Abstract
Biomethane is an example of a biofuel that is currently gaining interest due to its possible use as a substitute for natural gas and due to its generation in a “power to gas” production scheme. It can be injected into the gas network under certain purity requirements. It can also act as a source for the production of “green hydrogen”. This paper proposes a simple methodology to estimate the potential to obtain biomethane through the anaerobic digestion of biowaste in a delimited region. The mentioned methodology consists of the following main steps: (i) estimation of the potential biowaste from different sources in the region; (ii) characterization of each type of biowaste production; (iii) estimation of biogas production for each type of biowaste according to the selected anaerobic digestion process; and (iv) estimation of potential biomethane production through the purification of the biogas produced. The different types of biowaste that this methodology considers are the organic fraction of municipal solid waste, agroindustrial solid biowaste (biowaste from the food industry and livestock), and sewage sludge (urban and industrial). Energy crops are not considered because they are not treated as biowaste. After defining the proposed methodology, it is applied to a Spanish case study, in which the potential to obtain biomethane in Spain in 2019 is estimated. The results show that in Spain, around 4499 ktoe could be obtained if all biowaste was destined to produce biomethane, which would allow 31.6% of the final demand for natural gas to be satisfied in a sustainable way. In that sense, a double effect on climate change mitigation can be obtained, reducing use of fossil fuels and minimizing the final biowaste disposal into landfills.
1. Introduction
The current energetic model is based on a strong dependence on fossil fuels and covers 65% of the final energy demand [1] and 80% of the world’s primary energy demand [2]. Over time, the current model has become a non-sustainable energetic model. On the one hand, fossil fuels are limited resources. On the other hand, their use implies the emission of polluting and greenhouse gases (GHG), leading to numerous environmental impacts that will eventually affect human health and ecosystems.
A macroeconomic analysis carried out by the International Renewable Energy Agency (IRENA) concluded that by 2050, electricity will be present in 50% of final energy consumption, while renewable energy will be able to be produced in an economic way, enabling it to make up to 86% of the word’s energy demand [3].
In fact, the study also concluded that renewable energy solutions in the energy sectors are below the required levels and that emissions must be reduced even more. Furthermore, biofuels will play an important role in those cases in which electrification is difficult to achieve, such as in aviation, marine transport, or some special process industries [3].
In response to this situation, renewable energy technologies have dominated the global market of the new generation capacity market in recent years. Some of these technologies include those of biomethane, which are related to biogas production technologies.
Biogas is a gaseous biofuel that is obtained from the decomposition of organic material under anaerobic conditions. It mainly consists of methane and carbon dioxide, but its composition varies depending on its raw materials of origin and the process chosen to produce it. It comprises around 60% methane and 40% carbon dioxide. Biogas production allows the use of organic wastes (such as the organic fraction of municipal solid waste (MSW), agroindustrial solid biowaste (AISB), and sewage sludge), making it an interesting potential energy source [4].
If biogas is purified until the methane content is greater than 95%, it becomes biomethane, which presents properties and applications similar to natural gas and can consequently be injected into the gas grid [5]. On the other hand, power-to-gas technologies have reached the market and have achieved some relevance as biogas-upgrading methods. These technologies can make it possible to use the H2 from renewable energy to obtain biomethane from the CO2 contained in biogas. As an option, excess renewable electricity can be used for electrolysis, resulting in H2, which in turn can be used in a methanation process [6]. In addition to chemical methanation processes, biological methanation processes are also presented as a power-to-gas solution [7]. Rachbauer et al. [8] achieved CO2 conversion greater than 97% through biological methanation processes, which, depending on the biogas composition, can duplicate CH4 potential. Bellini et al. [9] evaluated biological aspects as well as applicability and scalability at an industrial level of biological methanation.
Consequently, since biomethane is presented as a sustainable and environmentally friendly energy source, interest in biomethane has increased in recent years. The significant increase in biomethane production units in Europe over the past decade (Figure 1) confirms the growing interest in this technology.
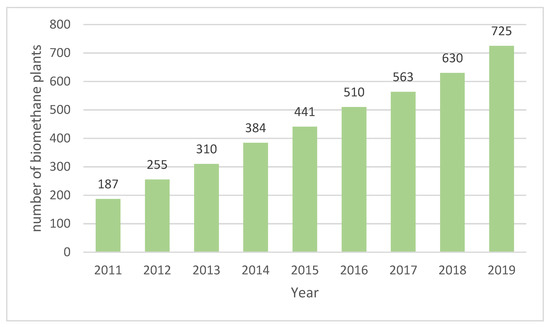
Figure 1.
Biomethane plants in Europe (EU28, Switzerland, and Norway) between 2011 and 2019. Source: Own elaboration using data published in [10].
Once it has been established that biomethane can be obtained from biowaste, there are some other aspects that should be emphasized. One of them is the answer to the question of how much biomethane can be obtained in a determined region or, similarly, what is the equivalence of natural gas that can be substituted by the production of biomethane.
This paper proposes a systematic, accessible, and simple methodology that allows one to estimate the potential to obtain biomethane through anaerobic digestion in a delimited region. Once that potential is deduced, these data may be used to determine the equivalent amount of natural gas that can be produced by taking advantage of the organic fraction of biowastes produced in that region.
2. Methodology
The proposed methodology consists of four main steps:
- Biowaste Production from Different Sources: The potential production of biowaste from different sources in the study region is estimated to determine how much material can be used to produce biomethane. Information on the different biowaste production activities that take place in the region under study is required. In this way, the sources of different types of biowaste are identified. As mentioned above, these types of biowaste are the organic fractions of MSW, AISB, and sewage sludge. Energy crops are not considered because they are not biowaste.
- Biowaste Characterization: The information about the volatile solid content in the considered biowaste types is estimated from the literature. These data are used to obtain how much matter can be degraded to obtain biogas.
- Biogas Production: Depending on the considered reaction conditions, the potential biogas production is estimated from the volatile solid data obtained in the previous stage.
- Potential Biomethane Production: Biogas losses are considered to obtain a final value of the biomethane that can be produced. Proposed biogas losses in this methodology are fugitive losses, the rate of degradation of volatile solids, and the biogas-purifying yield.
The required data can be experimentally obtained or from the scientific literature. Figure 2 shows a schematic of these stages followed by different directions depending on the available data. Next, the mentioned stages are described in detail. The frontier of the study is delimited by the limits of the region.
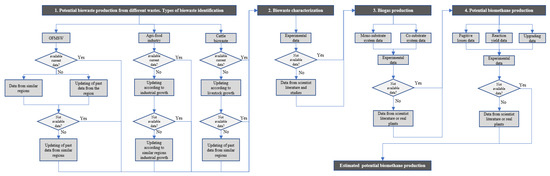
Figure 2.
Algorithm of the proposed methodology to estimate biomethane production in a region.
When estimating the potential biomethane production, it is necessary to consider three types of potentials:
- ▪
- Total Potential: This refers to the potential that can be obtained if all of the biowaste generated is used, regardless of whether the raw materials can or cannot be used to produce biomethane.
- ▪
- Accessible Potential: This refers to the potential biomethane that may be produced by considering the raw materials that can be collected, transported, and stored. For example, on a pig farm with a large surface area and a low number of heads of cattle, it is difficult to collect the slurry that they produce.
- ▪
- Available Potential: Biomethane that can be obtained by taking advantage of all manageable biowaste that is not destined for other, more rentable uses.
The available and accessible potentials will allow us to reach a better degree of accuracy than the total potential, but they require much more detailed data to be determined because, to obtain them, it is necessary to have more information about every exploitation or industrial plant in the study region. The available potential also requires additional data on the uses of the biowaste produced. The total potential is the most general and therefore the least accurate. Then, different types of biowaste produced are defined.
2.1. Biowaste Production from Different Sources
First, different sources of biowaste in the study region must be identified to obtain a list of the different types of biowaste that will be considered. Therefore, prior knowledge about the different activities (industrial, social, commercial, etc.) that take place in the region being studied is required. This is because these activities define the type and amount of biowaste that is produced. The existence of urban centres implies that MSW production, rural areas, agro-food industries, and livestock activities produce agroindustrial waste. Water treatment plants produce sewage sludge. Then, different types of biowaste produced are defined. This methodology groups biowaste into three main categories: the organic fraction of MSW, agroindustrial biowaste, and sewage sludge biowaste.
2.1.1. Organic Fraction of Municipal Solid Waste (OFMSW)
OFMSW is mainly made up of the remains of domestic kitchens and restaurants, discarded food products from commercial surfaces, and the remains of pruning and gardening.
Ideally, it would be enough to identify the main sources of this kind of biowaste. In fact, these biowastes are not always separated (different fractions in a selective MSW collection system). Depending on the behavior of the population and the municipal policies, it is possible that MSW is separated in different fractions (and collected in different containers), or perhaps not. Furthermore, a previous separation does not guarantee that there is not biowaste in other waste fraction containers. For these reasons, the production of MSW must be obtained according to each type of container in which it is deposited. Then, knowing the average composition of each fraction collected separately, the municipal production of biowaste can be estimated. Some types of MSW are municipal mix waste, paper, glass, organic, plastics, and metal [11,12]. If it is not possible to separate the wastes from each fraction that have been collected in the classification and material recovery plants separately, then the organic fraction contained there cannot be considered because it cannot be separated and taken advantage of.
If no data are available on the current production in MSW of the region under study, the proposed alternatives are as follows:
- ▪
- Collect available data on current production per capita from other regions where the population has similar lifestyles and gastronomic customs. Then, the data from that other region are used to estimate the total production, establishing a relationship between the number of inhabitants in the study region and the number of inhabitants in the similar region.
- ▪
- Use data from past periods of MSW production in the study region and estimate the production in the current period by accounting for the tendency of past data (i.e., demographic increase, waste production increase, consumption tendencies).
If none of these data are available, the last option is to use (if available) data from past periods of MSW production in a region with similar habits. If there are no current data on waste composition, the described strategies (focusing on regions with populations similar to those of the study region or deducing the trends of previous periods) can also be used to obtain data on the organic fraction.
2.1.2. AISB Production
Agroindustrial biowaste is waste produced from the food industry and livestock. Food industry waste can be, according to its origin, animal or vegetable. Within the animal category, the following should be considered:
- ▪
- Meat biowastes: Animal by-products not intended for human consumption. This category is mainly made up of biowaste from meat or poultry slaughterhouses, housing waste from the time before slaughter (24 h), or meat meals.
- ▪
- Dairy biowaste: Includes whey and non-conforming products.
- ▪
- Biowaste from fish: Organic remains of productive processes.
Vegetable biowaste includes products withdrawn according to quality policies, products that are not suitable for trade (because they are damaged or rotten), waste from transformation processes, and cereal straw. Livestock biowaste comprises waste from activities related to the daily lives of cattle, such as cattle manure.
If current data for the different industrial places that produce biowaste from animal and vegetable food industries are not available, then the proposed procedure to estimate the potential production associated with these types of biowaste consists of collecting data from previous years and updating them and relating them directly to the evolution of industrial activity. For example, an increase in dairy production is considered an increase in the generation of dairy biowaste. This method requires knowledge about industrial activities in the study region, which is more general data that are easier to find. It is possible to use data on the evolution of industrial activity from other regions with a similar agri-food industry if no data from the study region are available.
In relation to livestock biowaste, different factors take place that affect the ratio of this type of biowaste production, such as the type of livestock as well as the age of the cattle or the heads of cattle per surface unit. The estimation results will be more accurate if these different factors are taken into account in more detail. Based on the density of head cattle, two types of livestock exploitation should be differentiated: intensive and extensive exploitations. Extensive exploitations should not be considered if the potential being estimated is the accessible or the available one. These data require a high level of information on livestock activity in the region under study. The current biowaste production from each type of livestock activity can be estimated by relating it to other past data using the variation in the heads of cattle associated with that activity.
2.1.3. Sewage Sludge Production
Sewage sludge is waste produced at agri-food and urban wastewater treatment plants. Sewage sludge mainly consists of water and organic solids.
The ideal way to estimate sewage sludge production is to use data from each existing wastewater treatment plant in the region under study. However, obtaining these data is difficult due to the high number of plants, the lack of access to information sources, outdated data, or the mixture of data from industrial and urban wastewater treatment plants. In the case that there are no available current data, a proposed alternative is to obtain information from other similar regions by considering the evolution from past years.
2.2. Biowaste Characterization
It is necessary to determine the characteristics of biowaste and how its generation influences the generation of biogas during anaerobic digestion. The aim of this process is to obtain enough information on the fraction of the biowaste reacting and the biogas composition obtained. The main output of this stage of the methodology is the volatile solid (VS) content for each type of biowaste considered. The best way to obtain these data is to follow experimental methods. If this is not possible, some data on the composition of biowaste can be found in the scientific literature. Table 1 shows some of these data. To achieve this, information about the VS (%, by mass), TS (%, by mass), and VS/TS mass ratio is taken from the scientific literature, where at least two of these three parameters should be given. If TS and VS/TS ratios are given, then they must be related using the following formula to obtain VS:

Table 1.
Some examples of types of biowaste characterization. TS: total solids; VS: volatile solids.
To obtain these data, it would be optimal to experimentally analyze each type of biowaste. However, this is a laborious task that requires some resources that are difficult to obtain. Another option is to consult existing data on past studies treating similar types of biowaste. It is possible that some of the data on a determined type of biowaste are not available; in this case, it is important to focus on its relative importance with respect to the others. If the production potential of this biowaste is relatively short compared to the total, then it is possible to dispose of it.
2.3. Biogas Production
This stage of the methodology is carried out with the aim of having some data on the composition of biogas obtained from anaerobic digestion processes. As previously mentioned in the Section 1, the composition of biogas depends on the nature of the waste fed into the process and the techniques used to perform it. Table 2 shows the general typical values of biogas composition according to the substrate utilized.
Table 2.
Typical biogas composition of different substrates.
Regarding the reaction conditions, according to the content of TS, there is wet digestion (TS < 15% weight) and dry digestion (TS > 15% weight) [38]. Depending on the temperatures at which the anaerobic digestion process takes place, it can be carried out under mesophilic conditions (approximately 35 °C) or under thermophilic conditions (approximately 55 °C). Finally, depending on the number of substrates in the digester, there are mono-substrate and co-substrate systems. Table 3 shows different co-substrate yields according to sources from the scientific literature. Before choosing this kind of data, it is important to understand that co-substrate yields are not always higher than mono-substrate yields: the data indicated by scientific sources depend on many factors (experimental conditions, substrate composition, region, inoculum, and others).
Table 3.
Different co-substrate biomethane production yields according to the scientific literature. Sources: Own elaboration using data from [24,39,40].
If the material flow between produced biowaste and digested biowaste is balanced, it may be possible that a fraction of a concrete biowaste is digested under certain conditions and that the remaining fraction is digested under other different conditions. On the other hand, it is possible to consider a portion of biowaste is digested with a part of another biowaste, conforming to a co-substrate system. Considering that co-substrate systems require a great deal of knowledge about different co-digestion processes, it is the optimum way if there are available resources to obtain experimental data or real data from industrial plants. However, this may be too laborious if the data are obtained from the scientific literature. In this case, the simplest way is to take into account mono-substrate systems. Table 4 presents some examples of real plants that operate through co-substrate systems. Data from similar regions can be applied to the study region if there are no data available about it.
Table 4.
Some examples and results from different co-substrate biogas plants. Source: Own elaboration based on data from [41].
The available generation potentials from the scientific literature are usually based on the methane produced rather than the biogas produced. In this case, biomethane potentials can be directly used following the same procedure, but it would be interesting to consider the biogas composition because it allows for better results in the next stage of the methodology to quantify the final amount of biomethane produced (if purifying yields are considered).
2.4. Potential Biomethane Production
The last step of the described methodology consists of determining the amount of biomethane that may be extracted from the biogas produced, as previously estimated. Ideally, it would be the quantity of methane contained in the anaerobic reactor outlet stream. Therefore, in an ideal case, the best way to carry out this stage of the methodology is to consider the biogas’ methane content in the biogas produced using data from Section 2.3. If instead of biogas yields, biomethane yields are used, then the potential biomethane production can be directly determined.
In fact, considering an ideal case leads to unreal results because it does not take into account biogas losses during the production process. This methodology points to three main biogas losses that involve a reduction in the potential biomethane production, but it is possible (and should be done) to consider as many causes of biogas losses as appropriate. These causes are fugitive losses, the rate of degradation of volatile solids, and the biogas-purifying yield.
Fugitive losses are due to situations of excess pressure within the digester during the reaction process. According to [42], these losses represent 1% of the total biogas produced. On the other hand, [43] assumes that the methane losses from the digestion process are 2%.
With respect to the degradation rate of the VS, not all are converted inside the digester. That is why we consider the ratio between the VS that leaves the digester in the biogas stream and the VS that is fed. The degradation rate may vary depending on the operating conditions, pre-treatments, and different types of biowaste. A study based on a real case rated it as 62% [35]. Furthermore, some of the volatile solids contained in the digestate stream can be recovered and fed back to the reactor. The amount of volatile solids recovered depends on the digestate separation technique used. It is possible to consider that the digestate is fed back (totally or partially) directly once it leaves the digester or that it is treated before being fed back. In the first case, the feedback is taken from the raw digestate stream. In the second case, the recovered digestate fraction contains VS according to the separation method. According to [44], after solid–liquid separation, it is possible to obtain a liquid stream containing 35 to 45% VS from the digestate stream. Reference [35] proposes the feedback of 75% of the raw digestate stream.
Once biogas leaves the digester, it must be purified to the values of grid methane (natural gas). Two main streams leave this process: the biomethane stream and the impurities stream. Since some biomethane is contained in the impurities stream after the purification process (which means losses), it is important to quantify those losses. Biomethane losses depend on the purification technology. Data on biogas purifying yields are easy to find in the scientific literature. Table 5 shows typical yield data for some examples of biogas purification technologies. The most widely used purification technology is water scrubbing, which is simple, economical, and environmentally benign [45]. It is based on the physical absorption principle. It uses water to obtain CO2 and H2S and separate them from CH4. Organic scrubbing is similar to water scrubbing but uses an organic solvent instead of water. It is more expensive because it implies more solvent regeneration costs. Another technique is chemical absorption, which is widely used because it provides high biomethane purities, but it requires the use of toxic absorbents. Additionally, pressure swing adsorption (PSA) is a purification technology that requires low energy costs but requires a complex system of different columns that work in different stages. On the other hand, membrane separation is an increasingly used purification method. It allows purities of up to 96% to be obtained with a mono-stage system and to up to more than 99% with a multi-stage system [45,46]. Finally, cryogenic separation consists of distillation under cryogenic conditions [45,46]. It may be complex and expensive due to energy costs. Figure 3 shows the situation of the biogas purification market in 2016.
Table 5.
Typical biomethane purity and biomethane loss values from different reviews of biogas purification technologies.
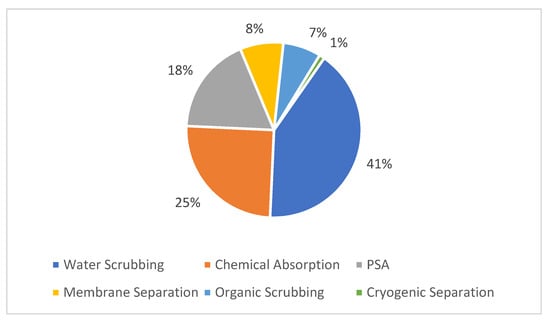
Figure 3.
Market shares of the different biogas purification approaches available on the market in 2016. Source: Own elaboration based on data from [45].
Using the proposed data, it is possible to estimate how much biomethane from anaerobic digestion can be injected into the natural gas grid (or used in other equivalent use). It is evident that not all of the biogas produced in the study region must be purified using the same technology. It is possible to consider that different biogas fractions are purified using different technologies. The purification technology being used depends on the biogas composition (which, at the same time, depends on the raw biowaste), its impurities, and the standard requirements of the grid injection in the study region.
To calculate the biomethane production potential, the following formula is proposed:
where:
- ▪
- B is the potential biomethane production per year in normal cubic meters per year ;
- ▪
- K is the yield of the production process, which depends on the yields previously treated;
- ▪
- Wi is the potential biowaste production, for a biowaste i, in volatile solid tons per year ;
- ▪
- Pi is the biomethane potential for a type of biowaste (i) in normal cubic meters per volatile solid ton ;
- ▪
- x is the number of considered types of biowaste.
3. Results: Application of the Methodology Proposed in a Case Study
The types of biowaste considered in this case study are those mentioned in Table 1. The described methodology is used to estimate the available potential biomethane production in Spain. In this case, activities in which raw biomethane materials have more profitable uses are not considered. Therefore, the accessible potential is estimated. The raw materials considered in this region are OFMSW, AISW, and sewage sludge biowaste. Data come from the scientific literature and official organisms. Experiments are not carried out as part of this paper.
3.1. Potential Biowaste Production in Spain
Since it is difficult to obtain direct data regarding MSW composition in Spain (according to the container in which it is disposed), data from Madrid containers are used, as they can be extended to the whole study region. In Madrid, it is possible to find (according to the behavior of the population) enough solid biowaste in mixed waste, organic, and packaging containers. These data on the composition of MSW for each kind of waste container allow us to obtain the amount of biowaste collected from each of them [49]. Pruning remains are considered biodegradable solid waste and are also present in the mentioned containers (Table A1, Appendix A).
The MSW flows collected from each type of container are deduced from annual data from the Spanish government [50]. Taking biowaste fractions from Table A1, it is possible to estimate the current annual OFMSW potential, which, in this case, is supposed to be about 4.9 million tons per year.
Current potential biowaste production from the agri-food industry is estimated by taking data from the Probiogas Project [51], carried out in Spain between 2007 and 2012, in which the potential biowaste production was estimated at that time. Since the Probiogas data were obtained about ten years ago, in the described case study, they are updated by considering the evolution of the Spanish industrial production index (IPI): each type of biowaste is related to the evolution of the industrial production in which it is generated. Agri-food animal biowaste in 2007 (Table A2, in Appendix B) and agri-food vegetable biowaste in 2007 (Table A3, in Appendix B) are multiplied by the increase in the corresponding IPI (Table A4, Appendix B), which is expressed using a factor calculated from the records of the Spanish government ([52,53,54]).
Not all of the biowaste production from the agri-food industry mentioned previously is estimated using IPI evolution. There are some types of agri-food biowaste in which other data are used because in these biowaste types, more real results can be reached. The waste from meat and poultry slaughterhouses is calculated by considering the total carcass weight produced in Spain in 2019 [55] and the coefficients of weight generated from the waste per carcass weight [32] (Table A5). Stable wastes are calculated from the Spanish carcass weight production in 2019 [55] and the residue weight coefficients generated by carcass weight [32] (Table A6). The data on the production of cereal straw (Table A7) were taken from the Spanish government’s 2020 Statistical Yearbook [56] (which provides data from 2019), while the Spanish production of olive oil in 2019 is taken from the 2019 Statistical Yearbook. Finally, the biowaste from the cider industry was not calculated because the amount of biowaste generated in 2007 was negligible compared to other types of biowaste. On the other hand, olive oil production in 2010 was 1,395,210 tons, while in 2019, it was 1,790,309 tons. This represents an increase of 28.3%. Therefore, the factor by which the residues from the olive oil industry multiplied is 1283 [54].
Livestock biowaste production is calculated using data from 2007, as previously determined in the Probiogas Project [57] and the estimated variation in cattle heads between 2007 and now according to 2018 data [58]. In this case, the production of associated types of biowaste is calculated based on VS, which should not be a problem if the biomethane generation potentials are based on VS. The production of chicken manure biowaste is estimated using data from the 1999 and 2009 Spanish agrarian censuses [59]. Since there are no agrarian census data after 2009, it is supposed that the tendency between these two dates was the same between 2009 and now. No variation in horse heads was considered due to its VS production being considered insignificant compared to the others (see Table A8, in Appendix B).
Estimating the potential biowaste from sewage sludge production in Spain is difficult because the last related data published by the Spanish government are from 2012. Furthermore, these data may vary from the data published by different regions in Spain. According to Eurostat data, in 2012, the production of this type of biowaste was 1,082 thousand of tons (dry basis). In fact, there are no more data from Spain since 2012 [60]. Using the trend of the last years of different European countries (Table A9, Appendix C) where the lifestyle of the population can be considered similar to that of the Spanish (in terms of sewage sludge generation). From the observed tendencies, it is assumed that the current production potential of sewage sludge in Spain is 1.1 million tons of dry matter.
3.2. Biowaste Characterization and Biogas Production
Both characterization and biogas production data are obtained from the scientific literature. No experiments are carried out to develop the study. For production data, biogas is supposed to be obtained under mesophilic conditions. Only mono-substrate systems are considered. Table 1 shows, for each type of biowaste that is considered in the study, both biowaste characterization and biomethane production potentials.
Characterization data are obtained from the scientific literature. No experiments are carried out to develop the study. The OFMSW characterization is taken from [13], where data from Barcelona are indicated and compared to data from other Italian cities. It consists of 28% TS and 24% vs. Table 1 shows the AISB characterization.
Sewage sludge contains 10% TS ([32,33]), with 70% VS (mass %).
3.3. Biomethane Production
The amount of biomethane that can be injected into the gas grid is calculated by considering a 62% VS degradation rate in the digester [35,61]. Fugitive losses suppose that 1% of the biogas is produced. If a screw press is used to separate liquid and solid digestate, about 65% of the non-digested VS is contained in the liquid fraction of the digestate [62]. In total, 75% of the liquid digestate is recirculated to the digester [35]. Since some digestate is recirculated, according to the given parameters, it can be assumed that 74.6% of the VS fed to the process is degraded during anaerobic digestion. The purification process is performed by membrane separation, with 1% biomethane losses in the total fed to this stage. For simplicity, it is considered that both stages (the digestion and purification processes) are carried out in a similar way for all types of biowaste. Power-to-gas biogas-upgrading technologies are not considered.
Table 6 indicates biomethane production from different types of biowaste treated in this case study. It has been determined using the formulas described in 3. The methodology is determined by applying data regarding VS content biomethane potentials and yield factors.
Table 6.
Biomethane “injectable” into the gas grid considering current biowaste production in Spain. Data estimated in this paper from biomethane potentials taken from the scientific literature. Cattle biowaste production data are directly based on % mass VS terms.
With a lower heating value of 9.95 kWh/Nm3 CH4, the available potential biomethane production in Spain is 4499 ktoe. In 2019, the demand for natural gas for final energy consumption (excluding non-energy uses) was 14,212 ktoe [63], so the available potential biomethane production in Spain can cover 31.6% of this demand.
4. Conclusions
An accessible potential biomethane production of 4499 ktoe has been estimated for Spain by applying the proposed methodology. It is able to cover 31.6% of the final demand for gas natural in this country. This result was reached by considering raw materials that can be collected, regardless of whether their final use is for this purpose. In this way, a large part of the natural gas destined for final energy consumption can be substituted. It represents a sustainable solution to obtain energy since biomethane is a renewable energy source that can be obtained at the same time that biowaste is being used.
This methodology offers consistent results, but the way in which it has been applied in the study presents some limitations: all of the data come from the scientific literature, and the anaerobic digestion process is supposed to be the same for all of the defined types of biowaste, and no biowaste mixes are considered. If more data were available, it would be possible to consider different digestion conditions for different portions of biowaste.
Nevertheless, it is a good approximation to estimate the energy resources available in a certain environment and may be used to determine if investment in biomethane from biowaste production infrastructure would be useful or not in the study region. In this case, the proposed methodology was successfully applied to the case study, which allowed its validity to be corroborated. Its application makes it possible to obtain the results for Spain and to estimate the total potential for obtaining biomethane from the organic waste produced in Spain.
Finally, it is important to note that the way in which the methodology is applied in the described study case only considers biogas purification methods that are able to achieve the required methane content. As a future line of research, it would be interesting to consider power-to-gas biogas-upgrading technologies, which could make it possible to take advantage of the CO2 contained in the biogas stream instead of removing it in a purification stage. Depending on the CO2 content in the biogas stream and the availability of renewable electricity, it could be possible to improve the potential biomethane production if the necessary infrastructure is available.
Author Contributions
E.S.N.: conceptualization, methodology, investigation, data curation, writing—original draft preparation, and visualization. J.P.R.: conceptualization, methodology, software, validation, resources, writing—original draft preparation, writing—review and editing, and supervision. All authors have read and agreed to the published version of the manuscript.
Funding
This research did not receive specific grants from funding agencies in the public, commercial, or non-profit sectors.
Institutional Review Board Statement
Not applicable.
Informed Consent Statement
Not applicable.
Data Availability Statement
Not applicable.
Acknowledgments
The research presented in this article is based on the final Master’s thesis of Eduardo Sánchez, which was made possible by support from the Department of Chemical Engineering and Environment of the Universidad Politécnica de Madrid.
Conflicts of Interest
The authors declare no conflict of interest.
Appendix A. Case Study: Data Used to Estimate the Biowaste Fraction in Different Selective MSW Collections
Table A1.
Biowaste fraction in different solid waste containers from Madrid in 2019. Source: Own elaboration based on data from [49].
Table A1.
Biowaste fraction in different solid waste containers from Madrid in 2019. Source: Own elaboration based on data from [49].
| Mix Waste Container | Packaging Container | Organic Container | |
|---|---|---|---|
| Organic material (%) | 14.7 | 2.6 | 63.7 |
| Pruning remains (%) | 7.5 | 0.3 | 8.7 |
| Biowaste fraction (%) | 22.2 | 2.9 | 72.4 |
Appendix B. Case Study: Data Used to Estimate Agri-Food Biowaste
Table A2.
Agri-food animal biowaste generated in 2007. Source: Own elaboration based on data from [32].
Table A2.
Agri-food animal biowaste generated in 2007. Source: Own elaboration based on data from [32].
| Type of Waste | Production (t/year) |
|---|---|
| Slaughterhouse raw biowaste | 931,318 |
| Poultry slaughterhouse | 690,607 |
| Stable manure | 354,150 |
| Bone flour | 9000 |
| Whey and dairy products | 2,823,590 |
| Fish waste | 382,819 |
| Total | 5,191,484 |
Table A3.
Vegetable agri-food industry biowaste generated in 2007. Source: Own elaboration based on data from [20].
Table A3.
Vegetable agri-food industry biowaste generated in 2007. Source: Own elaboration based on data from [20].
| Type of Waste | Production (t/year) |
|---|---|
| Non-citrus fruits | 349,245 |
| Citrus fruits | 862,105 |
| Vegetables | 1,380,061 |
| Tubers | 35,881 |
| Brewing industry | 697,240 |
| Wine industry | 872,390 |
| Cider industry | 15,264 |
| Sugar industry | 619,891 |
| Olive pomace and olive mil wastewater | 4,316,664 |
| Total | 9,148,741 |
Table A4.
The increase in some types of biowaste from agri-food animal and vegetable biowaste production from 2007 to 2019 related to the increase in IPI. Increase in IPI calculated from. Source: Own elaboration based on data from [52,53,54].
Table A4.
The increase in some types of biowaste from agri-food animal and vegetable biowaste production from 2007 to 2019 related to the increase in IPI. Increase in IPI calculated from. Source: Own elaboration based on data from [52,53,54].
| Production Increase IPI2019/IPI2005 | Related Biowaste Production | Biowaste Production in 2019 (t/year) | |
|---|---|---|---|
| Processing and preserving of meat and production of meat products | 1.14 | Bone flour | 10,260 |
| Processing and conservation of fish, crustaceans, and molluscs | 0.97 | Fish waste | 371,334 |
| Processing and preservation of fruits and vegetables | 1.18 | Non-citrus fruits, citrus fruits, vegetables, tubers | 3,100,204 |
| Elaboration of dairy products | 0.97 | Whey and dairy products | 2,738,882 |
| Winemaking | 1.10 | Wine industry | 959,629 |
| Brewing | 1.28 | Brewing industry | 892,467 |
| Other food products | 1.32 | Sugar industry | 818.256 |
Table A5.
Slaughterhouse biowaste generated in 2019 in Spain. Source: Own elaboration based on data from [32,55]. Carcass weight production obtained from [55]. Coefficients obtained from the Probiogas Project [32].
Table A5.
Slaughterhouse biowaste generated in 2019 in Spain. Source: Own elaboration based on data from [32,55]. Carcass weight production obtained from [55]. Coefficients obtained from the Probiogas Project [32].
| Coefficient (t/t Carcass Weight) | Carcass Weight 2019 | tbiowaste/year | |
|---|---|---|---|
| Bovine | 0.539 | 695,164 | 374,693 |
| Sheep | 0.511 | 121,338 | 62,004 |
| Goat | 0.522 | 10,420 | 5439 |
| Pig | 0.135 | 4,641,162 | 626,557 |
| Equine | 0.636 | 9632 | 6126 |
| Poultry | 0.520 | 1,705,190 | 886,699 |
| Rabbits | 0.500 | 52,143 | 26,072 |
| Total | 1,987,590 |
Table A6.
Stable biowaste generated in 2019 in Spain. Source: Own elaboration based on data from [32,55]. Carcass weight production obtained from [55]. Coefficients obtained from the Probiogas Project [32].
Table A6.
Stable biowaste generated in 2019 in Spain. Source: Own elaboration based on data from [32,55]. Carcass weight production obtained from [55]. Coefficients obtained from the Probiogas Project [32].
| Coefficient (t/t Carcass Weight) | Carcass Weight 2019 | tbiowaste/year | |
|---|---|---|---|
| Bovine | 0.080 | 695,164 | 55,613 |
| Sheep | 0.133 | 121,338 | 16,138 |
| Goat | 0.133 | 10,420 | 1386 |
| Pig | 0.065 | 4,641,162 | 301,676 |
| Equine | 0.037 | 9632 | 356 |
| Poultry | 0.037 | 1,705,190 | 63,092 |
| Rabbits | 0.142 | 52,143 | 7404 |
| Total | 445,665 |
Table A7.
Cereal straw production in Spain in 2019. Source: Own elaboration based on data from [56].
Table A7.
Cereal straw production in Spain in 2019. Source: Own elaboration based on data from [56].
| Type of Cereal Straw | Production (t/year) |
|---|---|
| Wheat | 3,130,942 |
| Barley | 3,938,160 |
| Oat | 443,427 |
| Rye | 131,749 |
| Triticale | 33,562 |
| Corn | 328,299 |
| Rice | 19,069 |
| Total | 8,025,208 |
Table A8.
Current livestock biowaste production estimated according to the variation in cattle heads from 2007. Chicken manure VS production data in 2007 obtained from the 1999 agricultural census.
Table A8.
Current livestock biowaste production estimated according to the variation in cattle heads from 2007. Chicken manure VS production data in 2007 obtained from the 1999 agricultural census.
| Biowaste | VS Production in 2007 (t/year) | Cattle Heads Increase (%) | Current VS Production (t/year) |
|---|---|---|---|
| Pig manure | 3,076,381 | 20.0 | 3,691,657 |
| Cow manure | 4,526,740 | 0.2 | 4,617,275 |
| Chicken manure | 1,134,312 | 20.58 | 1,367,795 |
| Sheep and goat manure | 1,897,843 | −27.7 | 1,372,140 |
| Horse manure | 87,230 | 0 | 87,230 |
| Total | 10,722,506 | 11,136,097 |
Appendix C. Case Study: Data Used to Estimate Sewage Sludge Production
Table A9.
Annual generation of sewage sludge in different European countries. Source: Source: Own elaboration based on data from [47].
Table A9.
Annual generation of sewage sludge in different European countries. Source: Source: Own elaboration based on data from [47].
| Thousands tdm | 2012 | 2013 | 2014 | 2015 | 2016 | 2017 |
|---|---|---|---|---|---|---|
| Czech Republic | 263.3 | 260.1 | 238.6 | 210.2 | 206.7 | 223.3 |
| Germany | 1849 | 1809 | 1803 | 1803 | 1794 | - |
| Ireland | 72.4 | 64.5 | 53.5 | 58.4 | 56.0 | 58.8 |
| France | 118.6 | 113.0 | 116.1 | 119.8 | 119.8 | - |
| Spain | 1082 | - | - | - | - | - |
| Greece | 1043 | 909 | 1059 | 1238 | 1006 | 1174 |
dm: dry matter.
References
- Repsol. Anuario Estadístico-Energético 2019. 2021. Available online: https://www.repsol.com/content/dam/repsol-corporate/es/energia-e-innovacion/documentos-energia-e-innovacion/anuario-estadistico-energetico-2019.pdf (accessed on 5 October 2022).
- Mohr, S.H.; Wang, J.; Ellem, G.; Ward, J.; Giurco, D. Projection of world fossil fuels by country. Fuel 2015, 141, 120–135. [Google Scholar] [CrossRef]
- Ministerio para la Transición Ecológica y el Reto Demográfico (MITECO). La Energía en España 2018. 2020. Available online: https://energia.gob.es/balances/Balances/LibrosEnergia/Libro-Energia-2018.pdf (accessed on 5 October 2022).
- Molino, A.; Nanna, F.; Ding, Y.; Bikson, B.; Braccio, G. Biomethane production by anaerobic digestion of organic waste. Fuel 2013, 103, 1003–1009. [Google Scholar] [CrossRef]
- Molino, A.; Nanna, F.; Iovane, P. Low pressure biomethane production by anaerobic digestion (AD). Fuel 2015, 154, 319–325. [Google Scholar] [CrossRef]
- Thema, M.; Bauer, F.; Sterner, M. Power-to-Gas: Electrolysis and methanation status review. Renew. Sustain. Energy Rev. 2019, 112, 775–787. [Google Scholar] [CrossRef]
- Bernacchi, S.; Weissgram, M.; Wukovits, W.; Herwig, C. Process efficiency simulation for key process parameters in biological methanogenesis. AIMS Bioeng. 2014, 1, 53–71. [Google Scholar] [CrossRef]
- Rachbauer, L.; Voitl, G.; Bochmann, G.; Fuchs, W. Biological biogas upgrading capacity of a hydrogenotrophic community in a trickle-bed reactor. Appl. Energy 2016, 483–490. [Google Scholar] [CrossRef]
- Bellini, R.; Bassani, I.; Vizzarro, A.; Azim, A.A.; Vasile, N.S.; Pirri, C.F.; Verga, F.; Menin, B. Biological Aspects, Advancements and Techno-Economical Evaluation of Biological Methanation for the Recycling and Valorization of CO2. Energies 2022, 15, 4064. [Google Scholar] [CrossRef]
- Sáinz Arnau, Á.; Pflüger, S.; Giacoazzi, M.; Decorte, M.; Genua, M. Annual Report 2020 European Biogas Association; European Biogas Association: Bruxelles, Belgium, 2021. [Google Scholar]
- Pérez, J.; Lumbreras, J.; de la Paz, D.; Rodríguez, E. Methodology to evaluate the environmental impact of urban solid. J. Clean. Prod. 2017, 150, 197–213. [Google Scholar] [CrossRef]
- Pérez, J.; de Andrés, J.M.; Lumbreras, J.; Rodríguez, E. Evaluating carbon footprint of municipal solid waste treatment: Methodological proposal and application to a case study. J. Clean. Prod. 2018, 205, 419–431. [Google Scholar] [CrossRef]
- Campuzano, R.; González-Martínez, S. Characteristics of the organic fraction of municipal solid waste and methane production: A review. Waste Manag. 2016, 54, 3–12. [Google Scholar] [CrossRef] [PubMed]
- Hejnfelt, A.; Irini, A. Anaerobic digestion of slaughterhouse by-products. Biomass Bioenergy 2009, 33, 1046–1054. [Google Scholar] [CrossRef]
- Rodríguez-Abalde, A.; Fernández, B.; Polatsi, J.; Flotats, X. Effects of thermal pre-treatments on solid slaughterhouse waste methane potential, 2001. Waste Manag. 2011, 31, 1488–1493. [Google Scholar] [CrossRef]
- Dinuccio, E.; Balsari, P.; Gioelli, F.; Menardo, S. Evaluation of the biogas productivity potential of some Italian agro-industrial biomasses. Bioresour. Technol. 2010, 101, 3780–3783. [Google Scholar] [CrossRef] [PubMed]
- Kafle, G.K.; Kim, S.H. Evaluation of the Biogas Productivity Potential of Fish. J. Biosyst. Eng. 2012, 37, 302–313. [Google Scholar] [CrossRef]
- Mancini, G.; Papirio, S.; Lens, P.N.; Esposito, G. Increased biogas production from wheat straw by chemical pretreatments. Renew. Energy 2018, 119, 608–614. [Google Scholar] [CrossRef]
- Przybyl, J.; Dach, J.; Wojcieszak, D.; Mazurkiewicz, J.; Zaborowicz, M. The possibility of maize straw application as a substrate for biogas plants. In IX International Scientific Symposium in Farm Machinery and Processes Management in Sustainable Agriculture, Lublin (Poland); Department of Machinery Exploitation and Management in Agricultural Engineering Faculty of Production Engineering University of Life Sciences: Lublin, Poland, 2017; ISBN 978-83-937433-2-2. [Google Scholar]
- Alfonso, D.; Brines, N.; Peñalvo, E.; Vargas, C.A.; Pérez-Navarro, A.; Gómez, P.; Pascual, A.; Ruiz, B. Cuantificación de Materias Primas de Origen Vegetal. Ministerio de Ciencia e Innovación. PSE Probiogás; 2010. Available online: http://213.229.136.11/bases/ainia_probiogas.nsf/0/D06E61BC808DB150C125753F00572938/$FILE/Inf_cuantificacion_vegetal_11-03-2010.pdf (accessed on 5 October 2022).
- Teghammar, A.; Karimi, K.; Horváth, I.S.; Taherzadeh, M.J. Enhanced biogas production from rice straw, triticale strawand softwood spruce by NMMO pretreatment. Biomass Energy 2012, 36, 116–120. [Google Scholar] [CrossRef]
- Murphy, J.; Braun, R.; Weiland, P.; Wellinger, A. Biogas from Crop Digestion; International Energy Agency Bioenergy (IEA-Bioenergy): Paris, France, 2011; Available online: https://www.ieabioenergy.com/wp-content/uploads/2011/10/Update_Energy_crop_2011.pdf (accessed on 5 October 2022).
- Edwiges, T.; Frare, L.; Mayer, B.; Lins, L.; Triolo, J.M.; Flotats, X. Influence of chemical composition on biochemical methane potential of fruit and vegetable waste. Waste Manag. 2018, 71, 618–625. [Google Scholar] [CrossRef] [PubMed]
- Kafle, G.K.; Kim, S.H.; Sung, K.I. Ensiling of fish industry waste for biogas production: A lab scale evaluation of biochemical methane potential (BMP) and kinetics. Bioresour. Technol. 2013, 127, 326–336. [Google Scholar] [CrossRef]
- Ziemiński, K.; Kowalska-Wentel, M. Effect of Different Sugar Beet Pulp Pretreatments on Biogas Production Efficiency. Appl. Biochem. Biotechnol. 2016, 181, 1211–1227. [Google Scholar] [CrossRef]
- Messineo, A.; Maniscalco, M.P.; Volpe, R. Biomethane recovery from olive mill residues through anaerobic digestion: A review of the state of the art technology. Sci. Total Environ. 2020, 703, 135508. [Google Scholar] [CrossRef] [PubMed]
- Pellera, F.M.; Gidarakos, E. Effect of substrate to inoculum ratio and inoculum type on the biochemical methane potential of solid agroindustrial waste. J. Environ. Chem. Eng. 2016, 4, 3217–3229. [Google Scholar] [CrossRef]
- Pellera, F.M.; Gidarakos, E. Microwave pretreatment of lignocellulosic agroindustrial waste for methane production. J. Environ. Chem. Eng. 2017, 5, 352–365. [Google Scholar] [CrossRef]
- Institut Català d’Energia. Producció de Biogàs per Codigestió Anaeròbia; Generalitat de Catalunya: Catalonia, Spain, 2008.
- Varnero Moreno, M.T. Manual de Biogás; Food and Agriculture Organization (FAO): Rome, Italy, 2011; Available online: https://www.fao.org/3/as400s/as400s.pdf (accessed on 5 October 2022).
- Wartell, B.A.; Krumins, V.; Alt, J.; Kang, K.; Schwab, J.B.; Fennell, D.E. Methane production from horse manure and stall waste with softwood bedding. Bioresour. Technol. 2012, 112, 42–50. [Google Scholar] [CrossRef] [PubMed]
- Alfonso, D.; Brines, N.; Peñalvo, E.; Vargas, C.A.; Pérez-Navarro, A.; Gómez, P.; Pascual, A.; Ruiz, B. Cuantificación de Materias Primas de Origen Animal. Ministerio de Ciencia e Innovación. PSE Probiogás. 2009. Available online: http://213.229.136.11/bases/ainia_probiogas.nsf/0/2A3FE73845F15A91C125753F00573FA7/$FILE/Inf_cuantificacion_animal_18-12-2009.pdf (accessed on 5 October 2022).
- Oropeza García, N. Lodos Residuales: Estabilización y Manejo. Caos Concienc. 2006, 1, 61–70. Available online: http://dci.uqroo.mx/RevistaCaos/2006_Vol_1/Num_1/NO_Vol_I_21-30_2006.pdf (accessed on 5 October 2022).
- Instituto para la Diversificación y Ahorro de Energía (IDAE). Biomasa. Digestores Anaerobios. 2007. Available online: https://www.idae.es/sites/default/files/documentos/publicaciones_idae/documentos_10737_biomasa_digestores_anaerobios_a2007_0d62926d.pdf (accessed on 5 October 2022).
- Ardolino, F.; Parrillo, F.; Arena, U. Biowaste-to-biomethane or biowaste-to-energy? An LCA study on anaerobic digestion of organic waste. J. Clean. Prod. 2018, 174, 462–476. [Google Scholar] [CrossRef]
- Kwaśny, J.; Balcerzak, W. Sorbents Used for Biogas Desulfurization in the Adsorption Process. Pol. J. Environ. Stud. 2015, 25, 37–43. [Google Scholar] [CrossRef] [PubMed]
- Yuan Chen, X.; Vinh-Thang, H.; Avalos Ramírez, A.; Denis, R.; Kaliaguine, S. Membrane gas separation technologies for biogas upgrading. RSC Adv. 2015, 5, 24399–24448. [Google Scholar] [CrossRef]
- Motte, J.C.; Trably, E.; Escudié, R.; Hamelin, J.; Steyer, J.P.; Bernet, N. Total solids content: A key parameter of metabolic pathways in dry anaerobic digestion. Biotechnol. Biofuels 2013, 6, 164. [Google Scholar] [CrossRef] [PubMed]
- Das, A.; Mondal, C. Biogas Production from Co-digestion of Substrates: A Review. Int. Res. J. Environ. Sci. 2016, 5, 49–57. [Google Scholar] [CrossRef]
- Siddique, M.N.I.; Wahid, Z.A. Achievements and perspectives of anaerobic co-digestion: A review. J. Clean. Prod. 2018, 194, 359–371. [Google Scholar] [CrossRef]
- Probiogas. Manual de Estado del Arte de la Co-digestión Anaerobia de Residuos Ganaderos y Agroindustriales. 2009. Available online: http://213.229.136.11/bases/ainia_probiogas.nsf/0/BB168DB006FAEAF1C12575380034D3DC/$FILE/Manual%20de%20Estado%20del%20Arte%20V2_(23-11-2009).pdf (accessed on 5 October 2022).
- European Monitoring and Evaluation Programme/European Environment Agency. EMEP/EEA Air Pollutant Emission Inventory Guidebook 2019. 5.B.2 Biological Treatment of Waste—Anaerobic Digestion Biogas 2019; European Monitoring and Evaluation Programme/European Environment Agency: Copenhagen, Denmark, 2019. [Google Scholar]
- Evangelisti, S.; Lettieri, P.; Borello, D.; Clift, R. Life cycle assessment of energy from waste via anaerobic digestion: A UK case study. Waste Manag. 2014, 34, 226–237. [Google Scholar] [CrossRef]
- Fuchs, W.; Drosg, B. Assessment of the state of the art of technologies for the processing of digestate residue from anaerobic digesters. Water Sci. Technol. 2013, 67, 1984–1993. [Google Scholar] [CrossRef] [PubMed]
- Kapoor, R.; Ghosh, P.; Kumar, M.; Kumar Vijay, V. Evaluation of biogas upgrading technologies and future perspectives: A review. Environ. Sci. Pollut. Res. 2019, 26, 11631–11661. [Google Scholar] [CrossRef] [PubMed]
- Izzuddin Adnan, A.; Yin Ong, M.; Saifuddin, N.; Chew, K.W.; Loke Show, P. Technologies for Biogas Upgrading to Biomethane: A review. Bioengineering 2019, 6, 92. [Google Scholar] [CrossRef] [PubMed]
- Angelidaki, I.; Treu, L.; Tsapekos, P.; Luo, G.; Campanaro, S.; Wenzel, H.; Kougias, P.G. Biogas upgrading and utilization: Current status and perspectives. Biotechnol. Adv. 2018, 36, 452–466. [Google Scholar] [CrossRef]
- Bauer, F.; Hulteberg, C.; Persson, T.; Tamm, D. Biogas Upgrading—Review of Commercial Technologies. 2013. Available online: http://www.sgc.se/ckfinder/userfiles/files/SGC270.pdf (accessed on 5 October 2022).
- Parque Tecnológico de Valdemingómez (PTV). Memoria de Actividades 2018. Área de Gobierno de Medio Ambiente y Movilidad del Ayuntamiento de Madrid. 2018. Available online: https://www.madrid.es/UnidadWeb/Contenidos/RC_Valdemingomez/Publicaciones/MemoriaActividadesValdemingomez2018.pdf (accessed on 5 October 2022).
- Ministerio para la Transición Ecológica y el Reto Demográfico (MITECO). Memoria Anual de Generación de Residuos. 2020. Available online: https://www.miteco.gob.es/es/calidad-y-evaluacion-ambiental/publicaciones/Memoria-anual-generacion-gestion-residuos.aspx (accessed on 5 October 2022).
- Probiogas. Available online: http://www.probiogas.es/ (accessed on 14 November 2021).
- Ministerio de Agricultura, Pesca y Medio Ambiente (MAPMA). Anuario de Estadística 2015; Ministerio de Agricultura, Pesca y Medio Ambiente (MAPMA): Madrid, Spain, 2016.
- Ministerio de Agricultura, Pesca y Medio Ambiente (MAPMA). Anuario de Estadística 2016; Ministerio de Agricultura, Pesca y Medio Ambiente (MAPMA): Madrid, Spain, 2017.
- Ministerio de Agricultura, Pesca y Medio Ambiente (MAPMA). Anuario de Estadística 2019; Ministerio de Agricultura, Pesca y Medio Ambiente (MAPMA): Madrid, Spain, 2020.
- Ministerio de Agricultura, Pesca y Alimentación (MAPMA). Encuesta de Sacrificio de Ganado 2018–2019. Por Categoría y Especie; 2019. Available online: https://www.mapa.gob.es/es/estadistica/temas/estadisticas-agrarias/ganaderia/encuestas-sacrificio-ganado/ (accessed on 30 January 2022).
- Ministerio de Agricultura, Pesca y Alimentación. Anuario de Estadística 2020; Ministerio de Agricultura, Pesca y Alimentación: Madrid, Spain, 2020.
- Alfonso, D.; Brines, N.; Peñalvo, E.; Vargas, C.A.; Pérez-Navarro, A.; Gómez, P.; Pascual, A.; Ruiz, B. Cuantificación de Materias Primas de Origen Ganadero. Ministerio de Ciencia e Innovación. PSE Probiogás. 2009. Available online: http://213.229.136.11/bases/ainia_probiogas.nsf/0/42EBC9523D85C2FCC12575380034A6A1/$FILE/Inf_cuantificacion_ganadero_07-10-2009.pdf (accessed on 14 December 2021).
- Ministerio de Agricultura, Pesca y Medio Ambiente (MAPMA). Anuario de Estadística 2018; Ministerio de Agricultura, Pesca y Medio Ambiente (MAPMA): Madrid, Spain, 2019.
- Instituto Nacional de Estadística (INE). Censo Agrario. 2021. Available online: https://www.ine.es/dyngs/INEbase/es/operacion.htm?c=Estadistica_C&cid=1254736176851&menu=resultados&secc=1254736194950&idp=1254735727106#!tabs-1254736194950 (accessed on 15 December 2021).
- Eurostat. Waste Generated by Households by Year and Waste Category. 2021. Available online: https://ec.europa.eu/eurostat/databrowser/view/ten00110/default/table?lang=en (accessed on 15 December 2021).
- Korres, N.E.; O’Kiely, P.; Benzhi, J.A.H.; West, J.S. Bionenergy Production by Anaerobic Digestion. In Using Agricultural Biomass and Organic Wastes; Routledge: London, UK, 2013; ISBN 9781138364103. [Google Scholar]
- Guilayn, F.; Jiménez, J.; Rouez, M.; Crest, M.; Patureau, D. Digestate mechanical separation: Efficiency profiles based on anaerobic digestion feedstock and equipment choice. Bioresour. Technol. 2019, 274, 180–189. [Google Scholar] [CrossRef]
- IDAE. Consumo de Energía Final. 2019. Available online: https://sieeweb.idae.es/consumofinal/bal.asp?txt=2019&tipbal=t (accessed on 30 December 2021).


Publisher’s Note: MDPI stays neutral with regard to jurisdictional claims in published maps and institutional affiliations. |
© 2022 by the authors. Licensee MDPI, Basel, Switzerland. This article is an open access article distributed under the terms and conditions of the Creative Commons Attribution (CC BY) license (https://creativecommons.org/licenses/by/4.0/).