Article

The Impact of Science and Technology Finance on Regional Collaborative Innovation: The Threshold Effect of Absorptive Capacity

School of Economics and Management, Hebei University of Technology, Tianjin 300401, China
*
Author to whom correspondence should be addressed.
Sustainability 2022, 14(23), 15980; https://doi.org/10.3390/su142315980
Submission received: 3 November 2022 / Revised: 26 November 2022 / Accepted: 27 November 2022 / Published: 30 November 2022

Abstract

:
The collaborative innovation of Beijing-Tianjin-Hebei region is faced with prominent problems such as the large gap in innovation resources and capability. In addition, science and technology (S&T) finance provides the approach to promote the flow of regional capital, technology and talents, which can facilitate the coordinated development of Beijing-Tianjin-Hebei region. Therefore, this study takes the Beijing-Tianjin-Hebei region as an example to explore the mechanism of different S&T finance on regional S&T collaborative innovation. Based on the provincial panel data of Beijing-Tianjin-Hebei region from 2009 to 2020, this paper constructs a dynamic panel threshold model with different regional absorptive capacities (technology level and economic base) as threshold variables to analyze the impact of public and market S&T finance on regional collaborative innovation. The main findings of this paper are as follows: first, the overall level of regional collaborative innovation in Beijing, Tianjin and Hebei is low, and public and market S&T finance significantly affects regional collaborative innovation in Beijing, Tianjin and Hebei. Specifically, public S&T finance plays an inhibitory role on regional collaborative innovation, and market S&T finance positively affects regional collaborative innovation. Secondly, both types of S&T finance have obvious heterogeneous threshold characteristics of absorptive capacity on regional collaborative innovation. Once the absorptive capacity of both regions breaks through the critical scale, the inhibiting effect of public S&T finance on regional collaborative innovation shows a weakening trend; with the improvement of technology level, the positive influence of market S&T finance on regional collaborative innovation keeps increasing. With the improvement of economic base, it shows a shift from negative to positive. The research findings provide theoretical and practical guidance for accelerating the pace of S&T innovation and the implementation mechanism of regional coordinated development.

1. Introduction

The function of regional collaborative innovation in the national innovation-driven development strategy is becoming increasingly significant. Cross-regional synergistic development, cultivating new advantages in S&T innovation, and discovering new drivers of industrial development are important challenges for regional collaborative innovation. Therefore, regional collaborative innovation has received great attention from policy makers of regional governments. Particularly, the Beijing-Tianjin-Hebei region is an essential region in North China and the third economic growth pole besides the “Yangtze River Delta region” and the “Guangdong-Hong Kong-Macao Greater Bay Area”. The Beijing-Tianjin-Hebei region plays an important role in the region coordinated development, especially in reorganizing the function of Beijing as the capital. However, compared with other region coordinated development, Hebei may not be able to undertake and transform the innovation resources of Beijing and Tianjin well, so the strength gap between Beijing, Tianjin and Hebei is large, including the link of R&D input, innovation absorption, and innovation output transformation. Therefore, how to effectively help the Beijing-Tianjin-Hebei region achieve the rapid development of collaborative innovation has become an urgent and realistic problem. At present, S&T finance is a new driving force to promote the development of S&T innovation and emerging industries. Facilitating the integration of S&T finance can help strengthen the network of regional innovation systems, which in turn can promote the development of regional innovation systems [1]. Its logic lies in that S&T finance promotes balanced regional development by driving regional technological exchanges and collaborative innovation [2]. Specifically, financial capital is the link and bridge connecting regional economic development. Furthermore, financial capital is the link and bridge to regional economic development. S&T finance can not only increase the speed of capital flow and promote the flow of technology, talent and other elements, but also break through the barriers to interregional S&T innovation [3]. In addition, the accelerated flow of technological innovation factors can increase regional capital investment and other innovative scarce resource inputs [4]. Therefore, S&T finance promotes regional balanced development by facilitating regional technology exchange and collaborative innovation [2].
Regarding the study of S&T finance, some scholars focus on labor division and the interaction between government and market. Zhao et al. [5] pointed out in the 2014 Annual Conference on S&T Finance that S&T finance has both public and commercial financial attributes. Thus, S&T finance can be divided into public S&T finance and market S&T finance based on the properties of the disciplines [6]. Both types of S&T finance are symmetrical, parallel and complementary in the S&T finance system [7]. On the one hand, public S&T finance has guiding, leveraging and replacing effects on market S&T finance, and provides a suitable macro environment for the function of resource allocation [8]. However, when public S&T finance plays its role, inefficiency or resource waste caused by function dislocation, offside and excessive intervention should be avoided. On the other hand, market technology finance mainly considers how to improve the efficiency of resource allocation from the micro level, and it follows the market logic that benefits match risks. In order to pursue the excess profits of scientific and technological innovation, it exists to promote the innovation and progress of applied technology by taking innovation risks. Therefore, there are significant functional differences between market S&T finance and public S&T finance, and their functional effects are not positive linear promotion. Therefore, it is necessary to explore the impacts of market S&T finance and public S&T finance on regional collaborative innovation, respectively.
According to the above theoretical analysis, S&T finance accelerates the flow of innovation factors in different regions. Absorptive capacity is a key factor for regions to make full use of external knowledge, information and other resources [9]. Absorptive capacity is centered on the ability to identify the value of new external knowledge, digest and apply it, thereby enhancing regional productivity and gaining competitive advantage [10,11]. When a region’s absorptive capacity is weak, it has difficulty in absorbing and understanding external knowledge and resource information, resulting in most external resources being ignored and potentially limiting the contribution of innovation resources to regional innovation development [12]. Hence, absorptive capacity plays an important role in the spillover effect of S&T finance on regional synergy in innovation.
However, does the effect of S&T finance on regional S&T collaborative innovation vary according to the intensity of regional absorptive capacity? This is a question worth thinking about. Therefore, we introduce the intensity of regional absorptive capacity as a threshold variable into the nonlinear model of S&T finance and regional collaborative innovation to verify their nonlinear threshold characteristics. The research findings of threshold model reveal that different types of S&T finance have obvious differences in the role of regional S&T innovation. The research findings provide guidance for the allocation of S&T financial resources and improving the efficiency of scientific and technological innovation. Additionally, there are important theoretical and practical significance for further promoting the high quality development driven by innovation.
The rest of this paper is organized as follows: Section 2 briefly reviews existing studies that are relevant to our research, which summarizes the S&T finance and regional collaborative innovation. Section 3 constructs the research model, including the construction of regional collaborative innovation system and the corresponding index system, as well as the dynamic threshold model. Section 4 describes the source of data and variables. Section 5 is the analysis and discussion of empirical results. Section 6 conclusion and policy implication.

2. Literature Review

2.1. Science and Technology Finance

King and Levine point out that the financial system as the main factor in the endogenous growth model, and proved that the good financial system can improve the success rate of innovation and accelerate economic growth. In addition, they also illustrate that investing financial resources in technology [13], improvement and commercialization of business can promote technological reform and upgrading. However, the scientific and technological finance mainly serves S&T innovation activities through the financing function, especially to support the S&T industry. For example, in order to promote the development of S&T innovation, it provides loans, investment, insurance and other financial products and services for regional and S&T-based enterprises innovative development [14].
The concept of “S&T finance” was first introduced in China in 1993 by the Shenzhen S&T Bureau. Zhao [15] pointed out that STF provides systematic and innovative arrangements for S&T innovation through a series of financial instruments including financial instruments, financial systems, financial policies and financial services, and provides financing services for the implementation of S&T innovation activities by integrating the market, government, enterprises, social intermediaries, etc. Wang and Xu [16] consider S&T finance as an innovative system of investment and financing composed of government, financial institutions together with S&T enterprises. Guarnieri et al. [2] found that government financial input, as the main way of public S&T finance, can promote enterprise innovation. Pan et al. [17] analyzed the difference of influence of technology and finance investment on different regions in China. The research findings showed that the support efficiency of technological and financial input to regional innovation was different, and the eastern region was significantly higher than the Northeast and central and western regions. In addition, Zheng et al. [18] further showed that there was the threshold effect in the impact of technology and finance on regional innovation and development. Only when regional economic development reaches a certain threshold could S&T finance play a role in promoting S&T innovation.
Based on existing research, S&T finance is a series of financial support and financial innovation behaviors that provide services for S&T innovation activities. In essence, it is also an innovation and a series of financial service ecology aimed at the field of S&T.

2.2. Regional Collaborative Innovation

Collaborative innovation originally originated from the synergetic class founded by Professor Harken. Synergism is the study of how a complex system consisting of a large number of subsystems interacting in a complex way in an open system far from equilibrium, with constant material exchange with the outside world, generates synergistic phenomena and synergistic effects through nonlinear interactions, resulting in an ordered organization or self-organized structure [19]. Freeman [20] argues that the main form of collaborative innovation is inter-firm cooperation. In 1987, Freeman put forward the regional innovation system, which can be regarded as the root of relevant research on regional innovation subjects. He believes that it is the difference between regional innovation resources and environment that promotes the development of regional innovation activities [20,21].
Regional collaborative innovation refers to the comprehensive innovation in the regional context in which the innovation subjects radiate to the whole regional context through the combination and collaboration of innovation resources among themselves. Li and Zhao [22] point out that the government is the rule maker, subject coordinator, service provider and internal booster of regional innovation and plays the important role for the regional innovation, at the same time the state that regional geographical location would also affect the role of local governments and made regional innovation efficiency different.
The regional S&T collaborative innovation has spillover effect [23]. Regional geographical proximity promotes inter-regional knowledge spillovers, drives regional scientific and technological collaborative innovation, and becomes an important channel for regional economic growth [24]. Arratt et al. [25] pointed out that due to the characteristics of capital liquidity and openness, the barriers of original regional spatial innovation activities were broken. Next, in this way, it is conducive to ensure that innovation subjects carry out technological collaborative innovation in a larger and wider space. Kavita et al. [26] showed that coordinated development of S&T can promote regional sustainable development to a certain extent.
In order to test the differences of regional collaborative innovation efficiency, scholars have conducted research by establishing mathematical models. Di [27] broke through the limitation of regional space and constructed a comprehensive spatio-temporal impulse response function. The model was used to test the influencing factors and differences of regional innovation spillovers. Márquez et al. [28] studied regional innovation and economic growth in Spain and established a spatial VAR model, which estimated the input and output effects of spillovers from regional economic growth, respectively. In addition, the research findings showed the adjustment process of regional growth in the long run and short run from both spatial and temporal aspects.
The research on the support of S&T finance at the city level for S&T innovation has been relatively mature, but the existing research rarely considers the impact of regional collaborative innovation on the efficiency of S&T innovation.

2.3. Science and Technology Finance and Regional Science and Technology Collaborative Innovation

Regions with advantages in S&T finance can promote the coordinated development of surrounding region [29]. The S&T finance policy as a pilot has the significant effect on regional economic growth, mainly through improving the level of regional S&T innovation and promoting the regional economic growth [30]. Existing research from the perspective of government public S&T finance showed that public S&T finance subsidy is the vital supplement to private R&D investment and helps to stimulate innovation investment activities [31,32] From the perspective of technology financial from market supply, Ang and Guariglia and Liu conducted empirical analysis on different supply subjects in the financial system, such as commercial banks, capital markets and venture capital investment, and the research showed that technology finance can support regional collaborative innovation of science and technology [2,33]. In conclusion, there exists a relationship between S&T finance and regional S&T collaborative innovation should exist.
However, existing studies have explored whether there is a boundary in promoting the development of S&T finance, and revealed the nonlinear effect between S&T finance development and regional collaborative innovation [18]. In view of the differences in the above research findings, the nonlinear relationship between different types of S&T finance and regional technology collaborative innovation is further expounded.

3. Empirical Model and Methodology

3.1. Measurement of Collaborative Innovation in Beijing-Tianjin-Hebei Region

3.1.1. Indicators of Collaborative Innovation Measurement

From the perspective of system theory, collaborative innovation in Beijing-Tianjin-Hebei region is a functional and complex system, which consists of three spatial subsystems, Beijing, Tianjin and Hebei. Regarding the regional collaborative innovation evaluation index system, scholars mainly choose industry, universities and research institutes as innovation subjects. Therefore, as shown in Table 1, we adopt the entropy value method to calculate the evaluation index weights of each system [34].

3.1.2. Calculation Method of Regional Collaborative Innovation

The Beijing-Tianjin-Hebei regional S&T collaborative innovation system is complex, dynamic and open [35,36]. Based on an integrated analysis of regional synergy innovation of S&T development measure, build composite based on “input-output-environment” system coordination degree measure model.
Suppose that the composite system of regional S&T collaborative innovation development is S = { S 1 , S 2 , S 3 } , where S 1 is the input subsystem, S 2 is the output subsystem and S 3 is the environment subsystem. The order parameters in the development process are e 1 i = { e 11 , e 12 , , e 1 n } , where, n 1 , β j i e j i α j i , i , j = 1 , 2 n , respectively, α j i , β j i are the upper and lower limits of the order parameter components e j i . Based on complex system coordination theory, by using the following formula, can be ordered degree of order parameter of each subsystem.
μ j ( e j i ) = { e j i β j i α j i β j i i [ 1 , k ] α j i e j i α j i β j i i [ k + 1 , n ]
In Formula (1), μ ( e j i ) [ 0 , 1 ] represents the system order degree of order parameter e j . When the value of μ ( e j i ) is high, it indicates that subsystem S j including order parameter e j contributes more to the order degree of regional collaborative innovation system. w i is the weight of subsystem order degree parameter. In this paper, the linear weighted sum method is used to define the order degree of the subsystem, and the order degree expression of the subsystem is obtained, as shown in Equation (2):
μ j ( e j ) = i = 1 n w i μ j ( e j i ) , w i 0 , i = 1 n w i = 1
The order degree of subsystem order parameter is μ j 0 = ( e j ) , j = 1 , 2 , 3 at the initial moment t 0 , and μ j 1 = ( e j ) , j = 1 , 2 , 3 at the moment t 1 during the development and evolution of the composite system. The change of subsystem order degree from μ j 0 = ( e j ) to μ j 1 = ( e j ) reflects the degree of coordination from moment t 0 to moment t 1 . Obviously, when the degree of transition from disorder to order is greater, the subsystems are more consistent and the value of the degree of coordination is greater.
S E = φ × | Π j = 1 3 [ μ j 1 ( e j ) μ j 0 ( e j ) ] | 3
φ = { 1 μ j 1 ( e j ) μ j 0 ( e j ) 1 else
Among them, S E [ 0 , 1 ] reflects the order degree of “input-output-environment” regional S&T innovation complex system. The higher SE value, the higher the synergy degree of the composite system.

3.2. Econometric Models

Regional collaborative innovation of S&T aims to solve the innovation activities in the complex and diversified environment. By organically integrating innovation elements and increasing the flow of new innovation elements in the collaborative region, cross-regional collaborative innovation can bridge the gap between the existing innovation level and the required innovation level in a single region. As a new driving force, S&T finance further improves the integration and flow speed of innovation elements in the synergy mechanism, thus driving the technology flow and collaborative innovation in various regions. Due to the different absorptive capacity within the region, the spillover effect of S&T finance will be heterogeneous. Therefore, the spillover effect of S&T finance should be influenced by regional absorptive capacity factors [37]. In conclusion, with the matching difference of regional absorptive capacity elements, the influence of S&T finance on the development of regional collaborative innovation will change accordingly.
This study constructs a dynamic threshold panel model with absorptive capacity as the threshold variable to investigate the nonlinear relationship between S&T finance and regional collaborative innovation. This paper focuses on the mechanism of the role of S&T finance on regional innovation, and describes the mechanism differences between public S&T finance and market S&T finance in regional collaborative innovation. Compared with the traditional threshold model, the dynamic threshold model can not only effectively explore the possible nonlinear relationships, but also better deal with the potential endogeneity problems. In particular, the threshold model is embedded in a generalized approach of the momentum (GMM) model. Orthogonality is constructed in the instrumental variable matrix of the stochastic regression terms to ensure that the instrumental variables are independent of the stochastic perturbation terms. A grid search algorithm is used to determine the threshold values, thus satisfying the requirement of endogenous grouping of thresholds and effectively solving the problem of endogenous variables [38].
ln R S T S i t = θ + α ln R S T S i t 1 + β 1 ln P u b F i n i t I ( ψ i t j η ) + β 2 ln P u b F i n i t I ( ψ i t j > η ) + σ 1 ln M a r i t + σ 2 ln H c i t + σ 3 ln F i n i t + v t + μ i + ε i t
ln R S T S i t = θ + α ln R S T S i t 1 + β 1 ln M a r F i n i t I ( ψ i t j η ) + β 2 ln M a r F i n i t I ( ψ i t j > η ) + σ 1 ln M a r i t + σ 2 ln H c i t + σ 3 ln F i n i t + v t + μ i + ε i t
where, R S T S i t represents the degree of regional collaborative innovation. P u b F i n i t represents public S&T finance; M a r F i n i t stands for market S&T finance; M a r i t represents marketization degree; H c i t stands for human capital; F i n i t represents the level of financial development; ψ i t j ( j = e c o , t e c h ) represents the regional absorptive capacity factor. σ 1 ,   σ 2 ,   σ 3 represents the synergistic elasticity of marketization degree, human capital and financial development level, respectively, and t represents the year. Considering the dynamic nature and continuity of collaborative innovation, the lag term of dependent variable is added into the model. v t is the time-specific effect, ε i t is the random error term, and μ i is the individual effect. The relationship between public S&T finance, market S&T finance and regional collaborative innovation is shown in the double threshold model with regional absorptive capacity as the threshold:
ln R S T S i t = θ + α ln R S T S i t 1 + β 1 ln P u b F i n i t I ( ψ i t j η 1 ) + β 2 ln P u b F i n i t I ( η 1 < ψ i t j η 2 ) + β 3 ln P u b F i n i t I ( ψ i t j > η 2 ) + σ 1 ln M a r i t + σ 2 ln H c i t + σ 3 ln F i n i t + v t + μ i + ε i t
ln R S T S i t = θ + α ln R S T S i t 1 + β 1 ln M a r F i n i t I ( ψ i t j η 1 ) + β 2 ln M a r F i n i t I ( η 1 < ψ i t j η 2 ) + β 3 ln M a r F i n i t I ( ψ i t j > η 2 ) + σ 1 ln M a r i t + σ 2 ln H c i t + σ 3 ln F i n i t + v t + μ i + ε i t
η 1 , η 2 is the double threshold value, other symbols have the same meaning, multiple thresholds and so on. When estimating the dynamic threshold panel model, based on the minimum criterion function of the sum of squares of residuals S n ( η ) in two stages, the consistent estimate η ^ of threshold parameter η is obtained by lattice point search. The threshold parameter η is estimated as: η ^ = arg min S n ( η ) . After the parameter estimation is obtained, the model can be tested for inference, including two aspects: the significance test of threshold parameters and the existence of threshold effect [39]. Using the Wald statistic to determine the threshold effect is significant, the corresponding probability is smaller, the threshold effect more significant. The null hypothesis of the threshold effect is as follows: H 0 : R θ = 0 If the null hypothesis is rejected, the influence of S&T finance on the development of regional collaborative innovation will be asymmetric [40]. Wald statistic is:
W ( η ^ ) = { R θ ^ ( η ^ ) } { R V a r θ ^ ( η ^ ) R } 1 { R θ ^ ( η ^ ) }
However, R = [ I K + 1 , I K + 1 ] , since the distribution of Wald statistics is unknown, bootstrap sampling method is used to obtain the simulated distribution of statistics to determine the significance level of the threshold effect. Finally, the moment condition of GMM estimation is constructed based on the threshold parameter estimation η ^ , and the coefficient estimation of each variable is further obtained [41].

4. Data Description

4.1. Variable Declaration

4.1.1. Dependent Variable

The measurement of regional collaborative innovation is measured by the “input-output-environment” measure index constructed in the Section 3.1 (see Table 1).

4.1.2. Independent Variable

The independent variable is technology finance, which can be divided into public technology finance and market technology finance according to different investors [6]. Market S&T finance mainly involves two providers, capital market and risk institutions. Therefore, the proportion of listed technology-based companies, the proportion of enterprise funds and the proportion of science and technology loans of financial institutions are selected as the proxy variables of market sci- tech finance. As the proxy variable also involves the related level of scientific and technological innovation, in order to focus on the part of S&T finance, the relative number is generally used to emphasize the support strength.
The listed companies in Shanghai and Shenzhen stock exchanges to filter, sure to distinguish the annual number of S&T of the listed company around. In most previous literatures, single factor indicators such as financial expenditure on S&T [39] and comprehensive indicators from resources, capital and output [42] were used as proxy variables. In this study the ratio of financial expenditure on S&T to financial expenditure was adopted as the representative.

4.1.3. Threshold Variable

Based on the study of Qiu et al. [43], we use the difference of supply and demand degree to measure the area of absorptive capacity through the analysis of the matching of elements:
f [ ψ e c o , ψ t e c h ] = f [ ( g e c o , n e c o ) , ( g t e c h , n t e c h ) ]
where, g i represents the actual supply of factors such as economic development foundation and technological level in the process of technological and financial integration, while n i represents the actual demand for the above factors in the process of technological and financial integration. Only when the elements of regional supply meet the fusion of actual demand, talent and spillover effects have good synergistic effect. Combined with the characteristics of S&T finance itself, this paper will focus on the impact of factors such as economic development foundation and technological level. The basis of economic development is expressed by per capita GDP, and patent application stock represents technological level.

4.1.4. Control Variables

Due to the complexity of regional collaborative innovation, the degree of collaboration is affected by many factors except S&T finance. In order to avoid the influence of other factors on the correlation between regional collaborative innovation and S&T finance, some other explanatory variables are also introduced as control variables. Specifically, according to the previous literature, the degree of marketization is represented by the degree of government intervention in economic activities and quantified by the ratio of the number of scientific researchers and urban employees. The ratio of researchers to urban employees is used to reflect human capital. The ratio of outstanding loans of financial institutions to GDP is used to measure the level of financial development [44].

4.2. Sample Selection and Data Sources

The measures of each variable in the threshold model are shown in Table 2, and data from 2009 to 2020 in the Beijing-Tianjin-Hebei region were selected as sample data. The data used to measure regional collaborative innovation come from China Statistical Yearbook, China Statistical Yearbook of S&T, China Statistical Yearbook of High-tech Industries and National Bureau of Statistics. The data of S&T Finance come from China Statistical Yearbook, China Financial Yearbook, China Regional Financial Operation Report and China Provincial Marketization Index Report. Other control variables are from the China Statistical Yearbook.

5. Analysis and Discussion of Empirical Results

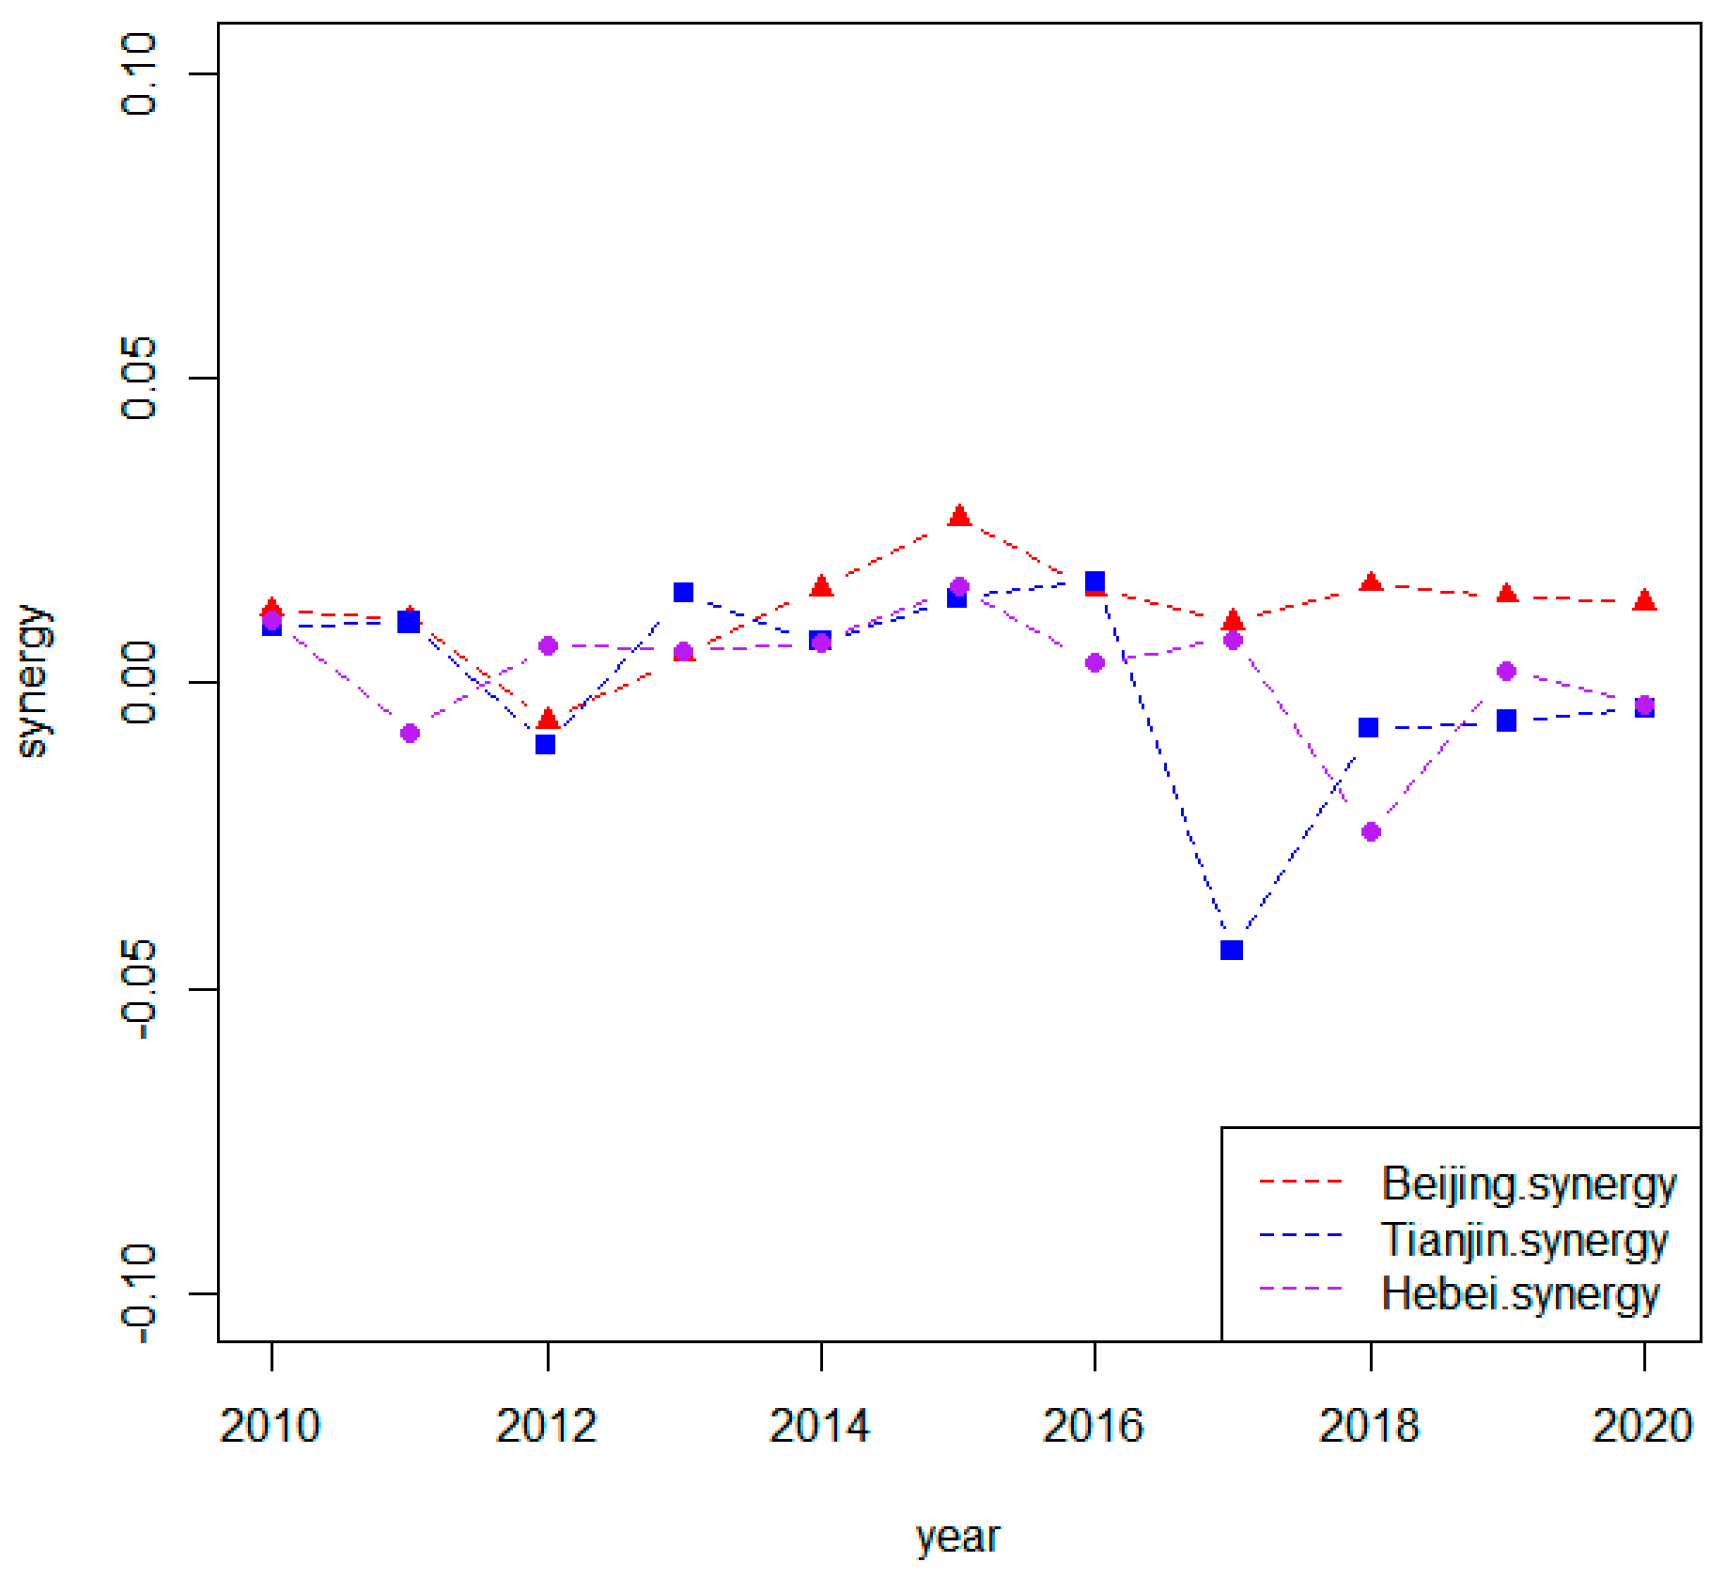
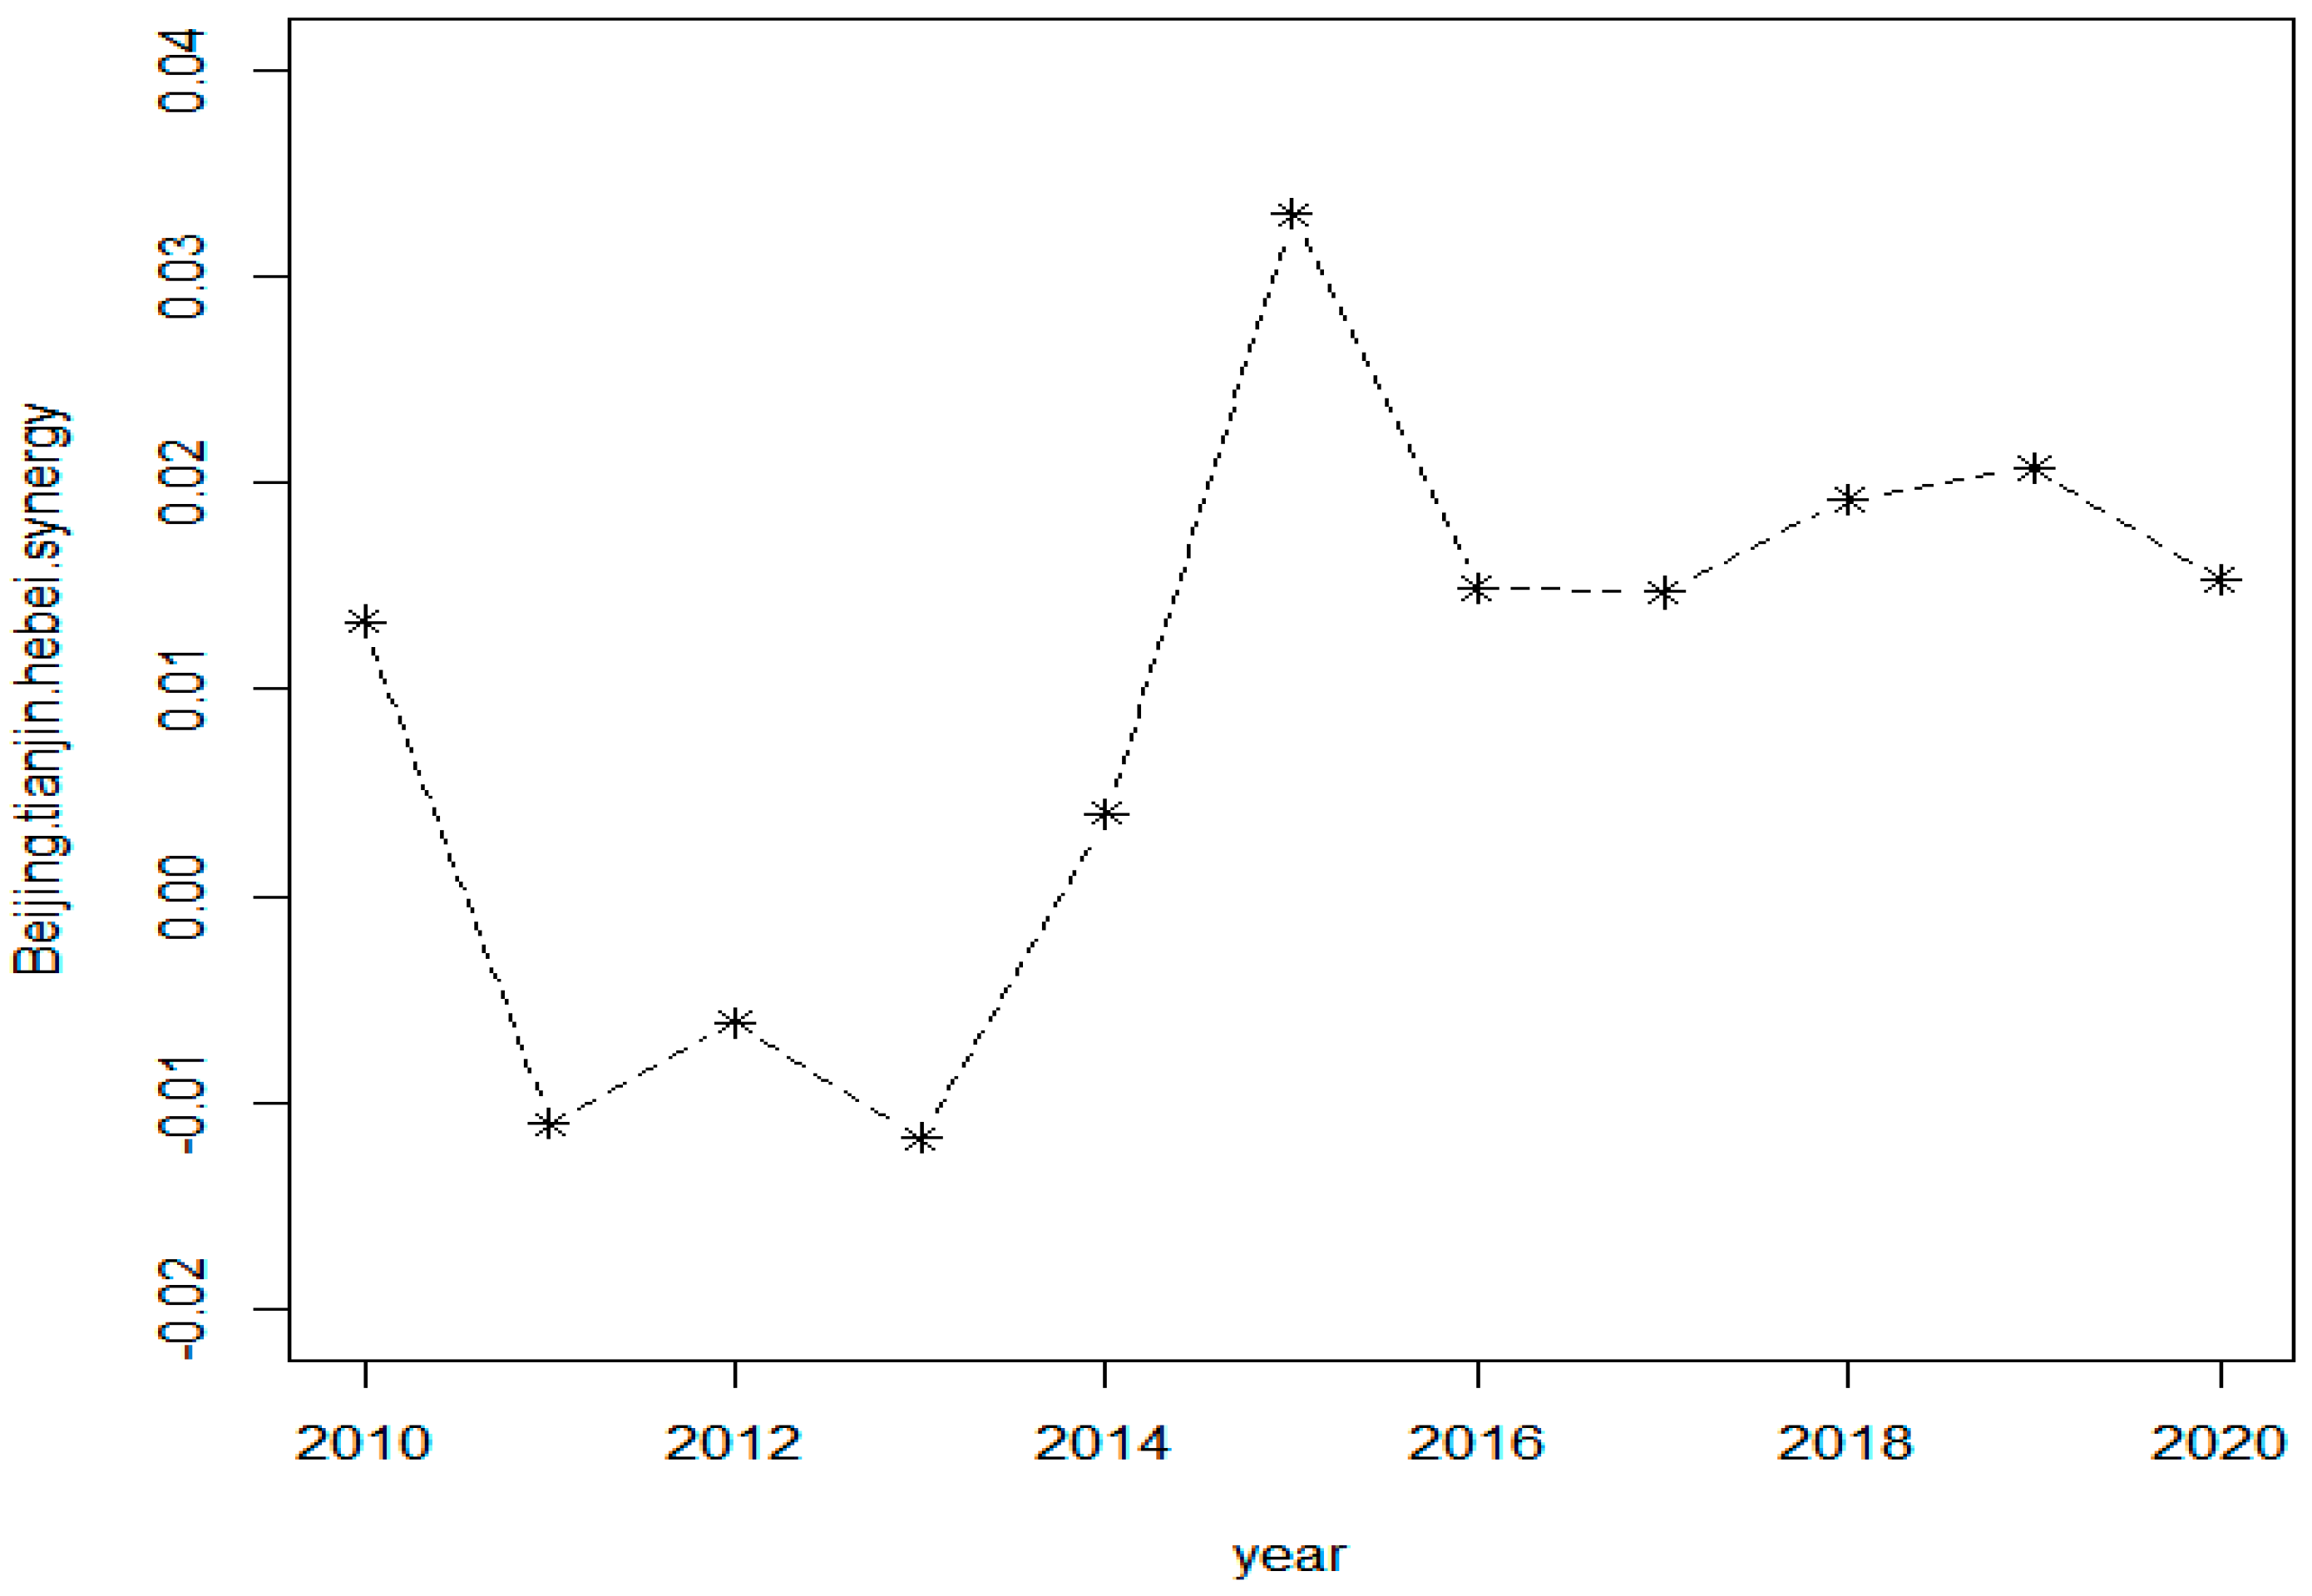
5.1. Collaborative Innovation of Beijing-Tianjin-Hebei Region

According to the measurement results in Table 3, we can see that the differences of regional collaborative innovation levels among Beijing, Tianjin and Hebei are not significant, with a floating range of [−0.05, 0.05], but there are significant differences in the overall fluctuation. As shown in Figure 1, in terms of Beijing’s coordination level, the overall coordination level showed an upward trend before 2015, and an obvious downward trend after 2015. Due to the implementation of the Beijing-Tianjin-Hebei coordinated strategy, Beijing’s scientific and technological innovation resources have been scattered. The re-integration of resources will have a certain impact on the level of coordination within Beijing. Collaborative level trend in Hebei province is relatively stable, annual overall points difference is small. After 2014, Tianjin showed a significant rise at first and then a rapid decline. The degree of synergy changes greatly and is easily affected by the environment.
In general, collaborative innovation in the Beijing-Tianjin-Hebei region is in a state of coordinated development (see Figure 2). With the passage of time, further deepen cooperation between the Beijing-Tianjin-Hebei region, the degree of fit between the elements has been strengthened, embodied in collaborative degree curve is on the rise. However, the degree of coordination in the Beijing-Tianjin-Hebei region is relatively low. This is because the technological and economic level gap between Beijing, Tianjin and Hebei region is too large in the process of coordination, which leads to the regional coordination degree of Beijing-Tianjin-Hebei region showing a sharp rise, then a short decline, and then a gentle trend. It can also be found that since 2015, the follow-up driving force of collaborative innovation of in the Beijing-Tianjin-Hebei region is obviously insufficient and lacks sustainability. This result is consistent with the actual development of the Beijing-Tianjin-Hebei region. Therefore, in order to solve this practical dilemma, it is considered to take S&T finance as a new driving force to support the efficient development of collaborative innovation in the Beijing-Tianjin-Hebei region.

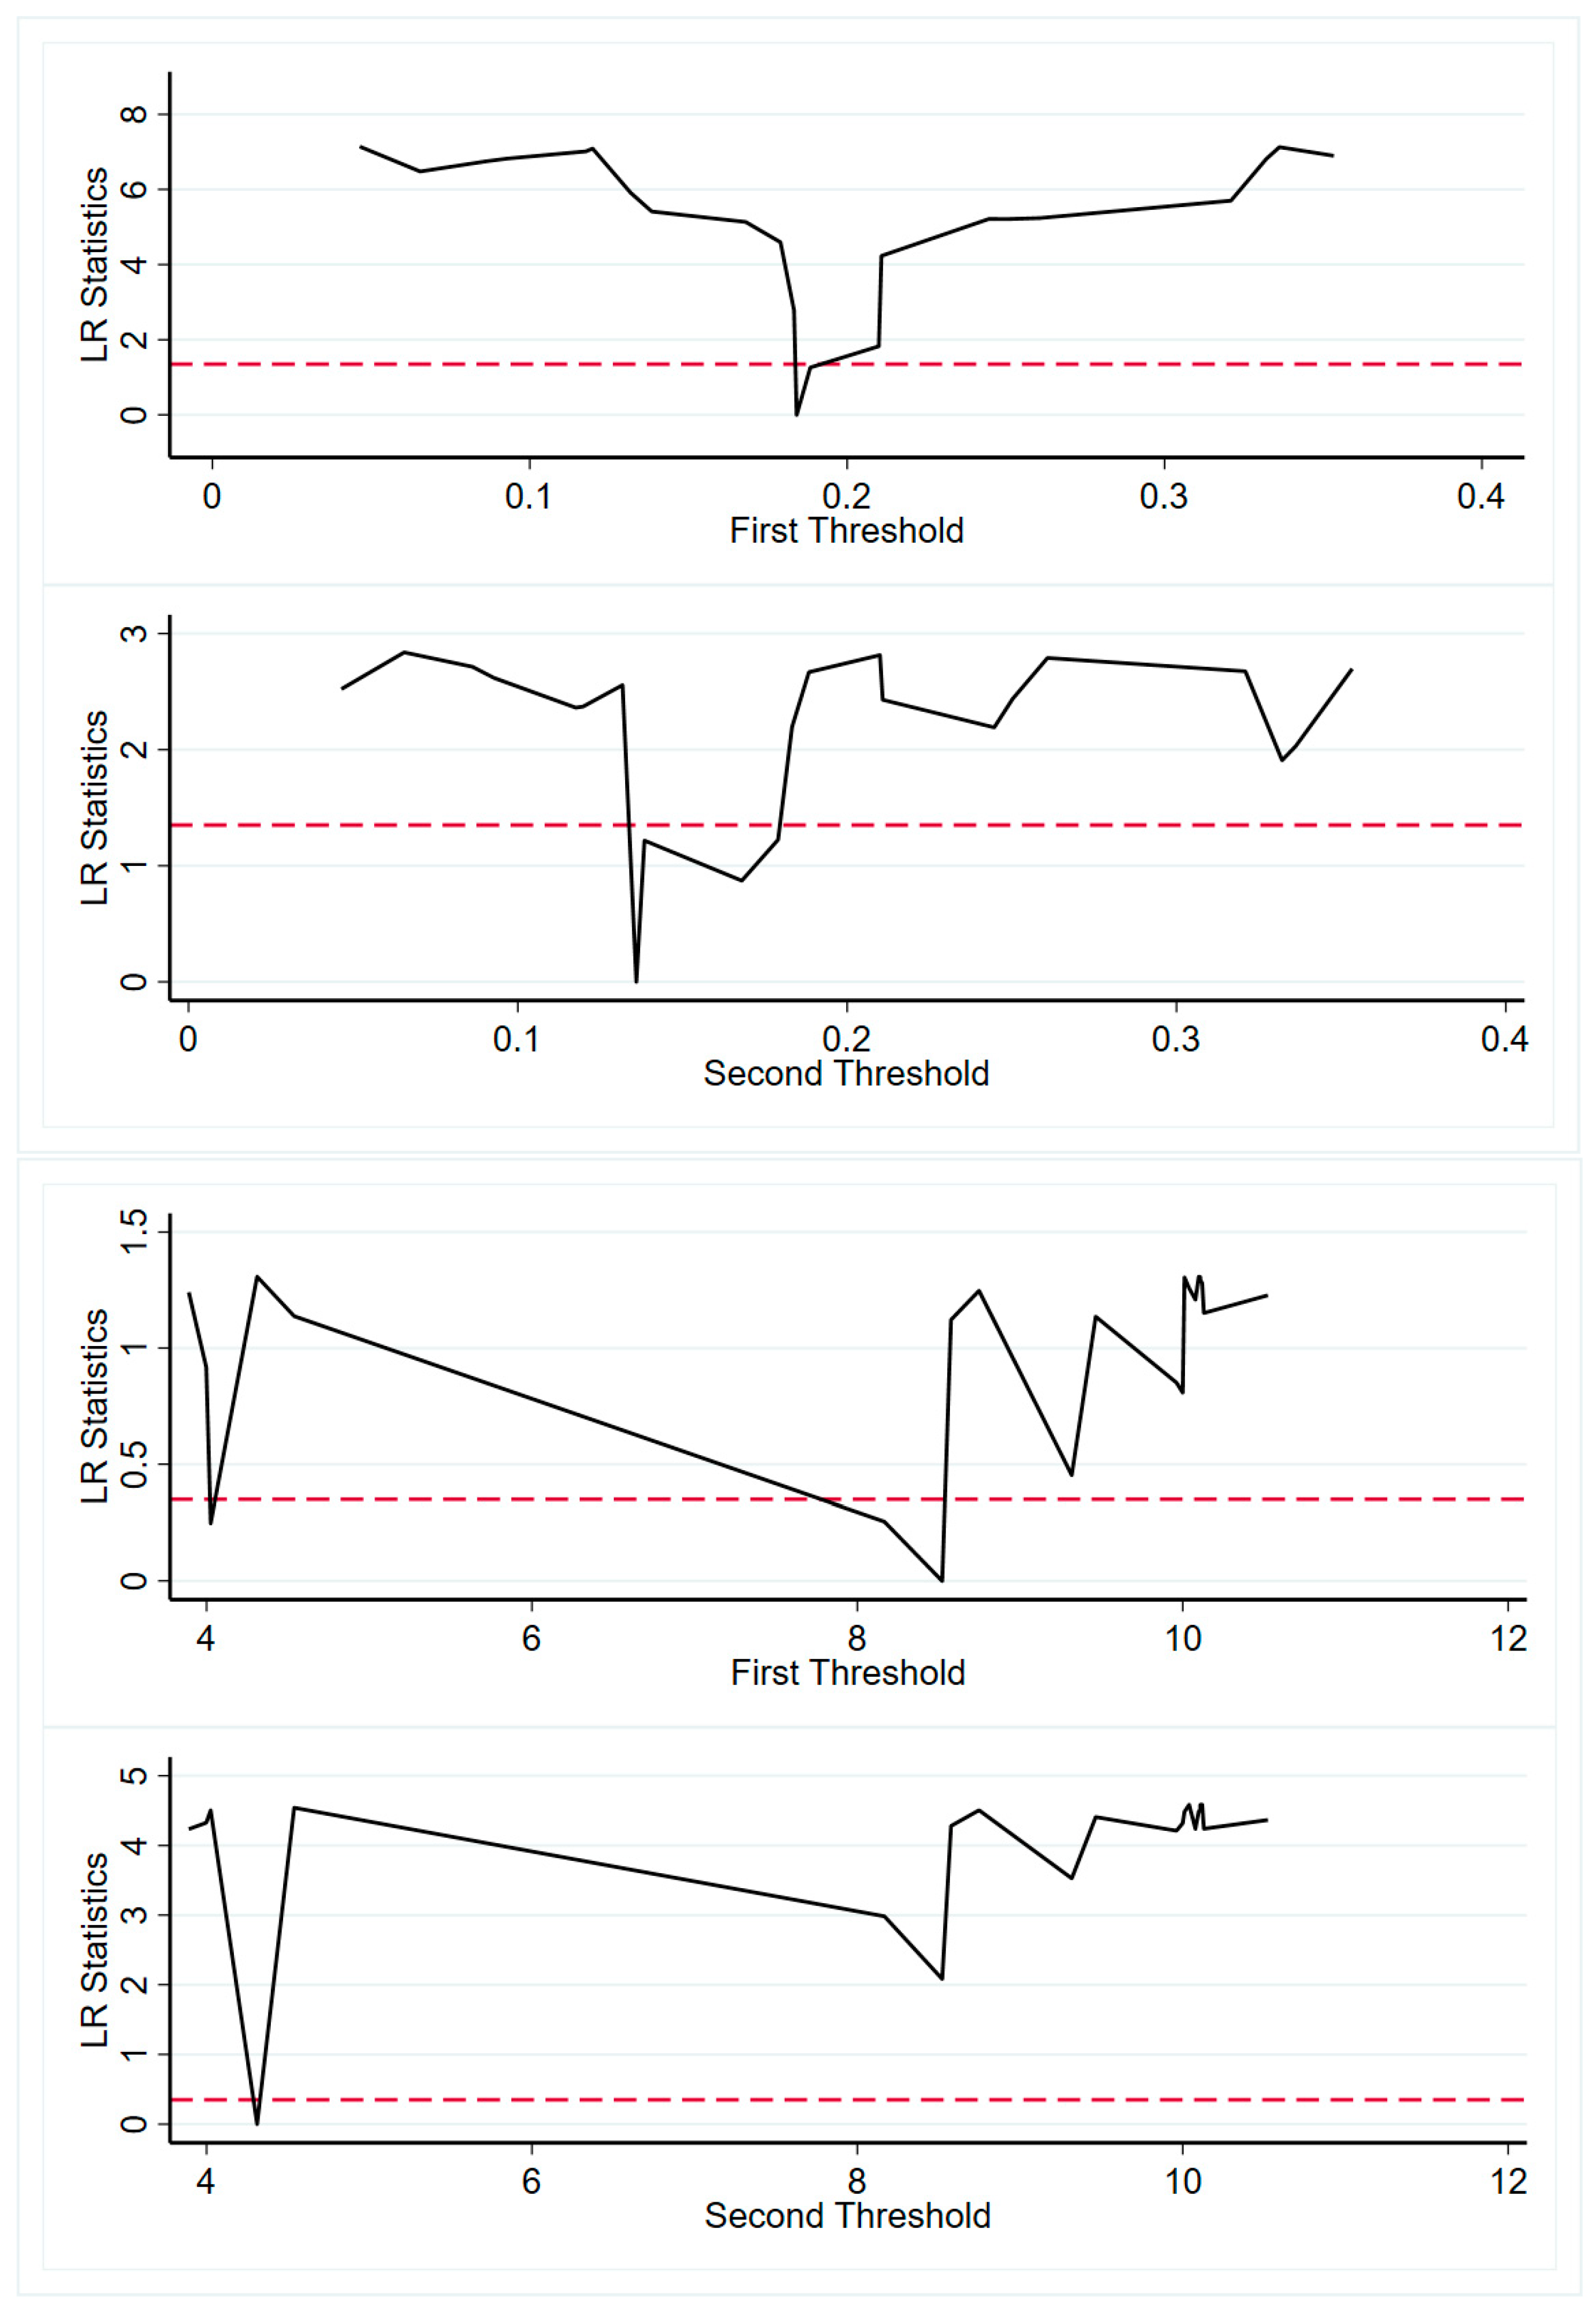
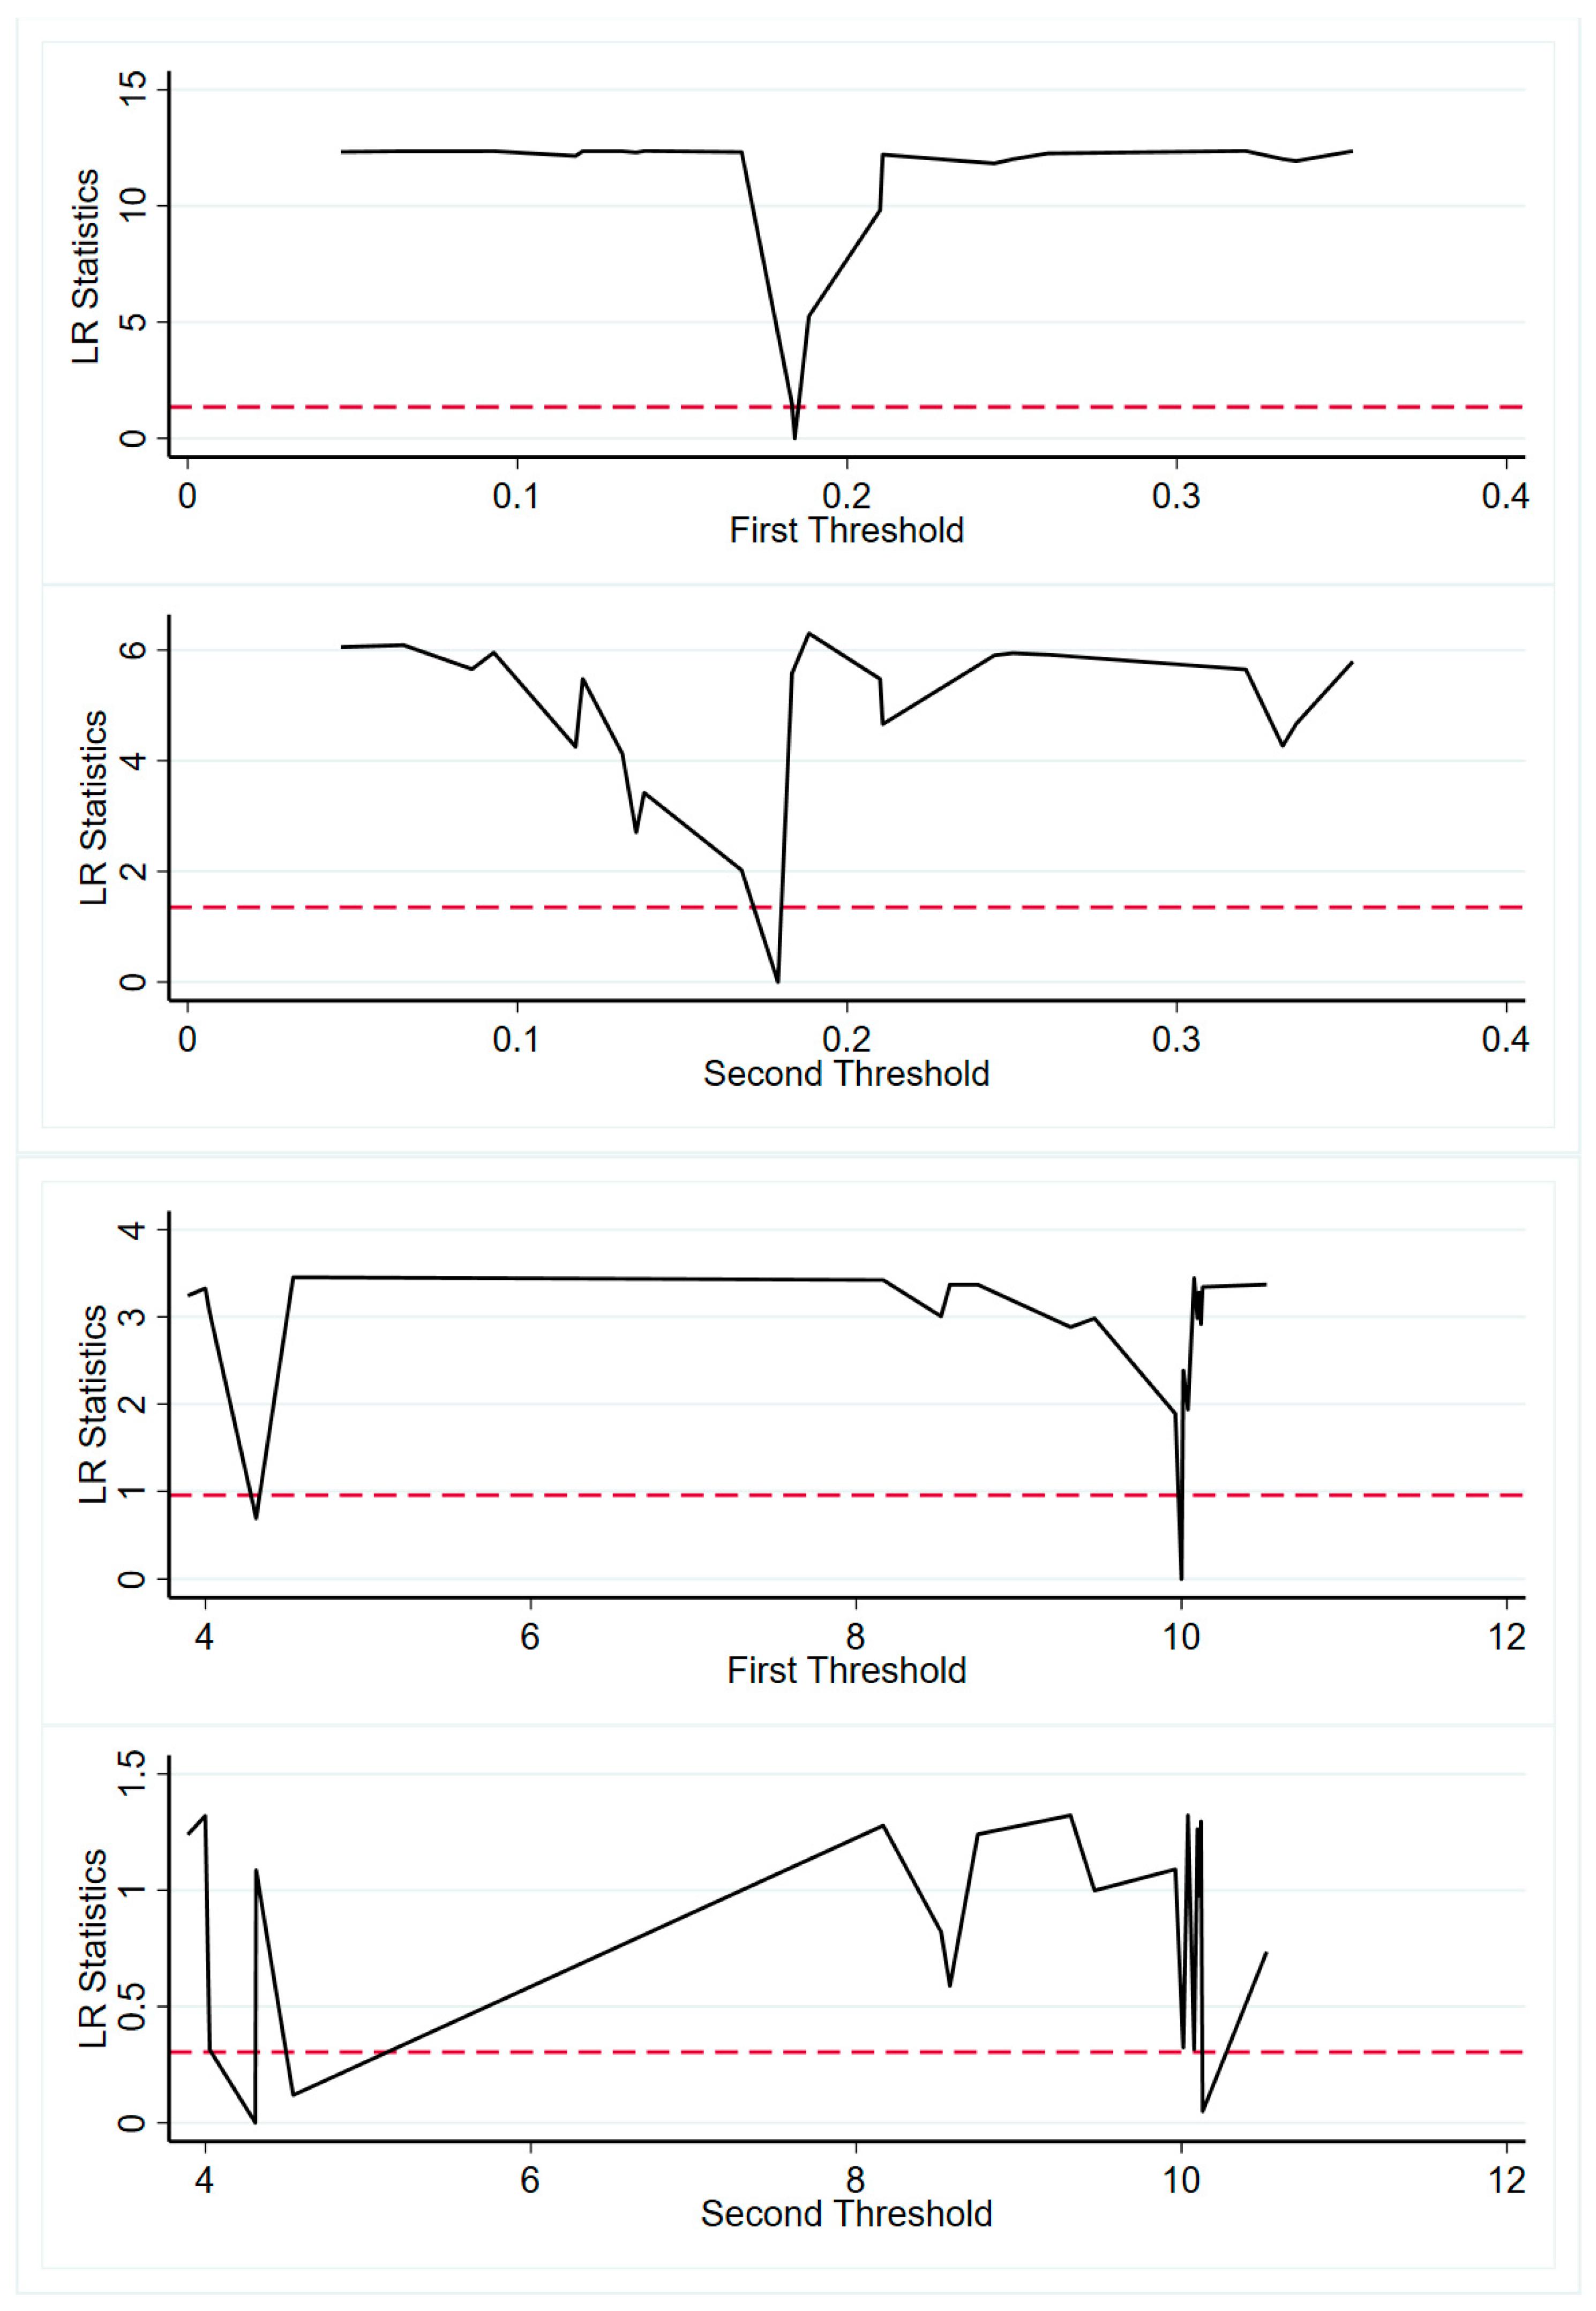
5.2. Analysis and Discussion of Threshold Effect

As Table 4 shows the results of the homogeneity tests. The p-values of the Lagrange multiplier and Fisher-type tests for the null hypothesis of linearity versus the alternative of nonlinearity specifications are shown in Table 4.
As mentioned above, we test the threshold effect under the null hypothesis of no threshold effect. First, in this paper, we use regional absorptive capacity as the threshold variable and divide regional absorptive capacity into technology level (tech) and economic development (eco), and test the significance of different numbers of thresholds in turn. According to Wald statistics and their p-values, all dynamic threshold models with different threshold variables reject the null hypothesis that there is no threshold effect at 1% significance level, suggesting that the threshold effect is obvious. Therefore, due to the differences in regional absorptive capacity, the impact of S&T finance on the Beijing-Tianjin-Hebei region’s collaborative innovation presents nonlinear characteristics, which indicates the need for the threshold panel model. By Table 5, the technical level (tech) of single threshold was significantly at the 10% level, the F value were 5.49 and 5.78, since the sampling p-values were 0.08, 0.06; the triple threshold was not significant. Based on Hansen threshold theory, the model is a significant technology of double threshold effect. According to F value and self-sampling p value, it can be seen that the economic development foundation (eco) also has double threshold effect, and the threshold values are shown in Table 6.
In order to further confirm the suitable threshold effect, use the bootstrap sampling method 1000 bootstrap sampling, it can achieve the areas under the 95% confidence interval of absorptive capacity threshold value and the change tendency of the confidence interval of the threshold value. As shown in Figure 3, the threshold values are 0.1790 and 0.3320, respectively, indicating that at different technological levels, the influence effect of public S&T finance on regional collaborative innovation has obvious structural changes at the above two nodes. Similarly, under different absorptive capacities of different regions, the effect of public S&T finance and market S&T finance on regional collaborative innovation is not a symmetric U-shaped relationship (see Figure 4).

5.2.1. Public S&T Finance and Regional Collaborative Innovation under the Effect of Absorptive Capacity

The effect of public S&T finance on regional collaborative innovation has double threshold effect under the factor of regional absorptive capacity. The threshold value of technological level (tech) is 0.1790 and 0.3320, respectively, and the threshold value of economic development foundation (eco) is 4.3062 and 7.2994, respectively. The results shown in Table 7 test whether the improvement of technological level and economic development basis will enhance the positive impact of public S&T finance on regional collaborative innovation. From the overall regression results, under different thresholds of absorptive capacity factors, public S&T finance has a significant restraining effect on regional collaborative innovation, which also conforms to the phased characteristics of the development of S&T finance in China, and the government-led public S&T finance does not play an effective guiding role. With the gradual improvement of technology level, the influence trend of public S&T finance first increases and then decreases. However, with the improvement of economic development foundation, the inhibition and threshold characteristics of public S&T finance are more significant. Importantly, when the regional absorptive capacity is relatively high, the inhibition of public sic-tech finance is enhanced. When the regional absorptive capacity reaches the first threshold value, the technical and economic level of the region is relatively low. At this moment, the market financial intervention is insufficient, the government’s guidance plays a relatively important role, and the public S&T finance has a significant impact. When the regional absorptive capacity is between the two thresholds, the regional technological and economic development level is high, a large amount of capital enters the capital market, and the risk is enhanced accordingly. The regulation effect of the influence mechanism of public S&T finance is more significant.

5.2.2. Market S&T Finance and Regional Collaborative Innovation under the Effect of Absorptive Capacity Factors

Market S&T finances the role of the regional collaborative innovation under the regional elements of absorptive capacity, which is a double threshold effect, with a technical level of threshold value of 0.0822 and 0.1841, and the economic development of the threshold value being 7.2994, 10.0776. From the distance of threshold value, with the technical level as the reference index, the access time of market S&T finance is short, so the investment of market S&T finance must seize the opportunity in order to maximize the benefits. The stable economic growth creates a stable market environment, which has a positive impact on the investment of market S&T finance. In comparison, the market S&T finance is more sensitive to the change of technological level, and the threshold value is triggered relatively early. This is because the capital of market S&T finance mainly comes from the capital market and risk institutions, and the improvement of technology level will drive the change of risk, thus causing the change of market S&T finance. In Table 8, under the effect of the distance threshold of regional absorptive capacity, the nonlinear impact of market S&T finance on regional collaborative innovation is generally positive. In addition, the economic development foundation level is too high or too low will show a certain inhibitory effect. Specifically, before crossing the first threshold value of 7.2994, the impact of market S&T finance on regional collaborative innovation is −0.005. It shows that when the economic development foundation is low, financial capital has a restraining effect on technological innovation and its synergistic development. At this time, due to the low foundation of economic development, capital market resources cannot be fully mobilized, resulting in low conversion rate of scientific and technological achievements. The second threshold value is 10.0776. When the economic development base is between 7.2994 and 10.0776, the change of regression coefficient is positive, and the positive influence on regional collaborative innovation increases significantly. After the second threshold, the regression coefficient decreases gradually. Under the double thresholds of economic development foundation, the effect of market S&T finance on regional collaborative innovation is gradually increasing, and there is a change from negative to positive, showing a significant threshold characteristic.

6. Conclusions and Policy Implication

This paper constructs a threshold model to analyze the nonlinear impact of S&T finance on regional collaborative innovation. We use regional absorptive capacity as the threshold variable, and the level of technology and economic development base as the elements of absorptive capacity, and measure the threshold of regional absorptive capacity by matching supply and demand. Compared with the existing literature, the innovation of this paper is that, firstly, absorptive capacity elements are measured based on the supply and demand matching of technological level and economic development foundation, and regional absorptive capacity is taken as the threshold variable. On this basis, the influence of S&T finance on regional collaborative innovation is analyzed. Similar to the research results of scholars, this paper argues that financial by driving regional technology exchange and collaborative innovation of S&T, so as to promote the development of regional scientific and technological innovation balance [24,45]. In addition, S&T finance can improve the regional input of capital and other resource factors, and then optimize the flow of regional financial factors [10,46]. However, this paper holds that the spillover effect of S&T finance has a significant impact on the collaborative development of regional S&T innovation. The matching of supply and demand based on the technological level and the absorptive capacity of economic development is a double threshold effect, which has not been found by previous scholars.
According to the empirical results, the following conclusions and enlightenment can be drawn:
First, the influence of public S&T finance in Beijing-Tianjin-Hebei region on regional collaborative innovation is not just a simple grounding relationship, or a symmetric inverted U-shaped relationship, and there is a nonlinear relationship with regional absorptive capacity as the double threshold. The empirical results show that, with the decrease of the absorptive capacity of the Beijing-Tianjin-Hebei region, public S&T finance has a significant inhibiting effect on the development of regional collaborative innovation. The influence effect shows a trend of stepwise improvement in the first stage and small acceleration in the second stage. Therefore, in the process of S&T collaborative innovation development in Beijing-Tianjin-Hebei region, the innovation mode based on public S&T finance is adopted. Should always pay attention to the dynamic change of technological and economic development level. Randomly adjust the access time of public funds, so as to maximize the public technology and finance driven advantage.
Second, in the Beijing-Tianjin-Hebei region, considering the heterogeneity of regional absorptive capacity, market S&T finance has a nonlinear effect of double thresholds on regional collaborative innovation. Due to the sensitivity of market S&T finance to risk, its timeliness to technology level is remarkable. With the improvement of economic development level, the environment of capital market and venture capital market is relatively stable, which can promote the investment ability of market S&T finance. The more significant the difference of economic development basis, the more unfavorable the market S&T finance is to the development of regional collaborative innovation. In the process of the increase of regional absorption capacity, especially the change of economic development basis, the influence trend of market scie-tech finance shows the effect from negative inhibition to positive promotion gradually. Therefore, it is necessary to choose the best investment subject of S&T finance according to the regional absorptive capacity difference. At this time, the substitution effect and regulation effect of public S&T finance can share part of the risk of market mechanism. It is beneficial to improve the level of S&T coordination in the Beijing-Tianjin-Hebei region.
Third, the differences in absorptive capacity of Beijing-Tianjin-Hebei region, such as technological level and economic development basis, exist objectively and are a dynamic process. Therefore, in the process of Beijing-Tianjin-Hebei S&T coordinated development, the technical level and economic development base level within the region should be taken into account. Pay attention to both fluctuations and where they are. When the regional absorption capacity difference is too large, the government should play an active role in regulation and control, and increase the public S&T finance at the right time to give play to its sustainability. In the Beijing-Tianjin-Hebei region, where differences in absorptive capacity are relatively small. We should develop a S&T finance model based on market S&T finance and supplemented by public S&T finance. To achieve the effective combination of government behavior and market mechanism, so as to reduce the synergistic effect, improve the effective allocation of financial resources, in order to achieve the wealth maximization of scientific and technological assets.
Based on the above research conclusions, this study puts forward policy suggestions from two aspects: increasing support for S&T finance and choosing appropriate ways to support it. On the one hand, continuous investment in S&T finance should be maintained to drive the S&T development and innovation. The government should guide the Beijing-Tianjin-Hebei region to increase the S&T finance resource investment in high-risk R&D projects, reducing the risk of autonomous R&D investment decisions of enterprises in various regions. On the other hand, the S&T finance approach is not immutable. The government can dynamically adjust S&T finance mode according to the level of regional economic development and absorptive capacity, so as to maximize the spillover effect of sci-tech finance.

Author Contributions

Conceptualization, Z.L. and H.L.; methodology, X.L.; software, X.L.; validation, Z.L., H.L. and S.W.; formal analysis, X.L.; investigation, H.L.; resources, S.W.; data curation, H.L.; writing—original draft preparation, H.L. and X.L.; writing—review and editing, H.L., X.L. and S.W.; visualization, H.L.; supervision, S.W.; project administration, X.L.; funding acquisition, Z.L.; All authors have read and agreed to the published version of the manuscript.

Funding

This research was funded by the Hebei Social Science Foundation major project (HB19ZD03); Hebei Province Department of Education Humanities and Social Science Research Major Project (ZD202004); Hebei Province Natural Science Foundation (G2021202001); Hebei Province Soft Science Research Project of Innovation Capability Improvement Plan: 225576190D.

Institutional Review Board Statement

Not applicable.

Informed Consent Statement

Not applicable.

Data Availability Statement

The data presented in this study are available on request from the corresponding author.

Conflicts of Interest

The authors declare no conflict of interest.

References

  1. Zhu, X.; Asimakopoulos, S.; Kim, J. Financial development and innovation-led growth: Is too much finance better? J. Int. Money Financ. 2020, 100, 102083. [Google Scholar] [CrossRef]
  2. Guariglia, A.; Liu, P. To what extent do financing constraints affect Chinese firms’ innovation activities? Int. Rev. Financ. Anal. 2014, 36, 223–240. [Google Scholar] [CrossRef]
  3. Law, S.H.; Lee, W.C.; Singh, N. Revisiting the finance-innovation nexus: Evidence from a non-linear approach. J. Innov. Knowl. 2018, 3, 143–153. [Google Scholar] [CrossRef]
  4. Fan, F.; Lian, H.; Wang, S. Can regional collaborative innovation improve innovation efficiency? An empirical study of Chinese cities. Growth Chang. 2020, 51, 440–463. [Google Scholar] [CrossRef]
  5. Zhao, Q.W.; Fu, J.F.; Liu, H.J. Key issues in science and technology finance: A review of China science and Technology Finance 2014 Annual Meeting. Manag. World 2015, 164–167. [Google Scholar] [CrossRef]
  6. Wang, W.; Wang, S. Review and prospect of public science and technology finance research. Sci. Manag. Res. 2021, 39, 129–134. [Google Scholar]
  7. Wang, H.T.; Liu, J.; Lei, D. Research on the function orientation of science and technology finance in the coupling development of new and old industries. Manag. World 2014, 178–179. [Google Scholar] [CrossRef]
  8. Zou, K.; Ni, Q.S. Is there substitution effect in public technology finance? China Soft Sci. 2019, 3, 164–173. [Google Scholar]
  9. Xie, X.M.; Zuo, L.L. Collaborative innovation network characteristics and innovation performance: A mediating effect based on knowledge absorptive capacity. Nankai Manag. Rev. 2013, 16, 47–56. [Google Scholar]
  10. Miguélez, E.; Moreno, R. Knowledge flows and the absorptive capacity of regions. Res. Policy 2015, 44, 833–848. [Google Scholar] [CrossRef]
  11. Xie, R.; Fu, W.; Yao, S.; Zhang, Q. Effects of financial agglomeration on green total factor productivity in Chinese cities: Insights from an empirical spatial Durbin model. Energy Econ. 2021, 101, 105449. [Google Scholar] [CrossRef]
  12. Lau, A.K.W.; Lo, W. Regional innovation system, absorptive capacity and innovation performance: An empirical study. Technol. Forecast. Soc. Chang. 2015, 92, 99–114. [Google Scholar] [CrossRef]
  13. King, R.G.; Levine, R. Finance, entrepreneurship and growth. J. Monet. Econ. 1993, 32, 513–542. [Google Scholar] [CrossRef]
  14. Ding, R.; Chen, S.; Zhang, B.; Shen, S.; Zhou, B. The reduce of energy consumption intensity: Does the development of science and technology finance matter? Evidence from China. Energy Rep. 2022, 8, 11206–11220. [Google Scholar] [CrossRef]
  15. Zhao, X.; Li, X.; Wu, J. The Research on Connection Mechanism Between Innovation Subjects and Regional Innovation System. J. Jiangsu Univ. 2009, 11, 68–72. [Google Scholar]
  16. Wang, H.Q.; Xu, Y.L. A measure model for synergy degree between sci-tech innovation and sci-tech finance and its application. China Soft Sci. 2012, 129–138. [Google Scholar] [CrossRef]
  17. Pan, J.; Zhang, Y.X. The regional S&T innovation performance of government, enterprises and financial institutions of S&T investment. Stud. Sci. Sci. 2018, 36, 831–838. [Google Scholar]
  18. Zheng, L.; Zhang, W.K. The non-linear influence of tech-finance on tech-innovation: A U-shaped relationship. Soft Sci. 2018, 32, 16–20. [Google Scholar]
  19. Haken, H. Synergetics: An Introduction; Springer: New York, NY, USA, 1983; pp. 120–127. [Google Scholar]
  20. Freeman, C. Networks of Innovation: A Synthesis of Research Issue. Res. Policy 1991, 20, 499–514. [Google Scholar] [CrossRef]
  21. Cooke, P. Regional Innovation Systems: Competitive Regulation in the New Europe. Geoforum 1992, 23, 365–372. [Google Scholar] [CrossRef]
  22. Li, X.D.; Zhao, Y.T. The Analysis of Behaviors of Local Government in the Regional Innovation System. Ind. Technol. Econ. 2007, 26, 16–19. [Google Scholar]
  23. Feldman, M.P.; Audretsch, D.B. Knowledge spillovers and the geography of innovation. Handb. Reg. Urban Econ. 2004, 4, 2713–2739. [Google Scholar]
  24. Basile, R.; Roberta, C.; Andrea, C. Technological interdependence and regional growth in Europe: Proximity and synergy in knowledge spillovers. Pap. Reg. Sci. 2012, 91, 697–722. [Google Scholar] [CrossRef]
  25. Arratt, D.G.; Duncan, R.; Bossomaier, T. It’s not only what you know: Simulating research networks in the UK university sector. Emerg. Complex. Organ. 2014, 16, 1–28. [Google Scholar]
  26. Kavita, S.; Anuraag, S.; Ambuj, D.S. Strengthening science, technology, and innovation-based incubators to help achieve Sustainable Development Goals: Lessons from India. Technol. Forecast. Soc. Chang. 2020, 157, 47–62. [Google Scholar]
  27. Di Giacinto, V. On vector autoregressive modeling in space and time. J. Geogr. Syst. 2010, 12, 125–154. [Google Scholar] [CrossRef]
  28. Márquez, M.A.; Julián, R.; Hewings, G.J. Regional growth and spatial spillovers: Evidence from an SpVAR for the Spanish regions. Reg. Sci. 2015, 94, S1–S18. [Google Scholar] [CrossRef]
  29. Wang, H.Y.; Liu, Y. Measurement and analysis of the development level of regional science and technology finance. Technol. Econ. 2019, 38, 50–56. [Google Scholar]
  30. Xu, Y.Q.; Li, T.; Lu, L.L. Research on the Influence of the Pilot Policy of combining Science and Technology with Finance on regional economic growth—Based on the perspective of science and technology innovation and industrial structure rationalization. J. Chongqing Univ. (Soc. Sci. Ed.) 2021, 27, 1–15. [Google Scholar]
  31. Hall, B.H.; Maffioli, A. Evaluating the impact of technology development funds in emerging economies: Evidence from Latin America. Eur. J. Dev. Res. 2008, 20, 172–198. [Google Scholar] [CrossRef]
  32. Bloch, C.; Graversen, E.K. Additionality of public R&D funding for business R&D–A dynamic panel data analysis. World Rev. Sci. Technol. Sustain. Dev. 2012, 9, 204–220. [Google Scholar]
  33. Ang, J.B. Research, technological change and financial liberalization in South Korea. J. Macroecon. 2010, 32, 457–468. [Google Scholar] [CrossRef]
  34. Yu, Z.-F.; Wang, W.-Q.; Yan, Y.; Liu, X.-S. Energy loss evaluation in a Francis turbine under overall operating conditions using entropy production method. Renew. Energy 2021, 69, 982–999. [Google Scholar] [CrossRef]
  35. Bochko, V.S. The Accelerating and Constraining Factors of the Coordinated and Balanced Development of Regions. Econ. Reg. 2015, 41, 39–52. [Google Scholar] [CrossRef]
  36. Xu, M.; Chen, C.; Deng, X. Systematic analysis of the coordination degree of China’s economy-ecological environment system and its influencing factor. Environ. Sci. Pollut. Res. 2019, 26, 29722–29735. [Google Scholar] [CrossRef] [PubMed]
  37. Wang, R.X.; Yang, M. Absorptive Capacity and Technology-Finance Coupling Value Chain Realization: Empirical Evidence from Cross-country Data and Application in China. Manag. Rev. 2020, 32, 29–39. [Google Scholar]
  38. Seo, M.H.; Kim, S.; Kim, Y.J. Estimation of dynamic panel threshold model using Stata. Stata J. 2019, 19, 685–697. [Google Scholar] [CrossRef]
  39. Ahmad, M.; Majeed, A.; Khan, M.A.; Sohaib, M.; Shehzad, K. Digital financial inclusion and economic growth: Provincial data analysis of China. China Econ. J. 2021, 14, 291–310. [Google Scholar] [CrossRef]
  40. Wu, H.; Hao, Y.; Weng, J.H. How does energy consumption affect China’s urbanization? New evidence from dynamic threshold panel models. Energy Policy 2019, 127, 24–38. [Google Scholar] [CrossRef]
  41. Li, Z.D.; Yu, Z.X.; Wang, M.J. A two-step sequential estimation for dynamic panel threshold model. Stat. Res. 2014, 31, 72–80. [Google Scholar]
  42. Yano, G.; Shiraishi, M. Finance, institutions, and innovation activities in China. Econ. Syst. 2020, 44, 100835. [Google Scholar] [CrossRef]
  43. Qiu, B.; Tang, B.Q.; Sun, S.Q.; Liu, X.Y. Factor endowment, institutional dividend and new comparative advantage of exports. Econ. Res. J. 2014, 49, 107–109. [Google Scholar]
  44. Mukherji, N.; Silberman, J. Absorptive capacity, knowledge flows, and innovation in US metropolitan areas. J. Reg. Sci. 2013, 53, 392–417. [Google Scholar] [CrossRef]
  45. Liu, X.W.; Zou, K. Does Sci-tech Finance Promote the Synergy of Economy and Innovation? J. Hunan Univ. Sci. Tech. (Soc. Sci. Ed.) 2021, 24, 71–81. [Google Scholar]
  46. Ke, H.; Dai, S.; Yu, H. Spatial effect of innovation efficiency on ecological footprint: City-level empirical evidence from China. Environ. Technol. Innov. 2021, 22, 101536. [Google Scholar] [CrossRef]
Figure 1. The degree of synergy of technological innovation in Beijing, Tianjin and Hebei.
Sustainability 14 15980 g001
Figure 2. Collaboration degree of technological innovation in the Beijing-Tianjin-Hebei region. Note: * menas the synergy value for each year.
Sustainability 14 15980 g002
Figure 3. LR statistics of two thresholds (Public S&T Finance).
Sustainability 14 15980 g003
Figure 4. LR statistics of two thresholds (Market S&T Finance).
Sustainability 14 15980 g004
Table 1. Indexes for measuring synergy of regional technological innovation “input-output-environment” composite system.
SubsystemMeasurement IndexUnitsWeight
Input subsystemR&D investmentWan Yuan0.1
Full time equivalent of R&D personnelTen thousand years0
Financial expenditure on science and technology100 million yuan0.1
Foreign technology import expenses of the enterpriseWan Yuan0.1
New product development project personnel inputman-year0
Investment in new product developmentWan Yuan0.1
Output subsystemTotal R&D projectsitem0
Number of patents grantedpiece0.2
Three major retrieval papers published numberpiece0.1
Market technology turnover100 million yuan0.1
Revenue from new product salesWan Yuan0
Environmental subsystemWholesale and retail added value100 million yuan0
Industrial added value100 million yuan0
Regional GDP growth100 million yuan0
revenue in the general public budgets100 million yuan0.1
Table 2. Main variables and measurement methods.
Variable TypesVariable NameMeasuring Method
Explained variableRSTSInput-output-environment system coordination
kernel variablePubFinGovernment expenditure on science and technology/fiscal expenditure
MarFinAmount of technology loans from financial institutions/Science and technology expenditure
Enterprise R&D investment/Main business income of the enterprise
Number of technology listed companies/Total number of listed companies
threshold variabletechPatent authorization traffic data is converted into stock
ecoper capital GDP
control variableMarfiscal expenditure/GDP
Hcresearcher/Urban Employed Persons
FinBalance of loans from financial institutions/GDP
Table 3. The degree of collaborative innovation of S&T in the Beijing-Tianjin-Hebei region.
Year20102011201220132014201520162017201820192020
Beijing-Tianjin-Hebei synergy degree0.0133 −0.0110 −0.0061 −0.0117 0.0040 0.0330 0.0149 0.0147 0.0192 0.0207 0.0153
Beijing sci&tech
synergy degree
0.0120 0.0106 −0.0063 0.0045 0.0155 0.0270 0.0154 0.0099 0.0162 0.0143 0.0132
Tianjing sci&tech
synergy degree
0.0093 0.0099 −0.0102 0.0147 0.0067 0.0138 0.0167 −0.0439 −0.0074 −0.0633 −0.0421
Hebei sci&tech
synergy degree
0.0102 −0.0079 0.0064 0.0053 0.0066 0.0159 0.0032 0.0073 −0.0245 0.0021 −0.035
Table 4. The LM and F homogeneity test (p-value).
m = 1PubFinMarFin
LM test0.0046190.000261
F test0.000 0.000
Note: LM and F are the Lagrange multiplier and F tests for linearity; H0 linear model, H1 PSTR model with m = 1.
Table 5. Threshold effect test.
Threshold
Variable
Threshold
Model
Public Technology FinanceMarket Technology Finance
F-Value p-ValueCritical ValueF-Value p-ValueCritical Value
1%5%10%1%5%10%
techsingle
threshold
5.490.0832.4817.3311.585.780.0620.8914.2411.18
double
threshold
6.310.0637.8816.0910.5211.060.0314.7410.437.54
triple
threshold
6.390.533.3823.9820.751.510.7512.7108.37
ecosingle
threshold
3.840.0611.548.066.462.260.0730.0618.1810.75
double
threshold
2.470.0210.067.797.13.130.0421.1812.7910.77
triple
threshold
5.860.117.556.835.981.470.9420.6414.8613.36
Table 6. Threshold values and their confidence intervals.
Threshold
Variable
Threshold
Model
Public Technology FinanceMarket Technology Finance
Threshold Estimate95% CIThreshold Estimate95% CI
techfirst threshold0.188374(0.0169, 0.4687)0.1384(0.02, 0.47)
second threshold0.3320411(0.0822, 0.4687)0.1884(0.18, 0.47)
third threshold0.4686667(0.0169, 0.4687)0.47(0.02, 0.47)
ecofirst threshold8.1658(2.8668, 11.9)3.9984(2.906, 11.905)
second threshold9.961134(9.95, 11.9)10.07775(10.056, 11.895)
third threshold11.8944(2.8668, 11.9)11.8944(2.906, 11.905)
Table 7. Regression results of Public S&T finance in the regional absorptive capacity threshold.
Threshold RangePubFinLRSTSMarHcFin_cons
tech ≤ 0.1790−8.58995 **0.2596814.42075 ***−0.90464.6203−0.00912
0.1790 < tech ≤ 0.3320−10.4774 ***
tech < 0.3320−8.38083 **
eco ≤ 4.3062−5.63860.177919.5307 ***−1.3783 ***1.54080.0277
4.3062 < eco ≤ 7.2994−8.8848 **
eco < 7.2994−12.271 ***
Note: ** p < 0.05, *** p < 0.01.
Table 8. Regression results of Market S&T finance in the regional absorptive capacity threshold.
Threshold RangeMarFinLRSTSMarHcFin_cons
tech ≤ 0.08220.6067 *0.23748.64845 *−0.25287.593−0.1484 **
0.0822 < tech ≤ 0.18410.4332
tech < 0.18410.6114 *
eco ≤ 7.2994−0.0050 **0.2689.6251 *−1.1922 **1.1874−0.0178
7.2994 < eco ≤ 10.07760.0671 *
eco < 10.0776−0.0178
Note: * p < 0.1, ** p < 0.05.
Publisher’s Note: MDPI stays neutral with regard to jurisdictional claims in published maps and institutional affiliations.

