Article

Variability of Water Use Efficiency Associated with Climate Change in the Extreme West of Bahia

by
Dimas de Barros Santiago
1,*,
Humberto Alves Barbosa
2,3,
Washington Luiz Félix Correia Filho
4,
José Francisco de Oliveira-Júnior
3,5,
Franklin Paredes-Trejo
2,6 and
Catarina de Oliveira Buriti
7
1
Postgraduate Program in Meteorology, Academic Unit of Atmospheric Sciences (UACA), Federal University of Campina Grande (UFCG), Campina Grande 58429-140, Brazil
2
Laboratory of Satellite Image Analysis and Processing (LAPIS), Institute of Atmospheric Sciences, Campus A. C. Simões, Federal University of Alagoas, Maceió 57072-900, Brazil
3
Institute of Atmospheric Sciences (ICAT), Federal University of Alagoas (UFAL), Maceió 57072-260, Brazil
4
Institute of Mathematics, Statistics and Physics (IMEF), Federal University of Rio Grande (FURG), Rio Grande 96203-900, Brazil
5
Postgraduate Program in Biosystems Engineering (PGEB), Federal Fluminense University (UFF), Niterói 24220-900, Brazil
6
PCBA Department of Civil Engineering, University of the Western Plains Ezequiel Zamora, San Carlos 2201, Venezuela
7
National Semi-Arid Institute, Ministry of Science, Technology, Innovations and Communications, Campina Grande 58434-700, Brazil
*
Author to whom correspondence should be addressed.
Sustainability 2022, 14(23), 16004; https://doi.org/10.3390/su142316004
Submission received: 12 October 2022 / Revised: 16 November 2022 / Accepted: 20 November 2022 / Published: 30 November 2022
(This article belongs to the Section Sustainable Agriculture)

Abstract

:
Water has become more important in agricultural implementations over the years, as has the need for water management. Thus, Water Use Efficiency (WUE) has been used as an alternative form of detecting the variability of water management based on the carbon–water cycle. The study aimed to map and quantify the spatio-temporal distribution of WUE based on its interactions with environmental changes. It focused on an agricultural area in the westernmost region of Bahia, Northeast Brazil (NEB). For WUE estimation, data from Collection 6 MODIS Gross Primary Productivity (GPP) and Evapotranspiration (ET) products with a spatial resolution of 0.05° × 0.05° were obtained from the Earth Explorer website. Subsequently, annual WUE anomalies were calculated based on the 2001–2019 period. The results obtained indicated that the highest values of GPP (580 gC/m2), ET (3000 mm), and WUE (3.5 gC/mm·m2) occurred in agricultural areas, associated with cultural treatments and insertion of irrigation, which helped in the higher WUE values and consequently increased agricultural productivity in the study region. In addition, there was a marked influence of the phases of the climate variability mode—El Niño-Southern Oscillation (ENSO)—on the annual variability of the WUE, with a reduction of 96% during the La Niña of 2016 (an increase of 89% during El Niño of 2005). During El Niños, vegetation had greater efficiency resulting from the adaptation of vegetation in maintaining the carbon–water balance, using water more efficiently. However, unlike Las Niñas, with excessive precipitation there is an interference in the WUE, which interferes with the absorption of radiation and nutrients for the biophysical processes of vegetation and agriculture and, consequently, agricultural production. The use of WUE for agriculture is extremely important, especially for Brazil and countries with an economy based on primary production. This information on the way vegetation (native or agricultural) responds to interactions with the environment aids in decision-making about water management, possibly lowering losses or agricultural damage caused by a lack of water.

1. Introduction

Over the years, the behavior of the vegetation under climatic and anthropogenic variations has been widely discussed [1,2,3]. Water use efficiency (WUE) and the ratio of carbon (C) assimilation to water (H2O) losses reflect the interaction between the C and H2O cycles. WUE is an indicator to quantify the coupling between the water and carbon cycles [4,5]. The physiological responses of vegetation to environmental changes in terms of WUE [6] are fundamental because changes in the carbon and water cycles have an impact on this variable [7].
That is, understanding the role of vegetation type in WUE behavior is essential, since each type presents different characteristics when conditioned to drought-motivated stress [8]. In this respect, we refer to tropical forests (e.g., Amazonia) in order to understand the role of vegetation type on the WUE on a regional scale as it relates to the water cycle [9], in the same way that the savannahs are conditioned for agricultural production [10].
The analysis of WUE provides valuable information for the assessment of climate change impacts, deficit irrigation, and the management of strategies to promote ecosystem productivity [11]. Water use efficiency is the ratio between gross primary productivity (GPP) and evapotranspiration (ET) in a relatively homogeneous way [12]. Gross primary productivity corresponds to the process called photosynthesis and constitutes one of the main means of controlling the atmosphere—biosphere exchange of carbon dioxide (CO2) [13,14,15]. ET is defined as the sum of water lost by transpiration from crops and evaporation from the soil [16].
WUE is conditioned by changes in environmental and climatic factors (air temperature, precipitation, and elevation) [4,17,18,19]. These changes, in turn, can be influenced by rapid population growth and the modification of native vegetation, as these factors interfere with the amount of CO2 in the atmosphere and, consequently, with the performance of the vegetation and its carbon–water cycle [20]. Regarding the climatic aspects (precipitation and air temperature variability), the climate of Northeast Brazil (NEB) is modulated by the El Niño-Southern Oscillation (ENSO) [21,22], and the Atlantic Interhemispheric Sea Surface Temperature Gradient (AISSTG) stands out [23,24]. These modes of variability modify the circulation pattern and consequently the intensity and frequency of meteorological systems on regional and global scales, as well as on seasonal and annual scales, as observed mainly in the precipitation regime [25,26,27,28].
Changes in the precipitation regime influence the development of vegetation due to the close relationship between water availability and productivity [29,30]. Plant growth varies according to the amount of water available in the environment, and although plants absorb water over their whole body surface, most of the supply comes from the soil [31,32]. According to [33,34], water availability has a strong influence on agricultural productivity, especially in the westernmost region of Bahia, a region of high-tech scientific and/or modern agriculture. This profile is the result of the expansion of monocultures motivated by the spread of globalized agribusiness in areas of the Brazilian Cerrado, which has stood out economically in the cultivation of grains, especially soybean, maize, and cotton [35,36]. The present study aimed to map and quantify the spatio-temporal distribution of WUE based on its environmental interactions in the westernmost region of Bahia, NEB.

2. Material and Methods
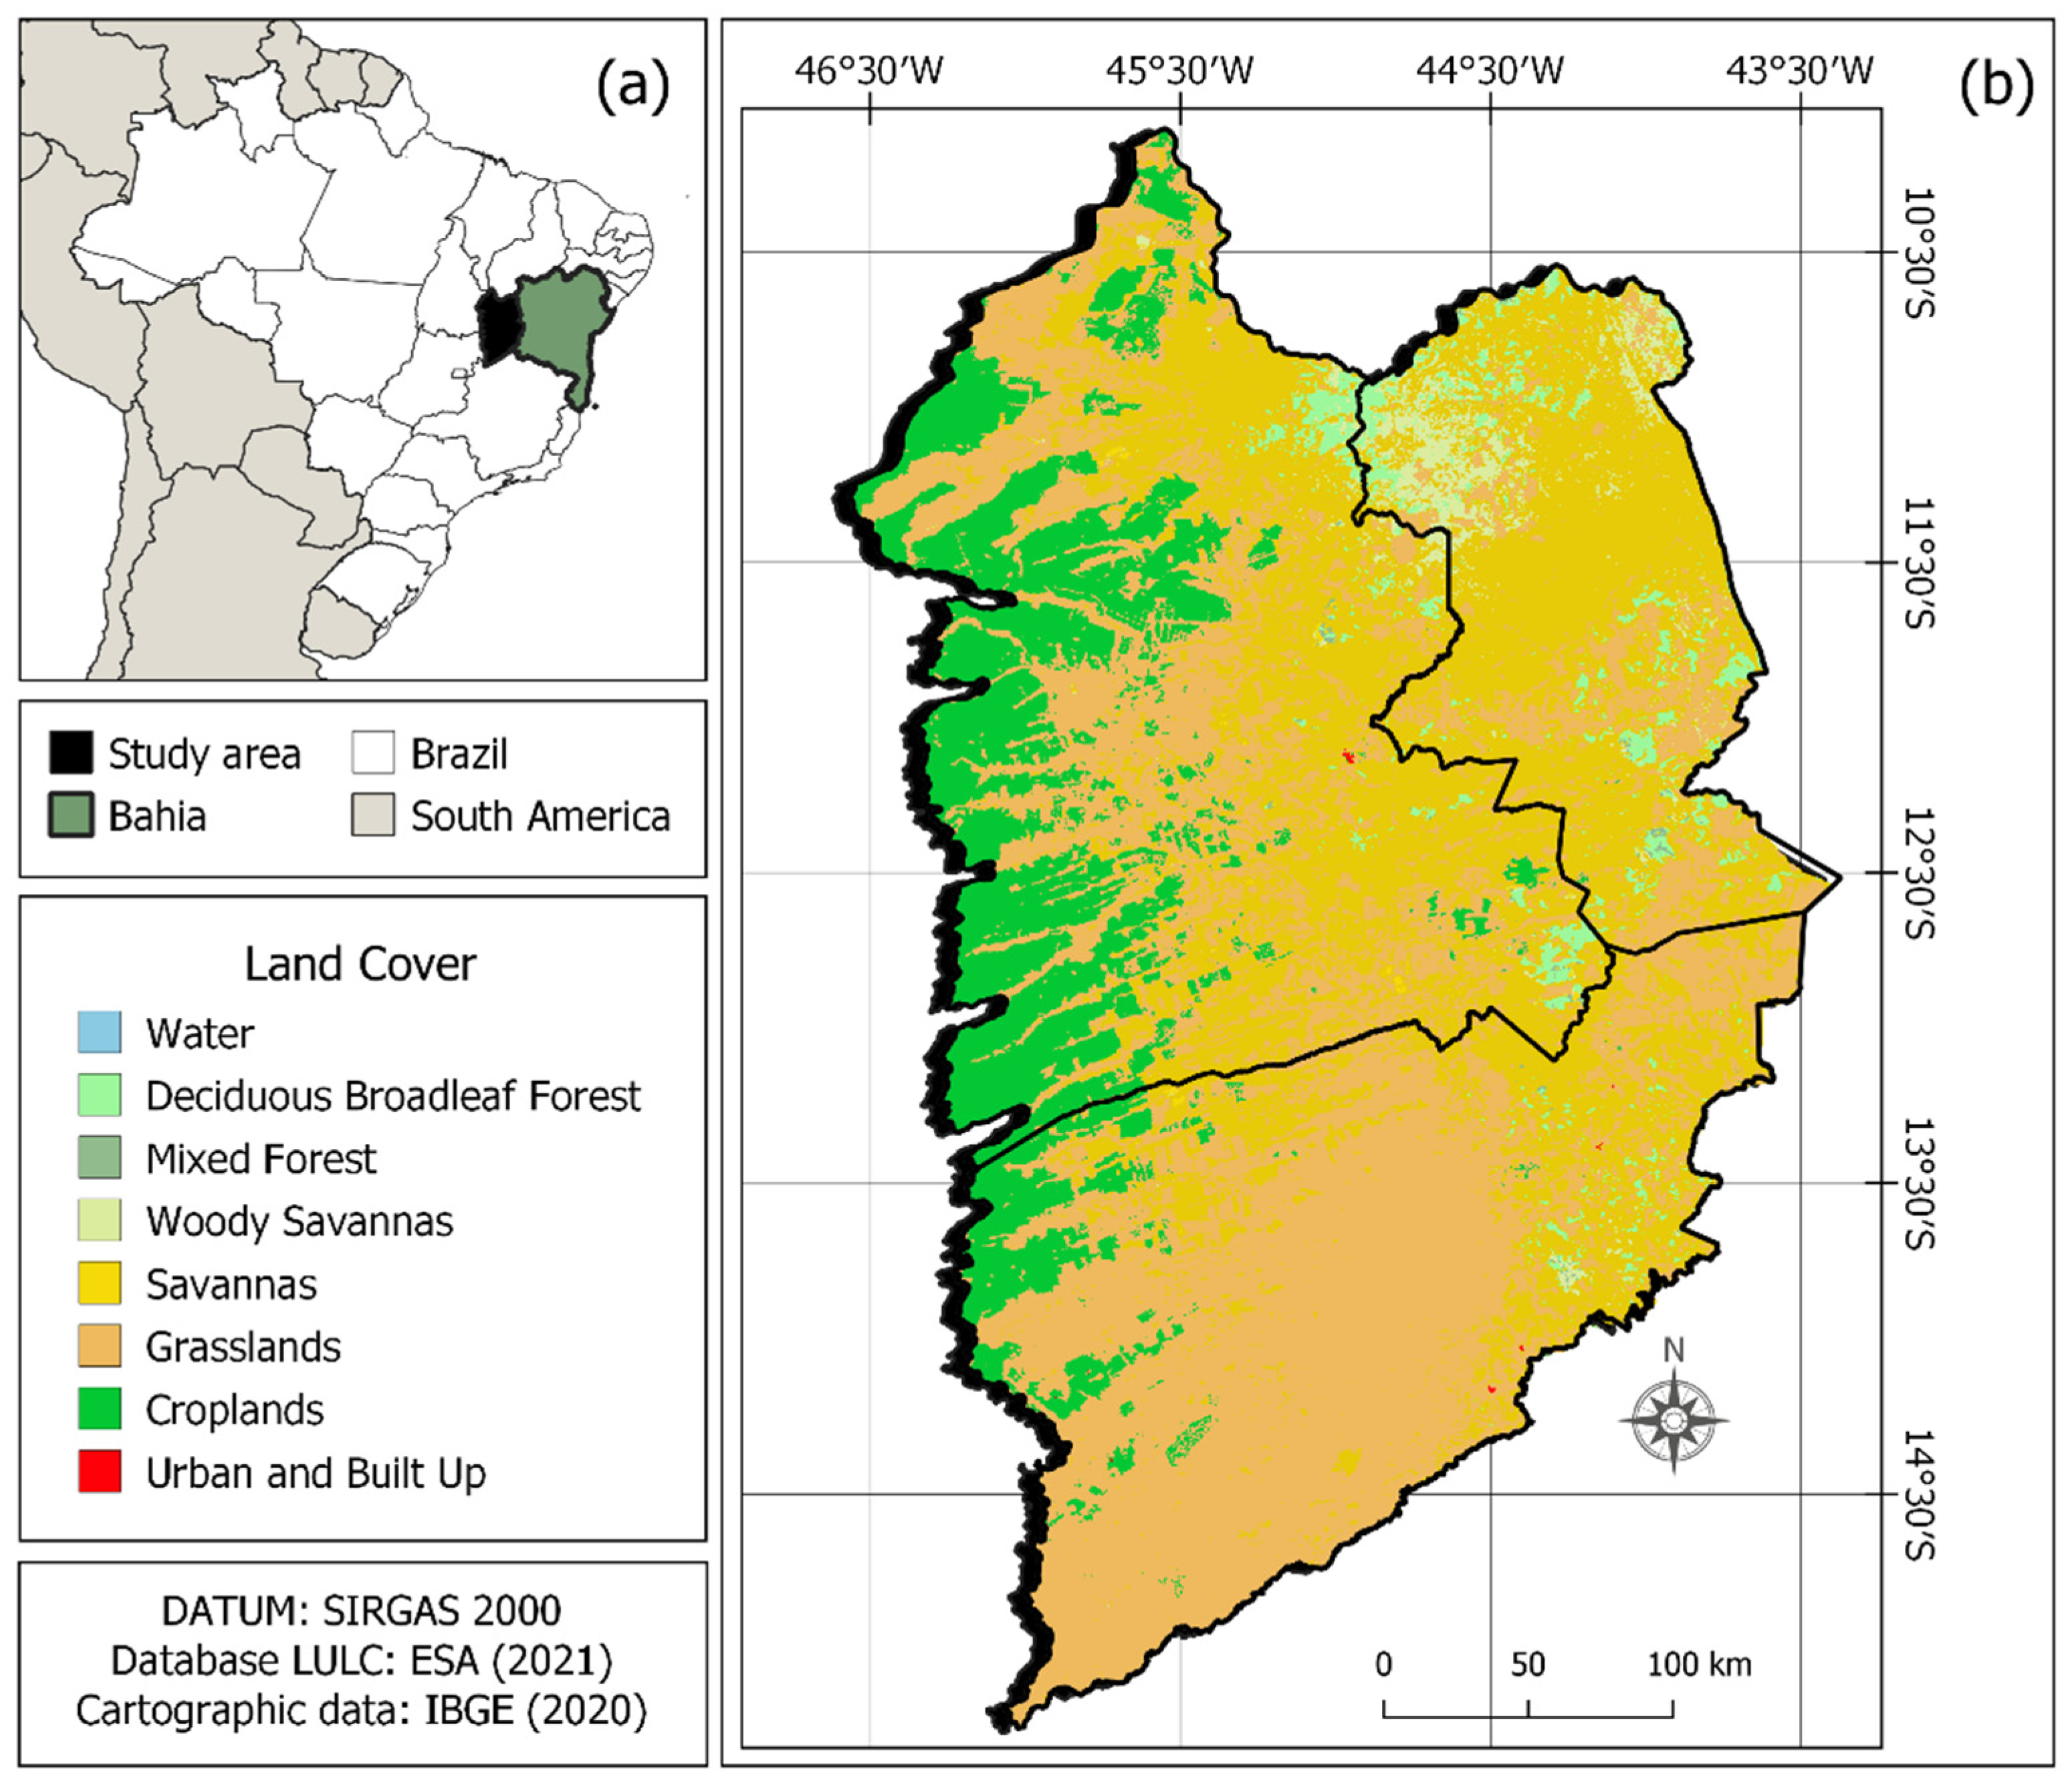
2.1. Study Area

The state of Bahia is divided into seven mesoregions: westernmost region of Bahia; São Francisco Valley of Bahia; north-central Bahia; northeast Bahia; Metropolitan region of Salvador; south-central Bahia; and south Bahia. In this work, we will focus on the westernmost region of Bahia (Figure 1), which is composed of three microregions (Barreiras, Cotegipe, and Santa Maria da Vitória) and 24 municipalities. Its total area is approximately 116,787 km2, corresponding to about 20% of the state territory [37]. The relief features are located at general altitudes of less than 500 m and may reach 1200 m [38]. Part of the vegetation in the westernmost region of Bahia is located in the Cerrado biome, which in Bahia comprises approximately 207 million hectares, equivalent to 24% of the national territory [38]. The climate of the region is characterized by two seasons: (i) rainy, between October and April, and (ii) dry, between May and September. The mean annual precipitation is 500–1500 mm, and the mean annual temperature ranges between 21.3 °C and 27.2 °C [39].
The soils are intemperate, deep, well-drained, have low natural fertility, and accentuate acidity. They rank in Latossoils, Concretionaries, Podzolic, Lithologic, Cambissoils, Purple Lands, Quartzous Sands, Hydromorphic Laterites, and Glaws [41]. Three important sub-basins, Grande to the north, Current in the center, and Carinhanha to the south, carry out the drainage of the hydrographic system to the San Francisco River, located east of the Chapadão. In addition, it constitutes a vast geographical region dominated by a gently sedimentary plateau dissected by perennial rivers draining into the San Francisco River [42].

2.2. Data

In order to analyze the WUE pattern, data were initially obtained from the 6th version of the Gross Primary Productivity (GPP, MOD17A2), Evapotranspiration (ET, MOD16A2), and Land Surface Temperature (LST, MOD11A2) products obtained from the Moderate Resolution Imaging Spectroradiometer (MODIS), with a spatial resolution of 0.05° × 0.05° obtained from the Earth Explorer website (available online: https://earthexplorer.usgs.gov, accessed on 10 July 2020). In addition, annual accumulated precipitation data for 2001–2019 was obtained from Climate Hazard Group InfraRed Precipitation with Station (CHIRPS) data. This product has been verified by authors such as [27,43] in northeastern Brazil, and [28] in the Brazilian Cerrado, with a spatial resolution of 0.05° × 0.05°, available online: https://data.chc.ucsb.edu/products/CHIRPS-2.0/, accessed on 10 July 2020. The extraction and manipulation of data and all calculations were performed using R version 3.6.3 [44] and Quantum GIS (QGIS) version 3.4.6 [45].

2.3. Methodology

2.3.1. Calculation of Water Use Efficiency (WUE)

In the methodology, the water use efficiency was calculated as the ratio between GPP and ET, according to Equation (1) [46,47].
WUE = GPP ET
where WUE is given in gC/mm·m2, GPP is given in grams of carbon per square meter (gC/m2), and ET is given in millimeters (mm).

2.3.2. Pearson Correlation Analysis

In the evaluation of interactions between environmental and meteorological variables, Pearson’s Correlation Analysis (AC) was applied, in order to identify the degree of association between the variables (Table 1)— [48].
r = i = 1 n ( x i   x ¯ ) ( y i   y ¯ ) [ i = 1 n ( x i   x ¯ ) 2 ] [ i = 1 n ( y i   y ¯ ) 2 ]

2.3.3. WUE Anomalies

The annual WUE anomalies were obtained based on the reference year value subtracted from the WUE mean from 2001 to 2019. Subsequently, to evaluate the anomalous WUE pattern on the interannual scale, ENSO events will be used based on the Oceanic Niño Index (ONI) [50]. These ENSO events are based on monthly sea surface temperature anomalies (SSTA) in the Pacific Equatorial Region known as Niño 3.4 region, according to Table 2. When the SSTA is greater than 0.5 °C, it is classified as El Niño (warm phase); when the sign is opposite, that is, a SSTA below −0.5 °C, it is classified as La Niña (cold phase) [21,51]. Therefore, eight years were selected for analysis based on the ONI pattern: (a) La Niña (2001, 2007, 2012, and 2016); (b) El Niño (2003, 2005, 2010, and 2019).

3. Results

3.1. Spatial Distribution of GPP, ET and WUE

In terms of the spatial mean distributions of GPP, ET, and WUE in 19 years (Figure 2), the maximum values are 580 gC/m2, 3000 mm, and 3.5 gC/mm·m2, respectively. Gross primary productivity values were mostly between 340 and 580 gC/m2 (Figure 2a), with the lowest values in the western part, on the border of the state of Bahia with the Tocantins (TO) (to the northwest-NW of the westernmost region of Bahia) and Goiás (GO) (to the southwest-SW of the westernmost region of Bahia). The mean ET values had a spatial distribution similar to that of GPP (Figure 2b), with the lowest values (≤1350 mm) in the western portion and a range of 1600 to 2100 mm.
The highest GPP (≌ 580 gC/m2) and ET (≌ 3000 mm) values were found in the central portion of the westernmost region of Bahia, towards the north. These areas have natural vegetation, which may have promoted the highest ET and GPP. Refs. [52,53] found that areas of dense vegetation and evergreen broadleaf forests had the highest annual total GPP.
Figure 2c shows the distribution of mean WUE values. There was an exception, an area of exposed soil in the SW portion with zero values highlighted in red. Values between 2.0 and 2.5 gC/mm·m2 were predominant. The highest values, between 3.0 and 3.5 gC/mm·m2, were observed in the western (W) and SW portions of the Santa Maria da Vitória microregion.

3.2. Meteorological Factors Associated with WUE Change

The following results refer to the descriptive statistics of the WUE, precipitation, and LST, shown in Table 3 and Figure 3. Significant differences in WUE were observed between the dry (Figure 3a) and rainy seasons (Figure 3d); in this case, the maximum, minimum, and mean values show variations of 1.33 gC/mm·m2, 0.45 gC/mm·m2, and 0.93 gC/mm·m2, respectively. This result indicates a possible influence of precipitation on these values since the mean total precipitation between the rainy and dry seasons differed by approximately 136 mm. The low precipitation in the dry season, associated with high temperatures (a difference of 4.2 °C between the dry and rainy seasons), stimulates biophysical processes, resulting in the highest WUE values in dry periods, as shown in Table 3.
Figure 3 displays the spatial variability of WUE during the dry and rainy seasons. During the dry season, the precipitation volume is less than 15 mm in the western portion, and, at the same time, there are temperatures between 30 °C and 35 °C resulting from the dry period. When combined, these conditions promote an increase in the amount of energy available in biophysical processes, contributing to higher WUE values (close to 4 gC/mm·m2), as seen in Figure 3a. However, in the rainy season, excess rain (Figure 3f) contributes to a decrease in temperatures (a decrease of approximately 5 °C in the maximum and minimum values). This behavior further interferes with the carbon absorption cycle and, consequently, WUE values (<2 gC/mm·m2, illustrated in Figure 3b). This interaction between WUE and temperature agrees with the results found by [54], who pointed out that increases in temperature and ET result in higher ecosystem productivity; that is, these climatic variations have a strong influence on the vegetation, and consequently, on WUE.
The influence of LST and precipitation on WUE can be seen in Figure 4. The averages of WUE, LST, and precipitation for the 19 years of study (2001 to 2019) were used for preparation. After the construction of the average images (WUE, LST, and precipitation), 220 random points were extracted referring to the study area (Figure 4a). Subsequently, the scatter plot and the calculation of Pearson’s correlation (r) were performed. When we look at Figure 4b, we can see the inverse relationship between the highest WUE values and the lowest precipitation values, confirmed by the moderate negative correlation (−0.57), emphasizing that as the volume of precipitation increases, there are decreases in the WUE values. The correlation between WUE and LST was high (0.66), implying higher WUE values as LST values increase. It is observed that the influence of these factors can explain the variation of WUE in rainy and dry periods through the coefficient of determination (R2), with 0.33 (precipitation) and 0.43 (LST). The low R2 values may be associated with the influence of other factors such as elevation and vegetation in addition to the randomness of the one-off values, affecting the variability of the explained variables.

3.3. Spatio-Temporal Distribution of WUE Anomalies

Figure 5 shows the temporal distribution of WUE anomalies, with positive and negative values predominating in the western portion of the entire study area. Ref. [55] mention that seasonal and interannual changes in weather conditions have strong impacts on WUE. The highest positive percentages occurred in El Niño years (dry years), mainly in 2003 (+51%), 2005 (+89%), 2010 (+72%), and 2019 (+66%). The action of El Niño in the NEB implied a regional reduction in precipitation [21,56] and thus intensified water stress and induced the process of adaptation or acclimation of crops, leading to the highest WUE value [57]. Ref. [58] highlighted that, under a certain level of water stress, plants could achieve higher productivity with the same amount of water lost by ET or the same productivity with a lower ET due to the increase in local WUE. On the other hand, during the La Niña years (wet years), namely 2001, 2007, 2012, and 2016, there was a reduction of 70%, 93%, 82%, and 96% in WUE values, respectively, due to the above-mean total precipitation [59,60]. Ref. [61] concluded that impacts on agriculture include reduced crop yields, increased pest and disease pressure, increased crop water demand, altered phenology of annual and perennial cropping systems, and uncertain future sustainability of some highly vulnerable crops. As a result of this effect, these areas occupied by crops are sensitive to climate change [62,63,64,65].

3.4. WUE Associated with Vegetation Types

Figure 6 exhibits the temporal variation of the WUE among the vegetation types between the years 2001 and 2019. The agriculture was superior to the remaining vegetation types, with maximum (minimum) values of 3.45 gC/mm·m2 (1.90 gC/mm·m2). The remaining vegetative types (Savanna, Pasture, and Forests) have maintained close temporal variation patterns (between 1.85 and 2.45 gC/mm·m2). The WUE is fully societal to the type of vegetation and the influence of climatic variations, such as the temperature and precipitation changes associated with the ENSO. Ref. [66] observed significant differences between the WUE of the different vegetation types, with values in agricultural areas of 2.03 gC/mm·m2 and forest areas of 2.28 gC/mm·m2. Meanwhile, the far westernmost region of Bahia has float areas with low densities [67], promoting lower WUE values.

4. Discussion

Land use changes in the westernmost region of Bahia are mainly related to agricultural expansion, and alter the rate of photosynthesis, water availability, and soil nutrient content [68]. Ref. [69] mention that the change in the mean annual WUE was mainly attributed to trends in human activities that may cause changes in land cover. The western portion of Bahia has been consolidated as the state’s largest area of agricultural expansion since 1980. Over thirty years (1985–2015), about 21.7 thousand km2 of the native vegetation of this area was converted into grain plantations, pastures, and other perennial crops [70]. This agricultural expansion implies adequate management of agricultural areas, resulting in a higher WUE. Ref. [71] found an improved crop WUE under drought when irrigation water was >60% or <40% of full irrigation water. Other possible contributing factors are good management practices, cultivar optimization, and irrigation, as they reduce the influence of the climate [72] and regulate the carbon–water balance more efficiently in agricultural areas.
The effects of WUE anomalies are related to environmental changes induced by the variability of environmental factors such as temperature, precipitation, and vegetation [73,74,75]. Thus, the phases of the ENSO mode of variability regulate precipitation availability (dry and rainy years), promoting periods of drought or excessive precipitation, ultimately modifying soil moisture, and significantly impacting the local carbon and water cycles [6,76]. In the NEB, ENSO events are associated with reductions in precipitation, high local temperatures (El Niño), and high volumes of precipitation (La Niña) [21,26,76,77]. Ref. [78] highlighted that excessive precipitation could cause negative impacts on the crop by causing nutrient leaching losses from the soil. Further, the presence of cloud cover reduces the amount of solar radiation incident on the ground and, consequently, the biophysical activity of the vegetation, prompting low WUE values. These anomalous WUE patterns result from major changes in local vegetation to meet the water needs of the respective biophysical processes. Ref. [79] assessed the interaction between vegetation growth and water vapor from ENSO variations over seven geographic regions of Mainland China. The authors found positive (negative) vegetation variations during El Niño (La Niña) periods and high correlation coefficients between vegetation and precipitation in some regions during ENSO variations, implying a change in the WUE of the vegetation. Ref. [79] assessed the correlation between vegetation and ENSO via principal component analysis (PCA) and found a strong relationship in some regions of Africa [80]. Ref. [81] pointed out that ENSO events affected vegetation in a long-term trend, highlighting weather and climate variations, changes in vegetation patterns, and the local WUE.

5. Conclusions

The special variability of the WUE and its components (GPP and ET) explained why the highest GPP (≌ 580 gC/m2) and ETP ((≌ 3000 mm)) values occurred in the central portion of the former westernmost Baiano towards the north, where they have native areas. The variations in the climate affected the WUE values in the study area, mainly in agricultural areas, and may be associated with good management that promotes better carbon–water balance. Whereas for the ENSO influence, the highest WUE values (3.45 gC/mm·m2) were during the warm phase (El Niño), with additions of 51% to 89% in vegetation, resulting from water stress conditioning vegetation adaptation, and maintaining the carbon–water balance in a more efficient manner in contrast to the La Niña years, which promoted decreased vegetation. This was due to interference in the absorption of radiation and nutrients for the biophysical processes related to excess precipitation, which resulted in the biophysical processes and thus the lower WUE values. As agriculture reveals existing potentials and difficulties in each region and, as a result, the need to consider these specificities when considering contributing to the development of these regions, information about how precipitation and LST variations associated with WUE assist in decision-making for the purpose of water management is achieved by obtaining better results. In this way, the importance of the use of WUE measures in agriculture, especially in Brazil, is emphasized, as agriculture is the main economic primary production. This makes the application of new tools for monitoring production indispensable.

Author Contributions

D.d.B.S.: Conceptualization; formal analysis; investigation; methodology; writing—original draft. H.A.B.: Writing—review and editing. W.L.F.C.F.: Writing—review and editing. J.F.d.O.-J.: Writing—review and editing. F.P.-T.: Editing. C.d.O.B.: Editing. All authors have read and agreed to the published version of the manuscript.

Funding

This work was supported by the Conselho Nacional de Desenvolvimento Científico e Tecnológico-(CNPq/MCTI/FNDCT N° 18/2021), Brazil, through Universal—Programa de Monitoramento da Desertificação por Satélite no Semiárido Brasileiro, under the Grant/Award Number (403223/2021-0 to H.A.B).

Acknowledgments

The first author thanks the Coordination for the Improvement of Higher Education Personnel (CAPES) for granting the doctoral scholarship. The second author thanks CNPq for granting the Research Productivity Fellowship level 1-D (317633/2021-0). The fourth author thanks CNPq for granting the Research Productivity Fellowship level 2 (309681/2019-7).

Conflicts of Interest

The authors declare no conflict of interest.

References

  1. Gu, Z.; Duan, X.; Shi, Y.; Li, Y.; Pan, X. Spatiotemporal variation in vegetation coverage and its response to climatic factors in the Red River Basin, China. Ecol. Indic. 2018, 93, 54–64. [Google Scholar] [CrossRef]
  2. Raza, A.; Razzaq, A.; Mehmood, S.S.; Zou, X.; Zhang, X.; Lv, Y.; Xu, J. Impact of climate change on crops adaptation and strategies to tackle its outcome: A review. Plants 2019, 8, 34. [Google Scholar] [CrossRef] [PubMed] [Green Version]
  3. Thonfeld, F.; Steinbach, S.; Muro, J.; Hentze, K.; Games, I.; Näschen, K.; Kauzeni, P.F. The impact of anthropogenic land use change on the protected areas of the Kilombero catchment, Tanzania. ISPRS J. Photogramm. Remote Sens. 2020, 168, 41–55. [Google Scholar] [CrossRef]
  4. Zhang, F.; Ju, W.; Shen, S.; Wang, S.; Yu, G.; Han, S. How recent climate change influences water use efficiency in East Asia. Theor. Appl. Climatol. 2014, 116, 359–370. [Google Scholar] [CrossRef]
  5. Yuan, F.; Liu, J.; Zuo, Y.; Guo, Z.; Wang, N.; Song, C.; Wang, Z.; Sun, L.; Guo, Y.; Song, Y.; et al. Rising vegetation activity dominates growing water use efficiency in the Asian permafrost region from 1900 to 2100. Sci. Total Environ. 2020, 736, 139587. [Google Scholar] [CrossRef] [PubMed]
  6. Barros Santiago, D.; Barbosa, H.A.; Correia Filho, W.L.F. Alterações na eficiência do uso da água relacionadas com fatores climáticos e uso e ocupação do solo, na região do MATOPIBA. Res. Soc. Dev. 2021, 10, e3010917891. [Google Scholar] [CrossRef]
  7. Xue, B.L.; Guo, Q.; Otto, A.; Xiao, J.; Tao, S.; Li, L. Global patterns, trends, and drivers of water use efficiency from 2000 to 2013. Ecosphere 2015, 6, 1–18. [Google Scholar] [CrossRef]
  8. Wu, J.; Guan, K.; Hayek, M.; Restrepo-Coupe, N.; Wiedemann, K.T.; Xu, X.; Wehr, R.; Christoffersen, B.O.; Miao, G.; da Silva, R.; et al. Partitioning controls on Amazon forest photosynthesis between environmental and biotic factors at hourly to interannual timescales. Glob. Chang. Biol. 2017, 23, 1240–1257. [Google Scholar] [CrossRef]
  9. de Oliveira, G.; Brunsell, N.A.; Moraes, E.C.; Shimabukuro, Y.E.; Bertani, G.; dos Santos, T.V.; Aragao, L.E. Evaluation of MODIS-based estimates of water-use efficiency in Amazonia. Int. J. Remote Sens. 2017, 38, 5291–5309. [Google Scholar] [CrossRef]
  10. Sani, B.M.; Oluwasemire, K.O.; Mohammed, H.I. Effect of irrigation and plant density on the growth, yield and water use efficiency of early maize in the Nigerian Savanna. J. Agric. Biol. Sci. 2008, 3, 2008. [Google Scholar]
  11. Tang, X.; Li, H.; Desai, A.R.; Nagy, Z.; Luo, J.; Kolb, T.E.; Olioso, A.; Xu, X.; Yao, L.; Kutsch, W.; et al. How Is Water-Use Efficiency of Terrestrial Ecosystems Distributed And Changing On Earth? Sci. Rep. 2015, 4, 7483. [Google Scholar] [CrossRef] [PubMed] [Green Version]
  12. Law, B.E.; Falge, E.; Gu, L.V.; Baldocchi, D.D.; Bakwin, P.; Berbigier, P.; Davis, K.; Dolman, A.J.; Falk, M.; Fuentes, J.D.; et al. Environmental Controls Over Carbon Dioxide and Water Vapor Exchange of Terrestrial Vegetation. Agric. For. Meteorol. 2002, 113, 97–120. [Google Scholar] [CrossRef] [Green Version]
  13. Almeida, C.T.; Delgado, R.C.; Galvão, L.S.; Aragão, E.O.C.L.; Ramos, M.C. Improvements Of The MODIS Gross Primary Productivity Model Based On A Comprehensive Uncertainty Assessment Over The Brazilian Amazonia. ISPRS J. Photogramm. Remote Sens. 2018, 145, 268–283. [Google Scholar] [CrossRef]
  14. Chagas, M.C.; Delgado, R.C.; Souza, L.P.; Carvalho, D.C.; Pereira, M.G.; Teodoro, P.E.; Silva Junior, C.A. Gross primary productivity in areas of different land cover in the western Brazilian Amazon. Remote Sens. Appl. Soc. Environ. 2019, 16, 100259. [Google Scholar] [CrossRef]
  15. Fu, Z.; Ciais, P.; Bastos, A.; Stoy, P.C.; Yang, H.; Green, J.K.; Wang, B.; Yu, K.; Huang, Y.; Knohl, A.; et al. Sensitivity Of Gross Primary Productivity to Climatic Drivers During The Summer Drought of 2018 In Europe. Phil. Trans. R. Soc. B 2020, 375, 20190747. [Google Scholar] [CrossRef]
  16. Correia Filho, W.L.F.; Santos, T.V.; Santiago, D.B.; de Oliveira-Júnior, J.F.; Amorim, R.F.C. Influence of meteorological variables on reference Evapotranspiration in the State of Alagoas, Brazil, based on multivariate analysis. Model. Earth Syst. Environ. 2020, 7, 2215–2224. [Google Scholar] [CrossRef]
  17. Niu, S.; Xing, X.; Zhang, Z.H.E.; Xia, J.; Zhou, X.; Song, B.; Li, L.; Wan, S. Water-use efficiency in response to climate change: From leaf to ecosystem in a temperate steppe. Glob. Chang. Biol. 2011, 17, 1073–1082. [Google Scholar] [CrossRef]
  18. Collados-Lara, A.J.; Fassnacht, S.R.; Pulido-Velazquez, D.; Pfohl, A.K.; Morán-Tejeda, E.; Venable, N.B.; Puntenney-Desmond, K. Intra-day variability of temperature and its near-surface gradient with elevation over mountainous terrain: Comparing MODIS land surface temperature data with coarse and fine scale near-surface measurements. Int. J. Climatol. 2021, 41, E1435–E1449. [Google Scholar] [CrossRef]
  19. Chang, X.; Wang, Z.; Wei, F.; Xiao, P.; Shen, Z.; Lv, X.; Shi, Y. Determining the Contributions of Vegetation and Climate Change to Ecosystem WUE Variation over the Last Two Decades on the Loess Plateau, China. Forests 2021, 12, 1442. [Google Scholar] [CrossRef]
  20. Quan, Q.; Zhang, F.; Tian, D.; Zhou, Q.; Wang, L.; Niu, S. Transpiration dominates ecosystem water-use efficiency in response to warming in an alpine meadow. J. Geophys. Res. Biogeosci. 2018, 123, 453–462. [Google Scholar] [CrossRef] [Green Version]
  21. Correia Filho, W.L.F.; Oliveira-Júnior, J.F.; Santiago, D.B.; Terassi, P.M.B.; Teodoro, P.E.; Gois, G.; Blanco, C.J.C.; Souza, P.H.A.; Costa, M.; Santos, P.J. Rainfall variability in the Brazilian northeast biomes and their interactions with meteorological systems and ENSO via CHELSA product. Big Earth Data 2019, 3, 315–337. [Google Scholar] [CrossRef]
  22. Medeiros, F.J.; de Oliveira, C.P. Dynamical Aspects of the Recent Strong El Niño Events and Its Climate Impacts in Northeast Brazil. Pure Appl. Geophys. 2021, 178, 2315–2332. [Google Scholar] [CrossRef]
  23. Lyra, G.B.; Oliveira-Júnior, J.F.; Gois, G.; Cunha-Zeri, G.; Zeri, M. Rainfall variability over Alagoas under the influences of SST anomalies. Meteorol. Atmos. Phys. 2017, 129, 157–171. [Google Scholar] [CrossRef]
  24. Costa, M.S.; Oliveira-Júnior, J.F.; Santos, P.J.; Correia Filho, W.L.F.; Blanco, C.J.C.; Teodoro, P.E.; Silva Junior, C.A.; Santiago, D.B.; Souza, E.O.; Jardim, A.M.R.F. Rainfall extremes and drought in Northeast Brazil and its relationship with El Niño-Southern Oscillation. Int. J. Climatol. 2021, 41, E2111–E2135. [Google Scholar] [CrossRef]
  25. Kayano, M.T.; Andreoli, R.V.; Souza, R.A.F. Relations between ENSO and the South Atlantic SST modes and their effects on the South American rainfall. Int. J. Climatol. 2013, 33, 2008–2023. [Google Scholar] [CrossRef]
  26. Marengo, J.A.; Cunha, A.P.; Alves, L.M. A seca de 2012-15 no semiárido do Nordeste do Brasil no contexto histórico. Climanálise 2016, 3, 1–6. [Google Scholar]
  27. Oliveira-Júnior, J.F.; da Silva Junior, C.A.; Teodoro, P.E.; Rossi, F.S.; Blanco, C.J.C.; Lima, M.; Gois, G.; Correia Filho, W.L.F.; Santiago, D.B.; Vanderley, M.H.G.D.S. Confronting CHIRPS dataset and in situ stations in the detection of wet and drought conditions in the Brazilian Midwest. Int. J. Climatol. 2021, 41, 4478–4493. [Google Scholar] [CrossRef]
  28. Correia Filho, W.L.F.; de Oliveira-Júnior, J.F.; da Silva Junior, C.A.; Santiago, D.D.B. Influence of the El Niño–Southern Oscillation and the sypnotic systems on the rainfall variability over the Brazilian Cerrado via Climate Hazard Group InfraRed Precipitation with Station data. Int. J. Climatol. 2021, 42, 3308–3322. [Google Scholar] [CrossRef]
  29. Chaves, M.M.; Costa, J.M.; Saibo, N.J.M. Recent advances in photosynthesis under drought and salinity. Adv. Bot. Res. 2011, 57, 49–104. [Google Scholar]
  30. Khalid, M.F.; Hussain, S.; Ahmad, S.; Ejaz, S.; Zakir, I.; Ali, M.A.; Ahmed, M.; Anjum, M.A. Impacts of abiotic stresses on growth and development of plants. In Plant Tolerance to Environmental Stress; CRC Press: Boca Raton, FL, USA, 2019; pp. 1–8. [Google Scholar]
  31. Paiva, R.; Oliveira, L.M. Fisiologia E Produção Vegetal; UFLA: Minas Gerais, Brazil, 2006; Volume 1, 104p. [Google Scholar]
  32. Hatfield, J.L.; Wright-Morton, L.; Hall, B. Vulnerabilidade de lavouras de grãos e lavouras do Centro-Oeste à variabilidade climática e estratégias de adaptação. Clim. Altere 2018, 146, 263–275. [Google Scholar] [CrossRef] [Green Version]
  33. Kramer, P.J.; Boyer, J.S. Water Relations of Plants And Soils; Academic Press: New York, NY, USA, 1995. [Google Scholar]
  34. Salehi-Lisar, S.Y.; Bakhshayeshan-Agdam, H. Drought stress in plants: Causes, consequences, and tolerance. In Drought Stress Tolerance in Plants; Springer: Cham, Switzerland, 2016; Volume 1, pp. 1–16. [Google Scholar]
  35. Mondardo, M.L. Da migração sulista ao novo arranjo territorial no Oeste Baiano: “territorialização” do capital no campo e paradoxos na configuração da cidade do agronegócio. Campo Território 2010, 5, 259–287. [Google Scholar]
  36. Souza Barbosa, A.; dos Santos, G.B.; Dias, E.S.; da Silva Siqueira, E.; da Silva, J.R.; Barbosa, V.D. Principais fatores condicionantes da formação e implicações para uso de Cambissolos em São Desidério, Oeste da Bahia. Rev. Espinhaço 2018, 40, 322–333. [Google Scholar] [CrossRef]
  37. Fernandes, R.C.; Lobão, J.S.B.; Vale, R.D.M.C. Oeste baiano: Da agricultura familiar à agroindústria. Encontro De Geógrafos Da América Lat. 2009, 12, 13. [Google Scholar]
  38. Batistella, M.; Guimarães, M.; de Miranda, E.E.; Vieira, H.R.; Valladares, G.S.; Mangabeira, J.; de Assis, M.C. Monitoramento da expansão agropecuária na Região Oeste da Bahia. Embrapa Territ. -Doc. (INFOTECA-E) 2002, 20, 41. [Google Scholar]
  39. Leivas, J.F.; de Castro Teixeira, A.H.; Takemura, C.M.; Garçon, E.A.M. Indicadores agrometeorológicos espectrais em áreas irrigadas no Oeste da Bahia. Braz. J. Anim. Environ. Res. 2021, 4, 789–797. [Google Scholar] [CrossRef]
  40. ESA—European Space Agency. Climate Change Initiative, Land Cover Maps—v2.0.7, Land Covers Maps 2000 and 2015. 2021. Available online: https://climate.esa.int/en/projects/land-cover/data/ (accessed on 1 March 2021).
  41. Do Nascimento Lopes, E.R.; Reuss-Strenzel, G.M. Geoprocessamento Aplicado À Caracterização Da Ocupação De Unidades De Conservação–Um Olhar Sobre A Área De Proteção Ambiental De Guaibim, Bahia, Brasil. Rev. De Geogr. (Ufpe) 2015, 32. [Google Scholar]
  42. Pimentel, M.L.; Turetta, A.P.D.; Távora, G.S.G. Mudanças de uso da terra e expansão da agricultura no Oeste da Bahia. In Congresso Brasileiro de Ciência do Solo, 33, Uberlândia; Solos nos Biomas Brasileiros: Sustentabilidade e Mudanças Climáticas: Anais; SBCS; UFU; ICIAG: Uberlândia, Brazil, 2011; 1 CD-ROM. [Google Scholar]
  43. Funk, C.; Petterson, P.; Landsfeld, M.; Pedreros, D.; Verdin, J.; Shukla, S.; Husak, G.; Rowland, J.; Harrison, L.; Hoell, A.; et al. The Climate Hazards Infrared Precipitation With Record For Monitoring Extremes. Sci. Data 2015, 2, 10–66. [Google Scholar] [CrossRef]
  44. R Development Core Team. R: A Language And Environment For Statistical Computing; R Foundation for Statistical Computing: Vienna, Austria, 2020. [Google Scholar]
  45. QGIS—Quantum Geographic Information System. Quantum GIS Geographic Information System, Version 3.4-6; Open Source Geospatial Foundation Project: Beaverton, OR, USA, 2019. [Google Scholar]
  46. Diaz, M.B.; Roberti, D.R.; Carneiro, J.V.; de Arruda Souza, V.; de Moraes, O.L.L. Dynamics of the superficial fluxes over a flooded rice paddy in southern Brazil. Agric. For. Meteorol. 2019, 276–277, 107650. [Google Scholar] [CrossRef]
  47. Wang, D.; Zhan, Y.; Yu, T.; Liu, Y.; Jin, X.; Ren, X.; Chen, X.; Liu, Q. Improving Meteorological Input for Surface Energy Balance System Utilizing Mesoscale Weather Research and Forecasting Model for Estimating Daily Actual Evapotranspiration. Water 2020, 12, 9. [Google Scholar] [CrossRef] [Green Version]
  48. Mukaka, M.M. A guide to appropriate use of correlation coefficient in medical research. Malawi Med. J. 2012, 24, 69–71. [Google Scholar]
  49. Bisquerra, R.; Sarriera, J.C.; Martinéz, F. Introdução à Estatística: Enfoque Informático com o Pacote Estatístico SPSS; Murad, F., Translator; Artmed: Porto Alegre, Brazil, 2004. [Google Scholar]
  50. Huang, M.; Piao, S.; Zeng, Z.; Peng, S.; Ciais, P.; Cheng, L.; Mao, J.; Poulter, B.; Shi, X.; Yao, Y.; et al. Seasonal responses of terrestrial ecosystem water-use efficiency to climate change. Glob. Chang. Biol. 2016, 22, 2165–2177. [Google Scholar] [CrossRef] [PubMed]
  51. Matzenauer, R.; Radin, B.; Maluf, J.R.T. O fenômeno ENOS e o regime de chuvas no Rio Grande do Sul. Agrometeoros 2017, 25, 323–331. [Google Scholar] [CrossRef] [Green Version]
  52. Frankenberg, C.; Fisher, J.B.; Worden, J.; Badgley, G.; Saatchi, S.S.; Lee, J.E.; Toon, G.C.; Butz, A.; Jung, M.; Kuze, A.; et al. New global observations of the terrestrial carbon cycle from GOSAT: Patterns of plant fluorescence with gross primary productivity. Geophys. Res. Lett. 2011, 38. [Google Scholar] [CrossRef] [Green Version]
  53. Ma, J.; Xiao, X.; Zhang, Y.; Doughty, R.; Chen, B.; Zhao, B. Spatial-temporal consistency between gross primary productivity and solar-induced chlorophyll fluorescence of vegetation in China during 2007–2014. Sci. Total Environ. 2018, 639, 1241–1253. [Google Scholar] [CrossRef] [PubMed]
  54. Xiao, J.; Zhou, Y.; Zhang, L. Contributions of natural and human factors to increases in vegetation productivity in China. Ecosphere 2015, 6, 1–20. [Google Scholar] [CrossRef]
  55. Ponce-Campos, G.E.; Moran, M.S.; Huete, A.; Zhang, Y.; Bresloff, C.; Huxman, T.E.; Eamus, D.; Bosch, D.D.; Buda, A.R.; Gunter, S.A.; et al. Ecosystem resilience despite large-scale altered hydroclimatic conditions. Nature 2013, 494, 349–352. [Google Scholar] [CrossRef]
  56. Fontes Silva, G.M.; Zanchi, F.B.; da Silva, J.B.L.; Cordeiro, M.E. Disponibilidade Hídrica de uma Bacia Hidrográfica no Sul da Bahia. Revista Brasileira de Geografia Física 2021, 14, 1597–1611. [Google Scholar] [CrossRef]
  57. Bhargava, S.; Sawant, K. Drought stress adaptation: Metabolic adjustment and regulation of gene expression. Plant Breed. 2013, 132, 21–32. [Google Scholar] [CrossRef]
  58. Zhao, J.; Xu, T.; Xiao, J.; Liu, S.; Mao, K.; Song, L.; Yao, Y.; He, X.; Feng, H. Responses of Water Use Efficiency to Drought in Southwest China. Remote Sens. 2020, 12, 199. [Google Scholar] [CrossRef] [Green Version]
  59. Lizumi, T.; Luo, J.J.; Challinor, A.J.; Sakurai, G.; Yokozawa, M.; Sakuma, H.; Brown, M.E.; Yamagata, T. Impacts of El Niño southern oscillation on the global yields of major crops. Nat. Commun. 2014, 5, 3712. [Google Scholar]
  60. Santiago, D.B.; Barbosa, H.A.; Correia Filho, W.L.F.; Oliveira-Júnior, J.F. Interactions of Environmental Variables and Water Use Efficiency in the Matopiba Region via Multivariate Analysis. Sustainability 2022, 14, 8758. [Google Scholar] [CrossRef]
  61. Pathak, T.B.; Maskey, M.L.; Dahlberg, J.A.; Kearns, F.; Bali, K.M.; Zaccaria, D. Climate change trends and impacts on California agriculture: A detailed review. Agronomy 2018, 8, 25. [Google Scholar] [CrossRef] [Green Version]
  62. Schauberger, B.; Archontoulis, S.; Arneth, A.; Balkovic, J.; Ciais, P.; Deryng, D.; Elliott, J.; Folberth, C.; Khabarov, N.; Müller, C.; et al. Consistent negative response of US crops to high temperatures in observations and crop models. Nat. Commun. 2017, 8, 13931. [Google Scholar] [CrossRef] [PubMed] [Green Version]
  63. Kukal, M.S.; Irmak, S. Climate-driven crop yield and yield variability and climate change impacts on the US Great Plains agricultural production. Sci. Rep. 2018, 8, 3450. [Google Scholar] [CrossRef] [PubMed] [Green Version]
  64. Aryal, J.P.; Sapkota, T.B.; Khurana, R.; Khatri-Chhetri, A.; Rahut, D.B.; Jat, M.L. Climate change and agriculture in South Asia: Adaptation options in smallholder production systems. Environ. Dev. Sustain. 2020, 22, 5045–5075. [Google Scholar] [CrossRef] [Green Version]
  65. Cintra, P.H.N.; De Melo, O.F.P.; de Menezes, J.O.S. Produção agrícola: Uma revisão bibliográfica sobre as mudanças climáticas e produtividade de plantas graníferas no brasil. Rev. Agrotecnologia Ipameri 2020, 11, 2179–5959. [Google Scholar]
  66. Zhu, X.J.; Yu, G.R.; Wang, Q.F.; Hu, Z.M.; Zheng, H.; Li, S.G.; Sun, X.M.; Zhang, Y.P.; Yan, J.H.; Wang, H.M.; et al. Spatial variability of water use efficiency in China’s terrestrial ecosystems. Glob. Planet. Chang. 2015, 129, 37–44. [Google Scholar] [CrossRef]
  67. Lumbreras, J.F.; Carvalho Filho, A.D.; da Motta, P.E.F.; Barros, A.H.C.; Aglio, M.L.D.; Dart, R.D.O.; da Silveira, H.L.F.; Quartaroli, C.F.; de Almeida, R.E.M.; de Freitas, P.L. Aptidão Agrícola Das Terras Do Matopiba. Embrapa Solos-Doc. (INFOTECA-E) 2015, 48. [Google Scholar]
  68. Sterling, S.M.; Ducharne, A.; Polcher, J. The impact of global land-cover change on the terrestrial water cycle. Nat. Clim. Chang. 2013, 3, 385–390. [Google Scholar] [CrossRef]
  69. Guo, L.; Shan, N.; Zhang, Y.; Sun, F.; Liu, W.; Shi, Z.; Zhang, Q. Separating the effects of climate change and human activity on water use efficiency over the Beijing-Tianjin Sand Source Region of China. Sci. Total Environ. 2019, 690, 584–595. [Google Scholar] [CrossRef]
  70. Ferreira, A.B.R.; Pereira, G.; Fonseca, B.M.; da Silva Cardozo, F. As Mudanças No Uso E Cobertura Da Terra Na Região Oeste Da Bahia A Partir Da Expansão Agrícola. Formação 2021, 28. [Google Scholar] [CrossRef]
  71. Yu, L.; Zhao, X.; Gao, X.; Jia, R.; Yang, M.; Yang, X.; Wu, Y.; Siddique, K.H. Effect of natural factors and management practices on agricultural water use efficiency under drought: A meta-analysis of global drylands. J. Hydrol. 2021, 594, 125977. [Google Scholar] [CrossRef]
  72. Davies, W.J.; Zhang, J.; Yang, J.; Dodd, I.C. Novel crop science to improve yield and resource use efficiency in water-limited agriculture. J. Agric. Sci. 2011, 149, 123–131. [Google Scholar] [CrossRef]
  73. Zhu, Q.; Jiang, H.; Peng, C.; Liu, J.; Wei, X.; Fang, X.; Liu, S.; Zhou, G.; Yu, S. Evaluating the effects of future climate change and elevated CO2 on the water use efficiency in terrestrial ecosystems of China. Ecol. Model. 2011, 222, 2414–2429. [Google Scholar] [CrossRef]
  74. Assis, M.V.; de Mattos, E.A. Vulnerabilidade da vegetação de campos de altitude às mudanças climáticas. Oecologia Aust. 2016, 20, 24–36. [Google Scholar] [CrossRef]
  75. Wang, M.; Ding, Z.; Wu, C.; Song, L.; Ma, M.; Yu, P.; Lu, B.; Tang, X. Divergent responses of ecosystem water-use efficiency to extreme seasonal droughts in Southwest China. Sci. Total Environ. 2021, 760, 143427. [Google Scholar] [CrossRef] [PubMed]
  76. De Melo, J.C. O fenômeno El Niño e as secas no Nordeste do Brasil. Raízes Rev. De Ciências Sociais E Econômicas 1999, 13–21. [Google Scholar] [CrossRef]
  77. Freire, J.L.M.; Lima, J.R.A.; Cavalcanti, E.P. Análise de aspectos meteorológicos sobre o Nordeste do Brasil em anos de El Niño e La Niña. Revista Brasileira de Geografia Física 2011, 3, 429–444. [Google Scholar] [CrossRef] [Green Version]
  78. Pyrgou, A.; Santamouris, M.; Livada, I. Spatiotemporal analysis of diurnal temperature range: Effect of urbanization, cloud cover, solar radiation, and precipitation. Climate 2019, 7, 89. [Google Scholar] [CrossRef] [Green Version]
  79. Zhao, Q.; Ma, X.; Yao, W.; Liu, Y.; Yao, Y. Anomaly variation of vegetation and its influencing factors in mainland China during ENSO period. IEEE Access 2019, 8, 721–734. [Google Scholar] [CrossRef]
  80. Anyamba, A.; Tucker, C.J.; Eastman, J.R. NDVI anomaly patterns over Africa during the 1997/98 ENSO warm event. Int. J. Remote Sens. 2001, 22, 1847–1860. [Google Scholar]
  81. Nagai, S.; Ichii, K.; Morimoto, H. Interannual variations in vegetation activities and climate variability caused by ENSO in tropical rainforests. Int. J. Remote Sens. 2007, 28, 1285–1297. [Google Scholar] [CrossRef]
Figure 1. Geographic location of the study area—westernmost region of Bahia (a), and Land Cover (b), respectively. Land Cover data source: ESA [40].
Sustainability 14 16004 g001
Figure 2. Mean spatial distribution of (a) GPP (gC/m2), (b) ET (mm) and (c) WUE (gC/mm·m2) along the years 2001 and 2019.
Sustainability 14 16004 g002
Figure 3. Spatial variation of WUE (gC/mm·m2), LST (°C) and Precipitation (mm) in the dry and rainy seasons. (a) WUE dry, (b) LST dry, (c) Precipitation dry, (d) WUE rainy, (e) LST rainy and (f) Precipitation rainy. Average monthly data between the years 2001 and 2019 were used.
Sustainability 14 16004 g003
Figure 4. (a) Random points were extracted referring to the study area, (b) Correlation between WUE-LST (land surface temperature) and WUE-PRP (Precipitation).
Sustainability 14 16004 g004
Figure 5. Spatio-temporal distribution of WUE (gC/mm·m2) anomalies between the years (a) 2003, (b) 2005, (c) 2010, (d) 2019, (e) 2001, (f) 2007, (g) 2012 and (h) 2016.
Sustainability 14 16004 g005
Figure 6. Temporal variation of WUE in vegetation types between the years 2001 and 2019.
Sustainability 14 16004 g006
Table 1. Classification of Pearson’s Correlation coefficients.
CoefficientsInterpretation
1.00 (−1.00)Perfect positive (negative) correlation
0.80 (−0.80) ≤ r ≤ 1.00 (−1.00)Very high positive (negative) correlation
0.60 (−0.60) ≤ r ≤ 0.80 (−0.80)High positive (negative) correlation
0.40 (−0.40) ≤ r ≤ 0.60 (−0.60)Moderate positive (negative) correlation
0.20 (−0.20) ≤ r ≤ 0.40 (−0.40)Low positive (negative) correlation
0 ≤ r ≤ 0.20 (−0.20)Very low positive (negative) correlation
0Null correlation
Source: Bisquerra; Sarriera & Martínez [49].
Table 2. ENSO events of moderate and intense intensity (SSTA +/− 0.5 °C) for the period 1979–2017 Correia Filho et al. [21].
EventsYears
El Niño2002–2003, 2006–2007, 2009–2010, 2015–2016, 2018–2019
La Niña1999–2001, 2005–2006, 2007–2009, 2010–2012, 2017–2018
Source: Adapted from Correia Filho et al. [21].
Table 3. Comparison of WUE, precipitation, and LST indices during the dry and rainy season.
MinimumMedianMeanMaximum
WUE (Dry period)1.952.832.843.69
WUE (Rainy period)1.501.891.922.36
Precipitation (Dry period)2.725.606.3012.42
Precipitation (Rainy period)102.90136.90136.90180.10
LST (Dry period)26.9630.0930.1433.30
LST (Rainy period)23.0225.7525.9128.62
Publisher’s Note: MDPI stays neutral with regard to jurisdictional claims in published maps and institutional affiliations.

