Abstract
The speedy increase in wind parks has brought to light a plethora of conflicts. Despite their benefits, there are more than a few who are opposed. The goal of this research is to study and evaluate the causes, so that such a project can take place in conditions of cooperation, mutual interest and profit for society and investors. The method chosen was a survey with approximately 600 responses in Attica, continental Greece and the islands. The data collected were analysed via SPSS on three levels: (i) descriptive statistics, (ii) binomial logistic regression to model the attitude towards wind farms, and (iii) factor analysis to identify latent factors that influence people’s thoughts. The results show that the NIMBY effect has no significant influence on the acceptance of the project, contrary to expectations. Moreover, the acceptance of a project does not seem to be a class issue, as the analysis showed that attitude is independent of income. The frequency and logistic analysis showed as the main determinants of the public attitude: (i) in a positive way, open and continuous briefing during all the construction stages and minimisation of greenhouse gases emissions (i) in a negative way, the impact on flora and fauna and the lack of trust in the investors.
1. Introduction
Climate change, scarcity of natural resources and the insecurity of food, water and energy supplies are just some of the environmental problems facing our planet today. Problems that can exacerbate the phenomenon of energy poverty, i.e., the situation in which a person is unable to “enjoy” basic energy goods, eventually leads to serious health and environmental consequences [1,2].
In conjunction with the concept of sustainable development, which includes considerations of inter- and intra-generational equity [3], a longer-term perspective, and the value of the environment in decision-making, it follows that adopting policies that ensure this sustainability is now considered to be a necessity. The concepts of energy justice and democracy, according to which a socially fair energy transition is pursued [4], form the basis of these policies.
In 2019, energy stored globally from Wind Parks (WPs) was nearly 651 GW, with an increase of 10% since 2018, reaching 744 GW in 2020. There are estimations of the total capacity by 2050, calculated at 5044 GW from onshore WPs and 1000 GW from offshore WPs. It is also known that the total capacity required will approach 14 TW by 2050 [5,6].
The current rapid increase in the size of wind turbines has brought to light a plethora of conflicts. Despite the benefits of wind turbines and the need to harness wind energy, there are more than a few who are opposed to such infrastructure. This opposition leads to disputes and, in many cases, is an obstacle to their installation and operation procedures. This subject has been researched, but each study has focused on a unique objective. Therefore, this article will focus on a simultaneous and comprehensive examination of the most common aspects that may influence people’s attitudes towards WPs, whether positively or negatively.
Wind energy, a leading player in energy transition, is the central topic of interest in this work. The goals of this research are:
- To study and evaluate the causes from which all the negative perceptions about WPs arise and
- To organise in a hierarchy the factors that can reduce conflicts about these implementations,
- To identify the main determinants affecting someone’s attitude towards WPs so that such a project can take place in conditions of cooperation, mutual interest and profit for both society and investors.
2. State-of-the-Art
About twenty years ago, when relevant research started in 1998, most studies focused on the Not In My Backyard (NIMBY) syndrome as the main cause of negative attitudes towards WPs. However, unlike previous research, Wolsink’s research [7] presented society’s rejection of WPs as a multi-faceted issue. According to him, the factors that influence citizens’ opinions about WPs are mainly institutional. Specifically, he addressed the importance of open procedures in land-use planning and, more generally, the possibility of open participation in the approval and planning processes for WPs. Finally, he asserted that politicians, policy decision makers and investors should focus on the proper growth and expansion of projects rather than on citizens’ reactions.
2.1. Wind Parks and Society
Society’s influence in the acceptance and integration of RES projects is a fact, as are doubts about these structures. In particular, fragmented information, mainly from social media, accompanies these conflicts. The prevailing perceptions in the context of the negative impact [8] of WPs on their area of establishment concern the impact on flora and fauna, mainly on local birds, as well as land occupation and the audio-visual nuisances that may occur because of their construction and operation. These perceptions, taken together, lead to the conclusion that the quality of life of the inhabitants and, more generally, the ecosystem of the wider area of the project, will be damaged.
A wind project has impacts on the ecosystem, both during its construction and operation [9]. The required fuel used to transport the equipment to the installation site, as well as that used to build the individual parts of the wind turbines, are part of the environmental cost, along with the audio-visual nuisances [10] that may agitate the ecosystem. These nuisances are an event that may cause a split in feelings towards a WP, as there is not a specific direction of public opinion.
Land occupation can also be examined in conjunction with other factors that have been studied and negatively affect the acceptance of a wind facility. In the first instance, it is related to the connection local residents have to nature nearby [11]. If this connection is strong, then it is difficult for the project to be accepted, as people find it hard to adjust to changes in their home environment. Moreover, there is a lack of trust in local authorities, and the perception that existing legislation is being violated; it is thought that areas that should be protected or maintained as they are are being illegally occupied [12].
However, there are other reasons leading to the above conclusions, such as a lack of confidence in investors [13], as well as the lack of reliability in the processes of design, development, construction, and operation of these structures. When it comes to a project which means a significant change for a large number of people nearby and, therefore, in their daily lives, a different approach is required, through which respect is shown to them and their environment.
Table 1 refers to nine important already published studies that have taken place in different regions in order to identify people’s attitude towards WPs, and also the reasons driving these perceptions.

Table 1.
Recent research on the specific objectives, tested, affecting public opinion towards Wind Parks [14].
The formation of mutual trust between investors and society is influenced not only by their direct relationship, but also by the relationship of local authorities with both parties [24]. The negative attitude of local authorities towards the project causes citizens to doubt as well, as they are usually represented by local, elected politicians and cannot have direct contact with the administrators and investors. On the other hand, the very positive treatment of wind farms by local authorities usually leads to controversy and mistrust about transparency.
Demographics also contribute to the attitude of the population towards WPs. In other words, there is a general picture that women are the most sensitive to environmental issues [25], as well as young people [26]. Lower-income groups tend to be more opposed to these projects because they are busy making a living and do not have the opportunity to engage in the “commons”. Moreover, these people usually feel that they have been exploited and treated unfairly, which does not make it easy for them to trust the local authorities or the investors.
Finally, the fact that many fossil fuel power plants are closing and giving way to renewable energy parks, leaving many people without jobs, creates a negative climate with respect to these facilities [27]. It is necessary to develop a plan for forthcoming jobs and especially for the sectors in which these people can be professionally retrained.
2.2. Pathways to Deal with the Arisen Conflicts
Although negative attitudes towards wind power projects are inevitable, there are ways to address the objections that arise, in order to improve the installation and operation of WPs with the lowest possible tension. It is, therefore, necessary to explore the point of balance between society and investors, as this means that the necessary concessions have been reached by both sides, aiming at achieving the objectives of both parties.
First, it is important to provide comprehensive information and education on the real impacts and benefits of wind power projects [28]. These can be more easily understood by comparing WPs with conventional methods of energy generation. In addition, there is a need for continuous information on individual projects, but also on RES in general, as it is an industry that is constantly evolving in terms of the technologies developed for its use. These processes should consider the principle that while RES are clean forms, the technologies used to exploit them are not fully clean.
Besides, the environmental advantages of exploiting wind energy compared to conventional energy production methods are a major argument that could stimulate the acceptance of WPs [29]. Energy generation using wind potential initially helps to reduce gas emissions. Also, the energy used for the creation and installation of WPs, is, according to studies, fully restored during the life of a project.
Furthermore, landscape alteration and audio-visual nuisance can be managed initially through careful management of construction works. In this way, violent and intense changes to the environment are avoided, and the ecosystem is given sufficient lead time to integrate the project. Of course, these impairments can also be minimised before this stage, as there are different ways of determining the damage caused by a WP, depending on its technical characteristics and location. By using research tools such as the Spanish method [30] for calculating the visual nuisance of a WP [31], a clear determination of the level of disturbance at each site can be achieved, and thus the best spatial planning and, accordingly, the best technical characteristics of the project.
In addition, it is particularly important to address the issues that are raised by local people who see the facility as a catalyst for accomplishing their tasks. Thus, it is noteworthy that a WP consists of wind turbines that have relatively large distances between them. Given this, there is an opportunity to develop the project site with other land uses such as agriculture and livestock [32].
While WPs are generally expected to adapt to and have less impact on the ecosystem after construction, the same does not apply to the flying populations of the installation area [33]. The high mortality rate of avifauna and bats has undeniably caused a great stir, so the need to manage them is also evident. For this reason, various studies are being conducted on how to protect the ecosystem from wind turbines and technologies developed for this purpose which are already in use. By replacing smaller wind turbines with those of greater height and power, a 54% reduction in the mortality of flying species was found in California [34].
More practical ways of dealing with the impact on wildlife are also mentioned. De Lucas et al. [35] referred to the temporary closure of WPs at times when the risk to wildlife is considered to be higher. A 50% reduction in griffon vulture mortality was observed. For the protection of bats, in particular, technology was used to emit the ultrasonic echoes that are perceived by the bats. The number of bats dying decreased by 64% [36]. In addition, practices related to the visual protection of species, such as dyeing a fin so it is seen more easily by birds, or using reflective ultraviolet paint on rotor blades for UV-sensitive species, are also quite common [37].
Moreover, there are more direct ways to positively influence citizens’ opinions on WPs. In particular, the economic and environmental incentives as well as the climate of trust between citizens, local authorities and investors can play a special role in achieving this objective, and therefore deserves to be considered separately and integrated into a policy for the management of such facilities. When analysing the incentives and conditions required to strengthen the acceptance of WPs, perhaps the existing legislation should also be mentioned [38].
There is no doubt that financial incentives are crucial for the smooth running of a project without much tension on the part of society [39]. Similarly, in the case of a wind project, applied financial motivations already exist that can be used to restore the sense of justice for citizens [40,41], such as financial compensation, mainly by reducing or even paying off the power bill, the creation of new jobs, and the possibility of public participation in project investment, as well as contributory projects. The economic easing of costs as well as new jobs are two crucial compensations which can lead to project acceptance, especially at this time, when approximately 9.2% of the world, or 689 million people, live in extreme poverty, according to the World Bank [42].
In addition, the rewards mentioned above constitute projects offered by the manufacturing and holding companies of the WPs and provide direct benefits to local societies. The aim of these projects is to upgrade the residents of the WPs area, quality of life, develop the area itself and, more generally, serve citizens. Such a project is the upgrading of the road network that, beyond the life of the citizens, facilitates the realisation of the project.
Participation in the investment, i.e., through energy communities, is already a tested business model [43]. Such a plan offers greater security for the project and intensifies the trust climate between citizens and investors since, in theory, citizens have easier access to the core of the project processes. The literature asserts that the impact or not of a participation plan also depends on demographics and speaks of the exceptional importance of creating equal opportunities for all in participatory projects [44].
It is well known that there is a lack of fairness as not everyone is able to participate in investment, because of the structure of the society we live in [45]. However, there are ways to create more equal opportunities for a wider public. Firstly, the introduction of a minimum amount of participation which is feasible for the majority of citizens, and, at the opposite end, a maximum amount, which would prevent the most well-off people from buying a large part of the investment, is one such way. Furthermore, the imposition of a mandatory tender procedure for a substantial part of the investment in public funds could make a positive contribution to this objective.
To conclude, the need to smooth the tensions between society and investors is recognised, but equally understandable should be the fact that we are referring to a two-way relationship. The nature of this relationship shows that to strike a balance between the two, both financial exchanges and retreats are required from investors on issues related to the technical elements and the way the project is developed, implemented and operated, as well as retreats and understanding from citizens on the same issues.
3. Methodology
The research approach adopted was based on a structured questionnaire aimed at understanding the current opinion of the population on wind projects and ways to mitigate conflicting attitudes towards these installations (Table 2 and Figure 1a,b). The questions were mainly based on the factors that influence a wind project as a whole. The ultimate goal is to prioritise the elements/reasons in terms of their negative impacts, i.e., to what extent they negatively affect the project, as well as find the compensations necessary to smooth the existing differences arising from the above elements/reasons.

Table 2.
Methods used. A detailed explanation.
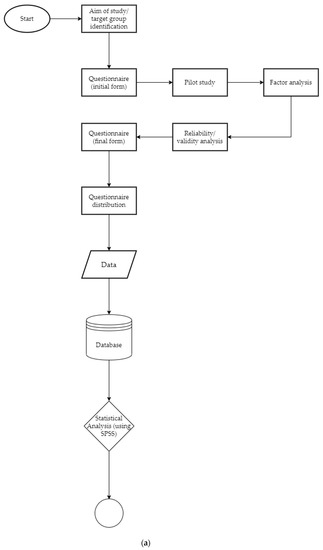
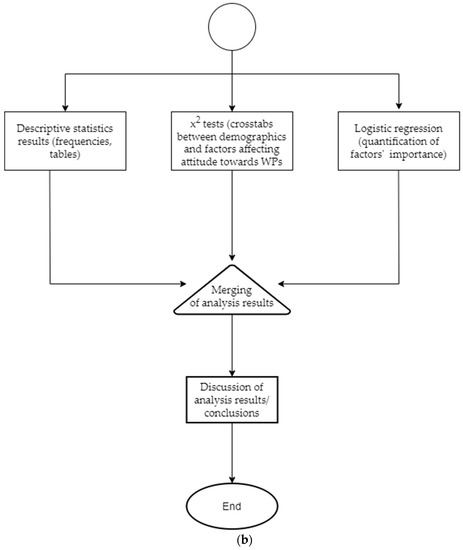
Figure 1.
(a) Methodology flowchart (part 1). (b) Methodology flowchart (part 2).
The first step in the formulation of the questionnaire (Figure A1, Figure A2, Figure A3, Figure A4 and Figure A5) was a literature review, which formed the basis of most of the questions. The initial form of the questionnaire was created using these questions, as well as the brainstorming of the research team and a validity analysis. We then applied exploratory factor analysis in order to identify and classify its possible variables in new (latent) variables/factors. An important element of the questionnaire was (the choice of) the way in which the questions and answers were phrased/measured, aiming to facilitate the analysis of the results. The variables of our interest were qualitative, mainly of ordinal type, and the scale of the responses was chosen to be a Likert one [46], with values ranging from 1 to 5 and interpretations from “not at all” to “extremely”. For the questions where the response could not be covered by such a scale, more than three possible values were chosen, among which there was a reasonable gradation (Table A1).
The finalised questionnaire was distributed electronically during March/April 2021. One of the main concerns was to reach areas with wind farms, as well as groups with a negative view towards wind farms and RES in general. An effort was made, therefore, to make the sample chosen as representative, of the target population as possible. As shown in Section 4.2, the questionnaires were:
- (i)
- Distributed to Attica, mainland, islands;
- (ii)
- Weighted w.r.t. certain factors such as living area and existence or lack of WPs;
- (iii)
- Checked w.r.t. sampling adequacy indexes such as KMO.
Once IBM SPSS software version 26.0.1.0 was selected as the statistical analysis program, the data were recorded and then coded in a way that they could be processed.
The results of the descriptive statistics were given first for the demographic characteristics, while the second part of the analysis was the choice of the proper statistical methods to be used [47,48,49]. Three techniques were selected, with the main selection criterion being the ability to process qualitative variables. The first was a computation of frequency distributions and the creation of graphs, the second was a correlation analysis of variables (i.e., x2 test-crosstabs) and the third one was binary logistic regression. Table 2 provides a detailed explanation of:
- (i)
- The methods used in our analysis
- (ii)
- The conditions necessary for their application
- (iii)
- The necessity of each one of the methods used
- (iv)
- The expected results from the methods applied
All the requirements for the use of these methods were satisfied by our data, so the respective processes could be applied.
4. Results and Discussion
4.1. Questionnaire’s Validity and Reliability
The initial form of the questionnaire was distributed (randomly) to a number of interviewees, and their answers were recorded. Next to the data collected, we ran an exploratory factor analysis in an attempt to find any latent variable/factors that influence people’s thoughts on windmills (and, as a result, organise the questionnaire into different sections of relevance). The application of factor analysis was possible since the basic requirements (Kaiser—Meyer—Olkin Measure of Sampling Adequacy = 0.819 > 0.7, and Bartlett’s Test of Sphericity was non-significant) were satisfied. The analysis gave three new factors (Table A3 and Table A4), which were: (a) enablers, (b) barriers, and (c) trust in investors, based on the loading scores of each one of the old variables w.r.t. each one of these new factors. This connection can be seen in Figure 2.
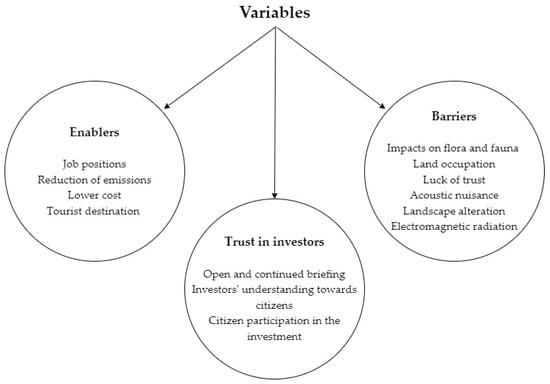
Figure 2.
Components grouped by factor analysis.
For the conceptual validity of the questionnaire, it was distributed (in addition) to a small group of experts, and their comments were considered. Moreover, for the reliability of the questionnaire (mainly of the newly described factors), inner reliability was applied, and Cronbach’s alfa coefficient(s) was determined to be equal to 0.827, 0.639, 0.727 for barriers (negative influence), enablers (positive influence) and trust in investors, respectively.
Considering the alfa values (a questionnaire with an alpha value of around 0.700 is considered to be a reliable one), these 3 factors can be considered and used as scales of positive influence, negative influence, and trust in the investors when someone wants to research (through a questionnaire) the attitude of people (and the factors responsible) versus the establishment and operation of WPs projects.
With the help of the above, the final form of the questionnaire was created and divided into five sections: (1) information about the questionnaire and the purpose of the survey, along with questions about the relationship between the public’s awareness of wind farms and RES in general, (2) questions about factors that negatively affect the public’s opinion of these projects, (3) a section on the positive effects on the acceptance of wind farms and on the trust in investors, (4) demographic data, and (5) a question about climate change and an empty space for respondents to share their thoughts. The main part of the questionnaire, i.e., parts 2 and 3, was based on the factors/scales described above.
4.2. Characteristics of the Sample
The Greek territory was divided into geographical areas, namely: Attica (43% of the responses), mainland Greece (25% of the responses) and the islands (32% of the responses). The sample collected was weighted w.r.t the variables gender, age and income, i.e., the sample was traced to the demographic data of Greece recorded by ELSTAT (Hellenic Statistical Authority). The final number of questionnaires used in our analysis was 574 (sample size). Regarding gender, there were 308 men (55%) and 257 women (45%) (Table A2). The age was divided into six groups: 18–24 (34%), 25–34 (26%), 35–44 (15%), 45–54 (13%), 55–64 (10%), over 65 (3%). Moreover, for income, there were eight possible answers, <6000€ (22%), 6000€–12,000€ (21%), 12,000€–18,000€ (13%), 18,000€–24,000€ (8%), 24,000€–36,000€ (8%), 36,000€–48,000€ (3%) and over 48,000€ (2%).
4.3. Data Analysis—Descriptive Statistics
4.3.1. Frequencies
61.1% of the sample members have a positive attitude towards WPs, while 18.3% seem to have a negative opinion about these projects (Figure 3, answers measured on a 5-degree Likert scale with 1 being “very negative” through to 5 being “very positive”). Moreover, about 60% of the interviewees stated that they were very well informed about RES and only 17% that they were poorly informed, or not informed at all (Figure A6).
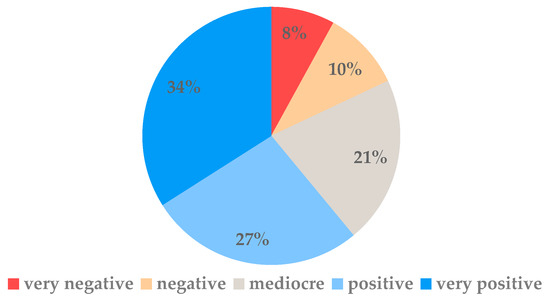
Figure 3.
People’s attitude towards Wind Parks.
Τhe responses about the main factors that influence people’s opinions on wind projects are impact on flora and fauna (≈70%), landscape alteration (≈55%) and lack of trust towards investors (≈55%) (Figure A7).
In Figure 4, factors are indexed that have a mentionable impact on the mindset of the population towards WPs. It is shown that most of the components play a vital part in the acceptance of the project and in increasing the trust in the investors, with the most important being open and continuous briefing during the project’s procedures. Nevertheless, the exploitation of the area as a tourist destination and citizens’ participation in investment seem to have the lowest impact on the set of options.
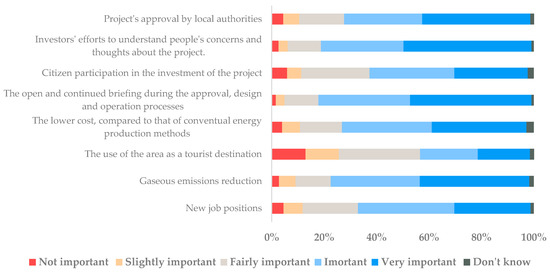
Figure 4.
Importance of the factors affecting positively people’s attitude towards Wind Parks.
Furthermore, regarding the question about desired compensation, the power bill discount was the most popular response, with 74% of the sample choosing it, while participation in the project was selected by only 27% of the population (Figure A8).
Finally, the answer to the question about the individual’s role in climate change shows that the overwhelming proportion of the sample (81.9%) accepts its responsibility as a part of the problem (Figure A9). This proportion is the result of both the degree of the outbreak and the environmental awareness that has begun to develop evenly in society (not specifically associated with demographic characteristics).
4.3.2. (Cor.) Relations
Next, in order to find any (possible) relation between demographics and factors which positively/negatively affect attitudes towards WPs, we used the x2 test of independence (crosstabs) and Phi and Cramer’s V coefficients (Figure A10).
- (i)
- Presence of a wind farm
First, we examined the (possible) relation between the attitude towards wind projects and the presence or absence of a wind farm in the vicinity of the respondents. From Figure 5, it can be seen that the existence of such a project in the vicinity of the respondents does not affect people’s opinion on wind turbines negatively (x2 = 7.895, p = 0.095). The result is also visually evident from the coincidence of the two lines, with the blue line reflecting the opinion of those who have a WP nearby and the red line the opinion of those who do not.
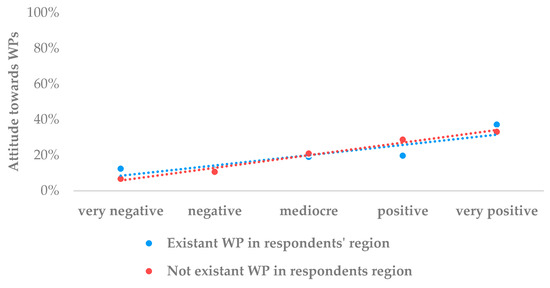
Figure 5.
Attitude towards WPs vs the infrastructures’ existence in the area.
It is notable that the distance at which a wind turbine will be placed is not important for those who already have a positive attitude towards WPs.
- (ii)
- Gender
Attitude towards WPs is related to gender (Table A6) (x2 = 27.769, p < 0.001), with men being more positive about WPs and women more skeptical (about 30% of women responded unenthusiastically)
- (iii)
- Age
Age appears to be inversely proportional to the positive attitude towards WPs (Table A7), apart from the 35–44 age group, which accounts for the largest proportion of negative attitudes (Figure 6).
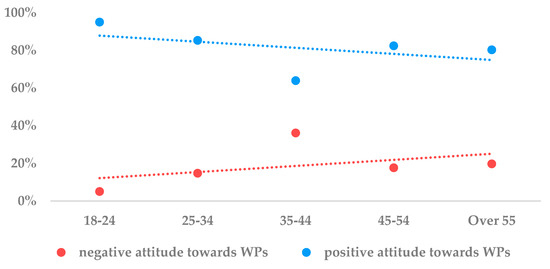
Figure 6.
Age and attitude towards Wind Parks.
Among the factors connected with the creation/operation of WPs and affecting the interviewees in a negative way, the impact on flora and fauna seems to have the greatest influence on young people and noise pollution is the smallest one. Moreover, the lack of confidence in investors mainly affects the 25–54 age group, and the deterioration of the landscape affects all age groups to the same extent (Figure 7).
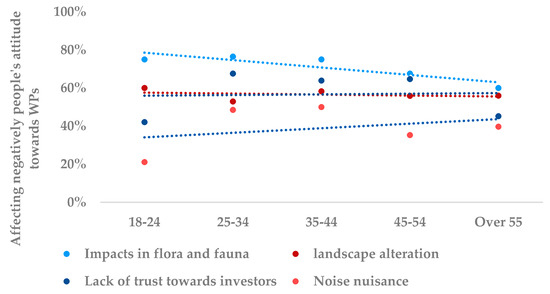
Figure 7.
Age and negative impact of factors on Wind Parks.
As for the factors that positively influence attitudes towards wind turbines, the trend diagram (Figure 8) shows that the age group of 18–24 is more cautious towards wind projects while the age group 35–44 is less affected by these factors. Moreover, as age increases, the influence of the following parameters on citizens’ opinions towards wind turbines decreases (Figure 8).
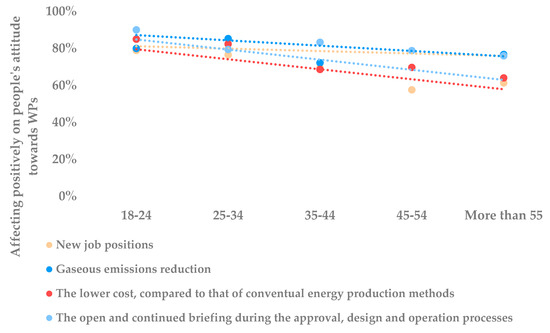
Figure 8.
Age and positive impact of factors on Wind Parks.
- (iv) Educational level
The analysis concluded that the attitude to WPs is not related in a statistically significant way to educational level (Table A8 and Figure A17) (x2 = 7.884, p = 0.794), in contrast to the information (Figure 9) on RES, which seems to be proportional to education (x2 = 84.742, p < 0.001).
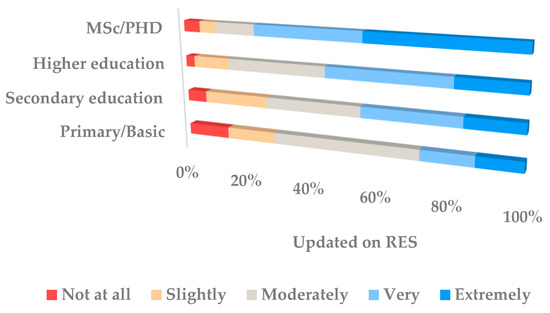
Figure 9.
Level of education and the information on renewables.
- (v) Income
Ιncome does not play a (statistically) significant role in people’s attitudes towards WPs (Table A9) (x2 = 18.695, p = 0.768). On the other hand, it is evident from Figure 10 that information on RES increases as income increases (up to a certain income).
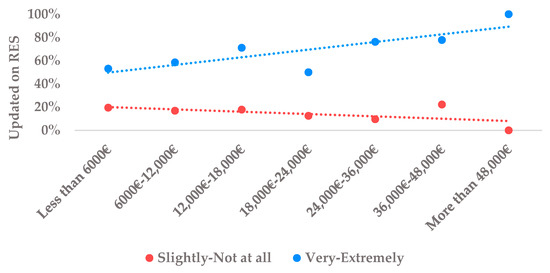
Figure 10.
Income in relation to the information on renewables.
- (vi)
- Region
The x2 relation analysis also shows that region is not related to the attitude towards WP’s (x2 = 9.947, p = 0.269). More precisely, even though people in Attica are more negatively opposed to such projects (10.6% to 6.1%, respectively, for the Continental Area and the Islands), the majority of the residents in all three areas have a positive or very positive opinion of such projects (60.8%, 57.5% and 64%, respectively). Any percentage differences between regions are proven to be not statistically significant (Figure 11).
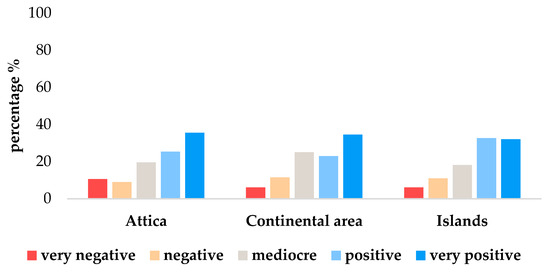
Figure 11.
Region and attitude towards Wind Parks.
There are analogous results for region and information on RES. (57.6%, 57.5% and 69.7%, respectively; the difference, once again, is not statistically significant (x2 = 4.572, p = 0.802), even though people in the islands seem to be more well informed). Moreover, people in all three regions consider that the main factor which influences their opinion is the impact on flora and fauna (37.6%, 39%, 43.6%, respectively) while the most important factor which positively affects their opinion of such a project is the reduction in gaseous emissions (42%, 40% and 44%, respectively).
4.4. Logistic Regression
“Attitude against WPs” and the main factors responsible for it were examined. The (independent) factors/variables investigated (as a result/part of the above-mentioned frequency and x2 analysis) were:
x1, Impacts on flora and fauna
x2, Landscape alteration
x3, Lack of trust towards the investors
x4, New job positions
x5, Reduction in gaseous emissions
x6, Lower cost, compared to conventual energy production methods
x7, Open and continuous briefing during the approval, design and operation processes recoded as dichotomous variables (new value 0 = negative, old values 1,2,3 on the Likert scale, and new value 1 = positive, old values 4,5 on the Likert scale).
The results of the (logistic regression) analysis (Table A12) are described below in a series of tables/graphs (Figure 12, Figure 13 and Table 3).
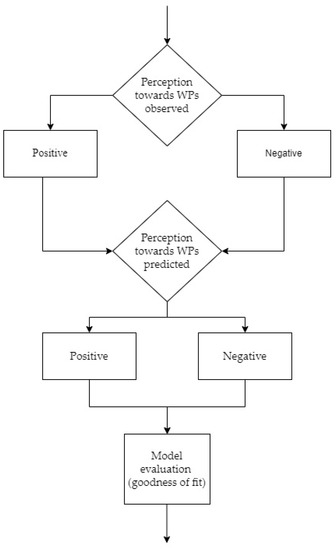
Figure 12.
Classification flowchart of logistic regression results.
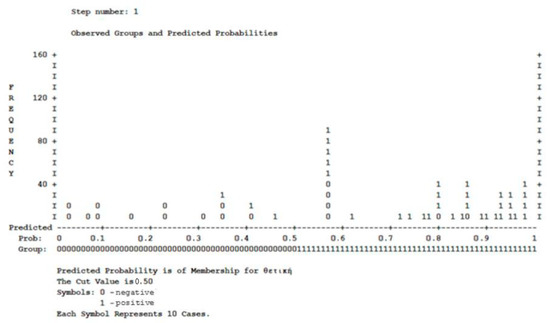
Figure 13.
Classification plot.

Table 3.
Logistic regression results.
The goodness of fit of the model can also be seen from the following graph (Figure 13): 0′s and 1′s are those who have (a real) negative and positive attitude, respectively, towards WPs. A well-fitted model classifies the ones to the right at 0.5 and the zeros to the left 0.5 (as our model does in the majority of cases).
Table 3 is the main part of the logistic analysis. First, we look at the fourth column, which gives the statistical significance of each one of the seven (independent) variables/factors used in the analysis. Since sig. <0.05, all the variables are (statistically) significant and must be included in the model. Next, the third column gives the coefficients of the logistic equation, which is given by:
The meaning and the importance of each one of the variables can be given in coordination with the values of Exp(B) (fifth column). The larger the value of Exp(B), the more significant the factor.
For example, the explanation of the first (coefficient) parameter x1 is:
Impacts in flora and fauna: coefficient −0.779 or Exp (−0.779) = 0.459. The possibility (odds) of someone having “positive attitude towards WPs” is 54.1% smaller in case that affects him/her negatively compared to the possibility (odds) of someone being positive towards WPs, in case that affects him/her positively (considering the remainder of the seven factors).
So, the main factors that influence a person’s attitude in terms of being positive/negative towards WPs (in order of importance) are x7, x5, x6, x4, x1, x3, x2.
Summarising the above described (frequency and logistic) analysis, it can be seen that there are two categories of reasons affecting a person’s attitude towards WPs projects, namely: (I) the environment and (II) the investors.
In fact: (a) the impact on flora and fauna and (b) the lack of trust in the investors influence someone negatively in terms of their acceptance of this kind of project, while, by contrast, (c) the open and continuous briefing during all the stages of construction and operation of WPs and (d) reductions in gaseous emissions influence someone positively.
5. Conclusions and Policy Implications
In this study, conclusions were drawn about the attitudes of the Greek population towards wind energy projects and the factors that influence them. Approximately 80% of the population acknowledges their individual responsibility for the phenomenon of climate change, which explains the overwhelmingly positive attitude towards wind turbines, recognising the need to switch to alternative forms of energy production. However, this attitude seems to be strongly influenced by factors related to project acceptance in general and those that can promote trust towards investors, while in the case of preferential compensation, the most important factor seems to be the discount on electricity costs.
The results show that the presence or absence of wind turbines in the vicinity of the respondents is not significantly related to their attitude towards wind turbines, and the more positive their attitude is, the less they are influenced by the placement of wind turbines in close proximity to their houses. Therefore, it can be concluded that the NIMBY effect has no significant influence on the acceptance of the project.
Moreover, the results of possible relations between the attitude towards WPs and demographic characteristics are of particular importance. In fact, men seem to be better informed about RES than women and, at the same time, more positive towards wind projects, while for age, it is confirmed that younger age groups have a more positive attitude towards projects. The update on RES also shows an analogy between education level and income. Moreover, the acceptance of a WP project does not seem to be a class issue, as the analysis showed that attitude is independent of income class.
Logistic regression was run, resulting in an equation linking/quantifying attitudes towards wind projects to impacts on flora and fauna, landscape alteration, lack of trust in investors, new job positions, reduction in gaseous emissions, the lower cost of energy through windmills compared to conventual energy production methods and open and continuous briefing during the approval, design and operation processes.
The analysis showed that the most important factor in public attitudes towards WPs is open and continuous briefing during the approval, design and operation processes, new job positions and reduction in gaseous emissions.
The above results display the urgent need for increased transparency and information campaigns towards the local society. Also, joint cooperation schemes with local communities, such as energy communities, are a successful global practice. In addition, the Greek local and regional authorities should encourage open discussion on the potential environmental, economic and aesthetic burdens, taking into account environmental responsibility and dynamic energy independence.
The current research had to face limitations such as the fact that wide national coverage of the sample ignored local geographical and morphology characteristics, as well as particular cultures in different Greek regions. The authors recommend, complementary to the above, detailed local research working with the candidate societies combined with technical and visual analysis using the IT tools available.
Finally, as a future study, an additional survey is proposed to collect the opinion of wind turbine investors on the same issues. The objective of the study, namely to examine all dimensions of the problem and mitigate it, is thus achieved.
Author Contributions
Conceptualization, G.S. and T.T.; methodology, G.S., T.D. and T.T.; validation, G.S., T.D. and T.T.; formal analysis, G.S., T.D. and T.T.; data curation, G.S.; writing—original draft preparation, G.S.; writing—review and editing, G.S., T.D. and T.T.; supervision, T.T.; project administration, G.S.; All authors have read and agreed to the published version of the manuscript.
Funding
This research received no external funding.
Informed Consent Statement
Informed consent was obtained from all subjects involved in the study.
Conflicts of Interest
The authors declare no conflict of interest.
Appendix A

Figure A1.
Survey’s questionnaire page 1.
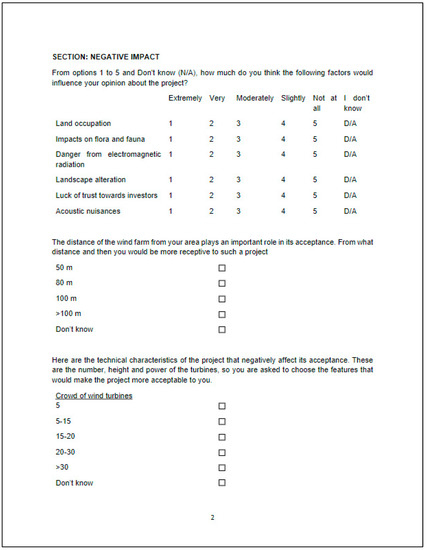
Figure A2.
Survey’s questionnaire page 2.
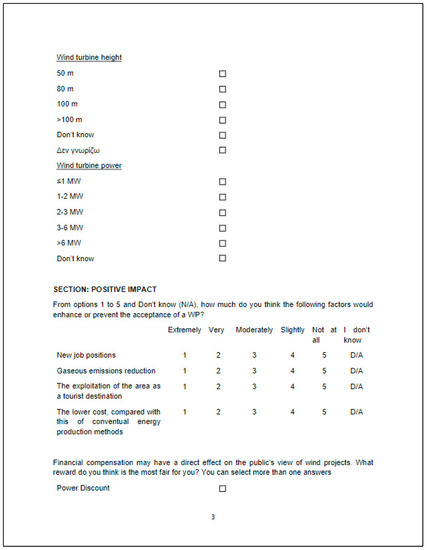
Figure A3.
Survey’s questionnaire page 3.
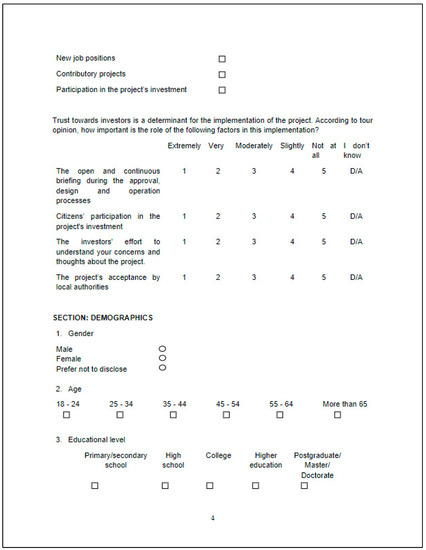
Figure A4.
Survey’s questionnaire page 4.
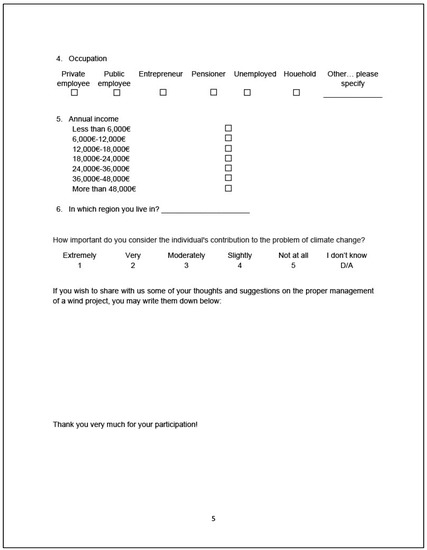
Figure A5.
Survey’s questionnaire page 5.

Table A1.
Coding of the questionnaire.
Table A1.
Coding of the questionnaire.
| Question | Code Number |
|---|---|
| Is there a WP near your area? | 1 |
| If not, is your area a possible location for a future WP? | 2 |
| What is your perception towards wind projects? | 3 |
| How informed are you about RES? | 4 |
| How much do you think the following factors would influence your opinion about the project? | |
| Land occupation | 5a |
| Impacts on flora and fauna | 5b |
| Danger from electromagnetic radiation | 5c |
| Landscape alteration | 5d |
| Luck of trust towards investors | 5e |
| Acoustic nuisances | 5f |
| From what distance and then you would be more receptive to such a project | 6 |
| Wind turbine height | |
| 50 m | 7a (1) |
| 80 m | 7a (2) |
| 100 m | 7a (3) |
| >100 m | 7a (4) |
| Don’t know | 7a (5) |
| Wind turbine power | |
| ≤1 MW | 7b (1) |
| 1-2 MW | 7b (2) |
| 2-3 MW | 7b (3) |
| 3-6 MW | 7b (4) |
| >6 MW | 7b (5) |
| Don’t know | 7b (6) |
| Crowd of wind turbines | |
| 5 | 7c (1) |
| 5-15 | 7c (2) |
| 15-20 | 7c (3) |
| 20-30 | 7c (4) |
| >30 | 7c (5) |
| Don’t know | 7c (6) |
| How much can the following enhance or prevent the acceptance of a WP? | |
| New job positions | 8a |
| Reduction in gaseous emissions | 8b |
| The exploitation of the area as a tourist destination | 8c |
| The lower cost, compared with this of conventual energy production methods | 8d |
| Trust towards investors is a determinant for the implementation of the project. According to tour opinion, how important is the role of the following factors in this implementation? | |
| Open and continuous briefing during the approval, design and operation processes | 9a |
| Citizens’ participation in the project’s investment | 9b |
| The investors’ effort to understand your concerns and thoughts about the project. | 9c |
| The project’s acceptance by local authorities | 9d |
| Financial compensation may have a direct effect on the public’s view of wind projects. What reward do you think is the most fair for you? You can select more than one answers | |
| Power Discount | 10a |
| New job positions | 10b |
| Contributory projects | 10c |
| Participation in the project’s investment | 10d |
| Gender | 11 |
| Age | 12 |
| Educational level | 13 |
| Occupation | 14 |
| Annual income | 15 |
| In which regional section do you live? | 16 |
| How important do you think the individual’s contribution to the climate change problem is? | 17 |

Table A2.
Sample distribution vs. gender.
Table A2.
Sample distribution vs. gender.
| Gender | Questionnaires | Percentage in the Population% | Percentage in ELSTAT% |
|---|---|---|---|
| Man | 308 | 55 | 49.2 |
| Woman | 257 | 45 | 50.8 |
| Other/No answer | 9 | - | - |
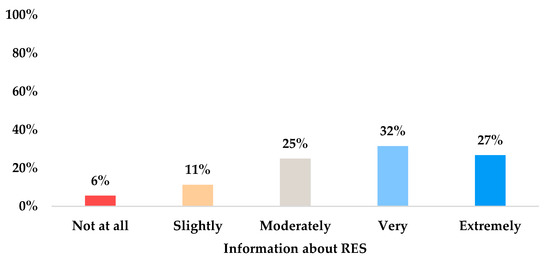
Figure A6.
Information of the population on RES.
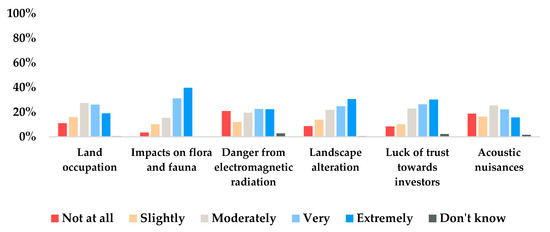
Figure A7.
Factors with negative impact on people’s opinion towards WPs.
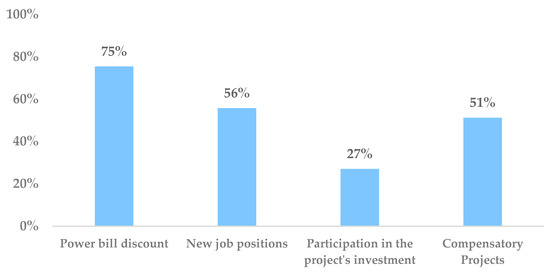
Figure A8.
Preferable compensation schemes.
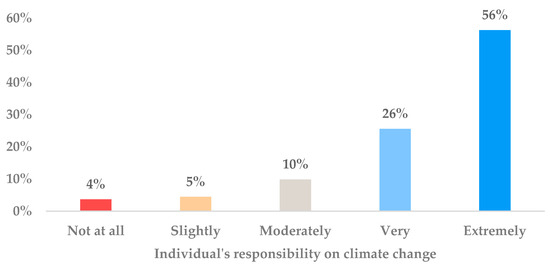
Figure A9.
Public perception of their responsibility for climate change.

Table A3.
Total variance of factor analysis explained.
Table A3.
Total variance of factor analysis explained.
| Component | Initial Eigenvalues | Extraction Sums of Squared Loadings | ||||
|---|---|---|---|---|---|---|
| Total | % of Variance | Cumulative % | Total | % of Variance | Cumulative % | |
| 1 | 3413 | 24,378 | 24,378 | 3413 | 24,378 | 24,378 |
| 2 | 2881 | 20,578 | 44,956 | 2881 | 20,578 | 44,956 |
| 3 | 1380 | 9854 | 54,810 | 1380 | 9854 | 54,810 |
| 4 | 909 | 6495 | 61,305 | |||
| 5 | 725 | 5179 | 66,484 | |||
| 6 | 681 | 4865 | 71,349 | |||
| 7 | 636 | 4540 | 75,889 | |||
| 8 | 624 | 4458 | 80,347 | |||
| 9 | 577 | 4122 | 84,469 | |||
| 10 | 498 | 3557 | 88,026 | |||
| 11 | 457 | 3262 | 91,288 | |||
| 12 | 441 | 3149 | 94,437 | |||
| 13 | 393 | 2805 | 97,243 | |||
| 14 | 386 | 2757 | 100,000 | |||
| Extraction Method: Principal Component Analysis. | ||||||

Table A4.
Rotated Component Matrix.
Table A4.
Rotated Component Matrix.
| Rotated Component Matrix a | |||
|---|---|---|---|
| Component | |||
| 1 | 2 | 3 | |
| Land occupation | 720 | ||
| Impacts in flora and fauna | 772 | ||
| Electromagnetic radiation | 736 | ||
| Landscape alteration | 799 | ||
| Luck of trust towards investors | 633 | ||
| Acoustic nuisances | 739 | ||
| Open and continuous briefing during the approval, design and operation processes | 709 | ||
| Citizens’ participation in the project’s investment | 708 | ||
| The investors’ effort to understand your concerns and thoughts about the project. | 804 | ||
| The project’s acceptance by local authorities | 716 | ||
| New job positions | 777 | ||
| The exploitation of the area as a tourist destination | 560 | ||
| Reduction in gaseous emissions | 706 | ||
| Lower cost, compared to that of conventual energy production methods | 678 | ||
| Extraction Method: Principal Component Analysis. Rotation Method: Varimax with Kaiser Normalization. | |||
a. The Rotated Component Matrix contains the Pearson correlations between items and components or “factors”. These are known as factor loadings and allow us to interpret which traits our components may reflect.
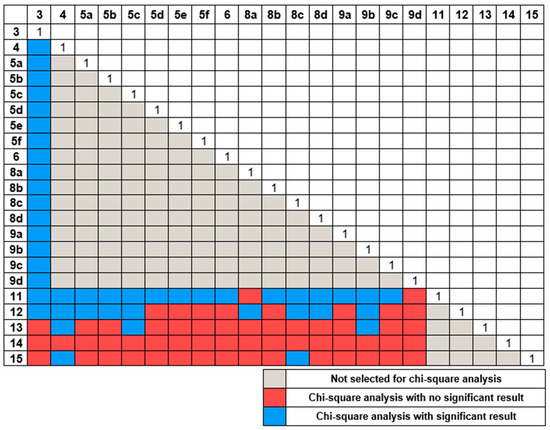
Figure A10.
Possible chi-square crosstabulations.

Table A5.
x2 crosstabs of questions/factors and people’s attitude towards WPs.
Table A5.
x2 crosstabs of questions/factors and people’s attitude towards WPs.
| Crosstabs (Pair of Questions) | Sig | Phi | Cramer’s | |
|---|---|---|---|---|
| 3 | 4 | 0 | 0.35 | 0.18 |
| 3 | 5a | 0 | 0.50 | 0.25 |
| 3 | 5b | 0 | 0.51 | 0.26 |
| 3 | 5c | 0 | 0.29 | 0.15 |
| 3 | 5d | 0 | 0.62 | 0.31 |
| 3 | 5e | 0 | 0.43 | 0.22 |
| 3 | 5f | 0 | 0.43 | 0.22 |
| 3 | 6 | 0 | 0.45 | 0.22 |
| 3 | 8a | 0 | 0.55 | 0.28 |
| 3 | 8b | 0 | 0.49 | 0.25 |
| 3 | 8c | 0 | 0.26 | 0.13 |
| 3 | 8d | 0 | 0.54 | 0.27 |
| 3 | 9a | 0 | 0.41 | 0.20 |
| 3 | 9b | 0 | 0.30 | 0.15 |
| 3 | 9c | 0 | 0.37 | 0.18 |
| 3 | 9d | 0 | 0.39 | 0.20 |
| 3 | 11 | 0 | 0.22 | 0.22 |
| 3 | 12 | 0.05 | 0.21 | 0.11 |

Table A6.
x2 crosstabs of questions/factors and gender.
Table A6.
x2 crosstabs of questions/factors and gender.
| Crosstabs (Pair of Questions) | Sig | Phi | Cramer’s | |
|---|---|---|---|---|
| 11 | 4 | 0 | 0.26 | 0.26 |
| 11 | 5a | 0.04 | 0.14 | 0.14 |
| 11 | 5b | 0 | 0.19 | 0.19 |
| 11 | 5c | 0 | 0.36 | 0.36 |
| 11 | 5d | 0.01 | 0.16 | 0.16 |
| 11 | 5f | 0 | 0.17 | 0.17 |
| 11 | 6 | 0.01 | 0.17 | 0.17 |
| 11 | 8b | 0.02 | 0.14 | 0.14 |
| 11 | 8c | 0 | 0.17 | 0.17 |
| 11 | 8d | 0.01 | 0.16 | 0.16 |
| 11 | 9b | 0 | 0.18 | 0.18 |
| 11 | 9c | 0.01 | 0.16 | 0.16 |
| 11 | 9d | 0.04 | 0.14 | 0.14 |

Table A7.
x2 crosstabs of questions/factors and age.
Table A7.
x2 crosstabs of questions/factors and age.
| Crosstabs (Pair of Questions) | Sig | Phi | Cramer’s | |
|---|---|---|---|---|
| 12 | 4 | 0 | 0.27 | 0.14 |
| 12 | 5a | 0.01 | 0.23 | 0.12 |
| 12 | 5b | 0.03 | 0.22 | 0.11 |
| 12 | 5c | 0.01 | 0.24 | 0.12 |
| 12 | 8a | 0.04 | 0.22 | 0.11 |
| 12 | 8c | 0 | 0.25 | 0.12 |
| 12 | 8d | 0.02 | 0.23 | 0.12 |
| 12 | 9b | 0.01 | 0.24 | 0.12 |

Table A8.
x2 crosstabs of questions/factors and educational level.
Table A8.
x2 crosstabs of questions/factors and educational level.
| Crosstabs (Pair of Questions) | Sig | Phi | Cramer’s | |
|---|---|---|---|---|
| 13 | 4 | 0 | 0.39 | 0.22 |
| 13 | 5γ | 0 | 0.27 | 0.16 |
| 13 | 9β | 0 | 0.27 | 0.15 |
| 13 | 10α | 0.04 | 0.12 | 0.12 |

Table A9.
x2 crosstabs of questions/factors and income.
Table A9.
x2 crosstabs of questions/factors and income.
| Crosstabs (Pair of Questions) | Sig | Phi | Cramer’s | |
|---|---|---|---|---|
| 15 | 4 | 0 | 0.33 | 0.16 |
| 15 | 8c | 0.01 | 0.31 | 0.16 |

Table A10.
Factors that increase a positive attitude towards WPs.
Table A10.
Factors that increase a positive attitude towards WPs.
| New Job Positions | Reduction in Gaseous Emissions | Exploitation of the Area as a Tourist Destination | Lower Cost, Compared to That of Conventual Energy Production Methods | |
|---|---|---|---|---|
| Not at all | 4.5% | 2.8% | 12.9% | 4.0% |
| Slightly | 7.3% | 6.3% | 12.7% | 6.8% |
| Moderately | 21.1% | 13.4% | 31.0% | 16.0% |
| Very | 36.8% | 34.0% | 22.0% | 34.3% |
| Extremely | 29.1% | 41.8% | 19.9% | 36.1% |
| Don’t know | 1.2% | 1.7% | 1.6% | 2.8% |

Table A11.
Factors that increase trust towards the investors.
Table A11.
Factors that increase trust towards the investors.
| Open and Continuous Briefing during the Approval, Design and Operation Processes | Citizens’ Participation in the Project’s Investment | The Investors’ Effort to Understand Your Concerns and Thoughts about the Project. | The Project’s Acceptance by Local Authorities | |
|---|---|---|---|---|
| Not at all | 1.6% | 5.9% | 2.6% | 4.4% |
| Slightly | 3.3% | 5.4% | 3.5% | 6.1% |
| Moderately | 12.9% | 26.0% | 12.7% | 17.1% |
| Very | 35.0% | 32.4% | 31.5% | 29.8% |
| Extremely | 46.3% | 28.0% | 48.8% | 41.3% |
| Don’t know | 0.9% | 2.3% | 0.9% | 1.4% |
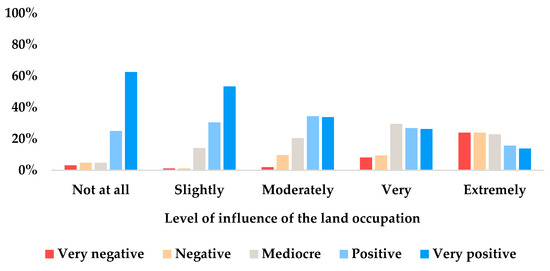
Figure A11.
People’s attitude towards WPs vs land occupation.
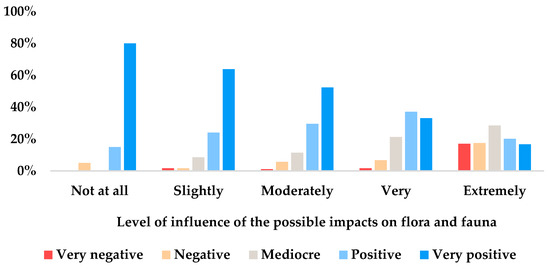
Figure A12.
People’s attitude towards WPs vs impacts on flora and fauna.
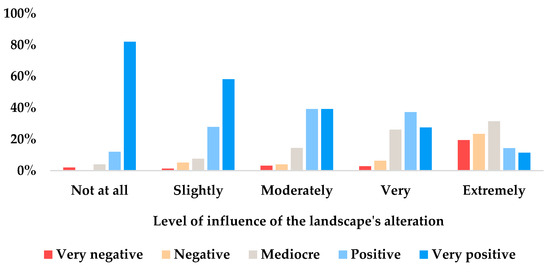
Figure A13.
People’s attitude towards WPs vs landscape’s alteration.
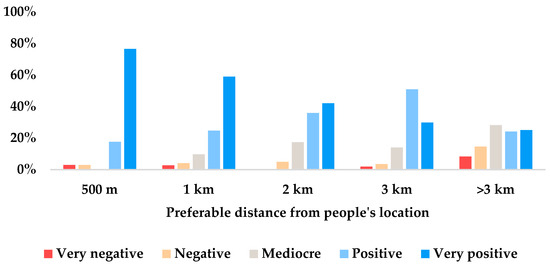
Figure A14.
People’s attitude towards WPs vs the distance of the project from their location.
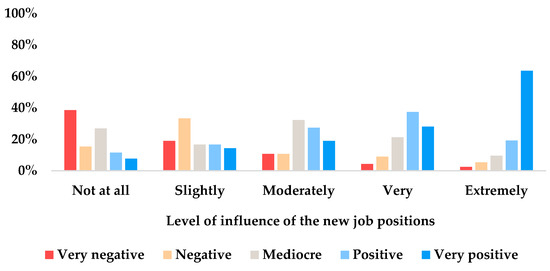
Figure A15.
People’s attitude towards WPs vs creation of new jobs.
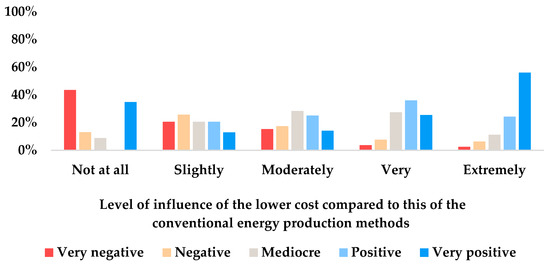
Figure A16.
People’s attitude towards WPs and lower-cost energy through windmills.
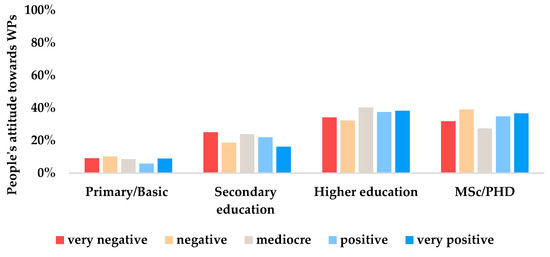
Figure A17.
Educational level and people’s opinion towards WPs.

Table A12.
Variables in the Logistic Equation.
Table A12.
Variables in the Logistic Equation.
| Variables in the Equation a | ||||||||
|---|---|---|---|---|---|---|---|---|
| B | S.E. | Wald | df | Sig. | Exp(B) | 95% C.I.for EXP(B) | ||
| Lower | Upper | |||||||
| Impacts in flora and fauna | −0.779 | 0.317 | 6.031 | 1 | 0.014 | 0.459 | 0.246 | 0.854 |
| Landscape alteration | −1.545 | 0.268 | 33.187 | 1 | <0.001 | 0.213 | 0.126 | 0.361 |
| Lack of trust towards investors | −1.092 | 0.253 | 18.623 | 1 | <0.001 | 0.335 | 0.204 | 0.551 |
| New job positions | 0.891 | 0.248 | 12.920 | 1 | <0.001 | 2.436 | 1.499 | 3.959 |
| Reduction in gaseous emissions | 1.084 | 0.307 | 12.447 | 1 | <0.001 | 2.957 | 1.619 | 5.401 |
| Lower cost, compared with this of conventual energy production methods | 0.627 | 0.275 | 5.209 | 1 | 0.022 | 1.872 | 1.093 | 3.208 |
| Open and continuous briefing during the approval, design and operation processes | 1.335 | 0.338 | 15.654 | 1 | <0.001 | 3.802 | 1.962 | 7.367 |
| Constant | −0.268 | 0.403 | 0.441 | 1 | 0.507 | 0.765 | ||
a. Variable(s) entered on step 1 Impacts in flora and fauna, Landscape alteration, Lack of trust towards investors, New job positions, Reduction in gaseous emissions, Lower cost, compared to that of conventual energy production methods, Open and continuous briefing during the approval, design and operation processes.
References
- Corovessi, A.; Boemi, S.N.; Tsoutsos, T.; Aryblia, M.; Touloupaki, E. Energy Poverty in Greece, 2nd ed.; Henrich-Boll Stiftung: Thessaloniki, Greece, 2020; pp. 7–11. Available online: https://gr.boell.org/en/2020/01/15/energy-poverty-greece-20 (accessed on 1 May 2021).
- Thayyib Sahini, K.M. Poverty, environment and climate change. In GREEN ENERGY Economy, Economics and Politics, 1st ed.; Tulsidas, H., Thayyib, S., Kadher-Mohien, U., Eds.; CRC Press: London, UK, 2010; pp. 309–317. [Google Scholar] [CrossRef]
- Verma, A.K. Sustainable Development and Environmental Ethics. Int. J. Environ. Sci. 2019, 10, 1–5. [Google Scholar]
- Cantarero, M.M.V. Of renewable energy, energy democracy, and sustainable development: A roadmap to accelerate the energy transition in developing countries. Energy Res. Soc. Sci. 2020, 289, 125779. [Google Scholar] [CrossRef]
- Sadorsky, P. Wind energy for sustainable development: Driving factors and future outlook. J. Clean. Prod. 2021, 289, 125779. [Google Scholar] [CrossRef]
- IRENA. International Renewable Energy Agency, IRENA, 2019. Available online: https://www.irena.org//media/files/irena/agency/publication/2019/oct/irena_future_of_wind (accessed on 1 May 2021).
- Wolsink, M. Wind power implementation: The nature of public attitudes: Equity and fairness instead of ‘backyard motives’. Renew. Sustain. Energy Rev. 2000, 21, 960–1481. [Google Scholar] [CrossRef]
- Wüstenhagen, R.; Wolsink, M.; Bürer, M.J. Social acceptance of renewable energy innovation: An introduction to the concept. Energy Policy 2006, 35, 2683–2691. [Google Scholar] [CrossRef]
- Hernandez, C.O.M.; Shadman, M.; Amiri, M.; Silva, C.; Estefen, S.F.; Rovere, E. Environmental impacts of offshore wind installation, operation and maintenance, and decommissioning activities: A case study of Brazil. Renew. Sustain. Energy Rev. 2021, 144, 110994. [Google Scholar] [CrossRef]
- Keeley, A.R.; Komatsubara, K.; Managi, S. The value of invisibility: Factors affecting social acceptance of renewable energy. Energy Sources Part B Econ. Plan. Policy 2021, 144, 1–20. [Google Scholar] [CrossRef]
- Devine-Wright, P. Rethinking NIMBYism: The role of place attachment and place identity in explaining place-protective action. J. Community Appl. Soc. Psychol. 2009, 19, 426–441. [Google Scholar] [CrossRef]
- Firestone, J.; Hirt, C.; Bidwell, D.; Gardner, M.; Dwyer, J. Faring well in offshore wind power siting? Trust, engagement and process fairness in the United States. Energy Res. Soc. Sci. 2019, 62, 101393. [Google Scholar] [CrossRef]
- Walker, G.; Devine-Wright, P.; Hunter, S.; High, H.; Evans, B. Trust and community: Exploring the meanings, contexts and dynamics of community renewable energy. Energy Policy 2010, 38, 2655–2663. [Google Scholar] [CrossRef]
- Skiniti, G.; Tsoutsos, T. Society in energy transition and justice, Social acceptance and contribution in Wind energy projects. In A Sustainable Green Future—Perspectives on Energy, Economy, Industry, Cities and Environment, 1st ed.; Oncel, S.S., Ed.; Springer Nature: Berlin/Heidelberg, Germany, 2023. [Google Scholar]
- Cousse, J.; Wüstenhagen, R.; Schneider, N. Mixed feelings on wind energy: Affective imagery and local concern driving social acceptance in Switzerland. Energy Res. Soc. Sci. 2020, 70, 101676. [Google Scholar] [CrossRef]
- Martínez-Mendoza, E.; Rivas-Tovar, L.A.; Fernández-Echeverría, E.; Fernández-Lambert, G. Social impact of wind energy in the Isthmus of Tehuantepec, Mexico, using Likert-fuzzy. Energy Strategy Rev. 2020, 32, 100567. [Google Scholar] [CrossRef]
- Mäntymaa, E.; Pouta, E.; Hiedanpää, J. Forest owners’ interest in participation and their compensation claims in voluntary landscape value trading: The case of wind power parks in Finland. For. Policy Econ. 2021, 124, 102382. [Google Scholar] [CrossRef]
- Devine-Wright, P.; Wiersma, B. Understanding community acceptance of a potential offshore wind energy project in different locations: An island-based analysis of ‘place-technology fit’. Energy Policy 2020, 137, 111086. [Google Scholar] [CrossRef]
- Hallan, C.; González, A. Adaptive responses to landscape changes from onshore wind energy development in the Republic of Ireland. Land Use Policy 2020, 97, 104751. [Google Scholar] [CrossRef]
- Cronin, Y.; Cummins, V.; Wolsztynski, E. Public perception of offshore wind farms in Ireland. Mar. Policy 2021, 134, 104814. [Google Scholar] [CrossRef]
- Vuichard, P.; Broughel, A.; Wüstenhagen, R.; Tabi, A.; Knauf, J. It local and bird-friendly: Exploring the social acceptance of wind energy in Switzerland, Estonia, and Ukraine. Energy Res. Soc. Sci. 2022, 88, 102508. [Google Scholar] [CrossRef]
- Sæþórsdóttir, A.D.; Ólafsdóttir, R. Not in my back yard or not on my playground: Residents and tourists’ attitudes towards wind turbines in Icelandic landscapes. Energy Sustain. Dev. 2020, 54, 127–138. [Google Scholar] [CrossRef]
- Lienhoop, N. Acceptance of wind energy and the role of financial and procedural participation: An investigation with focus groups and choice experiments. Energy Policy 2018, 118, 97–105. [Google Scholar] [CrossRef]
- Haque, A.N.; Lemanski, C.; De Groot, J. Why do low-income urban dwellers reject energy technologies? Exploring the socio-cultural acceptance of solar adoption in Mumbai and Cape Town. Energy Res. Soc. Sci. 2021, 74, 101954. [Google Scholar] [CrossRef]
- De Gobbi, M.S. Gender and the environment: Increasing enterprise productivity and improving occupational safety and health conditions. Field Actions Sci. Rep. J. Field Actions 2013, 9. Available online: https://journals.openedition.org/factsreports/2388 (accessed on 1 June 2021).
- Naderi, I.; Van Steenburg, E.; Naderi, I. Me first, then the environment: Young Millennials as green consumers. Young Consum. 2018, 19, 280–295. [Google Scholar] [CrossRef]
- Ziouzios, D.; Karlopoulos, E.; Fragkos, P.; Vrontisi, Z. Challenges and Opportunities of Coal Phase-Out in. Climate 2021, 9, 115. [Google Scholar] [CrossRef]
- Kondili, E.; Kaldellis, J.K. 2.16—Environmental-Social Benefits/Impacts of Wind Power. Comprehensive Renewable Energy, 2nd ed.; Sayigh, A., Ed.; Elsevier: Oxford, UK, 2012; Volume 2.16, pp. 503–539. [Google Scholar] [CrossRef]
- Ul-Mulk, R.; Reynaud, E. Sustainable Attitudes and Behavioural Intentions Towards. Rech. En. Sci. De Gest. 2018, 129, 151–178. [Google Scholar] [CrossRef]
- Hurtado, J.P.; Fernández, J.; Parrondo, J.L.; Blanco, E. Spanish method of visual impact evaluation in wind farms. Renew. Sustain. Energy Rev. 2004, 8, 483–491. [Google Scholar] [CrossRef]
- Gkeka-Serpetsidaki, P.; Tsoutsos, T. A methodological framework for optimal siting of offshore wind farms: A case study on the island of Crete. Energy 2022, 239, 122296. [Google Scholar] [CrossRef]
- Denholm, P.; Hand, M.; Jackson, M.; Ong, S. Land-Use Requirements of Modern Wind Power Plants in the United States; Department of Energy, National Renewable Energy Laboratory, United States: Golden, CO, USA, 2009. [CrossRef]
- Cabrera-Cruz, S.A.; Cervantes-Pasqualli, J.; Franquesa-Soler, M.; Muñoz-Jiménez, Ó.; Rodríguez-Aguilar, G.; Villegas-Patraca, R. Estimates of aerial vertebrate mortality at wind farms in a bird migration corridor and bat diversity hotspot. Glob. Ecol. Conserv. 2020, 22, e00966. [Google Scholar] [CrossRef]
- Lie Dahl, E.; May, R.; Nygård, T.; Åstrøm, J.; Diserud, O.H. Repowering Smøla wind-power plant. An assessment of avian conflicts. Norweigian Institute for Nature Research (NINA) Report 1135. Renew. Energy 2015, 75, 11–21. [Google Scholar] [CrossRef]
- De Lucas, M.; Ferrer, M.; Bechard, M.J.; Muñoz, A.R. Griffon vulture mortality at wind farms in southern Spain: Distribution. Biol. Conserv. 2012, 147, 184–189. [Google Scholar] [CrossRef]
- Arnett, E.B.; Johnson, G.D.; Erickson, W.P.; Hein, C.D. A Synthesis of Operational Mitigation Studies to Reduce Bat Fatalities at Wind Energy Facilities in North America; Report; National Renewable Energy Laboratory: Austin, TX, USA, 2013. [Google Scholar]
- Perrow, M. Wildlife and Wind Farms—Conflicts and Solutions: Onshore: Potential Effects; Pelagic Publishing: Exeter, UK, 2017; p. 220. [Google Scholar]
- González, J.S.; Lacal-Arántegui, R. A review of regulatory framework for wind energy in European Union countries: Current state and expected developments. Renew. Sustain. Energy Rev. 2016, 56, 588–602. [Google Scholar] [CrossRef]
- Brennan, N.; Rensburg, T.M. Public preferences for wind farms involving electricity trade and citizen engagement in Ireland. Energy Policy 2020, 147, 111872. [Google Scholar] [CrossRef]
- Johansen, K.; Emborg, J. Wind farm acceptance for sale? Evidence from the Danish wind farm co-ownership scheme. Energy Policy 2018, 117, 413–422. [Google Scholar] [CrossRef]
- Fraser, T.; Chapman, A. Social equity impacts in Japan’s mega-solar siting process. Energy Sustain. Dev. 2018, 42, 136–151. [Google Scholar] [CrossRef]
- Mahler, D.G.; Yonzan, N.; Lakner, C.; Aguilar, R.A.C.; Wu, H. Updated Estimates of the Impact of COVID-19 on Global Poverty: Turning the Corner on the Pandemic in 2021? World Bank Blog, 2021. Available online: https://blogs.worldbank.org/opendata/updated-estimates-impact-covid-19-global-poverty-turning-corner-pandemic-2021#:~:text=In%202021%2C%20we%20project%20global,2021%20before%20the%20pandemic%20hit (accessed on 1 June 2021).
- Ziozas, N.; Tsoutsos, T. Clean Energy Transition in Southeast Europe: The Paradigm of Greece from a Fossil Fuel Mediator to a Community Energy Hub. In Renewable Energy Communities and the Low Carbon Energy Transition in Europe; Coenen, F.H.J.M., Hoppe, T., Eds.; Palgrave Macmillan: Cham, Switzerland, 2021. [Google Scholar] [CrossRef]
- Tsagkari, M. The need for gender-based approach in the assessment of local energy projects. Energy Sustain. Dev. 2022, 68, 40–49. [Google Scholar] [CrossRef]
- Liu, L.; Bouman, T.; Perlaviciute, G.; Steg, L. Public participation in decision making, perceived procedural fairness and public acceptability of renewable energy projects. Energy Clim. Chang. 2020, 1, 100013. [Google Scholar] [CrossRef]
- Joshi, A.; Kale, S.; Chandel, S.; Pal, D. Likert Scale: Explored and Explained. Br. J. Appl. Sci. Technol. 2015, 7, 396–403. [Google Scholar] [CrossRef]
- Field, A. Discovering Statistics Using IBM SPSS Statistics, 5th ed.; SAGE Publications Ltd.: London, UK, 2018. [Google Scholar]
- Gorsuch, R.L. Factor Analysis, 2nd ed.; Lawrence Erlbaum Associates: Hillside, NJ, USA, 1983. [Google Scholar]
- Stevens, J.P. Applied Multivariate Statistics for the Social Sciences, 5th ed.; Erlbaum: Hillsdale, NS, USA, 2009. [Google Scholar]
Publisher’s Note: MDPI stays neutral with regard to jurisdictional claims in published maps and institutional affiliations. |
© 2022 by the authors. Licensee MDPI, Basel, Switzerland. This article is an open access article distributed under the terms and conditions of the Creative Commons Attribution (CC BY) license (https://creativecommons.org/licenses/by/4.0/).