Article

Application of Random Forest Model Integrated with Feature Reduction for Biomass Torrefaction

1
School of Mine, China University of Mining and Technology, Xuzhou 221116, China
2
State Key Laboratory of Coal Combustion, School of Energy and Power Engineering, Huazhong University of Science and Technology, Wuhan 430074, China
3
School of Low-Carbon Energy and Power Engineering, China University of Mining and Technology, Xuzhou 221116, China
*
Author to whom correspondence should be addressed.
Sustainability 2022, 14(23), 16055; https://doi.org/10.3390/su142316055
Submission received: 22 October 2022 / Revised: 17 November 2022 / Accepted: 29 November 2022 / Published: 1 December 2022

Abstract

:
A random forest (RF) model integrated with feature reduction was implemented to predict the properties of torrefied biomass based on feedstock and torrefaction conditions. Four features were selected for the prediction of fuel ratio (FR) and nitrogen content (Nt), and five features were selected for O/C and H/C ratios and HHV values. The results showed that the feature-reduced model had excellent prediction performance with the values of R2 higher than 0.93 and RMSE less than 0.58 for all targets. Moreover, partial dependence analysis (PDA) was performed to quantify the impacts of selected features and torrefaction conditions on the targets. Temperature was the dominant factor for FR, O/C and H/C ratios, and HHV values, whereas Nt was determined most on the nitrogen content in the feedstock (Ni). This study provided comprehensive information for understanding biomass torrefaction.

1. Introduction

The demand for renewable energy sources is growing rapidly worldwide due to the energy crisis and environmental pollution caused by excessive consumption of fossil fuels [1]. As the only carbon-based renewable energy resource, biomass is considered to be an important alternative to fossil fuels since it can not only be used for power generation and heat supply, but can also be converted into gases, liquids, chemicals, and solid products with zero CO2 emissions throughout its life cycle [2,3]. However, raw biomass often exhibits high moisture content and low calorific values, which are adverse to its utilization [4]. To upgrade the quality of raw biomass, various pretreatment technologies have been proposed, including pyrolysis, hydrothermal, torrefaction, etc; among them, torrefaction, which is traditionally performed at 200~300 °C in an inert atmosphere, is considered to be the most economic and efficient pretreatment technology [5,6,7].
To evaluate the torrefaction process, it is necessary to determine the properties of torrefied biomass. Generally, proximate (moisture, fixed carbon, volatile matter, and ash contents), ultimate (CHON contents), and high heating value (HHV) analyses are essentially implemented. Proximate and ultimate analyses require special instruments and complex procedures [8], while HHV is either experimentally tested using a calorimeter bomb or mathematically calculated based on the ultimate and proximate analyses results [9]. Thus, repetitive experiments, instrumental analysis or mathematical calculations that consume lots of time, costs and manpower are needed. Therefore, researchers have been trying to develop a method to estimate torrefied product properties from those of feedstock without various tests and experiments.
Due to the strong ability to deal with complex and non-linear problems, the application of machine learning (ML) methods to biomass torrefaction has received growing attention in recent years. Several ML models, involving artificial neural network (ANN), gradient boosting trees (GBT), random forest (RF), support vector machines (SVM), etc., were employed to predict the properties of torrefied biomass. However, these studies mainly focused on the HHV [8,9,10,11,12] and mass yield [1,10,13,14,15], while other properties of torrefied biomass which are also important parameters for evaluating the performance of torrefied biomass, including fuel ratio (FR, fixed carbon content divided by volatile content), and O/C and H/C (oxygen or hydrogen content divided by carbon content) ratios [16] were rarely reported. Moreover, nitrogen content, which is the dominant source of NOx and other nitrogen containing pollutants, such as NH3 and HCN during biomass conversion was also not of concern until now. Therefore, more efforts are needed to provide Supplemental information to the torrefied biomass by developing ML algorithms.
In addition to prediction, the influences of feedstock and torrefaction conditions on torrefaction process are also critical focuses of researches to provide internal information for understanding torrefaction mechanisms. Other than the ANNs, black-box models which were most frequently used in existing literatures [17], RF models have the advantage of processing the correlation between input and output variables for both classification and regression problems [18]. Leng et al. [15] analysed the impact of influential factors on the yields of three-phase pyrolysis products and bio-oil HHV using a RF model. Tang et al. [19] also discussed the effects of input features and the resulting interactions exerted on the pyrolysis process based on a RF model. However, to the authors’ knowledge, the implementation of RF in analyzing the torrefaction process has not been reported.
As reviewed above, there are massive gaps in ML algorithms application to biomass torrefaction, including the prediction of properties and their intrinsic relations with raw feedstock and torrefaction conditions. In this study, a RF model was employed to predict torrefied biomass properties including the FR, H/C and O/C ratios, HHV, and N content (Nt). The influences of the feedstock and torrefaction conditions were then investigated by feature reduction and partial dependence analysis (PDA). The proximate and ultimate analyses of raw biomass and the torrefaction conditions (temperature, duration time) were assigned as input variables, while the FR, H/C and O/C ratios, HHV and Nt of torrefied biomass were labeled as targets. The contributions of each input feature to the targets as well as their interactions were also analyzed. The results could provide comprehensive insights into biomass torrefaction.

2. Materials and Methods

2.1. Data Collection and Pre-Processing

515 data points were extracted from 67 journal publications, including our previous studies [20], to create a dataset; the detailed information is provided in the supplementary materials (Table S1). Notably, only the traditional torrefaction performed at 200~300 °C in N2, He, Ar, and anoxic atmosphere was taken into account. Most data were obtained from the texts, the tables in the literatures and their corresponding supplementary materials. To obtain data not directly listed, WebPlotDigitizer software (https://apps.automeris.io/wpd/) was used to extract the necessary data from the figures. Diverse biomass was employed as feedstock whether it had been dried or not, including agricultural residues, forestry residues, energy crops, leaves, fruit wastes, sewage sludge, and so on. The proximate and ultimate analyses results of the raw biomass involving moisture (MO, wt.%), volatile matter (VM, wt.%), fixed carbon (FC, wt.%), ash (Ash, wt.%) contents and CHON contents (wt.%) as a function of torrefaction conditions involving temperature (Temp, °C) and duration time (Time, min) were assigned as input variables. The FR, O/C and H/C ratios, HHV, and Nt of the torrefied biomass were assigned as the output targets.
Correlation analysis was applied to the dataset, and linear dependencies among all features and targets were measured using Pearson’s correlation coefficient (PCC) [21].
r = i = 1 n ( x i x ¯ ) i = 1 n ( y i y ¯ ) i = 1 n ( x i x ¯ ) 2 i = 1 n ( y i y ¯ ) 2
where r is the value of PCC; x ¯ and y ¯ are the means of the feature and the target, respectively. r is ranged from −1 to 1, where 0 means no linear correlation, and a negative value means a negative correlation, while a positive value indicates a positive correlation. It should be noted that the lack of a linear correlation between input features and output targets does not imply the absence of other relationships.
To obtain a uniform range among the variables, the features and the targets were then normalized using Z-score standardization using Equation (2):
x i = x i μ s
where xi is the value of feature i; xi* is the normalized value of xi; μ is the mean value of xi, and s represents its standard deviation.
After pre-processing, the data points were randomly divided into training and validation subsets at a ratio of 80% to 20% for the evaluation of the developed model. To improve the model’s performance, a 10-fold cross-validation method (Figure 1) was applied during the training process to tune the hyper-parameter using a trial-and-error method, including the number of trees in the forest (n_estimators), the maximum depth of each tree (max_depth), and the number of features to consider when seeking the best split (max_features). To accomplish this, the dataset was randomly shuffled and split into 10 non-overlapping folds; then, nine of them were employed to train the ML model and the remaining one was used for testing for repeatedly 10 times with a different piece of test fold. Finally, the optimal hyper-parameters were determined, as shown in Table 1.

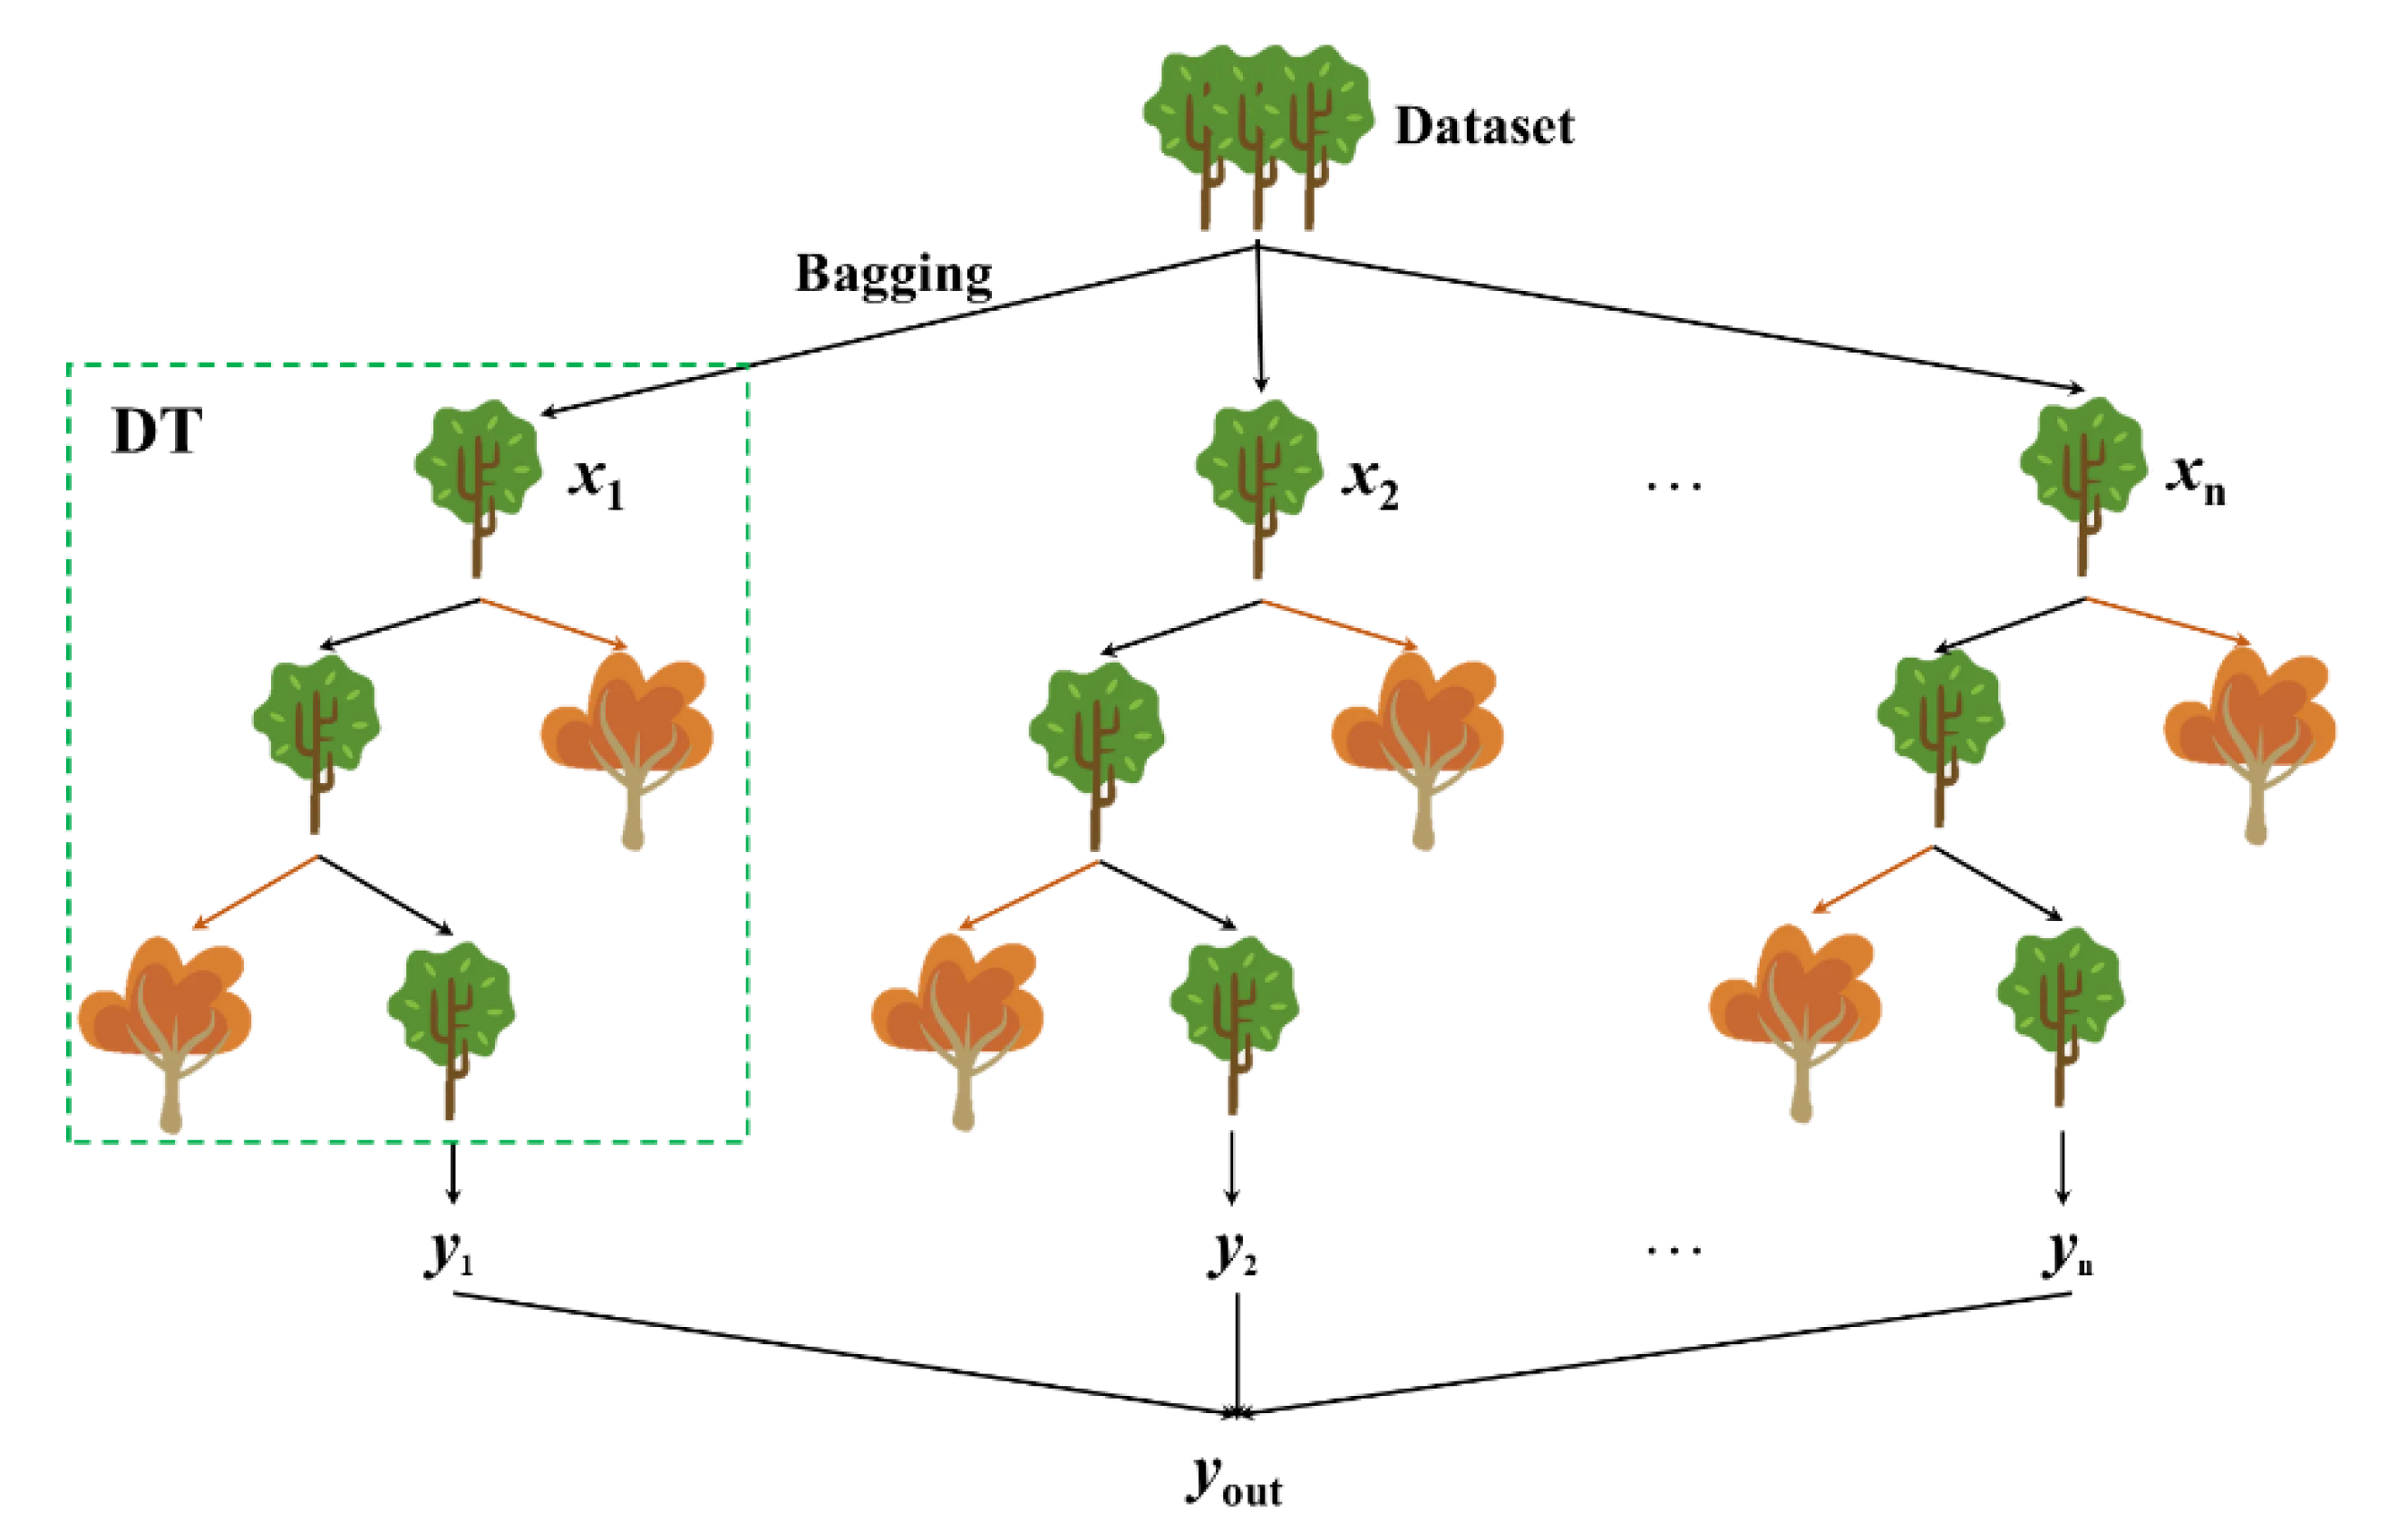
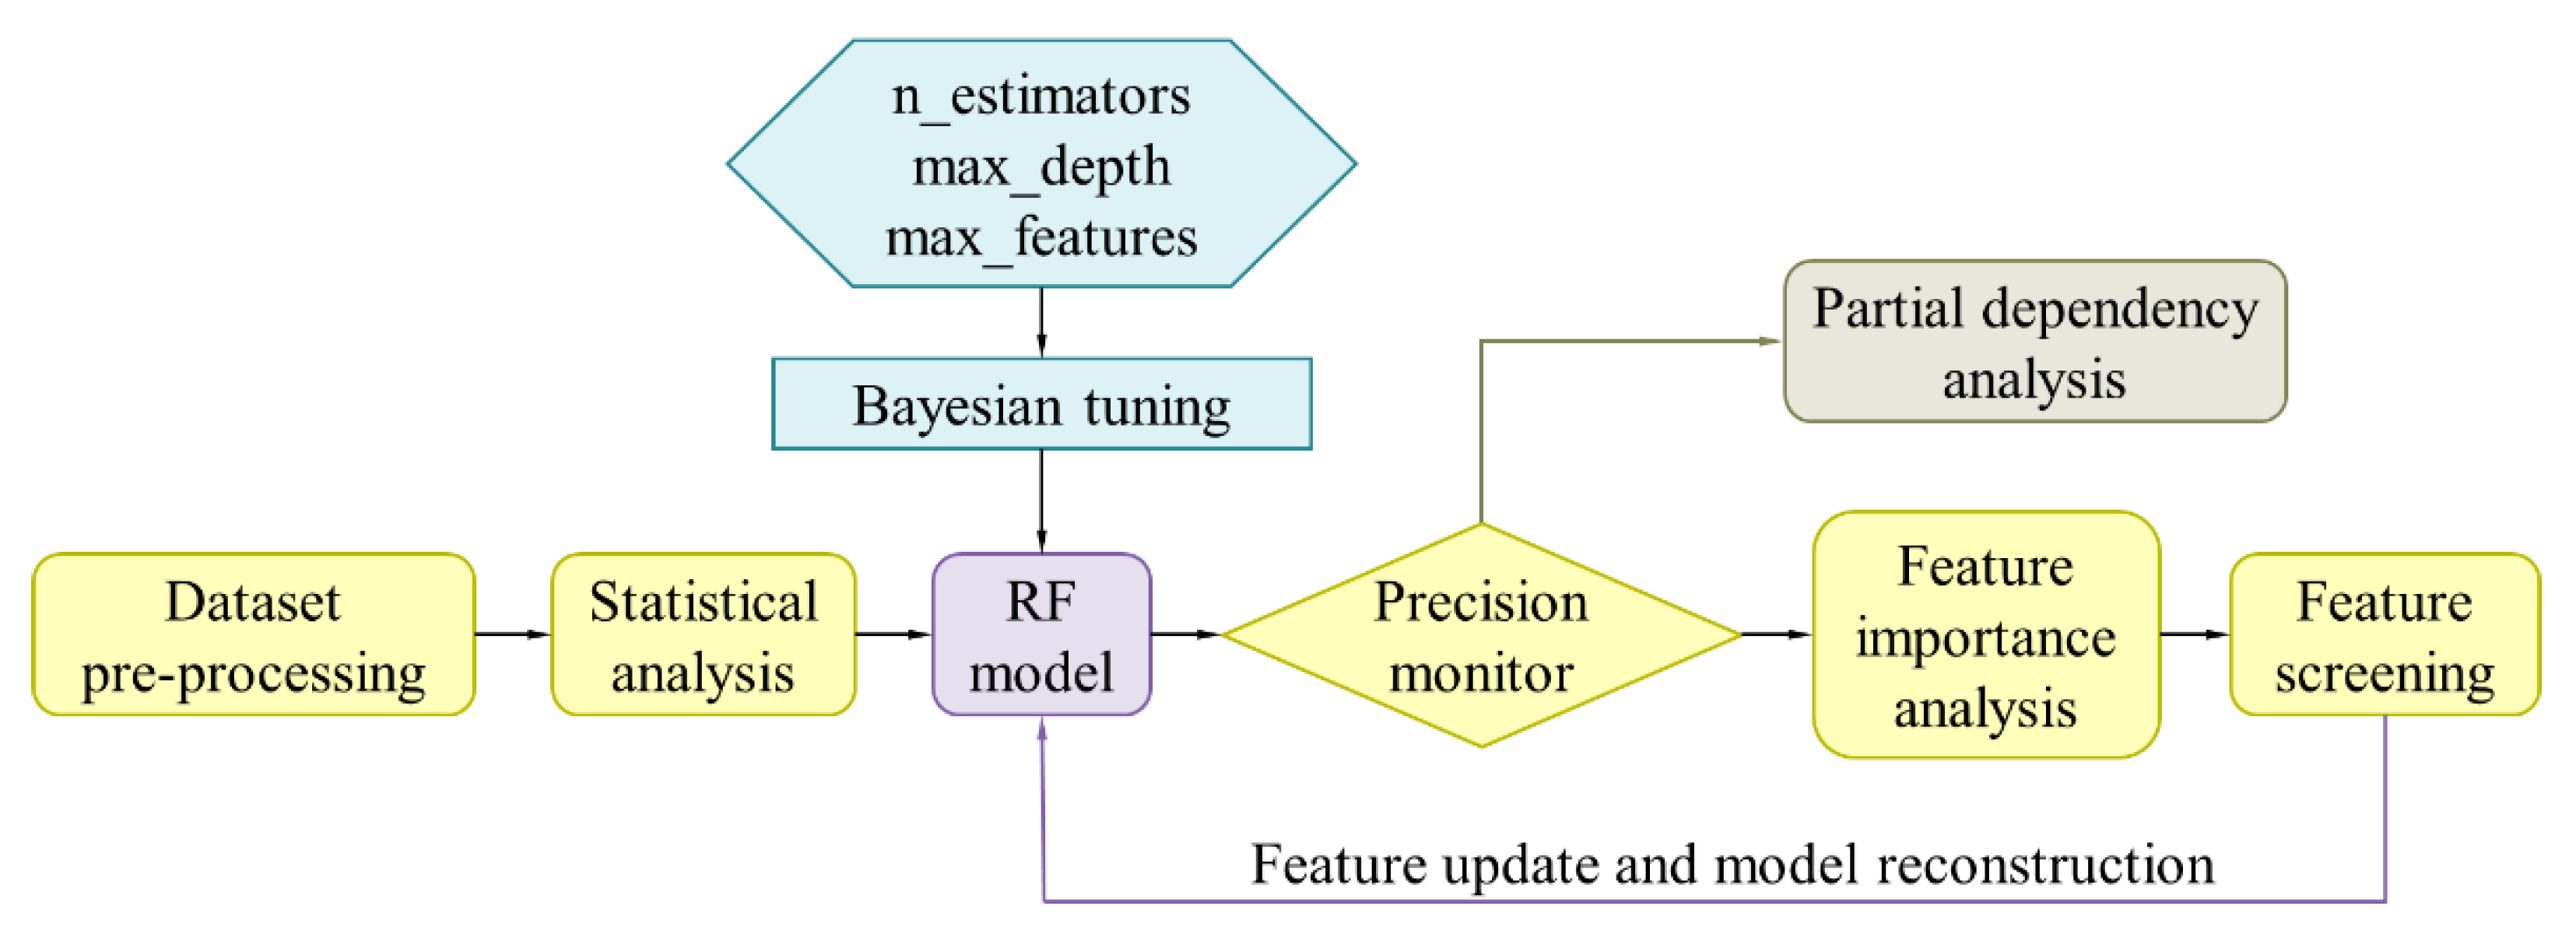
2.2. RF Model Description

As an ensemble learning method introduced by Breiman in 2001 [18], a random forest (RF) model consists of multiple decision trees and can be used to solve both classification and regression problems [22,23]. For each tree, it generally contains a root node, several internal nodes, and several leaf nodes. The leaf nodes correspond to decision outcomes, and each of the other nodes corresponds to a feature test. The samples in each node are divided into child nodes according to the features’ splitting results. The path from the root node to each leaf node is a decision sequence. The purpose is to produce a tree with a strong generalization ability, that is, strong ability to deal with unseen examples.
The structure of the RF model is shown in Figure 2 and the definition is given by Equation (3).
{ h ( x , ϴ k ) , k = 1 , 2 , , K }
where x represents an input vector, {ϴk} is the random vector based on independent identical distribution, and K is the number of trees.
The RF begins with the random split of the training set into multiple subsets based on bootstrap aggregating (bagging) strategy involving “in-bag” (IB) and “out-of-bag” (OOB) samples. With considering the outputs of all trees which are trained with subsets and evaluated by the OOB samples to prevent overfitting, RF model is performed to determine the final predicted value. Finally, the test set is used to determine the model’s performance.
RF models exhibit low overfitting risk and high predictive accuracy because they utilize bagging and random feature selection strategies to construct several decorrelation decision trees and output the average value of their prediction results [24,25]. Moreover, RF models also show high tolerance to missing values, which is a significant superiority since data missing is very common in biomass related studies [26].

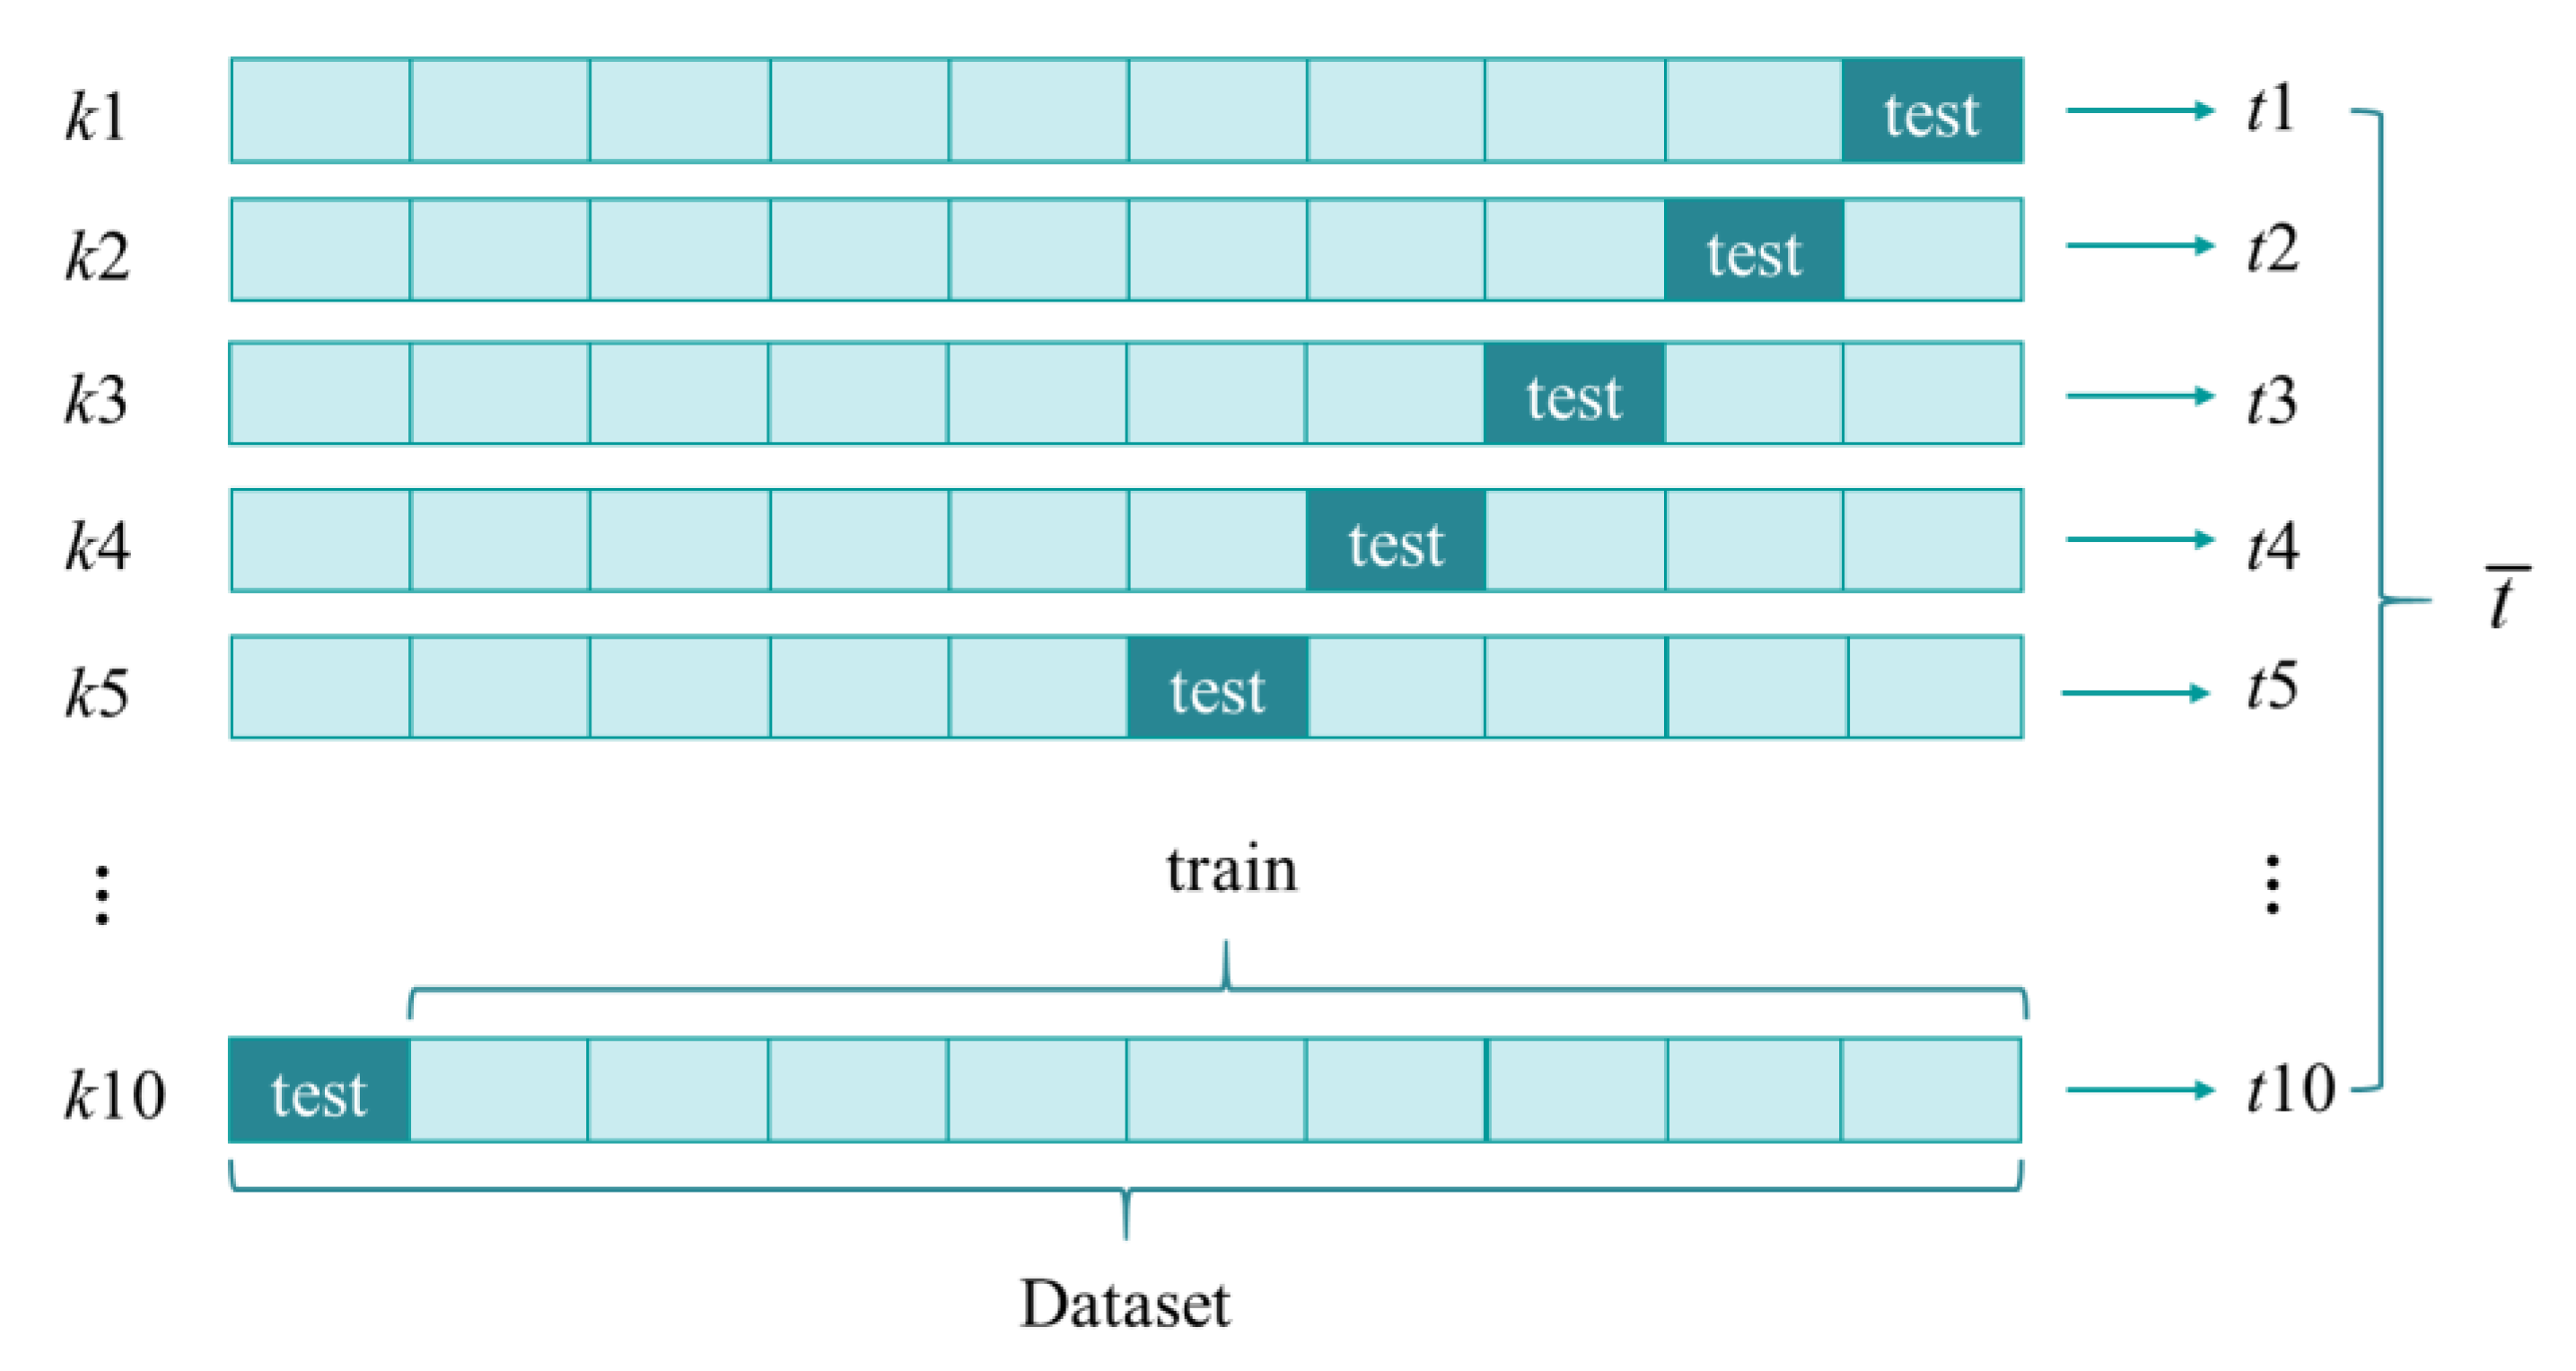
2.3. Performance Evaluation Criteria

The model’s performance was evaluated using the determination coefficient (R2) and the root mean square error (RMSE) [27]. Conceptually, a higher R2 and a lower RMSE indicate better model accuracy.
R 2 = 1 i = 1 N ( y ^ y ) 2 i = 1 N ( y ^ y ¯ ) 2
RMSE = i = 1 N ( y ^ y ) 2 N
where y ^ , y, and y ¯ are the predicted, actual, and mean values of the target, respectively; N is the total number of data points.

2.4. Feature Importance Analysis

Once the model was built and its prediction performance was evaluated, the relative importance of the features was then determined for further model optimization. In this study, the mean decrease impurity method [28] was applied to calculate the relative importance of raw biomass properties and torrefaction conditions in predicting targets. Then, features with nearly 80% importance were selected for further model optimization.
To gain a better understanding of how each feature affected the targets, partial dependence analysis (PDA) was performed. As there were 10 input features and 5 targets, only the influences of selected features on the corresponding target were visualized using the partial dependence plot (PDP), in which the relationship type involving a linear, monotonous, or more complicated connection for each selected feature on the target could be exposed [29]. Figure 3 illustrates the FR model workflow for the prediction of torrefied biomass properties based on raw biomass features and torrefaction conditions.

3. Results and Discussion

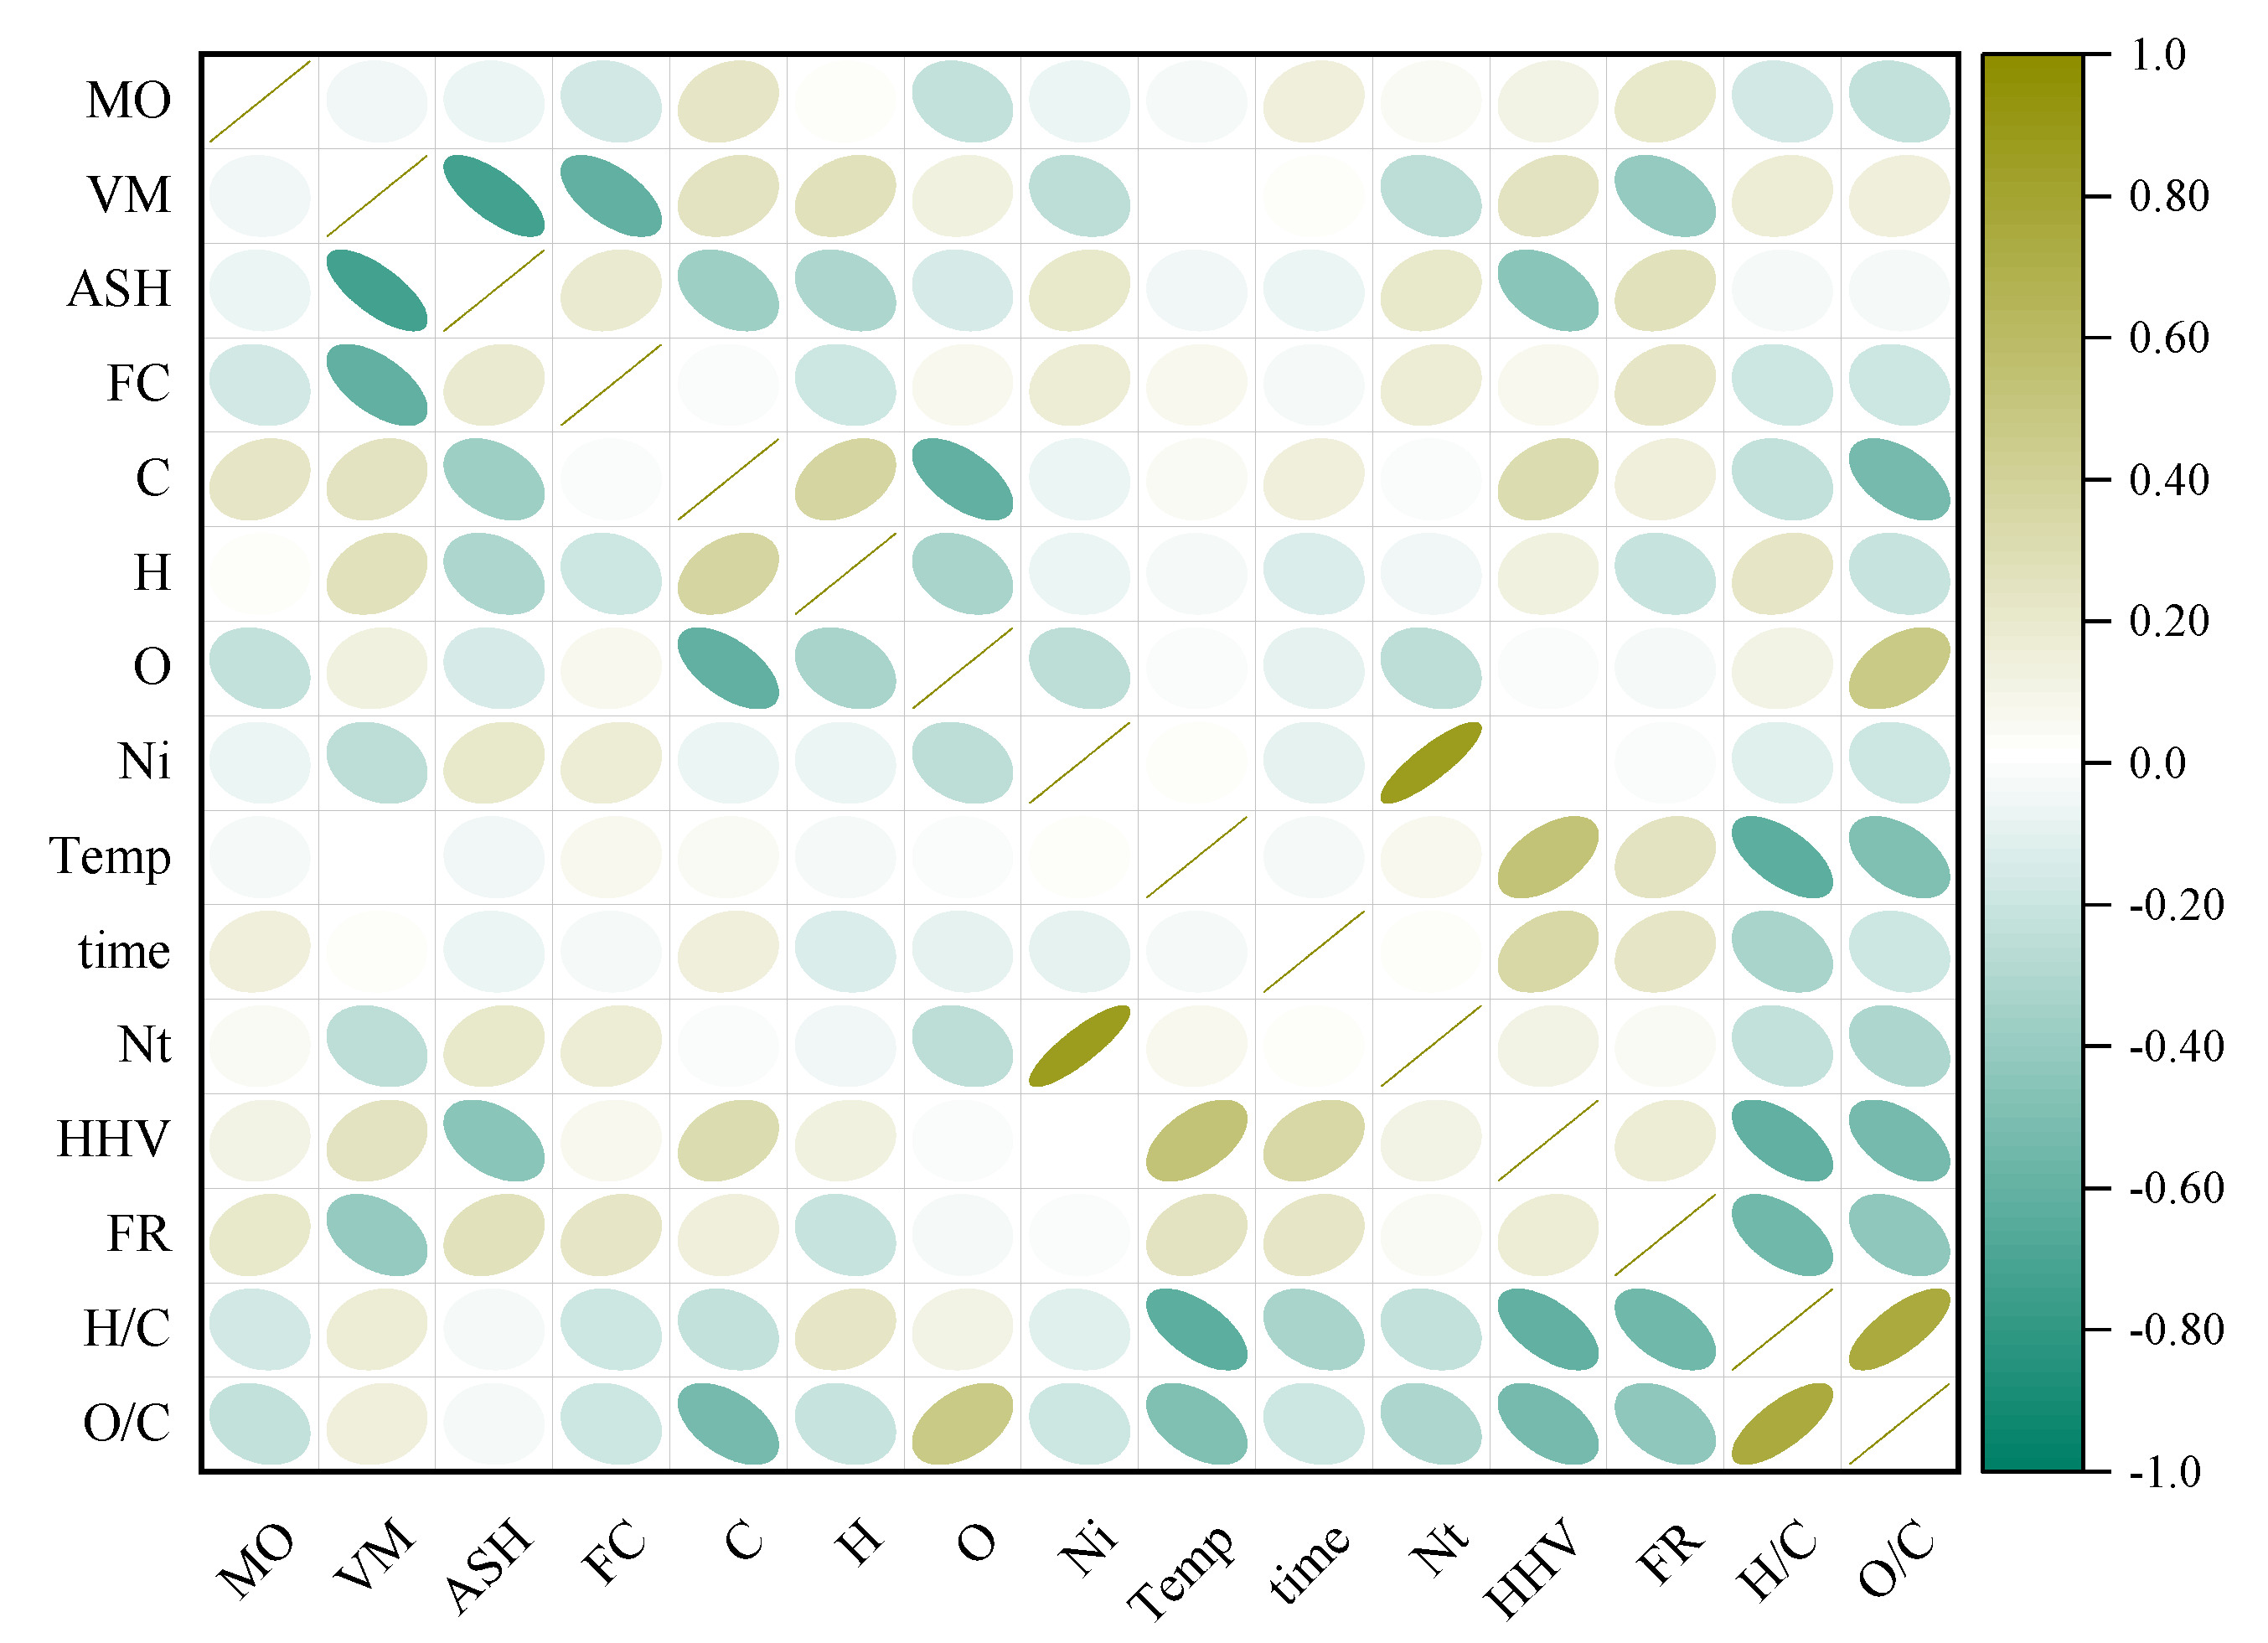
3.1. Dataset Description

Table 2 presents a statistical description of the dataset, including the units, counts, ranges, means, median values, and standard deviations of all inputs and outputs. A statistical distribution overview of the dataset is presented by violin-plots in Figure S1. For the inner boxplot, the interquartile range (IQR) was used to measure data variability. Points outside the range, i.e., outliers, were plotted individually with rhombus shape which would be directly removed from the dataset. The data distribution (outer) based on kernel density estimation facilitated visualization of data distribution.
According to Table 2 and Figure S1, the MO content of raw biomass ranged within 0~14.8 wt.%. The samples had VM content ranging from 32.2 to 96.4 wt.% with a median of 78.9 wt.%. ASH and FC contents were in the range of 0~32.58 wt.% and 1.67~61.4 wt.%, respectively. Regarding elemental compositions, the C content varied from 29.59 wt.% to 54.16 wt.% with a 45.1 wt.% median and a 48.83 wt.% plot peak. O content ranged from 11.37 to 61.55 wt.%, the plot peak of which was 44.25 wt.%. H content was in the range of 3.92 and 8.78 wt.%. Ni was widely distributed in the range of 0~14.29 wt.%; however, most feedstock had N content of approximate 0.37 wt.%. The significant variations in textural properties were attributed to diversity in the feedstock. For the torrefaction conditions, 250 °C was the most frequently employed temperature, closely followed by 300 °C. The duration time ranged from 10 to 360 min, among which, 30 min was most common.
Regarding the properties of torrefied biomass, FR varied between 0.021 and 7.19 with a mean value of 0.53, which is close to that of coal (0.5~2.0) [30], indicating that the combustibility of biomass was significantly improved by torrefaction. The density peaks of O/C and H/C plots were 0.71 and 0.11, respectively, which lie within the coal’s ratio ranges of 0.38~0.91and 0.02~0.28, respectively [31]. The reductions in O/C and H/C ratios benefitted to HHV, which ranged from 13.48 to 30.3 MJ/kg with a median of 20.67 MJ/kg. It is worth noting that the torrefied biomass had a lower N content than the feedstock, implying that torrefaction could decrease the N content of biomass and subsequently reduce the emissions of N-containing pollutants during the utilization process.
Figure 4 is the Pearson correlation matrix between any two variables, the detailed information of which was shown in Table S2. There were no significant linear correlations between any two features. Relatively strong negative correlations were observed for ASH-VM (−0.73) simply because the sum of the proximate analysis results should be 100%; therefore, Ash was removed from the input variables. The Nt exhibited a very strong linear connection with Ni (0.86), implying that the Nt highly depended on the feedstock’s nitrogen content.

3.2. Feature Importance

The relative importance of each input feature in predicting FR, H/C, O/C, Nt, and HHV of torrefied biomass is exhibited in Table 3. It can be seen that torrefaction temperature was the most important factor for FR, H/C, O/C, and HHV, the share of which was 40.33%, 37.32%, 30.69%, and 31.13%, respectively. Guo et al. [32] also reported that temperature was the most important factor influencing torrefaction. While for Nt, Ni was most crucial since it occupied a fairly high share of 54.38%, indicating that the nitrogen content in the torrefied biomass significantly depended on that of the raw material. Table 4 shows the selected features for each target.

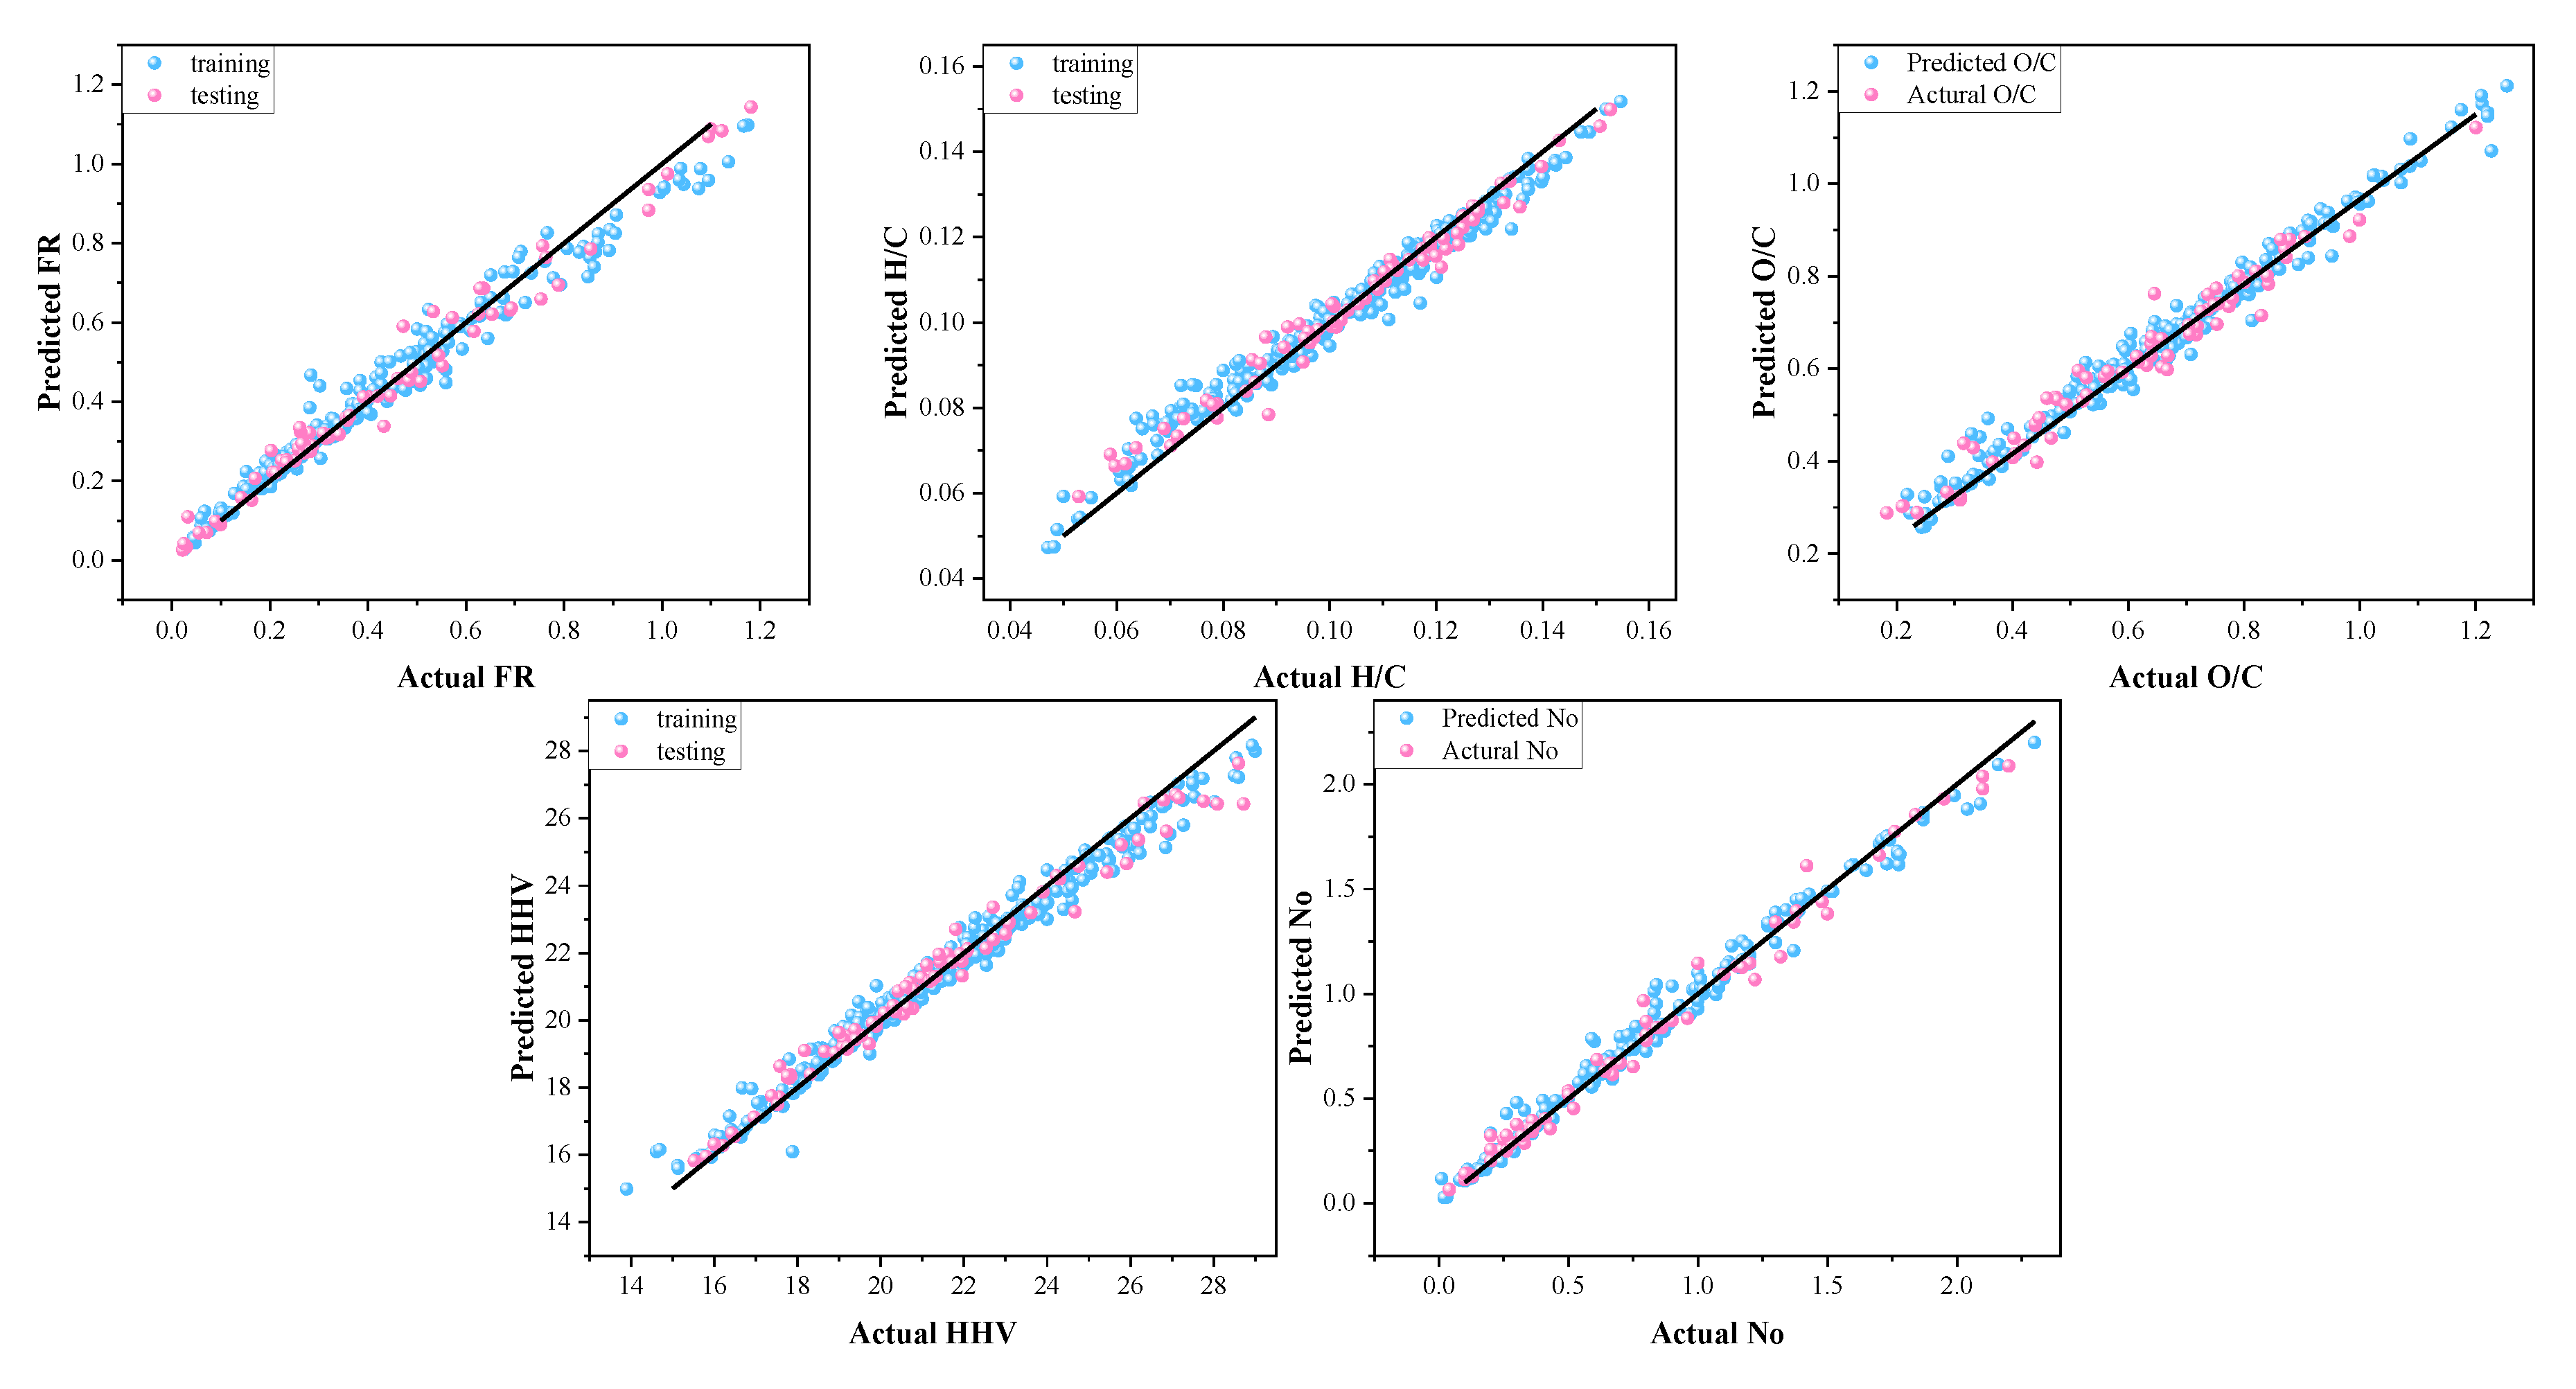
3.3. Prediction Performance of the Feature-Reduced Model

Figure 5 presents a comparison of predicted values and tested data for training and testing sets with selected features for each target. All data points were densely distributed along the black line of y = x, implying the equivalence between predicted values and actual data. The results of R2 and RMSE for both training and testing sets are shown in Table 5. R2 values for all targets’ training and testing sets were larger than 0.93, and RMSE values were also fairly acceptable. Therefore, the RF model with feature reduction could predict the FR, H/C, O/C, HHV, and Nt of torrefied biomass from the features of feedstock and torrefaction conditions for both training and testing sets with high precision. Compared with other models employed in existing literatures [8,9,10,11,12], the feature-reduced RF model developed in this study showed excellent performance in predicting the corresponding properties of torrefied biomass.

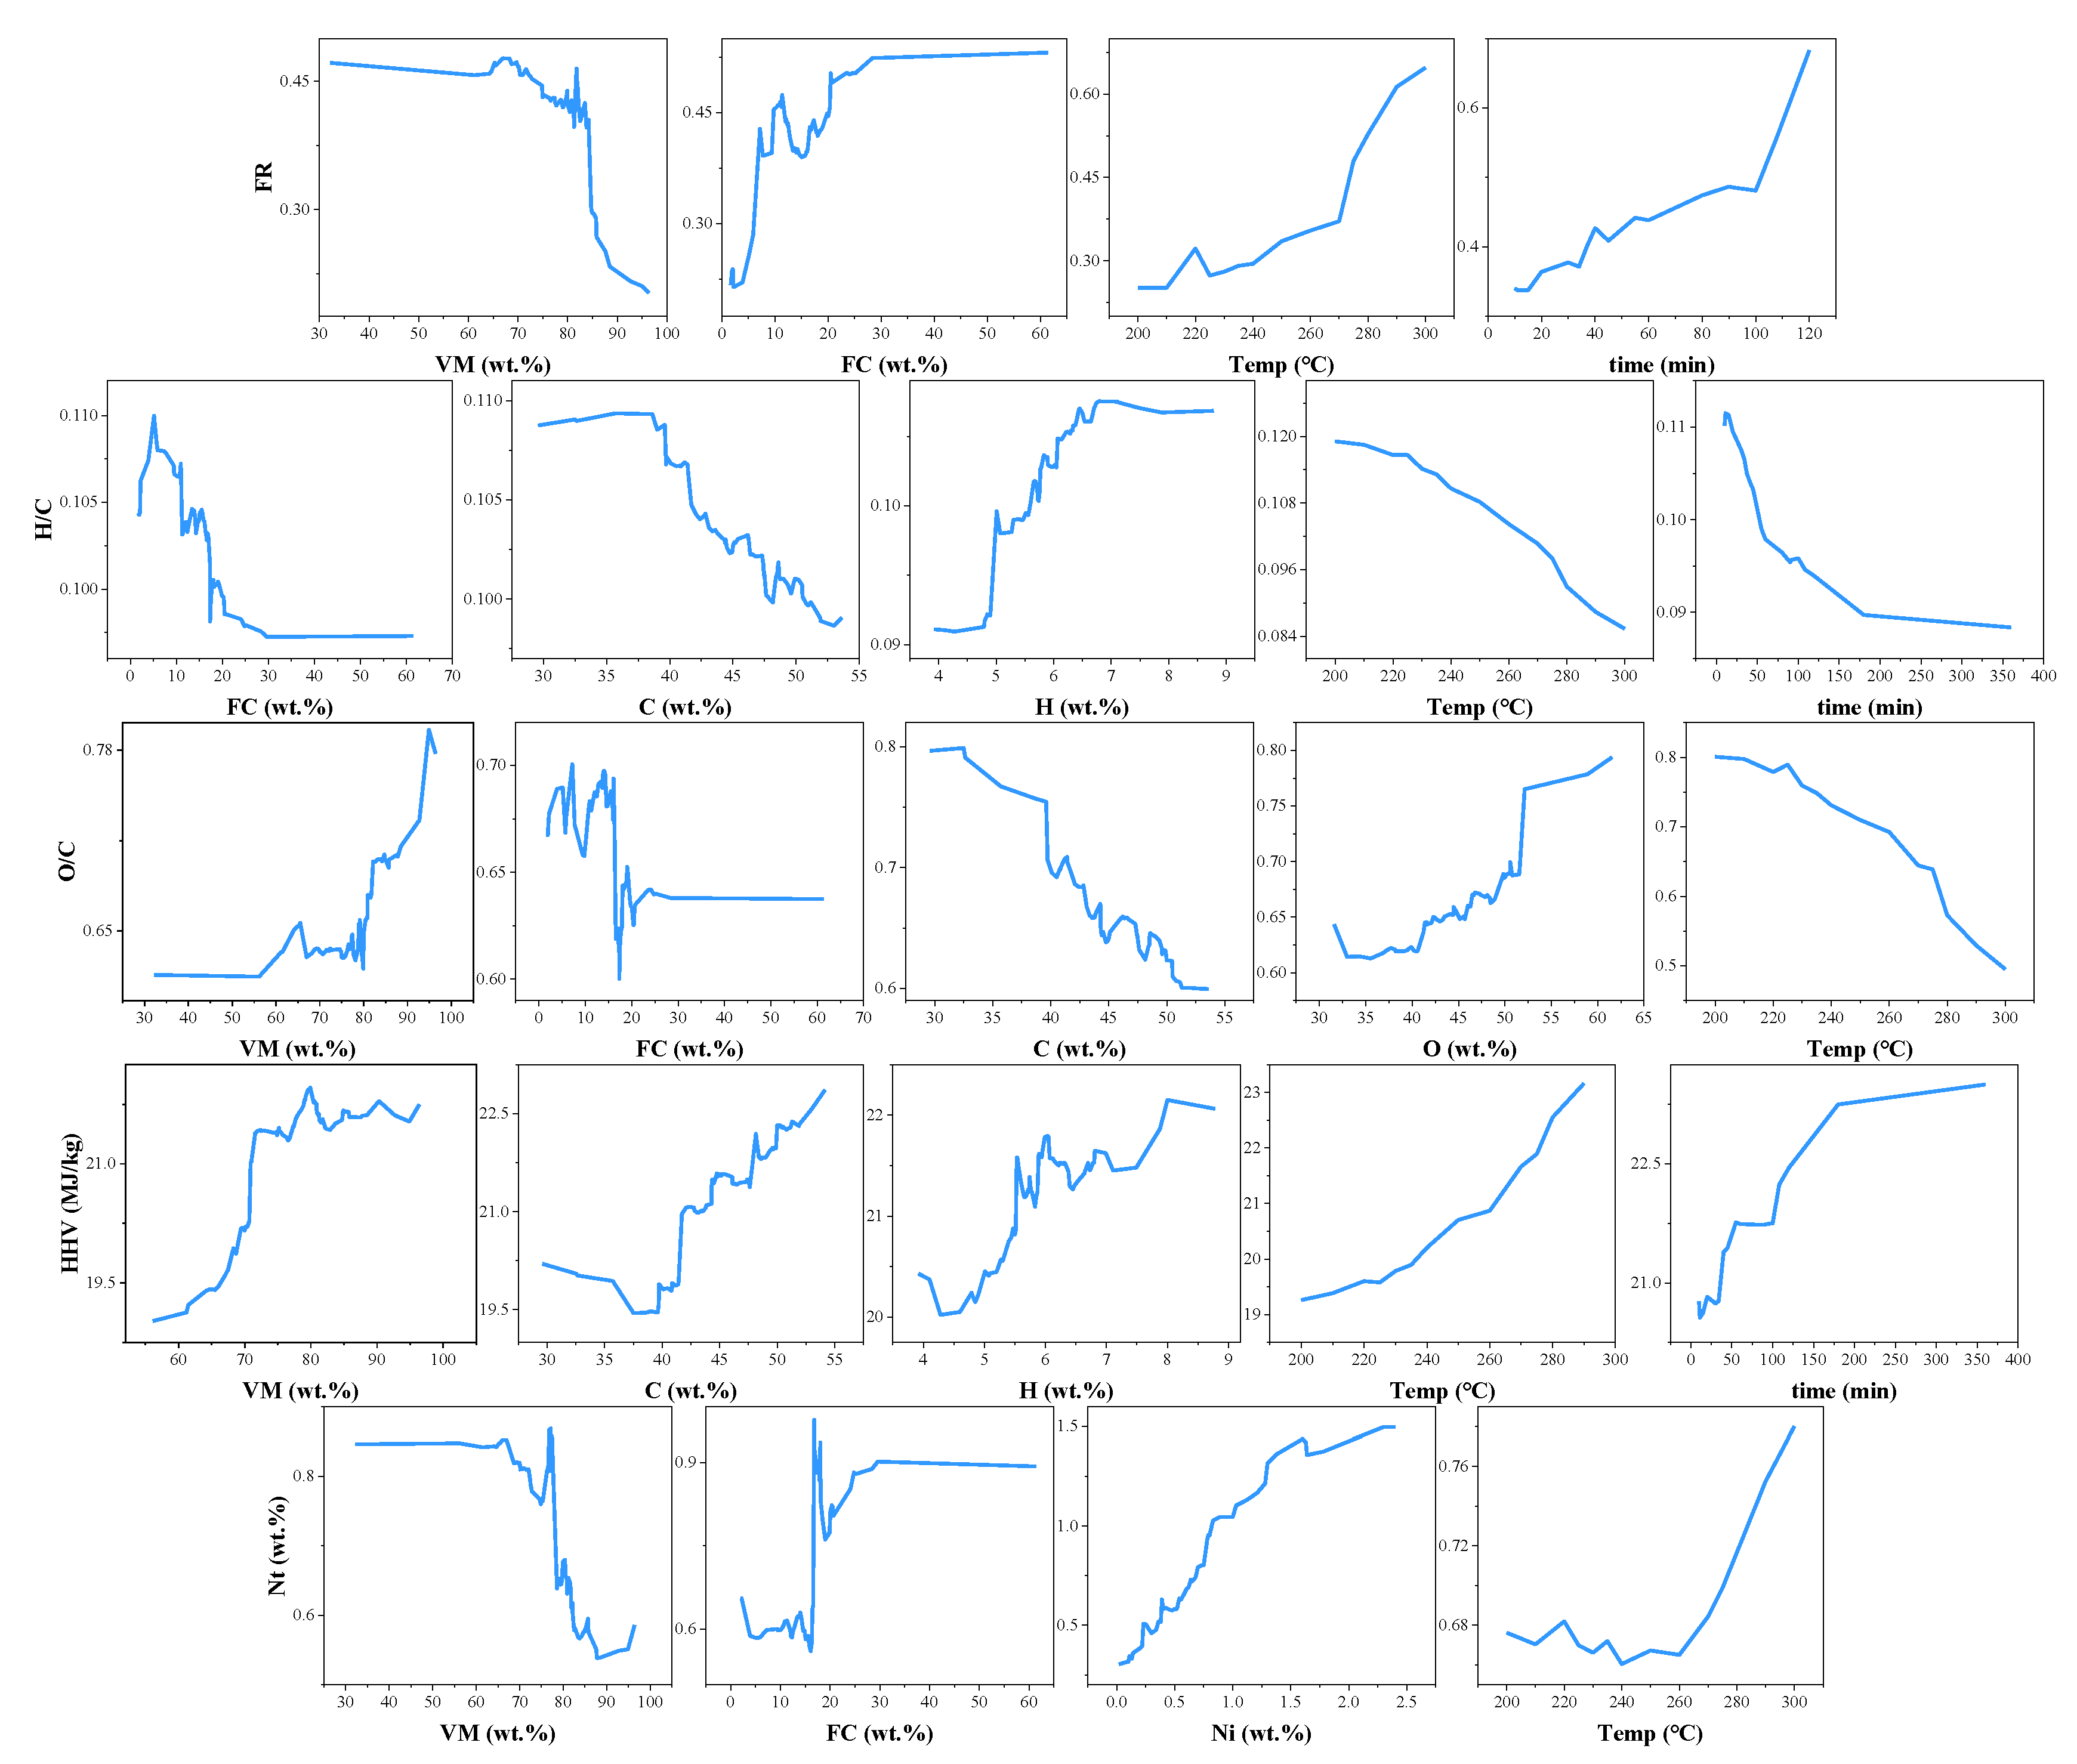
3.4. Partial Dependency

The partial dependences of the targets on selected features are shown in Figure 6. For FR, completely opposite effects were observed for VM and FC, implying that a higher FC content and a lower VM content of the feedstock is beneficial to the FR improvement of torrefied biomass. Temperature was the most influential factor with a contribution rate of as high as 40.33%. As temperature increased, a raising trend of FR was observed. Especially, as temperature reached to above 270 °C, the FR sharply increased, attributing to the more violent decomposition of the organic components which led to the decrease of VM. It was reported that hemicellulose was most sensitive to temperature, which decomposed between 200 and 350 °C, whereas cellulose and lignin decomposed above 250 °C [10]. A same trend was presented for the FR plot versus duration time. And FR increased more sharply when duration time exceeded 100 min, implying that a longer duration time is essential to the heat transfer into the solids to release VM. Due to this, an increase in duration time also raised the HHV of torrefied biomass and declined the H/C ratio which was affected by torrefaction severity [2]. However, the variation of HHV was slight when duration time was longer than 180 min, indicating that torrefaction for more than 180 min was of less necessary for HHV improvement. Thus, 100–180 min was appropriate duration time for biomass torrefaction. Temperature was also the dominant factor for H/C and O/C ratios. As temperature increased, both ratios sharply declined due to the release of a large amount of HO elements and relatively few C element mainly in the forms of CO2, CO and vapor [33,34]. Moreover, O/C and H/C ratios exhibited negative relationships with C content, but positive to O and H contents, respectively. It was reported that the consumption of HO elements during torrefaction was much larger than that of C element, leading to the concentration of C in the torrefied biomass [33]. An increase in temperature and time tended to increasingly improve the HHV of torrefied biomass due to the decrease of O/C and H/C ratios. This is consistent with the results reported by Onsree et al. [34] that temperature is the most influential feature to HHV prediction. It is worth noting that Nt exhibited a sharp upward trend with increasing Ni which contributed 54.38% importance, indicating that Nt was highly dependent on Ni. Different to other targets, temperature contributed only 5.33% importance to Nt prediction which was effective when temperature was higher than 260 °C. This might be attributed to the more violent release of HO elements than Ni into gases at above 260 °C.

4. Conclusions

The properties of torrefied biomass, including FR, O/C and H/C ratios, HHV, and Nt, were predicted using a RF model integrated with feature reduction. Four features were selected for the prediction of FR and Nt, while five features for O/C, H/C, and HHV prediction. The feature-reduced model exhibited excellent prediction precision with the values of R2 higher than 0.93 and acceptable RMSE for all targets. Further, PDA was performed to quantify the impact of selected features and torrefaction conditions on the targets. Temperature was the most influential factor for FR, O/C, H/C, and HHV, whereas Nt was strongly dependent on Ni. The results obtained in this study provide compre hensive information for understanding biomass torrefaction. Besides, the model developed in this study is applicable to any type of biomass feedstock whether it was dried or not before torrefaction. In our future research, feature interactions will be investigated using multiple partial dependence analysis to reveal in-depth mechanism of torrefaction and provide references for the optimization of torrefaction techniques.

Supplementary Materials

The following supporting information can be downloaded at: https://www.mdpi.com/article/10.3390/su142316055/s1, Figure S1: The statistical distribution of each variable in terms of the inherent properties of the raw biomass, the torrefaction conditions, and the fuel properties of torrefied biomass with violin-plots; Table S1: Dataset; Table S2: Detailed information of the PCCs.

Author Contributions

Conceptualization, X.L. and H.Y.; methodology, J.Y.; validation, H.Y.; writing—original draft preparation, X.L.; writing—review and editing, X.L.; visualization, F.L.; project administration, F.L.; and funding acquisition, X.L. All authors have read and agreed to the published version of the manuscript.

Funding

This research was funded by the Natural Science Foundation of Jiangsu Province, grant number BK20210511.

Institutional Review Board Statement

Not applicable.

Informed Consent Statement

Not applicable.

Data Availability Statement

Not applicable.

Conflicts of Interest

The authors declare no conflict of interest.

References

  1. Aniza, R.; Chen, W.; Yang, F.; Pugazhendh, A.; Singh, Y. Integrating Taguchi method and artificial neural network for predicting and maximizing biofuel production via torrefaction and pyrolysis. Bioresour. Technol. 2022, 343, 126140. [Google Scholar] [CrossRef] [PubMed]
  2. Chen, W.; Lin, B.; Lin, Y.; Chu, Y.; Ubando, A.T.; Show, P.L.; Ong, H.C.; Chang, J.; Ho, S.; Culaba, A.B.; et al. Progress in biomass torrefaction: Principles, applications and challenges. Prog. Energ. Combust. 2021, 82, 100887. [Google Scholar] [CrossRef]
  3. Seo, M.W.; Lee, S.H.; Nam, H.; Lee, D.; Tokmurzin, D.; Wang, S.; Park, Y. Recent advances of thermochemical conversion processes for biorefinery. Bioresour. Technol. 2022, 343, 126109. [Google Scholar] [CrossRef] [PubMed]
  4. Liu, Y.; Rokni, E.; Yang, R.; Ren, X.; Sun, R.; Levendis, Y.A. Torrefaction of corn straw in oxygen and carbon dioxide containing gases: Mass/energy yields and evolution of gaseous species. Fuel 2021, 285, 119044. [Google Scholar] [CrossRef]
  5. González-Arias, J.; Gómez, X.; González-Castaño, M.; Sánchez, M.E.; Rosas, J.G.; Cara-Jiménez, J. Insights into the product quality and energy requirements for solid biofuel production: A comparison of hydrothermal carbonization, pyrolysis and torrefaction of olive tree pruning. Energy 2022, 238, 122022. [Google Scholar] [CrossRef]
  6. Lokmit, C.; Nakason, K.; Kuboon, S.; Jiratanachotikul, A.; Panyapinyopol, B. Enhancing lignocellulosic energetic properties through torrefaction and hydrothermal carbonization processes. Biomass Convers. Biorefin. 2022. [Google Scholar] [CrossRef]
  7. Lin, Y.; Chen, W.; Colin, B.; Pétrissans, A.; Lopes Quirino, R.; Pétrissans, M. Thermodegradation characterization of hardwoods and softwoods in torrefaction and transition zone between torrefaction and pyrolysis. Fuel 2022, 310, 122281. [Google Scholar] [CrossRef]
  8. Kartal, F.; Özveren, U. Prediction of torrefied biomass properties from raw biomass. Renew. Energy 2022, 182, 578–591. [Google Scholar] [CrossRef]
  9. Samadi, S.H.; Ghobadian, B.; Nosrati, M. Prediction of higher heating value of biomass materials based on proximate analysis using gradient boosted regression trees method. Energy Sources Part A Recovery Util. Environ. Eff. 2021, 43, 672–681. [Google Scholar] [CrossRef]
  10. Onsree, T.; Tippayawong, N.; Phithakkitnukoon, S.; Lauterbach, J. Interpretable machine-learning model with a collaborative game approach to predict yields and higher heating value of torrefied biomass. Energy 2022, 249, 123676. [Google Scholar] [CrossRef]
  11. García Nieto, P.J.; García-Gonzalo, E.; Paredes-Sánchez, J.P.; Bernardo Sánchez, A.; Menéndez Fernández, M. Predictive modelling of the higher heating value in biomass torrefaction for the energy treatment process using machine-learning techniques. Neural Comput. Appl. 2019, 31, 8823–8836. [Google Scholar] [CrossRef]
  12. García Nieto, P.J.; García Gonzalo, E.; Sánchez Lasheras, F.; Paredes Sánchez, J.P.; Riesgo Fernández, P. Forecast of the higher heating value in biomass torrefaction by means of machine learning techniques. J. Comput. Appl. Math. 2019, 357, 284–301. [Google Scholar] [CrossRef]
  13. Onsree, T.; Tippayawong, N. Machine learning application to predict yields of solid products from biomass torrefaction. Renew. Energy 2021, 167, 425–432. [Google Scholar] [CrossRef]
  14. Ismail, H.Y.; Fayyad, S.; Ahmad, M.N.; Leahy, J.J.; Naushad, M.; Walker, G.M.; Albadarin, A.B.; Kwapinski, W. Modelling of yields in torrefaction of olive stones using artificial intelligence coupled with kriging interpolation. J. Clean. Prod. 2021, 326, 129020. [Google Scholar] [CrossRef]
  15. Leng, E.; He, B.; Chen, J.; Liao, G.; Ma, Y.; Zhang, F.; Liu, S.; Jiaqiang, E. Prediction of three-phase product distribution and bio-oil heating value of biomass fast pyrolysis based on machine learning. Energy 2021, 236, 121401. [Google Scholar] [CrossRef]
  16. Yu, S.; Kim, H.; Park, J.; Lee, Y.; Park, Y.K.; Ryu, C. Relationship between torrefaction severity, product properties, and pyrolysis characteristics of various biomass. Int. J. Energy Res. 2022, 46, 8145–8157. [Google Scholar] [CrossRef]
  17. Kartal, F.; Özveren, U. Investigation of the chemical exergy of torrefied biomass from raw biomass by means of machine learning. Biomass Bioenergy 2022, 159, 106383. [Google Scholar] [CrossRef]
  18. BREIMAN, L. Random Forests. Mach. Learn. 2001, 45, 5–32. [Google Scholar] [CrossRef] [Green Version]
  19. Tang, Q.; Chen, Y.; Yang, H.; Liu, M.; Xiao, H.; Wang, S.; Chen, H.; Raza Naqvi, S. Machine learning prediction of pyrolytic gas yield and compositions with feature reduction methods: Effects of pyrolysis conditions and biomass characteristics. Bioresour. Technol. 2021, 339, 125581. [Google Scholar] [CrossRef]
  20. Xiaorui, L.; Longji, Y.; Xudong, Y. Evolution of chemical functional groups during torrefaction of rice straw. Bioresour. Technol. 2021, 320, 124328. [Google Scholar] [CrossRef]
  21. Li, J.; Zhu, X.; Li, Y.; Tong, Y.W.; Ok, Y.S.; Wang, X. Multi-task prediction and optimization of hydrochar properties from high-moisture municipal solid waste: Application of machine learning on waste-to-resource. J. Clean. Prod. 2021, 278, 123928. [Google Scholar] [CrossRef]
  22. Tang, Q.; Chen, Y.; Yang, H.; Liu, M.; Xiao, H.; Wu, Z.; Chen, H.; Naqvi, S.R. Prediction of Bio-oil Yield and Hydrogen Contents Based on Machine Learning Method: Effect of Biomass Compositions and Pyrolysis Conditions. Energy Fuels 2020, 34, 11050–11060. [Google Scholar] [CrossRef]
  23. Rasam, S.; Talebkeikhah, F.; Talebkeikhah, M.; Salimi, A.; Moraveji, M.K. Physico-chemical properties prediction of hydrochar in macroalgae Sargassum horneri hydrothermal carbonisation. Int. J. Environ. Chem. 2019, 101, 2297–2318. [Google Scholar] [CrossRef]
  24. Li, J.; Zhang, W.; Liu, T.; Yang, L.; Li, H.; Peng, H.; Jiang, S.; Wang, X.; Leng, L. Machine learning aided bio-oil production with high energy recovery and low nitrogen content from hydrothermal liquefaction of biomass with experiment verification. Chem. Eng. J. 2021, 425, 130649. [Google Scholar] [CrossRef]
  25. Li, J.; Pan, L.; Suvarna, M.; Tong, Y.W.; Wang, X. Fuel properties of hydrochar and pyrochar: Prediction and exploration with machine learning. Appl. Energy 2020, 269, 115166. [Google Scholar] [CrossRef]
  26. Guo, H.N.; Wu, S.B.; Tian, Y.J.; Zhang, J.; Liu, H.T. Application of machine learning methods for the prediction of organic solid waste treatment and recycling processes: A review. Bioresour. Technol. 2021, 319, 124114. [Google Scholar] [CrossRef]
  27. Yuan, X.; Suvarna, M.; Low, S.; Dissanayake, P.D.; Lee, K.B.; Li, J.; Wang, X.; Ok, Y.S. Applied Machine Learning for Prediction of CO2 Adsorption on Biomass Waste-Derived Porous Carbons. Environ. Sci. Technol. 2021, 55, 11925–11936. [Google Scholar] [CrossRef]
  28. Zhu, X.; Wan, Z.; Tsang, D.C.W.; He, M.; Hou, D.; Su, Z.; Shang, J. Machine learning for the selection of carbon-based materials for tetracycline and sulfamethoxazole adsorption. Chem. Eng. J. 2021, 406, 126782. [Google Scholar] [CrossRef]
  29. Ullah, Z.; Khan, M.; Raza Naqvi, S.; Farooq, W.; Yang, H.; Wang, S.; Vo, D.N. A comparative study of machine learning methods for bio-oil yield prediction – A genetic algorithm-based features selection. Bioresour. Technol. 2021, 335, 125292. [Google Scholar] [CrossRef]
  30. Conag, A.T.; Villahermosa, J.E.R.; Cabatingan, L.K.; Go, A.W. Energy densification of sugarcane leaves through torrefaction under minimized oxidative atmosphere. Energy Sustain. Dev. 2018, 42, 160–169. [Google Scholar] [CrossRef]
  31. Adeleke, A.A.; Odusote, J.K.; Ikubanni, P.P.; Lasode, O.A.; Malathi, M.; Paswan, D. Essential basics on biomass torrefaction, densification and utilization. Int. J. Energy Res. 2021, 45, 1375–1395. [Google Scholar] [CrossRef]
  32. Guo, S.; Guo, T.; Che, D.; Liu, H.; Sun, B. Response surface analysis of energy balance and optimum condition for torrefaction of corn straw. Korean J. Chem. Eng. 2022, 39, 1287–1298. [Google Scholar] [CrossRef]
  33. McNamee, P.; Adams, P.W.R.; McManus, M.C.; Dooley, B.; Darvell, L.I.; Williams, A.; Jones, J.M. An assessment of the torrefaction of North American pine and life cycle greenhouse gas emissions. Energy Convers. Manag. 2016, 113, 177–188. [Google Scholar] [CrossRef] [Green Version]
  34. Kanwal, S.; Chaudhry, N.; Munir, S.; Sana, H. Effect of torrefaction conditions on the physicochemical characterization of agricultural waste (sugarcane bagasse). Waste Manag. 2019, 88, 280–290. [Google Scholar] [CrossRef]
Figure 1. 10-fold cross-validation method.
Sustainability 14 16055 g001
Figure 2. The structure of RF model.
Sustainability 14 16055 g002
Figure 3. The workflow of the RF model for biomass torrefaction.
Sustainability 14 16055 g003
Figure 4. Pearson correlation matrix between any two features.
Sustainability 14 16055 g004
Figure 5. Comparison of predicted values and experimental data of training and testing sets.
Sustainability 14 16055 g005
Figure 6. Partial dependence plots of the targets on each selected feature.
Sustainability 14 16055 g006
Table 1. Optimal hyper-parameters.
n_Estimatorsmax_Depthmax_Features
FR174160.353
HC112290.313
OC174270.232
HHV141460.353
Nt97410.596
Table 2. Dataset description.
FeatureNameUnitCountRangeMeanMedianStd
Moisture contentMOwt.%5150~14.84.334.554.12
Volatile contentVMwt.%51532.2~96.477.0278.98.28
Ash contentASHwt.%5150~32.585.483.35.76
Fixed carbon contentFCwt.%5101.67~61.414.7215.475.91
Carbon contentCwt.%49729.59~54.1644.8345.14.73
Hydrogen contentHwt.%4973.92~8.785.996.030.69
Oxygen contentOwt.%48811.37~61.5543.8344.467.57
Nitrogen content inputNiwt.%4880~14.291.240.592.09
TemperatureTemp°C515200~300255.2725032.63
Duration timeTimemin49110~36046.783035.20
Nitrogen content outputNtwt.%3790~8.320.940.651.066
High heating valueHHVMJ/kg49113.48~225.521.4520.679.76
Fuel ratioFR4360.02~7.190.530.360.65
H/C ratioH/C3970.03~0.160.100.110.02
O/C ratioO/C3800.06~1.870.700.680.29
Table 3. Feature importance of each feature to the prediction of targets.
MOVMFCCHONiTempTime
FR0.04670.12170.18720.04170.04420.04600.04870.40330.0605
H/C0.04860.06590.08770.08860.09350.07810.05490.37320.1094
O/C0.06900.07700.08530.10450.05470.14080.08760.30690.0742
Nt0.04730.09690.10230.06320.02490.03180.54380.05330.0365
HHV0.03210.16940.06000.15790.0780.06430.05520.31130.0719
Table 4. Selected features for each target.
TargetFeatures
FRVM, FC, Temp, time
H/CFC, C, H, Temp, time
O/CVM, FC, C, O, Temp
NtVM, FC, Ni, Temp
HHVVM, C, H, Temp, time
Table 5. R2 and RMSE results for the training set and the testing set.
FRH/CO/CHHVNt
R2 (training)0.96490.96530.95890.97740.982
RMSE (training)0.0480.00430.04480.46710.0679
R2 (testing)0.94850.96540.93150.96490.9746
RMSE (testing)0.05850.00420.05790.58190.0808
Publisher’s Note: MDPI stays neutral with regard to jurisdictional claims in published maps and institutional affiliations.

