


Effects of Different Fertilization Methods on Double-Rice Yield and Bacterial Community in Paddy Soil


Abstract
1. Introduction
2. Materials and Methods
2.1. Study Site
2.2. Field Experiment and Sample Collection
2.3. Soil Chemical Properties
2.4. Soil DNA Extraction
2.4.1. 16S rRNA Gene Amplification and Sequencing
2.4.2. Bioinformation
2.5. Statistical Analysis
3. Results
3.1. Soil Properties and Rice Yield
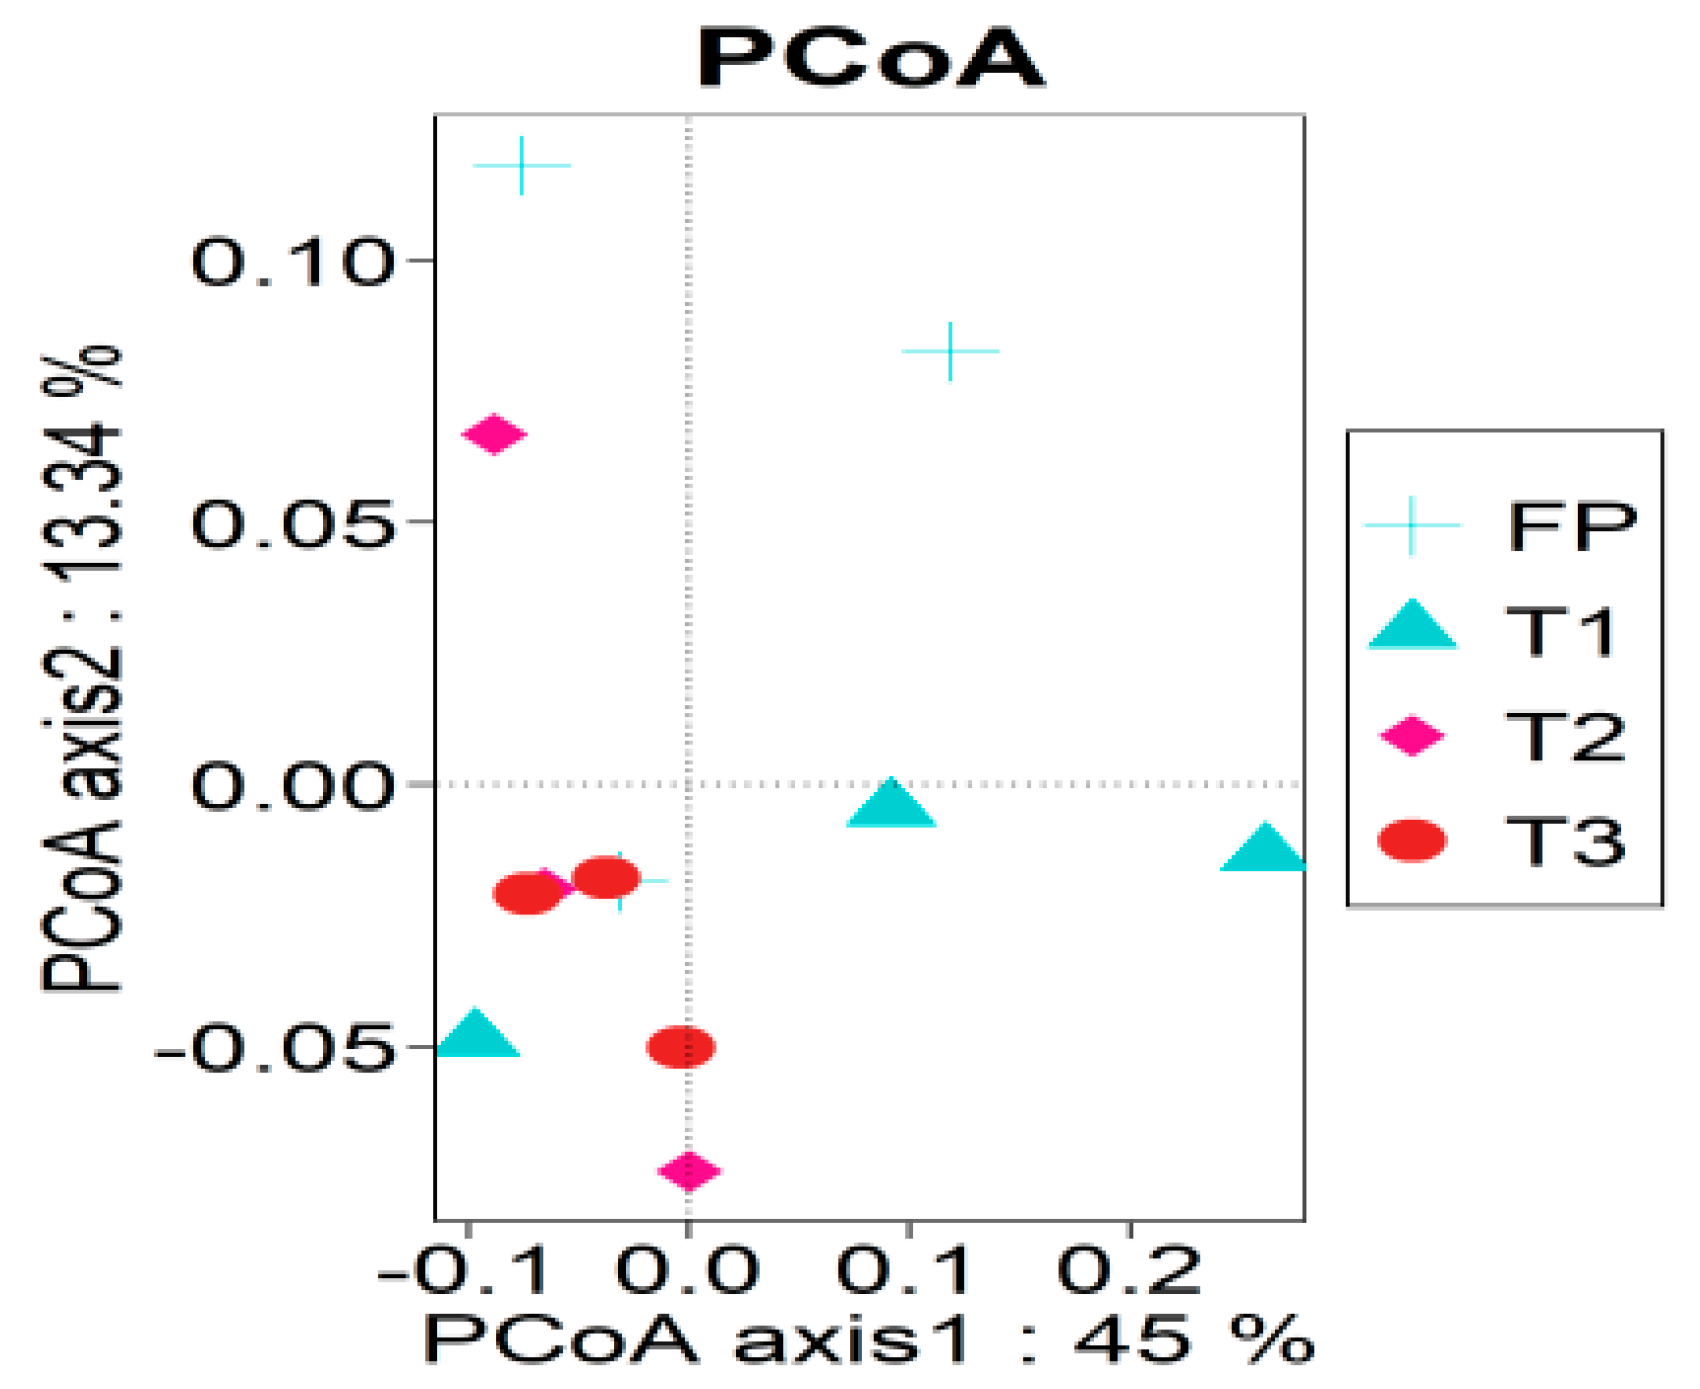
3.2. Bacterial Alpha and Beta Diversity
3.3. Bacterial Phylogenetic Compositions
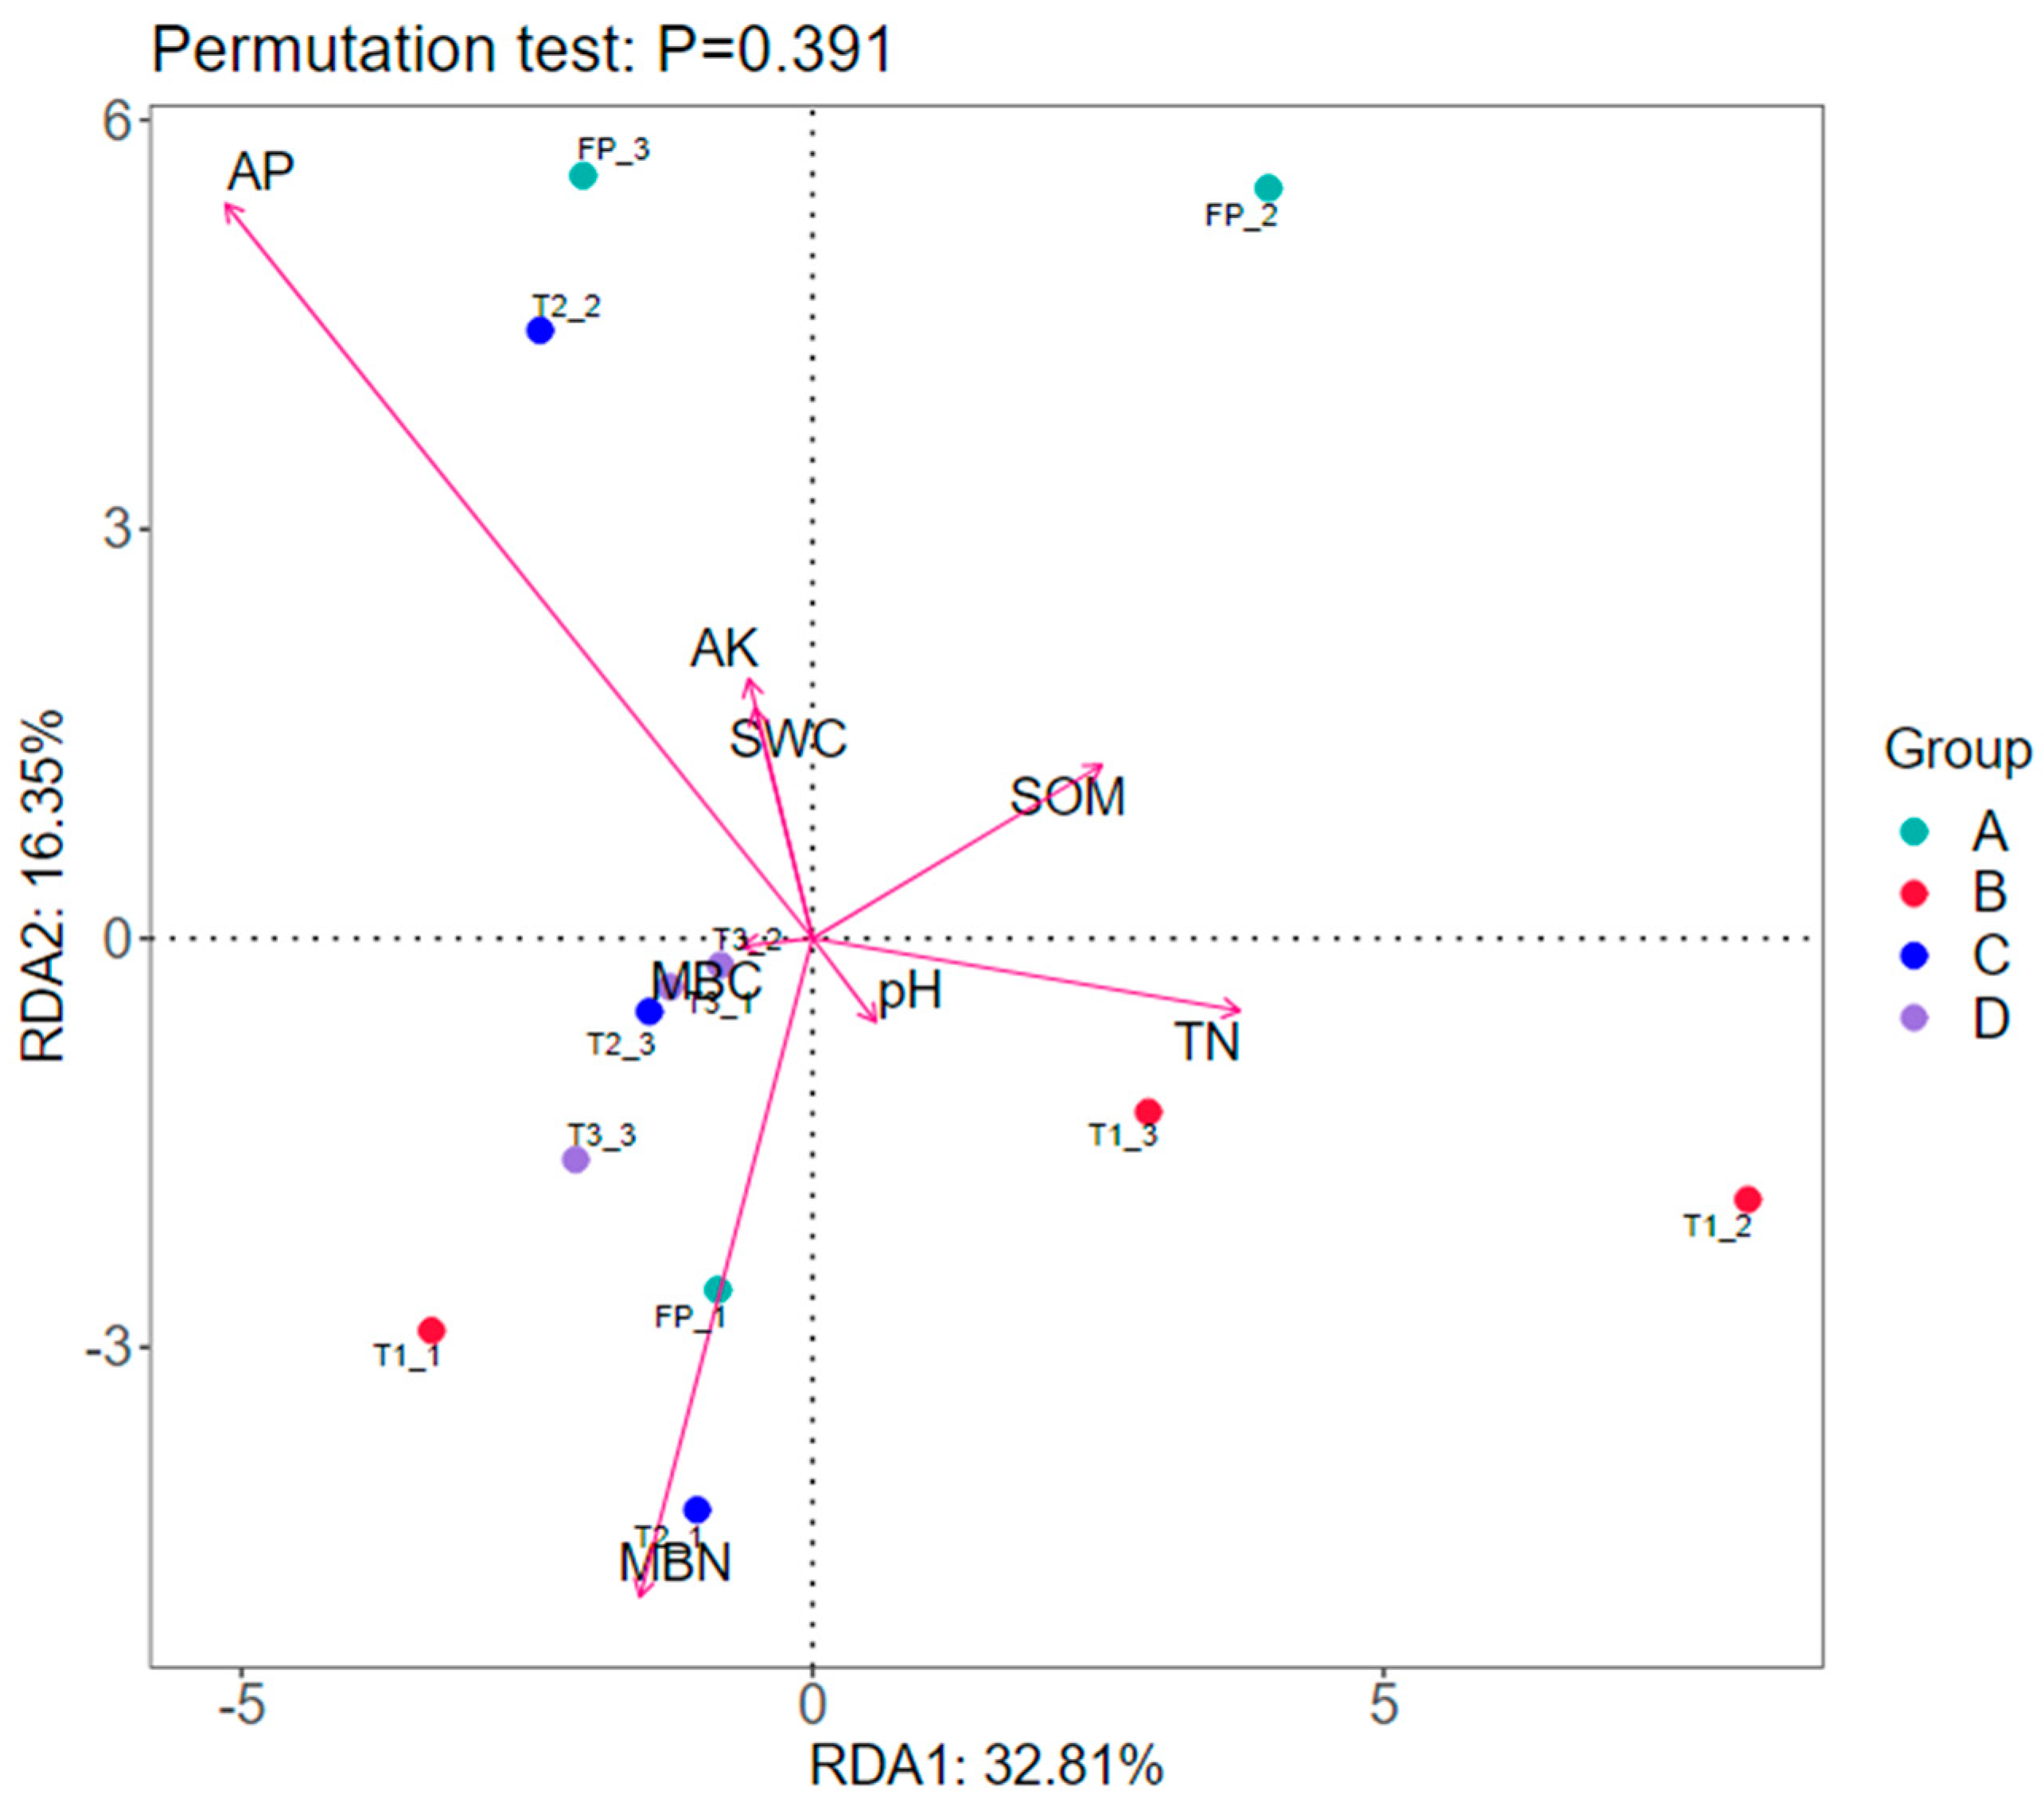
3.4. Relationship between Bacterial Structure and Soil Properties
4. Discussion
4.1. Rice Yield and Soil Properties
4.2. Bacterial Alpha Diversity and Community Structure
4.3. Relative Proportion of Bacterial OTUs at Phyla Level
5. Conclusions
Author Contributions
Funding
Institutional Review Board Statement
Informed Consent Statement
Data Availability Statement
Conflicts of Interest
References
- Sun, R.; Zhang, X.; Guo, X.; Wang, D.; Chu, H. Bacterial Diversity in Soils Subjected to Long-Term Chemical Fertilization Can Be More Stably Maintained with the Addition of Livestock Manure than Wheat Straw. Soil Biol. Biochem. 2015, 88, 9–18. [Google Scholar] [CrossRef]
- Ye, Y.; Sun, B.; Liu, S.; Li, W.; Yang, F. Spatio-Temporal Variation of Paddy Soil Acidification and its Response to Nitrogen Surplus in China. Trans. Chin. Soc. Agric. Mach. 2021, 52, 246–256. [Google Scholar]
- Menéndez, S.; López-Bellido, R.J.; Benítez-Vega, J.; González-Murua, C.; López-Bellido, L. Long-term Effect of Tillage, Crop Rotation and N Fertilization to Wheat on Gaseous Emissions under Rainfed Mediterranean Conditions. Eur. J. Agron. 2008, 28, 559–569. [Google Scholar] [CrossRef]
- Florio, A.; Felici, B.; Migliore, M.; Dell’Abate, M.T.; Benedetti, A. Nitrogen Losses, Uptake and Abundance of Ammonia Oxidizers in Soil under Mineral and Organo-Mineral Fertilization Regimes. J. Sci. Food Agric. 2015, 96, 2440–2450. [Google Scholar] [CrossRef] [PubMed]
- Matocha, C.J.; Grove, J.H.; Karathanasis, T.D.; Vandiviere, M. Changes in Soil Mineralogy Due to Nitrogen Fertilization in An Agroecosystem. Geoderma 2016, 263, 176–184. [Google Scholar] [CrossRef]
- Yeoh, Y.K.; Paungfoo-Lonhienne, C.; Dennis, P.G.; Robinson, N.; Ragan, M.A.; Schmidt, S.; Philip, H. The Core Root Microbiome of Sugarcanes Cultivated under Varying Nitrogen Fertilizer Application. Environ. Microbiol. 2015, 18, 1338–1351. [Google Scholar] [CrossRef]
- Liang, X.; Li, H.; Wang, S.; Ye, Y.; Ji, Y.; Tian, G.; van Kessel, C.; Linquist, B.A. Nitrogen Management to Reduce Yield-Scaled Global Warming Potential in Rice. Field Crop Res. 2013, 146, 66–74. [Google Scholar] [CrossRef]
- Zhang, C.; Liu, G.; Xue, S.; Wang, G. Soil Bacterial Community Dynamics Reflect Changes in Plant Community and Soil Properties During the Secondary Succession of Abandoned Farmland in the Loess Plateau. Soil Biol. Biochem. 2016, 97, 40–49. [Google Scholar] [CrossRef]
- Liu, J.; Shu, A.; Song, W.; Shi, W.; Li, M.; Zhang, W.; Li, Z.; Liu, G.; Yuan, F.; Zhang, S.; et al. Long-Term Organic Fertilizer Substitution Increases Rice Yield by Improving Soil Properties and Regulating Soil Bacteria. Geoderma 2021, 404, 115287. [Google Scholar] [CrossRef]
- Van der Bom, F.; Nunes, I.; Raymond, N.S.; Hansen, V.; Bonnichsen, L.; Magid, J.; Nybroe, O.; Jensen, L.S. Long-term Fertilisation Form, Level and Duration Affect the Diversity, Structure and Functioning of Soil Microbial Communities in the Field. Soil Biol. Biochem. 2018, 122, 91–103. [Google Scholar] [CrossRef]
- Daquiado, A.R.; Kuppusamy, S.; Kim, S.Y.; Kim, J.H.; Yoon, Y.-E.; Kim, P.J.; Oh, S.-H.; Kwak, Y.-S.; Lee, Y.B. Pyrosequencing Analysis of Bacterial Community Diversity in Long-term Fertilized Paddy Field Soil. Appl. Soil Ecol. 2016, 108, 84–91. [Google Scholar] [CrossRef]
- Hou, Q.; Ni, Y.; Huang, S.; Zuo, T.; Wang, J.; Ni, W. Effects of Manure Substitution for Chemical Fertilizers on Rice Yield and Soil Labile Nitrogen in Paddy Fields of China: A Meta-analysis. Pedosphere 2022, 32, S1002016022000881. [Google Scholar] [CrossRef]
- Kumar, U.; Nayak, A.K.; Shahid, M.; Gupta, V.; Panneerselvam, P.; Mohanty, S.; Kaviraj, M.; Kumar, A.; Chatterjee, D.; Lal, B.; et al. Continuous Application of Inorganic and Organic Fertilizers over 47 Years in Paddy Soil Alters the Bacterial Community Structure and Its Influence on Rice Production. Agric. Ecosyst. Environ. 2018, 262, 65–75. [Google Scholar] [CrossRef]
- Chen, D.; Yuan, L.; Liu, Y.; Ji, J.; Hou, H. Long-Term Application of Manures Plus Chemical Fertilizers Sustained High Rice Yield and Improved Soil Chemical and Bacterial Properties. Eur. J. Agron. 2017, 90, 34–42. [Google Scholar] [CrossRef]
- Poulsen, P.; Al-Soud, W.; Bergmark, L.; Magid, J.; Hansen, L.; Sørensen, S. Effects of Fertilization with Urban and Agricultural Organic Wastes in A Field Trial-Prokaryotic Diversity Investigated by Pyrosequencing. Soil Biol. Biochem. 2013, 57, 784–793. [Google Scholar] [CrossRef]
- Mi, W.; Gao, Q.; Xia, S.; Zhao, H.; Wu, L.; Mao, W.; Hu, Z.; Liu, Y. Medium-term Effects of Different Types of N Fertilizer on Yield, Apparent N Recovery, and Soil Chemical Properties of a Double Rice Cropping System. Field Crop Res. 2019, 234, 87–94. [Google Scholar] [CrossRef]
- Tian, C.; Sun, M.; Zhou, X.; Li, J.; Xie, G.; Yang, X.; Peng, J. Increase in Yield and Nitrogen Use Efficiency of Double Rice with Long-Term Application of Controlled-Release Urea. J. Integr. Agric. 2022, 21, 2106–2118. [Google Scholar] [CrossRef]
- Song, A.; Li, Z.; Liao, Y.; Liang, Y.; Wang, E.; Wang, S.; Li, X.; Bi, J.; Si, Z.; Lu, Y.; et al. Soil Bacterial Communities Interact with Silicon Fraction Transformation and Promote Rice Yield after Long-term Straw Return. Soil Ecol. Lett. 2021, 3, 395–408. [Google Scholar] [CrossRef]
- Farooq, M.; Ullah, A.; Rehman, A.; Nawaz, A.; Nadeem, A.; Wakeel, A.; Nadeem, F.; Siddique, K.H.M. Application of Zinc Improves the Productivity and Biofortification of Fine Grain Aromatic Rice Grown in Dry Seeded and Puddle Transplanted Production Systems. Field Crop Res. 2018, 216, 53–62. [Google Scholar] [CrossRef]
- Wang, F.; Yuan, T.; Gu, S.; Wang, Z. Effects of Organic and Inorganic Controlled-Release Compound Fertilizers on Microbial Biomass Carbon and Nitrogen, and Microbial Community Structure. Acta Ecol. Sin. 2016, 36, 1461–1467. [Google Scholar]
- Wang, F.; Yuan, T.; Gu, S.; Zheng, Y. Effects of Organic and Inorganic Controlled-Release Compound Fertilizer on Different Soils Microbial Community Structure. Environ. Sci. 2015, 4, 323–329. [Google Scholar]
- Samaddar, S.; Truu, J.; Chatterjee, P.; Truu, M.; Kim, K.; Kim, S.; Seshadri, S.; Sa, T. Long-term Silicate Fertilization Increases the Abundance of Actinobacterial Population in Paddy Soils. Biol. Fertil. Soils 2019, 55, 109–120. [Google Scholar] [CrossRef]
- Zhang, L.; Guan, Y. Consistent Responses of Soil Bacterial Communities to Bioavailable Silicon Deficiency in Croplands. Geoderma 2022, 408, 115587. [Google Scholar] [CrossRef]
- Grant, C.A.; Bailey, L.D. Nitrogen, Phosphorus and Zinc Management Effects on Grain Yield and Cadmium Concentration in Two Cultivars Durum Wheat. Can. J. Plant Sci. 1998, 78, 63–70. [Google Scholar] [CrossRef]
- Garnaik, S.; Samant, P.K.; Mandal, M.; Mohanty, T.R.; Dwibedi, S.K.; Patra, R.K.; Mohapatra, K.K.; Wanjari, R.H.; Sethi, D.; Sena, D.R.; et al. Untangling the Effect of Soil Quality on Rice Productivity under a 16-Years Long-Term Fertilizer Experiment Using Conditional Random Forest. Comput. Electron. Agric. 2022, 197, 106965. [Google Scholar] [CrossRef]
- Seebold, K.W.; Datnoff, L.E.; Correa-Victoria, F.J.; Kucharek, T.A.; Snyder, G.H. Effect of Silicon Rate and Host Resistance on Blast, Scald, and Yield of Upland Rice. Plant Dis. 2000, 84, 871–876. [Google Scholar] [CrossRef]
- Geng, J.; Sun, Y.; Zhang, M.; Li, C.; Yang, Y.; Liu, Z.; Li, S. Long-term effects of Controlled Released Urea Application on Crop Yields and Soil Fertility under Rice-Oilseed Rape Rotation System. Field Crop Res. 2015, 184, 65–73. [Google Scholar] [CrossRef]
- Hamm, A.C.; Tenuta, M.; Krause, D.O.; Ominski, K.H.; Tkachuk, V.L.; Flaten, D.N. Bacterial Communities of An Agricultural Soil Amended with Solid Pig and Dairy Manures, and Urea Fertilizer. Appl. Soil Ecol. 2016, 103, 61–71. [Google Scholar] [CrossRef]
- Peng, H.; Deng, K.; Shi, Y.; Liu, S.; Jian, Z.; Li, C.; Ji, X.; Li, S. Alleviation of Cd-Polluted Paddy Soils through Si Fertilizer Application and Its Effects on the Soil Microbial Community. Sci. Total Environ. 2023, 855, 158735. [Google Scholar] [CrossRef]
- Gautam, A.; Sekaran, U.; Guzman, J.; Kovács, P.; Hernandez, J.L.G.; Kumar, S. Responses of Soil Microbial Community Structure and Enzymatic Activities to Long-Term Application of Mineral Fertilizer and Beef Manure. Environ. Sustain. Indic. 2020, 8, 100073. [Google Scholar] [CrossRef]
- Yuan, H.; Ge, T.; Zhou, P.; Liu, S.; Roberts, P.; Zhu, H.; Zou, Z.; Tong, C.; Wu, J. Soil Microbial Biomass and Bacterial and Fungal Community Structures Responses to Long-Term Fertilization in Paddy Soils. J. Soils Sediments 2013, 13, 877–886. [Google Scholar] [CrossRef]
- Wang, J.L.; Liu, K.L.; Zhao, X.Q.; Zhang, H.Q.; Li, D.; Li, J.J.; Shen, R.F. Balanced Fertilization over Four Decades Has Sustained Soil Microbial Communities and Improved Soil Fertility and Rice Productivity in Red Paddy Soil. Sci. Total Environ. 2021, 793, 148664. [Google Scholar] [CrossRef] [PubMed]
- Bergmann, G.T.; Bates, S.T.; Eilers, K.G.; Lauber, C.L.; Caporaso, J.G.; Walters, W.A.; Knight, R.; Fierer, N. The under-Recognized Dominance of Verrucomicrobia in Soil Bacterial Communities. Soil Biol. Biochem. 2011, 43, 1450–1455. [Google Scholar] [CrossRef] [PubMed]
- Gu, Y.; Wang, Y.; Lu, S.; Xiang, Q.; Yu, X.; Zhao, K.; Zou, L.; Chen, Q.; Tu, S.; Zhang, X. Long-Term Fertilization Structures Bacterial and Archaeal Communities along Soil Depth Gradient in a Paddy Soil. Front. Microbiol. 2017, 8, 1516. [Google Scholar] [CrossRef]
- Buckley, D.H.; Schmidt, T.M. 2001. Environmental Factors Influencing the Distribution of rRNA from Verrucomicrobia in Soil. FEMS Microbiol. Ecol. 2001, 35, 105–112. [Google Scholar] [CrossRef]
- Farag, I.F.; Davis, J.P.; Youssef, N.H.; Elshahed, M.S. Global Patterns of Abundance, Diversity and Community Structure of the Aminicenantes (Candidate Phylum OP8). PLoS ONE 2014, 9, e92139. [Google Scholar] [CrossRef]


| Treatment | Total N Input | Urea-N | Controlled-Release N | Organic N | Si | Zn | S | |
|---|---|---|---|---|---|---|---|---|
| Early rice | FP | 165 | 165 | 0 | 0 | 0 | 0 | 0 |
| T1 | 135 | 108 | 0 | 27 | 0 | 0 | 0 | |
| T2 | 135 | 108 | 0 | 27 | 126 | 10 | 29 | |
| T3 | 135 | 67.5 | 40.5 | 27 | 126 | 10 | 29 | |
| Late rice | FP | 195 | 195 | 0 | 0 | 0 | 0 | 0 |
| T1 | 165 | 132 | 0 | 33 | 0 | 0 | 0 | |
| T2 | 165 | 132 | 0 | 33 | 126 | 10 | 29 | |
| T3 | 165 | 82.5 | 49.5 | 33 | 126 | 10 | 29 |
| Treatment | FP | T1 | T2 | T3 |
|---|---|---|---|---|
| pH | 4.97 (0.01) a | 4.96 (0.03) a | 4.99 (0.02) a | 4.96 (0.04) a |
| SOM (g kg−1) | 39.12 (2.40) a | 39.44 (2.67) a | 39.97 (1.45) a | 41.03 (2.07) a |
| TN (g kg−1) | 2.28 (0.03) a | 2.31 (0.06) a | 2.31 (0.03) a | 2.31 (0.07) a |
| MBC (mg kg−1) | 651.77 (69.52) a | 697.35 (54.29) a | 692.99 (58.13) a | 732.32 (89.53) a |
| MBN (mg kg−1) | 65.46 (5.98) a | 73.59 (4.99) a | 74.60 (5.29) a | 69.88 (3.94) a |
| AP (mg kg−1) | 42.00 (3.45) a | 46.80 (8.41) a | 47.51 (13.72) a | 51.67 (4.99) a |
| AK (mg kg−1) | 115.07 (19) a | 118.07 (16) a | 121.39 (10) a | 121.76 (11) a |
| ASi (mg kg−1) | 135.53 (11) a | 153.36 (19) a | 165.47 (22) a | 153.67 (21) a |
| FP | T1 | T2 | T3 | FP | T1 | T2 | T3 | |
|---|---|---|---|---|---|---|---|---|
| Early Rice | Late Rice | |||||||
| 2012–2013 | 7985 (539) | 7961 (131) | 7913 (522) | 7829 (353) | 7213 (373) | 7235 (220) | 7103 (315) | 7240 (390) |
| 2013–2014 | 7035 (265) | 7012 (358) | 7171 (477) | 7067 (364) | 8778 (293) | 8679 (431) | 8646 (471) | 8737 (313) |
| 2014–2015 | 7472 (644) | 6872 (593) | 6906 (720) | 7003 (917) | 6883 (346) | 7255 (485) | 7033 (240) | 6838 (179) |
| 2015–2016 | 8076 (610) | 8763 (873) | 8334 (569) | 8577 (840) | 6311 (308) | 6764 (696) | 6633 (820) | 6889 (478) |
| Source of variation | F value | p value | ||||||
| Year | 91.623 | <0.001 | ||||||
| Treatment | 0.996 | 0.471 | ||||||
| Treatment | Shannon | Simpson | Chao1 |
|---|---|---|---|
| FP | 6.47 (0.11) c | 0.0054 (0.0013) a | 3838.67 (91.88) a |
| T1 | 6.52 (0.04) bc | 0.0048 (0.0001) a | 3865.00 (80.89) a |
| T2 | 6.66 (0.08) a | 0.0041 (0.0008) a | 3955.33 (58.65) a |
| T3 | 6.63 (0.04) ab | 0.0042 (0.0006) a | 4017.00 (59.57) a |
| pH | SOM | TN | MBC | MBN | AP | AK | |
|---|---|---|---|---|---|---|---|
| Shannon | −0.05 | 0.768 | 0.451 | 0.705 | 0.640 | 0.783 | 0.969 * |
| Simpson | 0.073 | −0.955 * | −0.375 | −0.804 | −0.597 | −0.861 | −0.997 ** |
| Chao1 | −0.312 | 0.958 * | 0.401 | 0.852 | 0.640 | 0.909 | 0.909 |
| Treatment | FP | T1 | T2 | T3 |
|---|---|---|---|---|
| Acidobacteria | 28.14 (4.75) a | 22.76 (8.32) a | 27.94 (4.27) a | 25.97 (3.56) a |
| Proteobacteria | 23.20 (5.91) a | 25.35 (6.90) a | 20.81 (1.61) a | 21.20 (1.74) a |
| Chloroflexi | 12.07 (4.51) a | 12.85 (3.10) a | 14.37 (3.71) a | 16.69 (1.76) a |
| Nitrospirae | 14.50 (1.32) a | 16.02 (3.99) a | 12.65 (0.57) a | 13.28 (0.66) a |
| Chlorobi | 6.93 (0.84) a | 7.91 (2.23) a | 5.46 (0.67) a | 5.57 (0.73) a |
| Bacteroidetes | 2.53 (1.08) a | 1.34 (0.57) a | 2.02 (0.19) a | 2.43 (0.08) a |
| Gemmatimonadetes | 1.53 (0.42) a | 1.67 (0.44) a | 1.70 (0.53) a | 1.41 (0.07) a |
| Actinobacteria | 1.50 (0.22) a | 1.54 (0.37) a | 2.12 (0.52) a | 1.94 (0.35) a |
| Parcubacteria | 1.33 (0.26) a | 1.29 (0.34) a | 2.01 (1.01) a | 1.37 (0.46) a |
| Aminicenantes | 0.92 (0.14) b | 0.78 (0.53) c | 1.26 (0.11) a | 1.21 (0.34) ab |
| Verrucomicrobia | 0.95 (0.25) c | 1.03 (0.70) b | 2.28 (0.36) a | 1.76 (0.45) ab |
Publisher’s Note: MDPI stays neutral with regard to jurisdictional claims in published maps and institutional affiliations. |
© 2022 by the authors. Licensee MDPI, Basel, Switzerland. This article is an open access article distributed under the terms and conditions of the Creative Commons Attribution (CC BY) license (https://creativecommons.org/licenses/by/4.0/).
Share and Cite
Li, G.; Zhang, X.; Zhang, H.; Guo, K.; Zhang, J. Effects of Different Fertilization Methods on Double-Rice Yield and Bacterial Community in Paddy Soil. Sustainability 2022, 14, 16061. https://doi.org/10.3390/su142316061
Li G, Zhang X, Zhang H, Guo K, Zhang J. Effects of Different Fertilization Methods on Double-Rice Yield and Bacterial Community in Paddy Soil. Sustainability. 2022; 14(23):16061. https://doi.org/10.3390/su142316061
Chicago/Turabian StyleLi, Guihua, Xueling Zhang, He Zhang, Kangli Guo, and Jianfeng Zhang. 2022. "Effects of Different Fertilization Methods on Double-Rice Yield and Bacterial Community in Paddy Soil" Sustainability 14, no. 23: 16061. https://doi.org/10.3390/su142316061
APA StyleLi, G., Zhang, X., Zhang, H., Guo, K., & Zhang, J. (2022). Effects of Different Fertilization Methods on Double-Rice Yield and Bacterial Community in Paddy Soil. Sustainability, 14(23), 16061. https://doi.org/10.3390/su142316061