Priority-Setting Methodology of Qualitative and Quantitative Analyses for Pedestrian Road Construction: Case Study of a National Highway in South Korea
Abstract
1. Introduction
2. Literature Review
3. Methods
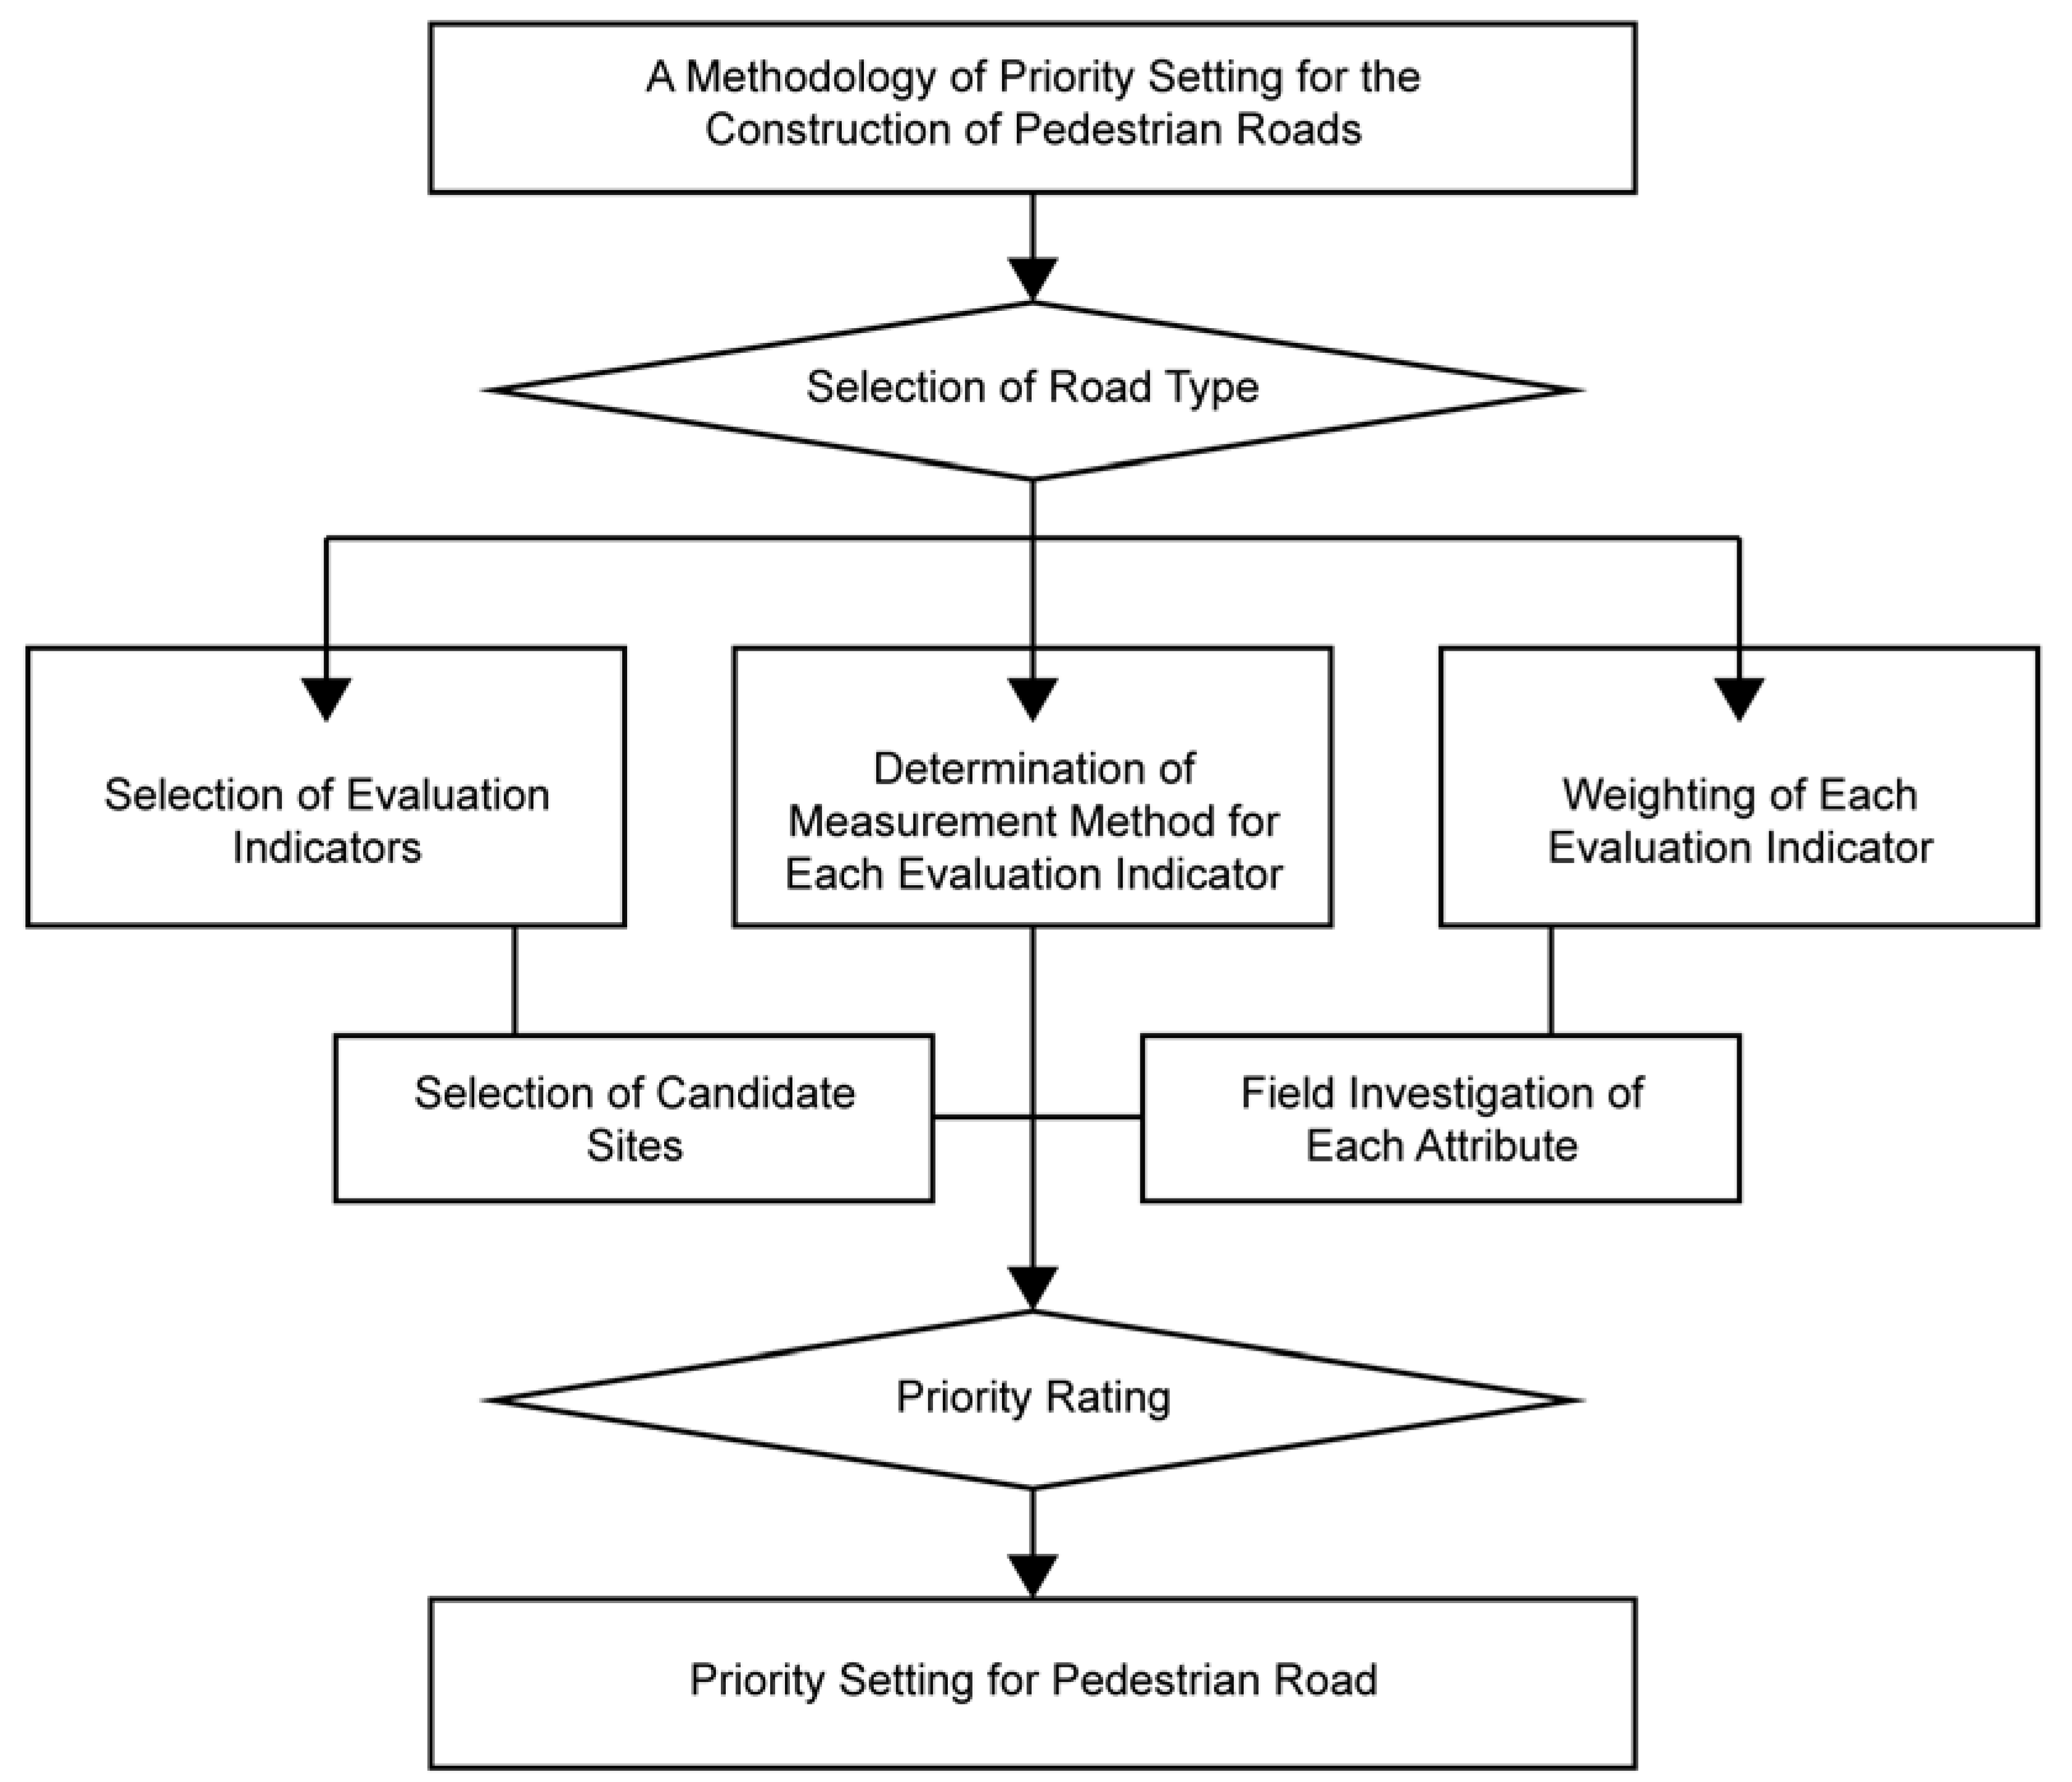
3.1. Procedures of Priority Setting
3.2. Methodology of Priority Setting for the Construction of Pedestrian Roads on National Highways
3.2.1. Selection of Evaluation Indicators
3.2.2. Determination of Measurement Method for Each Evaluation Indicator
Pedestrian Fatality Risk
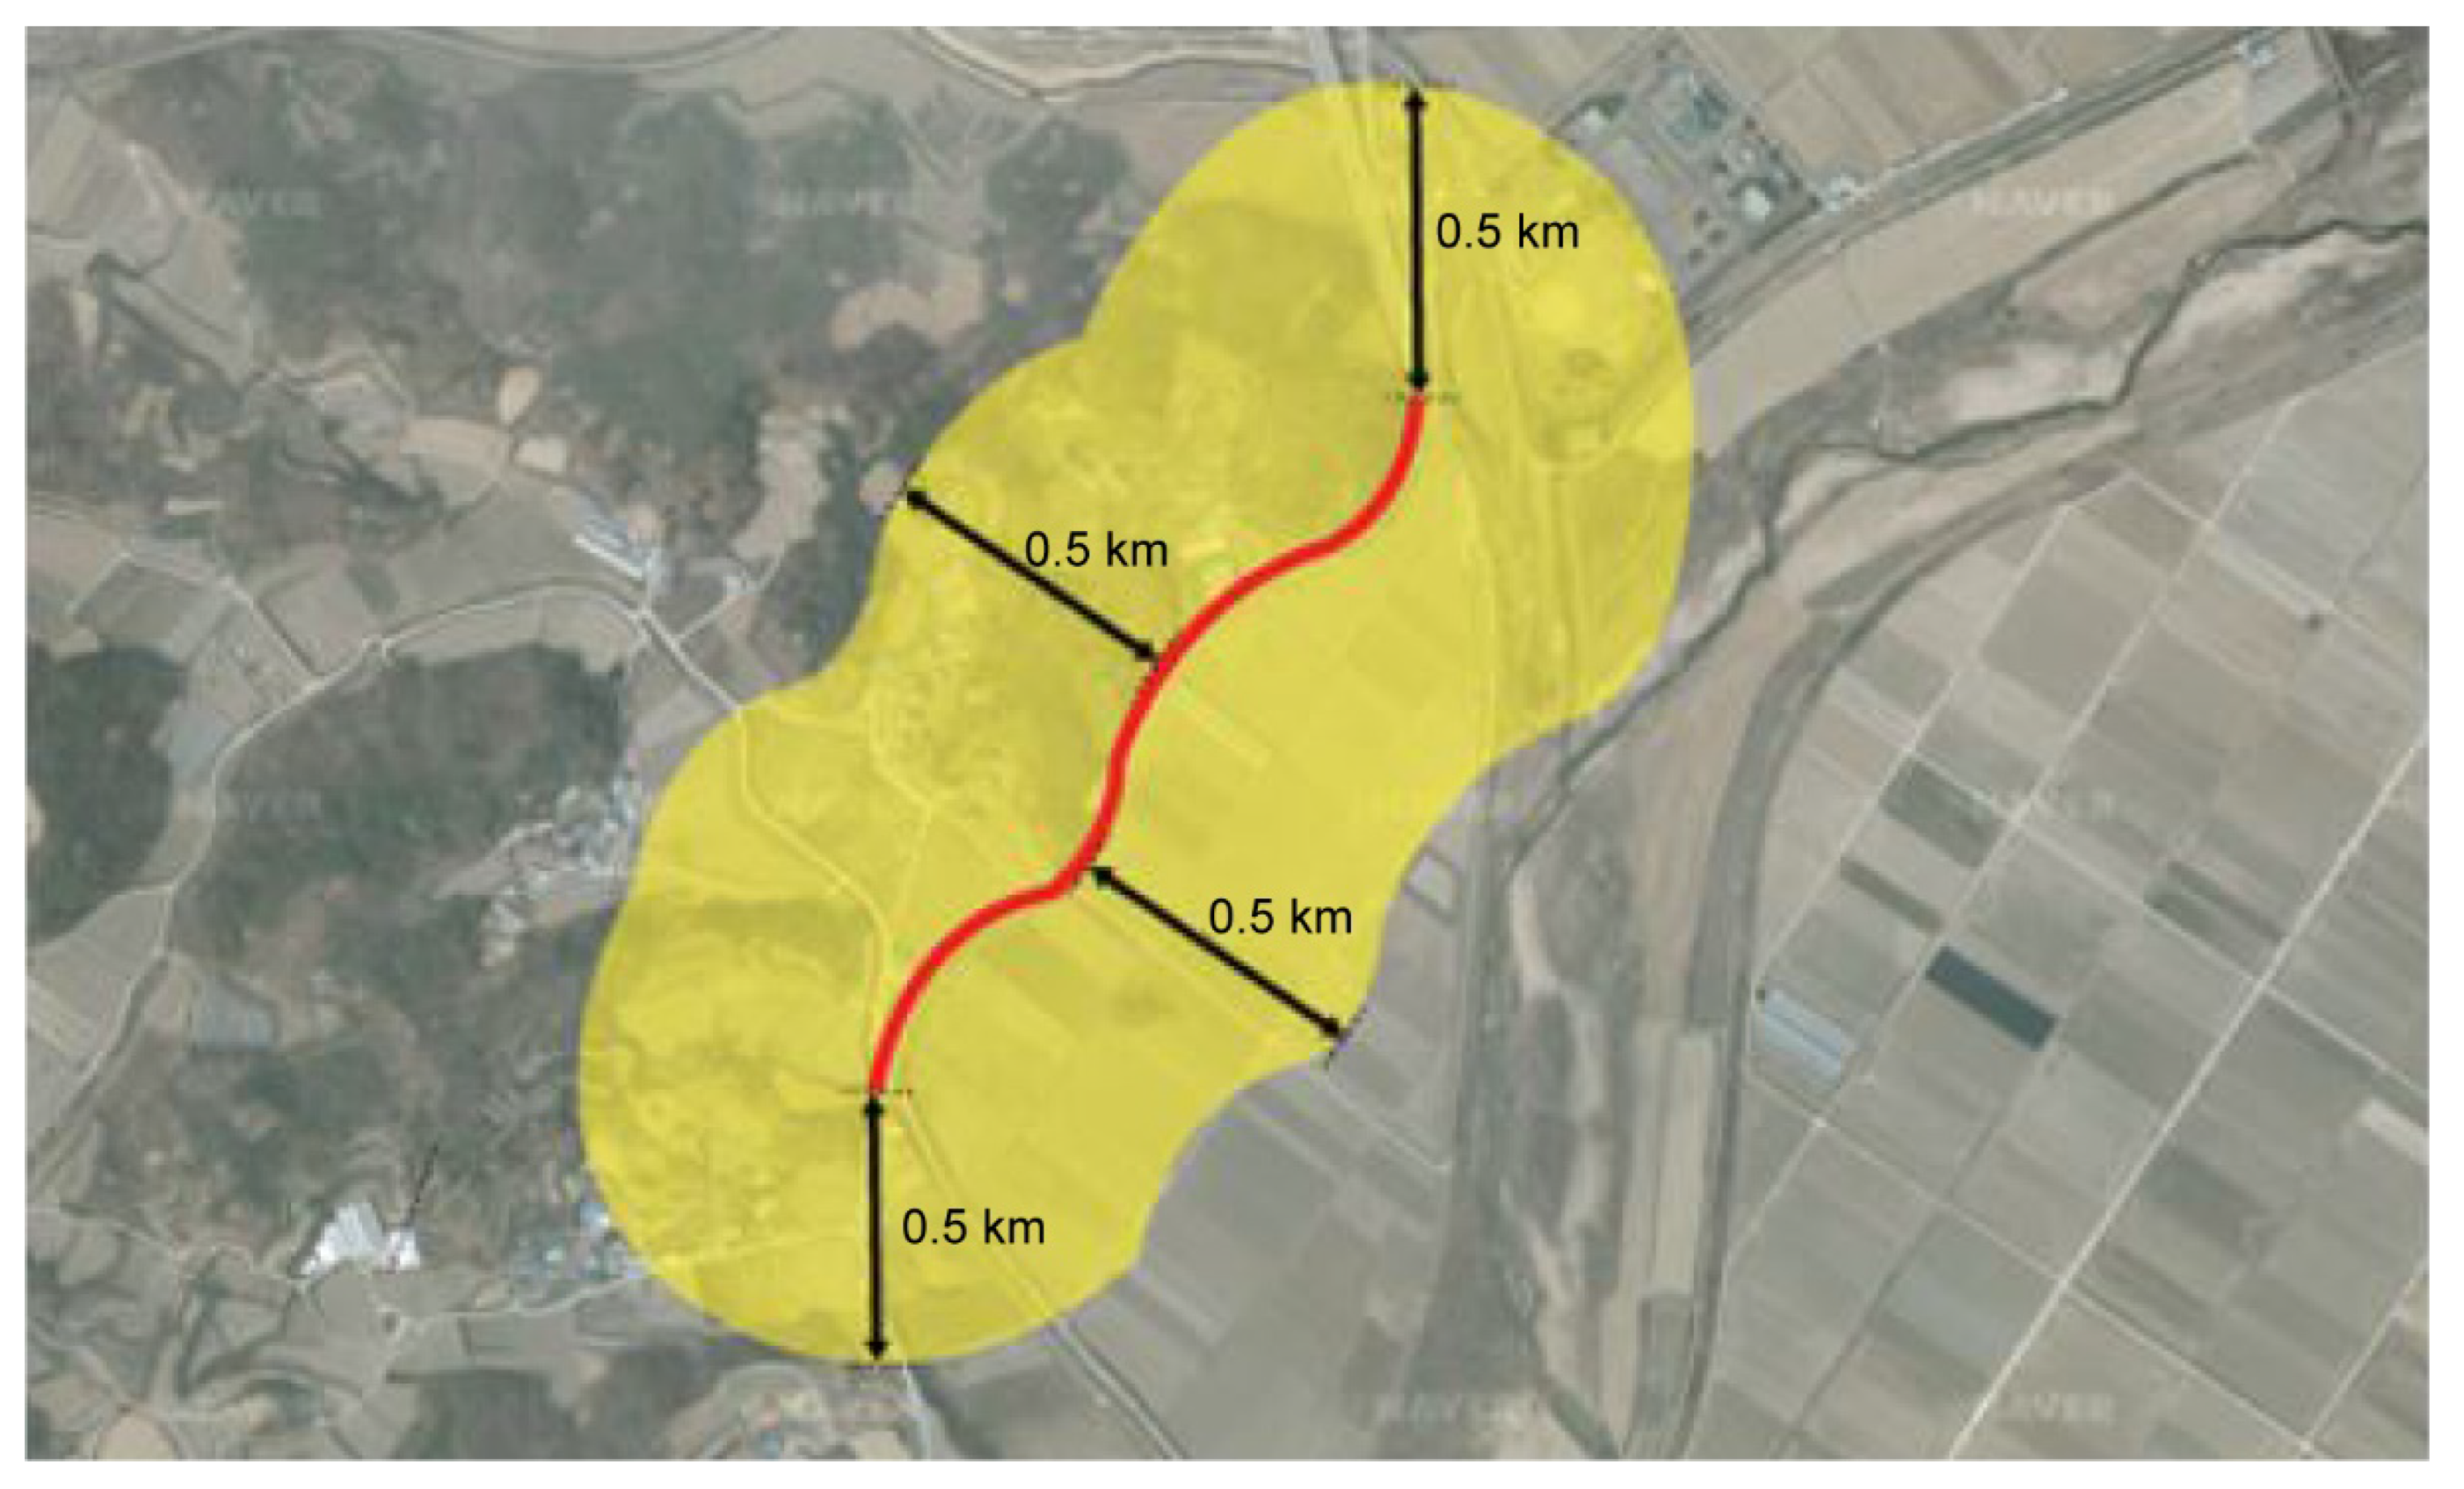
Surrounding Infrastructure
Potential Pedestrian Demand
Road Manager’s Opinion
Weighting of Each Evaluation Indicator
4. A Case Study
5. Conclusions
Funding
Institutional Review Board Statement
Informed Consent Statement
Data Availability Statement
Acknowledgments
Conflicts of Interest
References
- Park, J.H.; Oh, S.H.; Phee, J.H. A Study on the Analysis of Walking Behavior in Transfer Stations after the Improvement of Walking Environment. Int. J. Civ. Environ. Eng. Res. 2012, 32, 189–196. (In Korean) [Google Scholar]
- Jeon, W.H.; Yang, C.H.; Yoon, J.E.; Yang, I. Methodology for Prioritizing Sidewalk Construction among 100 Candidate Sites on Rural National Highways. Int. J. Highw. Eng. 2015, 17, 127–133. (In Korean) [Google Scholar] [CrossRef]
- KoROAD. A Statistical Analysis of Traffic Accidents. 2021. Available online: http://taas.koroad.or.kr (accessed on 16 October 2022). (In Korean).
- Kwon, Y.H.; Choi, Y. A Study on Walking Safety Satisfaction according to Vulnerable Pedestrian’ Access to Public Facilities. Int. J. Civ. Environ. Eng. Res. 2021, 41, 65–74. (In Korean) [Google Scholar] [CrossRef]
- Choi, Y.; Seo, M.J. Walkability analysis of Busan’s urban residential zones. Int. J. Civ. Environ. Eng. Res. 2016, 20, 2535–2547. [Google Scholar] [CrossRef]
- Hong, N.E.; Kim, Y.M.; Son, C.H.; Bak, J.I.; Ban, Y.W. Comparative analysis of factors affecting walking satisfaction for the disabled-for the new and old town of Chongju. Korea Environ. Policy Adm. Soc. Acad. Conf. 2015, 185–195. [Google Scholar]
- Jo, Y.H.; Kim, J.H.; Ha, J.M. User’s satisfaction evaluation of Dongsung pedestrian street in Daegu. JAIK 2009, 25, 197–204. (In Korean) [Google Scholar]
- Kim, B.S.; Seo, W.H. Current practice of walkability assessment for seniors and people with disabilities. Transp. Technol. Policy 2015, 12, 58–65. (In Korean) [Google Scholar]
- Kim, J.J.; Yun, D.S. Analyzing Factors Affection Transportation Vulnerable’s Improvement Needs of Transportation Infrastructure—A Case Study of Daegu Metropolitan City. J. Korea Plan. Assoc. 2019, 54, 56–64. (In Korean) [Google Scholar] [CrossRef]
- Mateo-Babiano, I. Pedestrian’s needs matters: Examining Manila’s walking environment. Transp. Policy 2016, 45, 107–115. [Google Scholar] [CrossRef]
- Jun, H.J.; Kang, S.; Jung, S.; Kim, T.; Cho, C.H.; Jhoo, W.Y.; Kim, J.Y. A Deep Learning Approach to Predict Elderly and Child Pedestrian Crash Hot Spots in the Seoul Metropolitan Area. J. Korea Plan. Assoc. 2021, 56, 115–127. (In Korean) [Google Scholar] [CrossRef]
- Campbell, B.J.; Zegeer, C.V.; Huang, H.H.; Cynecki, M.J. A Review of Pedestrian Safety Research in the United States and Abroad; FHWA-RD-03-042; HRDS-06/01-04(1M)E; U.S. Department of Transportation: Washington, DC, USA, 2003.
- Huang, H.; Zegeer, C. An Evaluation of Pedestrian Countdown Signals; Report No. FHWA DTFH61-92-R-00138; University of North Carolina Highway Safety Research Center: Chapel Hill, NC, USA, 1999. [Google Scholar]
- Huang, H. An Evaluation of Illuminated Pedestrian Push Buttons; Report No. FHWA DTFH61-92-R00138; University of North Carolina Highway Safety Research Center: Chapel Hill, NC, USA, 1999. [Google Scholar]
- Huang, H.; Zegeer, C.; Nassi, R.; Fairfax, B. The Effects of Innovative Pedestrian Signs at Unsignalized Locations: A Tale of Three Treatments; Report No. FHWA-RD-00-098; University of North Carolina Highway Safety Research Center: Chapel Hill, NC, USA; Department of Transport: Tucson, AZ, USA, 2000. [Google Scholar]
- Knoblauch, R. The Effect of Crosswalk markings on Vehicle Speeds in Maryland, Virginia, and Arizona; FHWA Contract DTFH61-92-C-00138; Center for Applied Research, Inc.: Great Falls, VA, USA, 1998. [Google Scholar]
- Knoblauch, R.; Nitzburg, M.; Seifert, R. Pedestrian Crosswalk Case Studies: Sacramento, California; Richmond, Virginia, Buffalo, New York, Stillwater, Minnesota; FHWA Contract DTFH61-92-C-00138; Center for Applied Research, Inc.: Great Falls, VA, USA, 1999. [Google Scholar]
- Kim, E.; Choi, E.J.; Yang, J.Y. A Study on Enhancement Methods of Level of Service Analysis for Pedestrian Sidewalks. JKST 2015, 33, 29–39. (In Korean) [Google Scholar] [CrossRef][Green Version]
- Kim, Y.S.; Choi, J.S. Evaluation of Sidewalk Level of Service Considering Land Use Patterns. JKST 2007, 25, 83–93. (In Korean) [Google Scholar]
- Lee, S.H. Improvement of Analysis Method for Pedestrian LOS on Sidewalk in Seoul. JKST 2012, 30, 7–15. (In Korean) [Google Scholar] [CrossRef]
- Lim, J.S.; Oh, Y.T. Estimation of Pedestrian Capacity for Walkway. JKST 2002, 20, 91–99. (In Korean) [Google Scholar]
- Swords, A.R.; Goldman, L.M.; Feldman, W.; Ehrlich, T.F.; Bird, W.J., Jr. Analytical Framework for Prioritizing Bicycle and pedestrian Investments. TRR 2004, 1878, 27–35. [Google Scholar]
- The City of Kirkland. More People, More Places, More Often. In An Active Transportation Plan 2009; The City of Kirkland: Kirkland, WA, USA, 2009; Section 5; pp. 77–91. [Google Scholar]
- World Bank Group. Prioritizing Infrastructure Investment. In Policy Research Working Paper 2016; World Bank Group: Washington, DC, USA, 2016; p. 7674. [Google Scholar]
- Ministry of Land. Infrastructure and Transport. Rules on the Road Structure & Facilities Standards 2020; Ministry of Land: Washington, DC, USA, 2020.
- Rosén, E.; Sander, U. Pedestrian fatality risk as a function of car impact speed. Accid. Anal. Prev. 2009, 41, 536–542. [Google Scholar] [CrossRef]
- Ministry of Land. Infrastructure and Transport. Annual Traffic Volume Statistical Report 2021; Ministry of Land: Washington, DC, USA, 2021.
- Ministry of Land. Infrastructure and Transport. A Handbook of Roads in South Korea, 2021; Ministry of Land: Sejong, Republic of Korea, 2021.
- Ministry of Land. Infrastructure and Transport. National Traffic Survey and DB Construction Report, 2015; Ministry of Land: Washington, DC, USA, 2015.
- Saaty, T.L. Decision making-the Analytic Hierarchy and Network Processes (AHP/ANP). J. Syst. Sci. Syst. Eng. 2004, 13, 1–35. [Google Scholar] [CrossRef]


| Road Type | Minimum Lane Shoulder Width (m) | ||||
|---|---|---|---|---|---|
| Rural Area | Urban Area | Compact Car Lane | |||
| Highway | 3.00 | 2.00 | 2.00 | ||
| Road | Design speed (km/h) | ≥80 | 2.00 | 1.50 | 1.00 |
| 60–80 | 1.50 | 1.00 | 0.75 | ||
| <60 | 1.00 | 0.75 | 0.75 | ||
| Evaluation Indicator | Grade (Score) | ||||||
|---|---|---|---|---|---|---|---|
| Attribute | Quantitative/Qualitative | Evaluation Criteria | A (1.0) | B (0.8) | C (0.6) | D (0.4) | E (0.2) |
| Lane shoulder width | Quantitative | Mean weight of lane shoulder width at the candidate site (m) | ≤0.5 | ≤1.0 | ≤2.0 | ≤3.0 | >3.0 |
| speed limit | Quantitative | Speed limit at the candidate site (km/h) | ≥80 | ≥70 | ≥60 | ≥50 | <50 |
| AADT | Quantitative | AADT at the candidate site | ≥20,000 | ≥10,000 | ≥5000 | ≥2500 | <2500 |
| Traffic accident | Quantitative | Traffic accidents at the candidate site in the past three years (case) | ≥50 | ≥30 | ≥15 | ≥5 | <5 |
| Evaluation Indicator | Grade (Score) | ||||||
|---|---|---|---|---|---|---|---|
| Attribute | Quantitative/Qualitative | Evaluation Criteria | A (1.0) | B (0.8) | C (0.6) | D (0.4) | E (0.2) |
| Connectivity to pedestrian roads | Quantitative + Qualitative | Connectivity to pedestrian roads within the area of candidate site (0–1) | very high (upper 20%) | high (20– 40%) | moderate (40– 60%) | low (60– 80%) | very low (80– 100%) |
| Connectivity to key facilities | Quantitative + Qualitative | Connectivity to public facilities and other key facilities (community hall, village office, etc.) (0–1) | |||||
| Connectivity to traffic facilities | Quantitative + Qualitative | Connectivity to public transportation facilities (bus station, train station, car park, etc.) (0–1) | |||||
| Tourism | Quantitative + Qualitative | Connectivity to rivers, parks, and historic sites (0–1) | |||||
| Evaluation Indicator | Grade (Score) | |||||||||||
|---|---|---|---|---|---|---|---|---|---|---|---|---|
| Attribute | Quantitative/Qualitative | Evaluation Criteria | A (1.0) | B (0.8) | C (0.6) | D (0.4) | E (0.2) | |||||
| Pedestrian population | Quantitative | Permitted number of pedestrians reflecting age; dependent rate of pedestrian travel | ≥2000 | ≥1000 | ≥750 | ≥500 | <500 | |||||
| Category | <20 years | <30 years | <40 years | <50 years | ≥50 years | |||||||
| Pedestrian percentage (%) | 69.87 | 25.84 | 28.64 | 26.21 | 41.01 | |||||||
| Quantitative measure (%) | 36 | 13 | 15 | 14 | 21 | |||||||
| Pedestrian-generating facility | Quantitative | Number of pedestrian-generating facilities per road length (Number of facilities/road length (km) at the candidate site) | ≥30 | ≥15 | ≥10 | ≥5 | <5 | |||||
| Evaluation Indicator | Grade (Score) | ||||||
|---|---|---|---|---|---|---|---|
| Attribute | Quantitative/Qualitative | Evaluation Criteria | A (1.0) | B (0.8) | C (0.6) | D (0.4) | E (0.2) |
| Manager priority | Quantitative | Scoring the road manager priority | very high (1.0–0.8) | high (0.8–0.6) | moderate (0.6–0.4) | low (0.4–0.2) | very low (0.2–0.0) |
| Construction rationale | Quantitative | Analyzing the keywords of pedestrian road construction rationale | n = 4 | n = 3 | n = 2 | n = 1 | n = 0 |
| n | 1 | 2 | 3 | 4 | 5 | 6 | 7 | 8 | 9 | 10 |
|---|---|---|---|---|---|---|---|---|---|---|
| RI | 0 | 0 | 0.52 | 0.89 | 1.11 | 1.25 | 1.35 | 1.40 | 1.45 | 1.49 |
| Evaluation Indicator in the First Hierarchy | Weight of the First Hierarchy | Evaluation Indicator in the Second Hierarchy | Weight of the Second Hierarchy |
|---|---|---|---|
| Pedestrian fatality risk | 0.443 | Mean lane shoulder width | 0.046 |
| Speed limit | 0.127 | ||
| AADT | 0.086 | ||
| Traffic accident | 0.185 | ||
| Surrounding infrastructure | 0.312 | Connectivity to pedestrian roads | 0.127 |
| Connectivity to key facilities | 0.061 | ||
| Connectivity to traffic facilities | 0.071 | ||
| Tourism | 0.053 | ||
| Potential pedestrian demand | 0.136 | Pedestrian population | 0.06 |
| Density of pedestrian-generating facilities | 0.075 | ||
| Manager’s opinion | 0.109 | Manager priority | 0.024 |
| Construction rationale | 0.085 |
| Attribute | Survey Data | AHP Weight (1) (ⓐ) | AHP Weight (2) (ⓑ) | Score (ⓒ) | Converted Score (ⓐ × ⓑ × ⓒ) |
|---|---|---|---|---|---|
| Lane shoulder width | 0.625 m | 0.443 | 0.102 | 0.8 | 0.036 |
| Speed limit | 60 km/h | 0.443 | 0.287 | 0.6 | 0.076 |
| AADT | 8954 | 0.443 | 0.193 | 0.6 | 0.051 |
| Traffic accident | 9 cases | 0.443 | 0.418 | 0.4 | 0.074 |
| Total | 244th rank | 0.238 (23.8) | |||
| Attribute | Survey Data | AHP Weight (1) (ⓐ) | AHP Weight (2) (ⓑ) | Score (ⓒ) | Converted Score (ⓐ × ⓑ × ⓒ) |
|---|---|---|---|---|---|
| Connectivity to pedestrian roads | 18 | 0.312 | 0.408 | 0.90 | 0.115 |
| Connectivity to key facilities | 16 | 0.312 | 0.193 | 0.80 | 0.048 |
| Connectivity to traffic facilities | 17 | 0.312 | 0.228 | 0.85 | 0.060 |
| Tourism | 12 | 0.312 | 0.168 | 0.6 | 0.031 |
| Total | 2nd rank | 0.255 (25.5) | |||
| Attribute | Survey Data | AHP Weight (1) (ⓐ) | AHP Weight (2) (ⓑ) | Score (ⓒ) | Converted Score (ⓐ × ⓑ × ⓒ) |
|---|---|---|---|---|---|
| Pedestrian population | 3177 | 0.135 | 0.444 | 1.0 | 0.060 |
| Pedestrian-generating facility | 17.5 | 0.135 | 0.556 | 0.8 | 0.060 |
| Total | 42nd rank | 0.120 (12.0) | |||
| Attribute | Survey Data | AHP Weight (1) (ⓐ) | AHP Weight (2) (ⓑ) | Score (ⓒ) | Converted Score (ⓐ × ⓑ × ⓒ) |
|---|---|---|---|---|---|
| Management agency priority | 0.8 | 0.109 | 0.222 | 0.8 | 0.019 |
| Road construction rationale | n = 4 | 0.109 | 0.778 | 1.0 | 0.085 |
| Total | 4th rank | 0.104 (10.4) | |||
| Site | Score of Pedestrian Fatality Risk | Score of Surrounding Infrastructure | Score of Potential Pedestrian Demand | Score of Manager’s Opinion | Sum |
|---|---|---|---|---|---|
| 1 | 42.4 | 24.52 | 12.0 | 8.95 | 87.87 |
| 2 | 42.4 | 22.16 | 12.3 | 10.9 | 87.76 |
| 3 | 43.3 | 16.04 | 13.5 | 10.82 | 83.65 |
| 4 | 40.76 | 23.68 | 12.0 | 7.13 | 83.57 |
| 5 | 41.6 | 22.75 | 13.5 | 5.32 | 83.17 |
| 6 | 39.6 | 19.31 | 12.0 | 10.05 | 80.96 |
| 7 | 43.3 | 21.38 | 10.5 | 5.25 | 80.43 |
| 8 | 35.72 | 21.21 | 13.5 | 7.50 | 77.93 |
| 9 | 39.06 | 18.4 | 13.5 | 6.42 | 77.38 |
| 10 | 41.6 | 13.86 | 13.5 | 8.4 | 77.36 |
| 11 | 44.2 | 14.5 | 12.3 | 5.8 | 76.8 |
| 12 | 41.66 | 12.6 | 13.5 | 8.9 | 76.66 |
| · · · | · · · | · · · | · · · | · · · | · · · |
| 385 | 21.12 | 9.02 | 2.7 | 1.8 | 34.64 |
Publisher’s Note: MDPI stays neutral with regard to jurisdictional claims in published maps and institutional affiliations. |
© 2022 by the author. Licensee MDPI, Basel, Switzerland. This article is an open access article distributed under the terms and conditions of the Creative Commons Attribution (CC BY) license (https://creativecommons.org/licenses/by/4.0/).
Share and Cite
Jeon, W.H. Priority-Setting Methodology of Qualitative and Quantitative Analyses for Pedestrian Road Construction: Case Study of a National Highway in South Korea. Sustainability 2022, 14, 16077. https://doi.org/10.3390/su142316077
Jeon WH. Priority-Setting Methodology of Qualitative and Quantitative Analyses for Pedestrian Road Construction: Case Study of a National Highway in South Korea. Sustainability. 2022; 14(23):16077. https://doi.org/10.3390/su142316077
Chicago/Turabian StyleJeon, Woo Hoon. 2022. "Priority-Setting Methodology of Qualitative and Quantitative Analyses for Pedestrian Road Construction: Case Study of a National Highway in South Korea" Sustainability 14, no. 23: 16077. https://doi.org/10.3390/su142316077
APA StyleJeon, W. H. (2022). Priority-Setting Methodology of Qualitative and Quantitative Analyses for Pedestrian Road Construction: Case Study of a National Highway in South Korea. Sustainability, 14(23), 16077. https://doi.org/10.3390/su142316077


