Article

Monetized Estimates of the Ecosystem Service Value of Urban Blue and Green Infrastructure and Analysis: A Case Study of Changsha, China

1
Chang Tech International, Inc., Ellicott City, MD 21042, USA
2
School of Energy and Civil Engineering, Harbin Institute of Technology, Harbin 150006, China
*
Author to whom correspondence should be addressed.
Sustainability 2022, 14(23), 16092; https://doi.org/10.3390/su142316092
Submission received: 21 October 2022 / Revised: 12 November 2022 / Accepted: 29 November 2022 / Published: 1 December 2022

Abstract

:
Urban blue-green infrastructure (BGI) forms the basis of a regional ecosystem. Quantitative calculations can identify the weak points of a typical ecological environment, which is helpful for providing a basis for the spatial planning and ecological environment protection of developing cities. Currently, assessment of BGI ecosystem services focuses on local temperature, climate, and entertainment aesthetics, and the integrity of ecological indicators needs improvement. The assessment is usually conducted within large blue-green areas such as parks and rivers, and street greening is typically ignored. Roof gardens and unmanaged blue-green spaces also have ecosystem service functions. Therefore, our study aimed to extract the basic design distribution of urban blue-green spaces more accurately and monetize the value of its ecosystem services. Changsha, one of the top ten ecologically competitive cities in China, was the research focus. First, four types of BGI, forest, grassland, wetland, and waterbody, were extracted using remote sensing images and ArcGIS10.8. Second, the adjusted value coefficient was used to quantify the service value and geographic spatial distribution of the four BGI ecosystems in monetary terms. The results showed that in 2020, the total economic value of ecosystem services (ESV) generated by BGI in the study area was CNY 36.25 billion. Among ecosystem services, forest land climate regulation and waterbody hydrological regulation accounted for the largest proportion, at CNY 6.543 and 15.132 billion, respectively. The urban center had the weakest climate regulation capacity, and the Xiangjiang River Basin had the strongest hydrological regulation capacity. The urban center had the lowest ESV, thus requiring the attention of urban planners in the future. This study evaluated and optimized the distribution of BGI in Changsha according to the ESV of the existing BGI to help improve the ESV of the city center and create a green, ecological, and healthy city.

1. Introduction

Blue-green infrastructure (BGI) includes green-space-containing urban parks, gardens, nature reserves, forests, and other public green facilities, as well as blue spaces, such as rivers, lakes, and wetlands [1]. It has rich ecological and social benefits and is closely related to residents’ well-being. Its most important function is to provide ecosystem services for cities [2]. Over the past 30 years, rapid urbanization and large-scale urban construction and human activities have had a profound impact on land use. The considerable urban expansion and land use changes have led to the fragmentation and contraction of urban landscapes, and a large amount of BGI has been converted into constructed land. According to statistics, the growth rate of China’s urban construction area is 5.33%. By 2021, China’s urban population will account for 63.89%, an increase of 18.49%, from the urbanization rate in 2020 [3]. Urban expansion and urban population explosion have led to increased demand for BGI, and residents need to obtain appropriate BGI resources.
The themes of urban public space, BGI, and biodiversity were widely discussed in the United Nations Sustainable Development Goals (SDG) agreed upon by the United Nations in 2015 [4,5]. Blue-green infrastructure is considered a nature-based solution, which can provide a series of other ecosystem services for cities and their hinterlands [6]. Donati suggested increasing the intervention measures for urban BGI to enhance urban biodiversity [7]. However, if BGI is undertaken as large-scale manual intervention measures, the urban landscape patches will be fragmented, which will become an obstacle to the connectivity of natural habitats, thus causing a negative impact on biodiversity. At present, it is necessary to take regions with serious human threats as key areas for biodiversity conservation [8], and give full play to the synergy between biodiversity and ecosystem functions. Su believed that blue-green space was a positive factor in regulating the urban heat island effect [9]. In fact, green space can provide increased thermal stress relief in the required time, whereas improperly designed blue space may aggravate the thermal effect under pressure [10]. For example, the irregular shapes of lakes and reservoirs may weaken the cooling effect, but the remodeling of rivers may not [11]. Further research is needed on the compatibility between green and blue spaces. The city is a place where people focus their activities; therefore, BGI services should be connected to residents as much as possible. Blue-green infrastructure can provide physical and mental products, environmental resources, and ecological public welfare to maintain urban human activities and residents’ physical and mental health [12], such as forest and fruit tree production, landscape aesthetics, and entertainment. However, owing to different space forms and types, blue-green spaces often have different impacts on residents. Zhou studied the impact of small and micro blue-green spaces on residents’ social interaction [13]. The results showed that many blue-green space characteristics, such as accessibility, hydrophilicity, breadth of vision, diversity of facilities, sense of spatial belonging, and green vision rate are significantly related to social interaction. In addition, urban wilderness, cemeteries, unmanaged areas, family gardens, canals, rivers, and their riverside areas, and even industrial infrastructure, such as sewage treatment and waste recycling plants, can also make important contributions to urban ecosystem services. It is possible to form spatial and functional (semi-) natural blue and green landscape pattern networks to support and optimize urban ecosystems [14].
Since the 1980s, geographic information systems and remote sensing technologies have developed rapidly. Scholars have obtained long-term dynamic data and research details from multitemporal historical remote sensing images. Remote sensing technology is widely used to monitor landscape pattern changes at different scales, vegetation dynamics, and in related studies [15]. Based on the demand for ecosystem service modeling and mapping, countries around the world have developed relevant models and tools, among which the InVEST model [16], which has positive monitoring effects on land use change, landscape pattern evolution, and habitat quality improvement, is widely used. However, owing to the reliability of the model, there are some deficiencies in the study of habitat quality using the InVEST model. The habitat quality calculated by the InVEST model is the superposition of threats, and the impact of multiple collective threats is far higher than the sum of individual threats; hence, there is an error in the habitat quality value calculated by the model. The indicator evaluation method is also used to discuss the relationship between ecosystem services. For example, Larondelle et al. used an indicator method to analyze the ecosystem services of several European cities [17]. The relationship between the two is different in different cities and at different scales. The evaluation index is constructed, and the variation in surface temperature under different BGI models is studied, which is helpful in clarifying the thermal environment effect of BGI. However, during actual indicator selection, the evaluation index is easily affected by the subjective judgment of researchers, which affects the objectivity of the results. Cui attempted to analyze ecological connectivity to locate the ecological source and used the minimum cost distance method to study and build a regional BGI ecological network system to avoid the challenges of spatial autocorrelation, heterogeneity, and non-stationarity [18].
As a rapidly rising representative city in central China, Changsha has good BGI resources and is one of the top ten cities with the highest ecological competitiveness in China. Owing to its development along the main banks of the Xiangjiang River, the city has a variety of types of BGI with a network radiation [19]. The city has been rated as the “happiest city in China” for 13 consecutive years. Our study aimed to monetize the ecosystem service value of urban BGI within a spatial perspective, because a monetary ecosystem service value is easy for people to understand and for decision-makers to use and can effectively assist urban spatial planning, ecological control, and ecological restoration [20]. A framework of BGI extraction-calculation-typical ecosystem service value determination–spatial planning was explored and designed that specifically included: (1) an innovative approach to the extraction range of the study area, which was based on the impervious area of the city, which means that areas with obvious BGI ecosystem services will be identified, and (2) comparing the extraction effect of remotely sensed BGI under different parameters. The normalized difference vegetation index (VDVI) showed the best extraction effect. Four BGI, including forest land, grassland, wetland, and waterbody, were extracted. (3) Among the 11 ecosystem services evaluated, four of the most typical BGI ecosystem service values were selected, and their spatial correlation was evaluated using ArcGIS10.8 and GeoDa1.2. (4) Based on the calculation results of ecosystem service value, in this study, the unreasonable problems of the spatial distribution of BGI were analyzed and planning suggestions are put forward. Our results will provide suggestions for the city to further improve BGI planning and build urban environmental space, drive the entire society toward a “blue-green” state, and provide reference for blue-green space construction in other provinces of China.

2. Materials and Methods
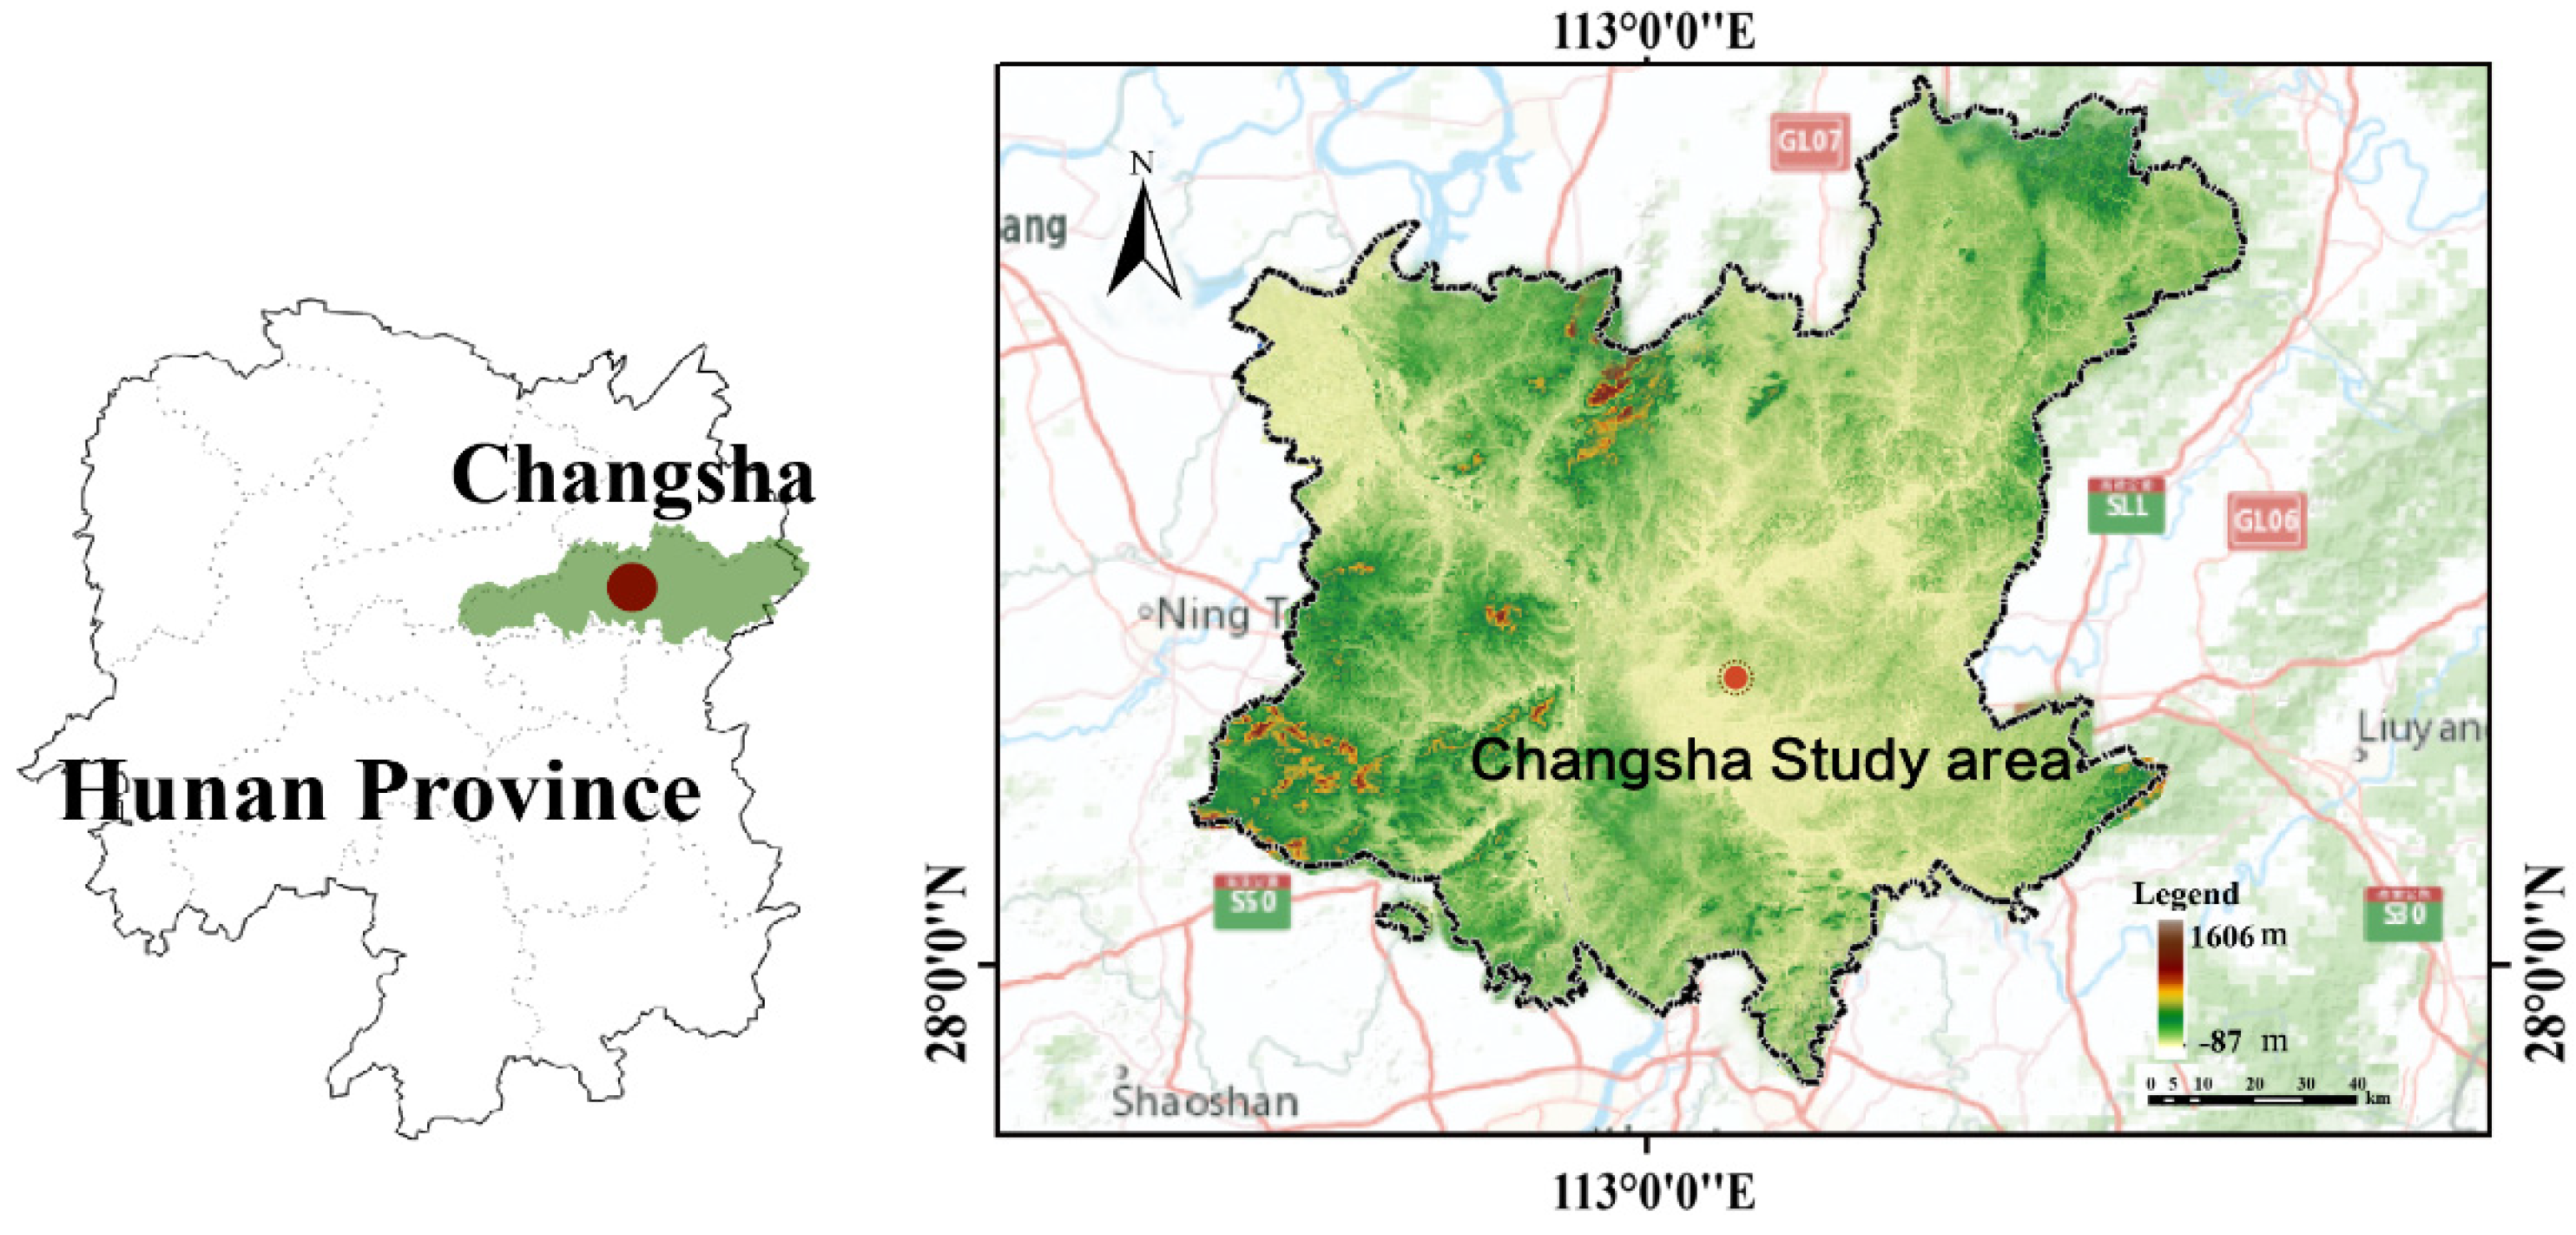
2.1. Study Area

Changsha is the capital of Hunan Province, China. It is located in the northeast of Hunan Province, near the lower reaches of the Xiangjiang River and the western edge of the Changsha basin. It is 111°53′ E–114°15′ E, 27°51′ N–28°41′ N, with a total boundary area of 11,819 km2. After nearly 30 years of rapid urbanization, the construction area has reached 567.32 km2, and the resident population had reached 10,239,300 by the end of 2017. The large population scale and urbanization have led to high demand for ecosystem services. The climate belongs to the subtropical monsoon climate, with evergreen blue-green infrastructures. Now, Yuelu Mountain, Orange Island, Meixi Lake Wetland, and other types of blue green infrastructure have been built. Therefore, grasping the ecological services of BGI and proposing a reasonable BGI planning direction is an important direction for the healthy and sustainable development of the city, which is also consistent with the policy guidance of the Hunan provincial government to jointly build an ecological, green city in Changsha, Zhuzhou and Xiangtan [21]. The scope of the study area determined based on the impervious surface is shown in Figure 1.

2.2. Data Source

Three types of geographic datasets were used in this study, as listed in Table 1.

2.3. Method

2.3.1. Identification of the Range of Urban Ecological Space

The identification of the extent of urban ecological space is mainly determined by the spread of enhanced impervious surface [25], which mainly comprises roads, parking lots, town squares, roofs, and other buildings in the city. It is an ecological and environmental factor that affects urban surface runoff, the hydrological cycle, water quality, local climate, and biodiversity. It is also an important indicator for detecting urban ecosystem and environmental changes [26]. Based on the standardized differential impermeable surface index [27], the enhanced normalized differential impermeable surface index (ENDISI) was used to extract and identify the impermeable surfaces [28]. The ENDISI, with a numerical range of [−1–1], was calculated as shown in Equation (1).
ENDISI = 2 × B   +   SWIR 2   /   2 R + N I R + S W I R   /   3   2 × B   +   SWIR 2   /   2 + R + N I R + S W I R   /   3
where B (blue), SWIR2 (short-wave infrared (IR) 2), R (red), NIR (near IR), and SWIRl (short-wave IR 1) represent spectral bands selected based on Landsat8 data.
Taking the B6 band as the selected value, the corresponding ENDISI of the impermeable water surface in Changsha was [0–0.7734], as shown in Figure 2. The impermeable surface of the city was mainly concentrated in the first and third rings of the city. Based on the discontinuity of the impermeable surface and the administrative division of Changsha City, the boundary of the study area was extracted from the main urban area, as shown in Figure 3, which defines the regional extent for the extraction of BGI and the calculation of the BGI ecosystem service value.

2.3.2. Extraction of BGI

The BGI in the research area was extracted using remote sensing images. Generally, three main image classification technologies are used in remote sensing: unsupervised image classification, supervised image classification, and object-based image analysis. Among these, unsupervised and image classification techniques are the two most commonly used methods [29,30]. However, the classification of urban remote sensing images with rich content and large amounts of ground information is insufficient [31,32]. Object-oriented image classification uses both spectral and context information, and its pixels can be divided into representative shapes and sizes in the process of multiresolution segmentation or segment mean offset; therefore, it has higher accuracy [33]. Blaschke believes that with the availability of high-altitude resolution images [34], object-oriented image classification is better than traditional pixel-based classification and can achieve higher and more complex texture features [35]. The Google images used in this study use an object-oriented approach, owing to their high and low spectral resolutions.
Many attempts have been made to develop methods to objectively identify the best segmentation parameters, most of which are multiresolution segmentations [36]. The proportional parameter estimation (ESP) method was used to depict the image object [37]. The rate of change (ROC) method is used in ESP to evaluate the dynamic local variance (LV) from one object scale to another. The ROC curve expression is shown in Equation (2).
ROC = [ L L 1 L 1 ]   ×   100
where L is the LV value at a certain target level and L − 1 is the LV value of the lower level.
Images were automatically segmented with fixed-scale parameter increments, and the LV was calculated as the average standard deviation of each object scale obtained from the segmentation. The LV dynamics were also assessed using a measure called the ROC. The peaks in the ROC–LV plot represent the image-level data properties that determine the optimal image segmentation scale [38]. After image segmentation, many adjacent patch objects were obtained. In the present study, VDVI was calculated for each plaque object [39]. The VDVI was found to have higher blue-green spatial identification accuracy than the normalized green-red difference index or evergreen index [40]. The VDVI was calculated as shown in Equation (3).
V VDVI = 2 G R + B 2 G + R + B
where VVDVI is the index result and G, R, and B are the green, red, and blue light bands, respectively.

2.3.3. Calculation of Urban Ecosystem Service Value

According to references [41], the basic ecosystem service value per unit area in Changsha is CNY 2570.98/hm2, calculated from the data of Hunan Statistical Yearbook and Hunan Food Trading Center [42]. Combining the value-equivalent factors of different ecosystem services (Table 2) [43], the ecological service value of blue and green infrastructure per unit area of different ecosystem services in Changsha is calculated. The calculation formula is shown in Formula (4). Finally, the total ecosystem service value of blue-green infrastructure is obtained by adding the values of various ecosystem services. The calculation formula is shown in Formula (5), and the calculation results are shown in Table 3.
The evaluation model is as follows.
Vci = Ei × VC
where Vci is the BGI ecological service value per unit area of class i ecological service (CNY/hm2), Ei is the value-equivalent factor for the class i ecological service, and VC is the basic ecological service value per unit area of Changsha (CNY/hm2). Using Equation (4), the value of ecological services in the BGI was obtained from the values of various ecological services.
ESV = i Vci     ×   A
where ESV is the total value of ecosystem services, and A is the blue-green infrastructure area (hm2), as shown in Equation (5).

2.3.4. Moran’s Index of BGI Ecosystem Service Value

In order to improve the accuracy of the assessment of ecosystem service value of blue-green infrastructure and visualize the ecosystem service value of different locations in the space, this study uses the fishing net analysis function of ArcGIS 10.8, adopts the equidistant grid sampling method, and uses each grid as the sample for ecosystem service assessment. According to existing research [45], the size of the fishing net was determined to be 2–5 times the average patch area. The study area was divided into 2 km × 2 km grids, and 1110 ecosystem service sample plots were obtained, shown in Figure 4. The ecosystem service value of each grid is calculated as the ecosystem service level of the sample center. Then, the spatial interpolation is used to obtain the ecosystem service value of several typical blue-green infrastructures in the whole study area. Finally, the global Moran index and local Moran index were calculated by Geoda software to measure the overall spatial distribution pattern and local spatial difference characteristics of blue-green infrastructure ecosystem service value.

3. Results

3.1. Extraction Results of BGI

To achieve the best extraction effect of the BGI, we used several segmentation scales and the vegetation index in ENVI5.3 for comparative analysis. The results show that the best segmentation scale data for the BGI is 31, and the VDVI is better than the other evaluated indices. The results based on the ESP multiscale segmentation tool are shown in Figure 5.
Four segmentation scales, 31, 42, 50, and 61, were selected to demonstrate the best BGI extraction results for the study area (Figure 6).
To compare the accuracy of the BGI extraction of different vegetation indices, we selected a residential BGI region as the research object. The accuracy of the VDVI was higher than that of the evergreen and normalized green-red difference indices (Figure 7). We applied the broad concept of BGI, which includes open spaces that can provide ecosystem services, to the research scope and comprehensively evaluated the ecosystem service value of the BGI. Therefore, the scope of this study includes the BGI in the study area, such as forest land, nature reserves, wetlands, beaches, and river waters, which are specifically divided into four types of BGI, namely, forest, grassland, wetland, and waterbody, as shown in Figure 8.

3.2. Calculation of Urban Ecosystem Service Value

To quantitatively assess the service value of the BGI ecological system, the present study used the ESV changes in the urban land cover based on the unit-area-value-equivalent factor assessment proposed by [46]. According to the Hunan Statistical Yearbook, the average grain output in 2020 was 6765.74 kg/hm2, and the national average grain purchase price was CNY 2.66/kg. According to this principle, the ecosystem-service-equivalent coefficient of the economic value standard is 1/7 of the cultivated land area per unit of ecosystem economic value, and the basic ecosystem service value per unit area in Changsha is CNY 2570.98/hm2. Using the monetized ESV evaluation method, the total economic value of ecosystem services generated by the BGI in the study area in 2020 was CNY 37.99 billion. Among the ecosystem services, climate and hydrological regulation accounted for the largest proportion, at approximately CNY 6.26 and 13.73 billion, respectively. The highest value for hydrological regulation was from waterbody, at CNY 7.35 billion, and that for climate regulation from forest land was CNY 5.72 billion (Figure 9), followed by biodiversity and gas regulation, at approximately CNY 3.88 and 3.92 billion, respectively. Soil conservation, clean the situation, and improving the landscape aesthetics were valued at CNY 3.00, 2.48, and 1.93 billion, respectively. Other ecosystem service types, including food production, raw material production, nutrient recycling maintenance, and water provisioning services, had relatively low values, with the water supply being negative.
From the perspective of the ecological service value of BGI per unit area in Changsha, the ecological service value per unit area of water area is the highest, followed by wetland and forest land, and the ecosystem service value per unit area of grassland is the lowest. Among the service values of the grassland ecosystem, maintaining nutrient circulation is the lowest, while wetlands and water areas also provide the most important value source for cultural services (Table 3). The evaluation results of ecosystem service value of different land uses are reflected in the research scope and space. The Xiangjiang River Basin and its surrounding mountain forest land in the study area have significant ecosystem functions.

3.3. Classification and Mapping of Ecosystem Services

3.3.1. Spatial Distribution of Ecosystem Service Value

To further study the spatial distribution of individual ecosystem service values, four typical ecosystem service values were selected. These included climate regulation under regulation services, water supply under provisioning services, biodiversity under supporting services, and cultural and entertainment services, and their spatial and geographical distribution was quantitatively calculated and mapped using ArcGIS10.8 (Figure 10).
(1)
Climate regulation services
Blue-green infrastructure can effectively facilitate carbon sequestration and exchange capacity to release oxygen. The spatial distribution of the climate regulation service capacity of green spaces in Changsha is shown in Figure 10a, which is consistent with the extraction distribution of the BGI. The forest in the northwest had the best climate regulation effect, indicating that large forests with less human activity and a high forest coverage rate are the main contributors. Studies [47] have shown that forest parks have the most well-known effects on climate regulation and cooling. The worst climate regulation was in built-up central urban areas, which are associated with dense population activity and construction of impervious urban surfaces. The urban heat island effect and air pollution hinder the climate regulation capacity of the ecosystem to some extent. In addition, some studies [48] have found that natural BGI in urban areas has a weak climate regulation capacity. Therefore, suburban areas with high vegetation coverage can provide more climate regulation and supervision services.
(2)
Biodiversity Services
The spatial distribution of biodiversity services is shown in Figure 10b. High biodiversity services were concentrated in the east because the area contains forest and grassland, which do not have large areas of human activity, and the landscape patches are relatively uniform. Low-value areas were concentrated in the north, central, and south belts, indicating the presence of several landscape patches and low biodiversity stability. The overall biodiversity was therefore highly fragmented.
(3)
Water regulation ability
The results of urban water conservation are shown in Figure 10c. From a spatial distribution perspective, the BGI of the Xiangjiang river waters showed an outstanding ability in regulating runoff. Turquoise infrastructure transformation has been reported to reduce the flood peak by 80% and slow down the runoff, thereby playing a key role in water regulation capacity [49]. However, this conclusion has been questioned under heavy rainfall conditions, because the relationship between different rainfall types, soil management, and soil erosion is not yet clear [50]. The wetland waters in the northwest also had a significant hydrological regulation capacity, whereas the hydrological regulation in urban areas was generally weak, because the downtown impervious surface is an important factor affecting urban water balance, which increases the rainwater runoff area [51].
(4)
Culture and Entertainment Services
Results of cultural and entertainment services are shown in Figure 10d, which can further help our understanding of ecosystem service capabilities with different BGI. The highest overall cultural service value was for BGI associated with water, followed by the forest, grassland, and waterbody. This indicates that most people visit BGI near the city to engage in high-density activities (running, roller skating, dancing, cycling, swimming), low-density activities (walking, yoga, meditation), social activities, child supervision, and landscape appreciation [52]. The evaluation of the entertainment activities in BGI through social media further confirmed that BGI mainly provides the ecosystem services of landscape appreciation and sports relaxation. When BGI has a good landscape effect, natural services become the main function of BGI. Ridding believed that a park with a large area of water is closely related to the natural service function of the park [53]. The number of park visitors showed a strong correlation with the BGI area, water, and total area and had the highest correlation with the BGI area. The recent COVID-19 outbreak suggests that recreational activity shifted to more natural green areas shortly after restrictions on access to BGI were removed, suggesting that people are extremely likely to choose large views of recreation, a natural heritage, or areas with cognitive value, in large woodland and urban areas.

3.3.2. Spatial Correlation Analysis of BGI Ecosystem Service Value

To better understand and optimize the existing BGI, we used the GeoDa tool to create four ecosystem service values. The global Moran’s indices of the four ecosystem service values were 0.563, 0.415, 0.388, and 0.488, indicating that the urban green spatial ecosystem service value had a positive spatial correlation and the highest spatial correlation (Figure 11). Among these, the highest Moran index of BGI climate regulatory services was 0.563, indicating that a BGI with a higher climate regulatory capacity is more likely to produce a higher ecosystem service value [54]. The Moran’s index of the BGI water regulation capacity had a minimum value of 0.388. Considering that it is located in the middle of Changsha City, Hunan Province, and is the largest river under the influence of urban development and construction processes, the ecosystem service value is relatively stable [55]. The Moran indices for biodiversity and culture and entertainment were 0.415 and 0.488, respectively, which also showed an obvious spatial correlation.
The relationship of local Moran’s indices with the BGI ecosystem service value is shown in Figure 12. The LISA clustering map can be intuitively analyzed. The overall spatial aggregation degree were the H-H and L-L models, and the service values of the four ecosystems were quite different in the city center. Climate regulation services and biodiversity were in an L-L aggregation mode, which mainly indicates that the service level of climate regulation and biodiversity in the BGI of the central city is low, and cultural and recreational activities and water regulation capacity are in an H-H aggregation mode. This ecosystem service value was highly affected by the original geographical environment and human activity.

3.4. Optimization Strategy of BGI Based on Ecosystem Service Value

Based on the calculation of the ecosystem service value of different BGI types, the present study clarified the value of ecosystem services provided by each BGI and the geographical spatial distribution of the four typical ecosystem services. The purpose of this study was to improve the ecosystem service value of BGI and propose corresponding BGI optimization schemes and restoration strategies, as shown in Figure 13. First, the ecosystem service capacity of different types of BGI should be improved and a diversified BGI built. According to our results, among all BGI types, the forest-type BGI had the best climate regulation effect, and the water-type BGI had the best water regulation ability. Moreover, the water-type BGI exhibited the best cultural and entertainment function because of its good location conditions and presence near the city center; however, the ecosystem service value of grassland-type BGI was small. Therefore, in the planning process, the connectivity of the city with landscape resources should be increased as much as possible, and the diversified development of the ecosystem service value of BGI balanced, thereby meeting people’s needs for waterfront BGI and forest BGI in daily life.
Second, attention should be paid to biodiversity. Owing to large-scale human interference and urban construction, the landscape is fragmented, the BGI connectivity of the same patch is disturbed, and biological mobility is affected. It is necessary to establish an ecological safety network connection, determine the optimal buffer zone range of urban–rural connection and urban structural corridor, improve the biological habitat environment, and strictly protect the mountain area in the outer suburbs. Relocation of the industrial land in the mountain area, protection of the forest land in the outer suburbs, and repair of the forest land in the mountain area that has been damaged by urban development is suggested. The strict protection of the forest BGI also provides the urban residents with the value of sightseeing and recreation. Furthermore, the mountain forest land with a relatively gentle slope and altitude can be considered for improvement, and a relatively small patch area as an urban park that provides a place of activity for urban residents. Increasing the density of urban parks can also increase the patch density of BGI and improve the ecosystem service value of BGI as a whole.
Finally, it is suggested to establish a flexible supply and demand mechanism of population and BGI and to build BGI in a refined way to make BGI accessible and visible. For example, we should strengthen the travel development of big data networks, optimize the route and time selection by the green accessibility index, web map, and other services, so as to reduce the pressure of BGI, balance the number of BGI, and solve the problem of unfair green distribution. Under the concept of human land integration and symbiosis, the BGI should be reasonably distributed to increase the internal and external connectivity of the green and enhance the accessibility of the park, so as to realize the construction of an ecological and healthy city.

4. Discussion

We calculated and analyzed the ecosystem service value and spatial distribution of BGI in Changsha based on the ecosystem service value. Results showed that BGI can reduce the environmental pressure caused by human activities, such as poor climate and water shortage [56]. For river-type cities, the value of water resource regulation of BGI is higher than that of climate regulation and culture and entertainment. The characteristics of the BGI play a crucial role in people’s choices and support the value of contact with nature [57]. The forest-type BGI on the outer edge of the city, the water-type BGI with a large body of water, and the scattered grassland-type BGI contribute differently to ecosystem service value. At a microscale, solving the high-density use of short-distance BGI and improving the accessibility of long-distance BGI should become a focus in the future.
In general, the study of the spatial relationship between BGI and ESV from the perspective of urban planning and geographical space is of great significance for optimizing the layout of BGI. However, as the calculation of ecosystem service value is affected by factors such as land type composition and subjective consciousness [58], determining the ecosystem service value is time-consuming and subjective; therefore, discussing the evolution of correlation over a long period of time is more meaningful [59].

4.1. Comparison of BGI Ecosystem Service Value and Spatial Model Results

Construction of BGI can reduce the environmental pressure caused by human activities, such as bad weather and water shortage [60]. Compared with previous results, the water resource regulation value of BGI was much higher than that of climate regulation and culture and entertainment, and the ecological value of forest land was also higher. In terms of influencing factors, this was mainly due to the different natural urban conditions. For example, in the subtropical region of China, water resources mainly play a role in improving the ecological footprint model [61]. The relationship between water resources, energy, and food security is key to the ecological balance in developed African countries [62]. The ecological service results of blue infrastructure water resources showed great differences, owing to different urban geographical locations. The spatial pattern of BGI distribution is also an important factor affecting the quality of urban ecosystem services. In our study, the ecological value of forest climate regulation gradually decreased from the edge of the region, and the green resources in the city center were often unevenly distributed. The United States has attempted to transform green infrastructure planning to solve the irregular distribution of green resources in downtown areas [63]. The BGI model of Ethiopia fully draws on public opinion, focusing on the connectivity of green infrastructure based on interviews and observations[64]. In addition, green infrastructure planning for flood areas and wetlands in poor African cities can effectively reduce the challenges of tropical floods [65]. This is related to the different blue-green resources in the study area.

4.2. Impact on the Blue-Green Ecological Security Pattern of Changsha

The index of ecosystem service evaluation, determined with the aid of China’s ecosystem-service-value-equivalent factor, the average grain price in the study area, and the ESV calculation formula indicated that the ecosystem service in the city center will be at a low level in 2020, which is related to the rapid development of the region’s economy [66]. For example, the original forests on both banks of the river have been cut to develop commercial blocks and residential areas, resulting in low ecological quality. Therefore, government departments should formulate relevant policies to improve vegetation coverage in Shizhong District and enhance the ecological and environmental awareness of residents [67]. This will be conducive to the future urban ecological balance and green, healthy, and sustainable development. The ESV calculation in the present study covers comprehensive urban BGI resources such as green roof gardens, unmanaged urban blue and green areas, and family green spaces.

4.3. Policy Significance

Based on the monetization estimation of BGI ecosystem services, an increase in the construction of urban blue and green resources is suggested to address the problem of uneven distribution of BGI resources [68]. In terms of economic development, we should encourage transformation and upgrading to clean energy and close heavily polluting enterprises to restore corresponding ecosystem services. In terms of government policies, we should increase support for environmental protection policies and popularize environmental protection education. In terms of population distribution, we should encourage people to obtain employment in a relatively decentralized way and ease the ecological pressure caused by excessive population concentration.

4.4. Research Limitations and Future Prospects

The results of the present study can be used to evaluate the ecosystem service value of urban BGI and to judge whether urban planning and blue-green space layout are reasonable. However, this study had some limitations. First, we only evaluated the spatial match between the ecological capacity of BGI and human activities and did not consider continuous spatial and temporal changes. Second, only four types of BGI were considered in this study. Categorizing according to different principles could lead to different results. Therefore, our future research framework will consider multiple periods, aim to establish a dynamic interaction model between BGI and ESV [69], and update the ecological assessment methods in time to promote the in-depth development of an overall ecological assessment.

5. Conclusions

Population growth, intensive road network construction, and extensive urban-scale expansion are considered to be the main reasons for the loss of BGI and the imbalance of ecological systems. This study established a spatial analysis and integration framework for the service value estimation of an urban blue-green ecosystem. Based on refined extraction of urban BGI, this study analyzed the ecosystem service value of four different types of BGI, quantitatively expressed the ecosystem service value of different BGI and mapped these values to urban space, and analyzed whether the geographical spatial distribution was reasonable. This study can provide a planning basis for relevant departments to conduct urban planning and improve the urban environment. The specific conclusions are as follows.
(1)
Urban BGI provides ecosystem services for the sustainable development of cities. Therefore, the starting point for optimizing BGI lies in areas with the greatest population activity intensity, such as areas with intensive living, shopping, and catering facilities.
(2)
Regarding climate regulation services, urban centers have the weakest regulatory capacity. The government should plan to design more BGI in economically underdeveloped areas to meet the demand and increase the capacity of forest and water BGI to play a role in climate regulation and water resource protection. In addition, it is necessary to protect the natural BGI within the city because this natural land can be easily replaced by urban land, and restoring the original state is difficult. Therefore, protecting this land should be a priority in future development plans.
(3)
In terms of cultural services, the urban fringe showed a high trend, indicating that people were more inclined to travel away from the city and enjoy nature. Therefore, we should increase the natural elements of the city and the basic service structure that interacts with nature.
(4)
Low-value areas for water resource management services are mainly distributed in peripheral small towns. These small centers contain a portion of the population, and the intensity of human activities is also high. However, in urban planning, these areas could be easily overlooked because high-quality BGI is mainly planned in the largest urban center, whereas vulnerable social population areas have scattered and small BGI, which also reflects the environmental inequality in these economically underdeveloped areas [70]. Generally, high-income residents attract investment in public facilities, whereas relatively low-income residents are at a disadvantage. Therefore, optimizing the BGI construction of these small city centers is necessary.
Finally, according to the research results, alongside the economic and social development of a city, measures must be taken to establish a more reasonable BGI space, especially in areas with weak ecosystem services, so that economic development and environmental construction can develop harmoniously.

Author Contributions

Conceptualization, X.G. and C.-C.C.; methodology, X.G.; software, X.G.; validation, X.G. and C.-C.C.; formal analysis, C.-C.C.; investigation, X.G.; resources, C.-C.C.; data curation, X.G.; writing—original draft preparation, X.G.; writing—review and editing, C.-C.C.; visualization, X.G.; supervision, C.-C.C.; project administration, C.-C.C.; funding acquisition, C.-C.C. All authors have read and agreed to the published version of the manuscript.

Funding

This research received no external funding.

Institutional Review Board Statement

Not applicable.

Informed Consent Statement

Not applicable.

Data Availability Statement

All open datasets for this study are available from the corresponding author upon reasonable request.

Acknowledgments

All individuals included in this section have agreed to confirm.

Conflicts of Interest

The authors declare no conflict of interest.

References

  1. Kati, V.; Jari, N. Bottom-up Thinking—Identifying Socio-Cultural Values of Ecosystem Services in Local Blue–Green Infrastructure Planning in Helsinki, Finland. Land Use Policy 2016, 50, 537–547. [Google Scholar] [CrossRef]
  2. Daily, G.; Postel, S.; Bawa, K.; Kaufman, L. Nature’s Services: Societal Dependence on Natural Ecosystems; Bibliovault OAI Repository, the University of Chicago Press: Chicago, IL, USA, 1997. [Google Scholar]
  3. Main Data of the Seventh National Population Census. Available online: http://www.stats.gov.cn/english/PressRelease/202105/t20210510_1817185.html (accessed on 6 November 2022).
  4. Meschede, C. The Sustainable Development Goals in Scientific Literature: A Bibliometric Overview at the Meta-Level. Sustainability 2020, 12, 4461. [Google Scholar] [CrossRef]
  5. THE 17 GOALS|Sustainable Development. Available online: https://sdgs.un.org/goals (accessed on 2 November 2022).
  6. Bozovic, R.; Maksimovic, C.; Mijic, A.; Smith, K.M.; Suter, I.; Van Reeuwijk, M. Blue Green Solutions. A Systems Approach to Sustainable and Cost-Effective Urban Development; Urban Fluid Mechanics: London, UK, 2017. [Google Scholar] [CrossRef]
  7. Donati, G.F.A.; Bolliger, J.; Psomas, A.; Maurer, M.; Bach, P.M. Reconciling Cities with Nature: Identifying Local Blue-Green Infrastructure Interventions for Regional Biodiversity Enhancement. J. Environ. Manag. 2022, 316, 115254. [Google Scholar] [CrossRef] [PubMed]
  8. Wang, Y.; Zhu, L.; Yang, X.; Zhang, X.; Wang, X.; Pei, J.; Zhou, L.; Luo, Z.; Fang, Q.; Liang, M.; et al. Evaluating the Conservation Priority of Key Biodiversity Areas Based on Ecosystem Conditions and Anthropogenic Threats in Rapidly Urbanizing Areas. Ecol. Indic. 2022, 142, 109245. [Google Scholar] [CrossRef]
  9. Su, X.; Zhang, K.; Chang, Q. The pattern of block blue green infrastructure based on MSPA and its thermal mitigation characteristics. J. Ecol. 2022, 41, 1173–1181. (In Chinese) [Google Scholar] [CrossRef]
  10. Gunawardena, K.R.; Wells, M.J.; Kershaw, T. Utilising Green and Bluespace to Mitigate Urban Heat Island Intensity. Sci. Total Environ. 2017, 584–585, 1040–1055. [Google Scholar] [CrossRef]
  11. Lin, Y.; Wang, Z.; Jim, C.Y.; Li, J.; Deng, J.; Liu, J. Water as an Urban Heat Sink: Blue Infrastructure Alleviates Urban Heat Island Effect in Mega-City Agglomeration. J. Clean. Prod. 2020, 262, 121411. [Google Scholar] [CrossRef]
  12. Zijlema, W.L.; Avila-Palencia, I.; Triguero-Mas, M.; Gidlow, C.; Maas, J.; Kruize, H.; Andrusaityte, S.; Grazuleviciene, R.; Nieuwenhuijsen, M.J. Active Commuting through Natural Environments Is Associated with Better Mental Health: Results from the PHENOTYPE Project. Environ. Int. 2018, 121, 721–727. [Google Scholar] [CrossRef]
  13. Zhou, Y.; Liu, M.; Yang, Q.; Guo, Y. The Influence of Small Blue and Green Space Characteristics on Different Types of Social Exchanges of ResidentsTaking the East Lake Greenway in Wuhan as an Example. Gardens 2022, 39, 87–94. (In Chinese) [Google Scholar]
  14. Dige, G.; Eales, R.; Baker, J.; Sheate, W.; Zamparutti, T.; Ferner, B.; Banko, G.; Eckerberg, K. Green Infrastructure and Territorial Cohesion the Concept of Green Infrastructure and Its Integration into Policies Using Monitoring Systems; European Environment Agency: Copenhagen, Denmark, 2011. [Google Scholar]
  15. Cheng, C.; Hu, Y.; Zhao, M. Research progress and prospect of spatio-temporal evolution of urban green space pattern and evaluation of ecosystem services. Prog. Geogr. Sci. 2020, 39, 1770–1782. (In Chinese) [Google Scholar] [CrossRef]
  16. Zhang, X.; Li, X.; Lv, C.; Bi, T.; Xia, L.; Guo, Y.; Sun, B. Research progress in application of ecosystem services based on InVEST model. Ecol. Sci. 2022, 41, 237–242. (In Chinese) [Google Scholar] [CrossRef]
  17. Larondelle, N.; Haase, D. Urban Ecosystem Services Assessment along a Rural–Urban Gradient: A Cross-Analysis of European Cities. Ecol. Indic. 2013, 29, 179–190. [Google Scholar] [CrossRef]
  18. Cui, L.; Wang, J.; Sun, L.; Lv, C. Construction and Optimization of Green Space Ecological Networks in Urban Fringe Areas: A Case Study with the Urban Fringe Area of Tongzhou District in Beijing. J. Clean. Prod. 2020, 276, 124266. [Google Scholar] [CrossRef]
  19. He, L.; Wan, J.; Zhu, M.; Shi, X. Response of ecosystem service value to land use change in changsha city. Hunan J. Ecol. Sci. 2017, 4, 41–47. (In Chinese) [Google Scholar]
  20. de Groot, R.; Brander, L.; van der Ploeg, S.; Costanza, R.; Bernard, F.; Braat, L.; Christie, M.; Crossman, N.; Ghermandi, A.; Hein, L.; et al. Global Estimates of the Value of Ecosystems and Their Services in Monetary Units. Ecosyst. Serv. 2012, 1, 50–61. [Google Scholar] [CrossRef]
  21. Zhou, H.; Li, Q. From Changsha Zhuzhou Xiangtan Urban Agglomeration to Changsha Zhuzhou Xiangtan Metropolitan Circle—Interpretation of the Development Plan of Changsha Zhuzhou Xiangtan Metropolitan Circle. China Investig. 2022, 66–70. [Google Scholar]
  22. Geospatial Data Cloud. Available online: http://www.gscloud.cn/search (accessed on 21 July 2022).
  23. Gong, P.; Li, X.; Wang, J.; Bai, Y.; Chen, B.; Hu, T.; Liu, X.; Xu, B.; Yang, J.; Zhang, W.; et al. Annual Maps of Global Artificial Impervious Area (GAIA) between 1985 and 2018. Remote Sens. Environ. 2020, 236, 111510. [Google Scholar] [CrossRef]
  24. NICFI Basemaps in GEE. Available online: https://developers.planet.com/docs/integrations/gee/nicfi/ (accessed on 14 July 2022).
  25. Zhong, J.; Li, Z.; Sun, Z.; Tian, Y.; Yang, F. The Spatial Equilibrium Analysis of Urban Green Space and Human Activity in Chengdu, China. J. Clean. Prod. 2020, 259, 120754. [Google Scholar] [CrossRef]
  26. Liu, H.; Wang, L.; Peng, J. Research progress in remote sensing monitoring and application of impervious surface Prog. Geogr. Sci. 2010, 29, 1143–1152. (In Chinese) [Google Scholar]
  27. Wang, T.; Zhao, L.; Wu, J.; Zhang, P.; Zhang, N.; Zhang, B. Discussion on Improved Normalized Difference Impervious Surface Index. Surv. Mapp. Spat. Geogr. Inf. 2015, 38, 182–185. (In Chinese) [Google Scholar]
  28. Mu, C.; Ji, W.; Zhang, L.; Chen, H. A new enhanced impervious surface index. Sci. Surv. Mapp. 2018, 43, 83–87. (In Chinese) [Google Scholar] [CrossRef]
  29. GISGeography Supervised and Unsupervised Classification in Remote Sensing. Available online: https://gisgeography.com/supervised-unsupervised-classification-arcgis/ (accessed on 17 July 2022).
  30. Zhang, X. The Application of Remote Sensing Image Processing in Urban Green Space Extraction. Ph.D. Thesis, Xi’an University of Architecture and Technology, Xi’an, China, 2018. (In Chinese). [Google Scholar]
  31. Weih, R.; Riggan, N. Object-Based Classification vs. Pixel-Based Classification: Comparitive Importance of Multi-Resolution Imagery. Int. Arch. Photogramm. Remote Sens. Spat. Inf. Sci.-Isprs Arch. 2010, 38, C7. [Google Scholar]
  32. Blaschke, T. Object Based Image Analysis for Remote Sensing. ISPRS J. Photogramm. Remote Sens. 2010, 65, 2–16. [Google Scholar] [CrossRef] [Green Version]
  33. Ruggeri, S.; Henao-Cespedes, V.; Garcés-Gómez, Y.A.; Parra Uzcátegui, A. Optimized Unsupervised CORINE Land Cover Mapping Using Linear Spectral Mixture Analysis and Object-Based Image Analysis. Egypt. J. Remote Sens. Space Sci. 2021, 24, 1061–1069. [Google Scholar] [CrossRef]
  34. Anders, N.; Seijmonsbergen, A.; Bouten, W. Segmentation Optimization and Stratified Object-Based Analysis for Semi-Automated Geomorphological Mapping. Remote Sens. Environ. 2011, 115, 2976–2985. [Google Scholar] [CrossRef]
  35. Esch, T.; Thiel, M.; Bock, M.; Roth, A.; Dech, S. Improvement of Image Segmentation Accuracy Based on Multiscale Optimization Procedure. IEEE Geosci. Remote Sens. Lett. 2008, 5, 463–467. [Google Scholar] [CrossRef] [Green Version]
  36. Maxwell, T.; Zhang, Y. A Fuzzy Approach to Supervised Segmentation Parameter Selection for Object-Based Classification. In Proceedings of the ASPRS 2006 Annual Conference, Reno, NV, USA, 1–5 May 2006. [Google Scholar]
  37. Drǎguţ, L.; Tiede, D.; Levick, S.R. ESP: A Tool to Estimate Scale Parameter for Multiresolution Image Segmentation of Remotely Sensed Data. Int. J. Geogr. Inf. Sci. 2010, 24, 859–871. [Google Scholar] [CrossRef] [Green Version]
  38. Belgiu, M.; Drǎguţ, L. Comparing Supervised and Unsupervised Multiresolution Segmentation Approaches for Extracting Buildings from Very High Resolution Imagery. Isprs J. Photogramm. Remote Sens. 2014, 96, 67–75. [Google Scholar] [CrossRef] [Green Version]
  39. Wu, J.; Liu, X.; Tong, X.; Luo, M.; Duan, M.; Wang, L. Vegetation classification in arid and semi-arid areas based on objectOriented method. Classif. Arid Areas 2020, 37, 1026–1034. (In Chinese) [Google Scholar] [CrossRef]
  40. Ling, X.; Liu, H.; Ji, P.; Hu, H.; Wang, H.; Hou, X. Estimation of Vegetation Coverage Based on VDVI Index of UAV Image: A Case Study of Shenmu Shelterbelt Project in Shaanxi Province. For. Eng. 2021, 37, 57–66. (In Chinese) [Google Scholar] [CrossRef]
  41. Lei, P.; Han, C.; Yang, B.; Wang, L.; Wang, P.; Li, B. The leaf area index (LAI) of different cotton varieties was monitored using UAV digital images. Chin. Cotton 2018, 45, 9–15. (In Chinese) [Google Scholar]
  42. Hunan Provincial Bureau of Statistics—Statistical Yearbook. Available online: http://tjj.hunan.gov.cn/tjsj/tjnj/ (accessed on 7 November 2022).
  43. Xie, D.; Zhang, X.; Zhang, S.; Xiao, Y.; Lu, X. The value of ecosystem services in China. Resour. Sci. 2015, 37, 1740–1746. (In Chinese) [Google Scholar]
  44. Xie, D.; Lu, X. Value evaluation of ecological assets in qinghai-tibet plateau. J. Nat. Resour. 2003, 18, 189–196. (In Chinese) [Google Scholar] [CrossRef]
  45. Tian, P.; Li, L.; Shi, L.; Wang, L.; Liu, Q. Spatial and temporal changes of land use pattern and ecological risk assessment in Zhejiang Province. Resour. Environ. Yangtze River Val. 2018, 27, 2697–2706. (In Chinese) [Google Scholar]
  46. Huang, M.; Xiao, Y.; Lv, X. Advances in Research on the Supply Demand Relationship and Spatial Flow of Ecosystem Services. J. Resour. Ecol. 2022, 13, 925–935. (In Chinese) [Google Scholar]
  47. Ding, H.; Chiabai, A.; Silvestri, S.; Nunes, P.A.L.D. Valuing Climate Change Impacts on European Forest Ecosystems. Ecosyst. Serv. 2016, 18, 141–153. [Google Scholar] [CrossRef]
  48. Nero, B.F.; Callo-Concha, D.; Anning, A.; Denich, M. Urban Green Spaces Enhance Climate Change Mitigation in Cities of the Global South: The Case of Kumasi, Ghana. Procedia Eng. 2017, 198, 69–83. [Google Scholar] [CrossRef]
  49. Haghighatafshar, S.; Nordlöf, B.; Roldin, M.; Gustafsson, L.-G.; la Cour Jansen, J.; Jönsson, K. Efficiency of Blue-Green Stormwater Retrofits for Flood MitigationConclusions Drawn from a Case Study in Malmö, Sweden. J. Environ. Manag. 2018, 207, 60–69. [Google Scholar] [CrossRef]
  50. Zheng, H.; Nie, X.; Liu, Z.; Mo, M.; Song, Y. Identifying Optimal Ridge Practices under Different Rainfall Types on Runoff and Soil Loss from Sloping Farmland in a Humid Subtropical Region of Southern China. Agric. Water Manag. 2021, 255, 107043. [Google Scholar] [CrossRef]
  51. Wang, K.; Onodera, S.; Saito, M.; Shimizu, Y. Long-Term Variations in Water Balance by Increase in Percent Imperviousness of Urban Regions. J. Hydrol. 2021, 602, 126767. [Google Scholar] [CrossRef]
  52. Grzyb, T.; Kulczyk, S.; Derek, M.; Woźniak, E. Using Social Media to Assess Recreation across Urban Green Spaces in Times of Abrupt Change. Ecosyst. Serv. 2021, 49, 101297. [Google Scholar] [CrossRef]
  53. Ridding, L.E.; Redhead, J.W.; Oliver, T.H.; Schmucki, R.; McGinlay, J.; Graves, A.R.; Morris, J.; Bradbury, R.B.; King, H.; Bullock, J.M. The Importance of Landscape Characteristics for the Delivery of Cultural Ecosystem Services. J. Environ. Manag. 2018, 206, 1145–1154. [Google Scholar] [CrossRef] [PubMed] [Green Version]
  54. Li, F.; Zhang, F.; Li, X.; Wang, P.; Liang, J.; Mei, Y.; Cheng, W.; Qian, Y. Spatiotemporal Patterns of the Use of Urban Green Spaces and External Factors Contributing to Their Use in Central Beijing. Int. J. Environ. Res. Public Health 2017, 14, 237. [Google Scholar] [CrossRef] [PubMed]
  55. Jing, Z.; An, W.; Zhang, S.; Xia, Z. Flood Control Ability of River-Type Reservoirs Using Stochastic Flood Simulation and Dynamic Capacity Flood Regulation. J. Clean. Prod. 2020, 257, 120809. [Google Scholar] [CrossRef]
  56. Wang, X.; Meng, Q.; Zhang, L.; Hu, D. Evaluation of Urban Green Space in Terms of Thermal Environmental Benefits Using Geographical Detector Analysis. Int. J. Appl. Earth Obs. Geoinf. 2021, 105, 102610. [Google Scholar] [CrossRef]
  57. Schindler, M.; Le Texier, M.; Caruso, G. How Far Do People Travel to Use Urban Green Space? A Comparison of Three European Cities. Appl. Geogr. 2022, 141, 102673. [Google Scholar] [CrossRef]
  58. Wang, C.; Xi, T.; Liu, R.; Zhou, W.; Xu, R. Spatial and Temporal Response of Ecological Service Value to Land Use Change: A Case Study of Xuzhou City. Remote Sens. Nat. Resour. 2021, 33, 219–228. (In Chinese) [Google Scholar]
  59. Ramdani, F.; Setiani, P. Spatio-Temporal Analysis of Urban Temperature in Bandung City, Indonesia. Urban Ecosyst 2014, 17, 473–487. [Google Scholar] [CrossRef]
  60. Battemarco, B.P.; Tardin-Coelho, R.; Veról, A.P.; de Sousa, M.M.; da Fontoura, C.V.T.; Figueiredo-Cunha, J.; Barbedo, J.M.R.; Miguez, M.G. Water Dynamics and Blue-Green Infrastructure (BGI): Towards Risk Management and Strategic Spatial Planning Guidelines. J. Clean. Prod. 2022, 333, 129993. [Google Scholar] [CrossRef]
  61. Zhang, M.; Ao, Y.; Liu, M.; Zhao, Y.; Lin, K.; Cheng, T. Ecological Security Assessment Based on Ecosystem Service Value and Ecological Footprint in the Pearl River Delta Urban Agglomeration, China. Ecol. Indic. 2022, 144, 109528. [Google Scholar] [CrossRef]
  62. Muhirwa, F.; Shen, L.; Elshkaki, A.; Zhong, S.; Hu, S.; Hirwa, H.; Chiaka, J.C.; Umarishavu, F.; Mulinga, N. Ecological Balance Emerges in Implementing the Water-Energy-Food Security Nexus in Well-Developed Countries in Africa. Sci. Total Environ. 2022, 833, 154999. [Google Scholar] [CrossRef]
  63. Grabowski, Z.J.; McPhearson, T.; Pickett, S.T.A. Transforming US Urban Green Infrastructure Planning to Address Equity. Landsc. Urban Plan. 2023, 229, 104591. [Google Scholar] [CrossRef]
  64. Girma, Y.; Terefe, H.; Pauleit, S.; Kindu, M. Urban Green Infrastructure Planning in Ethiopia: The Case of Emerging Towns of Oromia Special Zone Surrounding Finfinne. J. Urban Manag. 2019, 8, 75–88. [Google Scholar] [CrossRef]
  65. Douglas, I. The Challenge of Urban Poverty for the Use of Green Infrastructure on Floodplains and Wetlands to Reduce Flood Impacts in Intertropical Africa. Landsc. Urban Plan. 2018, 180, 262–272. [Google Scholar] [CrossRef]
  66. Nassauer, J.I.; Wu, J.G.; Xiang, W.-N. Actionable Urban Ecology in China and the World: Integrating Ecology and Planning for Sustainable Cities. Landsc. Urban Plan. 2014, 125, 207–208. [Google Scholar] [CrossRef]
  67. Astiaso Garcia, D. Green Areas Management and Bioengineering Techniques for Improving Urban Ecological Sustainability. Sustain. Cities Soc. 2017, 30, 108–117. [Google Scholar] [CrossRef]
  68. Wang, S.; Palazzo, E. Sponge City and Social Equity: Impact Assessment of Urban Stormwater Management in Baicheng City, China. Urban Clim. 2021, 37, 100829. [Google Scholar] [CrossRef]
  69. Shittu, W.; Adedoyin, F.F.; Shah, M.I.; Musibau, H.O. An Investigation of the Nexus between Natural Resources, Environmental Performance, Energy Security and Environmental Degradation: Evidence from Asia. Resour. Policy 2021, 73, 102227. [Google Scholar] [CrossRef]
  70. Nyelele, C.; Kroll, C.N. The Equity of Urban Forest Ecosystem Services and Benefits in the Bronx, NY. Urban For. Urban Green. 2020, 53, 126723. [Google Scholar] [CrossRef]
Figure 1. Location of study area.
Sustainability 14 16092 g001
Figure 2. Scatter plots for different ENDISI values.
Sustainability 14 16092 g002
Figure 3. Spatial location of the impervious areas in Changsha City.
Sustainability 14 16092 g003
Figure 4. Division of ecosystem service value units.
Sustainability 14 16092 g004
Figure 5. Schematic diagram of multi-scale segmentation of ESP tool.
Sustainability 14 16092 g005
Figure 6. Different proportions of image segmentation.
Sustainability 14 16092 g006
Figure 7. Blue-green infrastructure extracted using different vegetation indices.
Sustainability 14 16092 g007
Figure 8. Extraction of four blue-green infrastructures.
Sustainability 14 16092 g008
Figure 9. Service value of BGI ecosystem in Changsha.
Sustainability 14 16092 g009
Figure 10. Spatial distribution of four ecosystem services.
Sustainability 14 16092 g010
Figure 11. Moran’s scatter plot of blue-green infrastructure ecosystem services.
Sustainability 14 16092 g011
Figure 12. LISA clustering diagram of blue-green infrastructure ecosystem services.
Sustainability 14 16092 g012
Figure 13. Optimization strategy of blue-green infrastructure.
Sustainability 14 16092 g013
Table 1. Geographic datasets.
DataResolutionDescription
ASTGTM230 mThe latest version of DEM data jointly released by NASA and METI in 2019 is based on V2, adding 360,000 optical stereo pair data, which is mainly used to reduce the blank area of elevation value and the numerical anomaly of water area. With this version of the data, there are basically no holes in DEM [22].
Landsat8 OLI30 mL1T data (“geospatial data cloud”, n.d.) can be used to extract large-scale urban impermeable surfaces, and the change from permeable to impermeable is determined using a comprehensive method of supervised classification and temporal consistency check. Water impermeable pixels are defined as being more than 50% water impermeable [23].
Google earth image4.7 mProvides biannual composite satellite images [24].
Table 2. Classification and value equivalents of ecosystem service functions per unit area [44].
Provisioning Services Regulating Services Supporting Services Cultural
Services
FPPMWSGCCRCSHRSCMCBDLA
Forest0.290.660.342.176.501.934.472.650.202.411.06
Grassland0.100.140.080.511.340.440.980.620.050.560.25
Wetland0.510.502.591.903.603.6024.232.310.187.874.73
Water area0.800.238.290.772.295.55102.240.930.072.551.89
Note: FP—Food production; PM—Production of material; WS—Water supply; GC—Gas conditioning; CR—Climate regulation; CS—Clean the situation; HR—Hydrological regulation; SC—Soil conservation; MC—Maintain nutrient circulation; BD—Biodiversity; LA—Landscape aesthetics.
Table 3. Ecosystem service value of BGI per unit area (CNY 10,000).
Ecological Service FunctionEcological ServicesForestGrasslandWetlandWater AreaTotal
Provisioning servicesFood production0.170.070.350.521.11
Production of material0.380.120.260.120.88
Water supply0.180.041.305.166.67
Regulating serviceGas conditioning2.090.280.990.393.74
Climate regulation3.260.851.801.257.16
Clean the situation0.970.341.902.785.99
Hydrological regulation2.240.5212.1551.2666.17
Supporting servicesSoil conservation1.490.311.520.573.89
Maintain nutrient
circulation
0.150.030.090.060.33
Biodiversity1.640.324.011.367.33
Cultural servicesLandscape aesthetics0.750.132.370.954.19
Total 13.323.0026.7564.40107.47
Publisher’s Note: MDPI stays neutral with regard to jurisdictional claims in published maps and institutional affiliations.

