Assessment of Accessibility of Public Transport by Using Temporal and Spatial Analysis
Abstract
1. Introduction
2. Related Literature
- measured by infrastructure equipment—the use of infrastructure equipment indicators,
- measured by distance—the distance (physical, time, economic) between the source and destination,
- cumulative (isochronous)—an estimate of the set of destinations available at a given time, cost, or effort,
- potential—the possibility of interaction between a starting point of travel and a set of destinations,
- personified—related to the individual socioeconomic characteristics of the road user.
2.1. The Temporal Aspect of Accessibility of Public Transport
- the frequency of departures of public transport vehicles, usually defined by the number of trips in the period examined [50],
- accessibility to a means of transport, characterized as the time required to walk to a stop [51],
- the time needed to travel by means of transport, characterized as the time needed to travel by means of transport to the destination [34].
- gross journey time—characterized as the total travel time between two door-to-door points,
- net journey time—characterized as the travel time between boarding the first vehicle and leaving the last vehicle,
- gross transport time—defined as the time required to travel between two points in a transport system, excluding time spent waiting to transfer,
- net transport time—characterized as the time necessary to travel between two points in a transport system, excluding traffic delays and technical delays.
2.2. The Spatial Aspect of Accessibility of Public Transport
2.3. Assessment of Accessibility of Public Transport Using Spatial Analysis
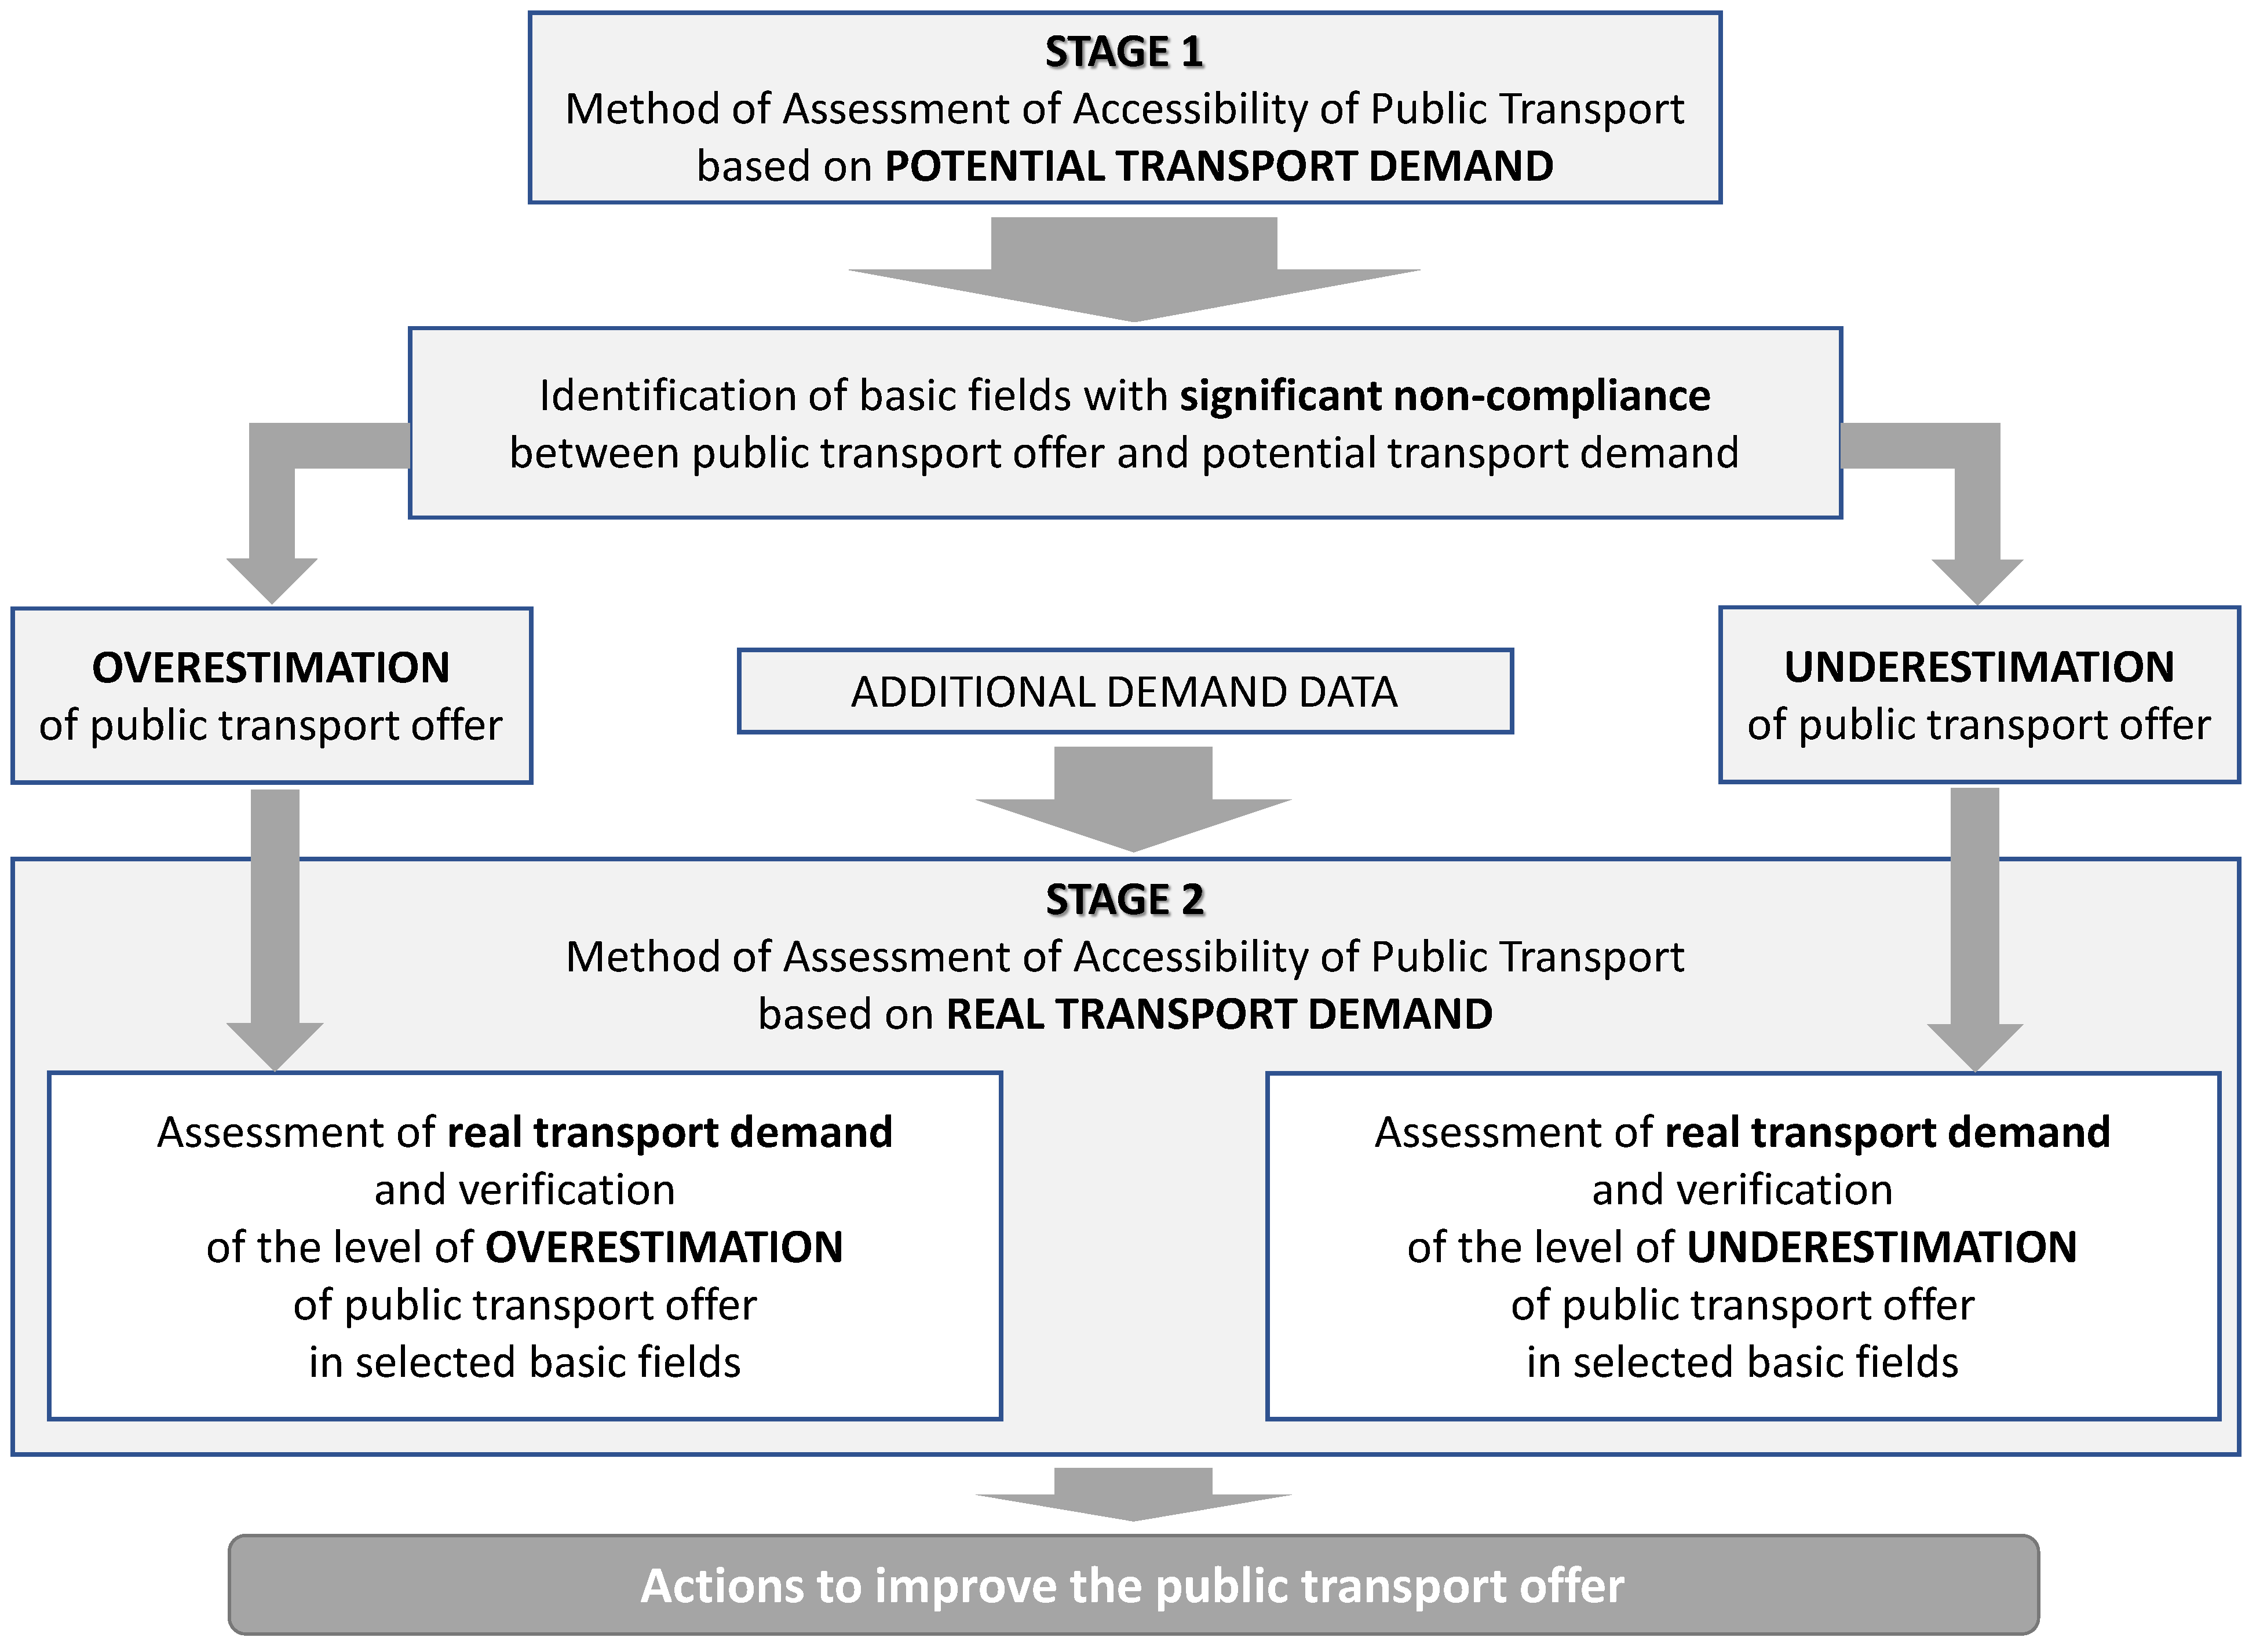
- we propose a new research method to assess accessibility of public transport services using spatial and temporal analysis,
- the method allows effective analysis based on easily accessible data, because it is based on spatial analyses with the land use measures to assess potential transport demand,
- our approach may be treated as the first stage of further in-depth analyses for the fields where significant non-compliance has been identified in this respect.
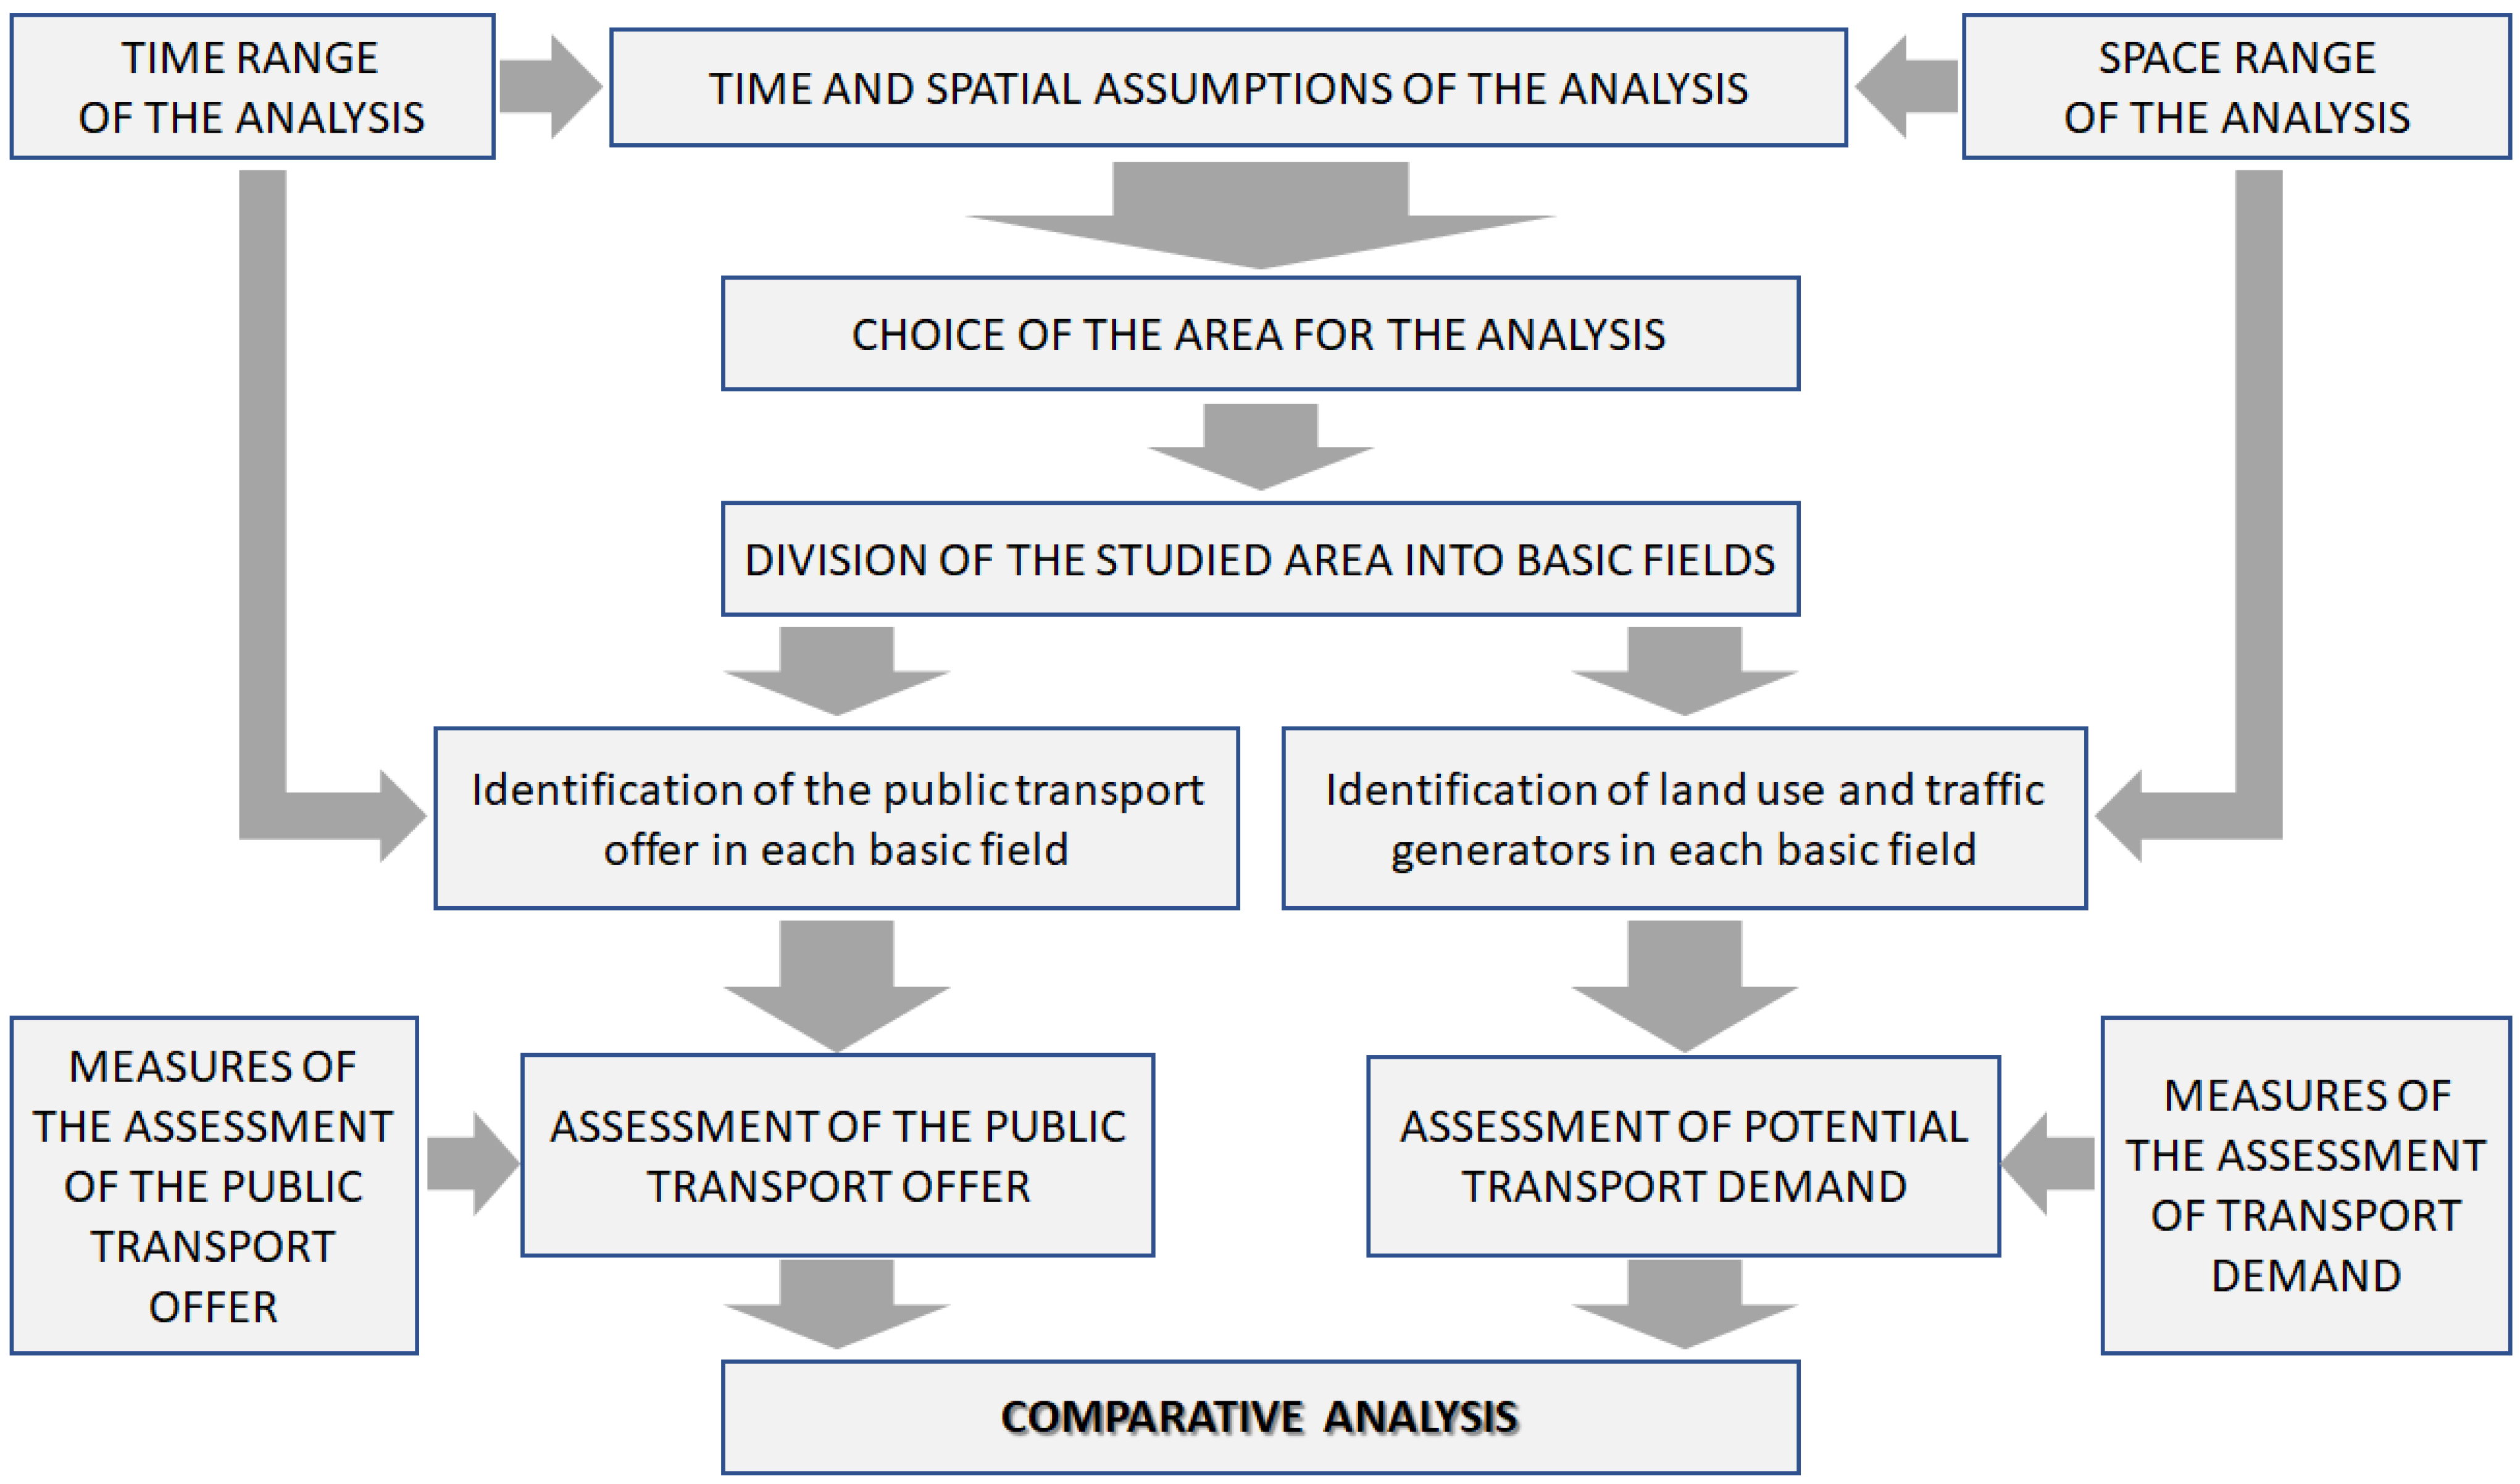
3. Research Method
- -
- regarding the assessment of the accessibility of public transport service:
- the analysis covered only working days,
- the working day has been divided into five time periods, that is:
- ○
- period 1—from 4 a.m. to 6 a.m.—the period before the morning peak,
- ○
- period 2—from 6 a.m. to 9 a.m.—the morning rush period,
- ○
- period 3—from 9 a.m. to 2 p.m.—the inter-peak period,
- ○
- period 4—from 2 p.m. to 5 p.m.—the afternoon rush period,
- ○
- period 5—from 5 p.m. to 11 p.m.—the period after the afternoon rush,
- -
- regarding the assessment of potential transport demand:
- traffic generators are divided into 5 categories, i.e.,:
- ○
- category 1—single-family housing,
- ○
- category 2—low multi-family housing,
- ○
- category 3—high multi-family housing,
- ○
- category 4—workplaces,
- ○
- category 5—schools.
- exclusion of fields located on the administrative boundaries of the area under study,
- inclusion of entire fields located on the administrative boundaries of the area under study,
- analysis of fields located on the administrative boundaries of the area only in the part that belongs to the area; it requires cutting the fields to the administrative boundaries of the area and appropriate recalculation of the attributes of these fields, considering their different area in relation to other fields, the area of which is entirely within the boundaries of the area under study.
3.1. Assessment of the Potential Transport Demand
3.2. Assessment of Accessibility of Public Transport Service
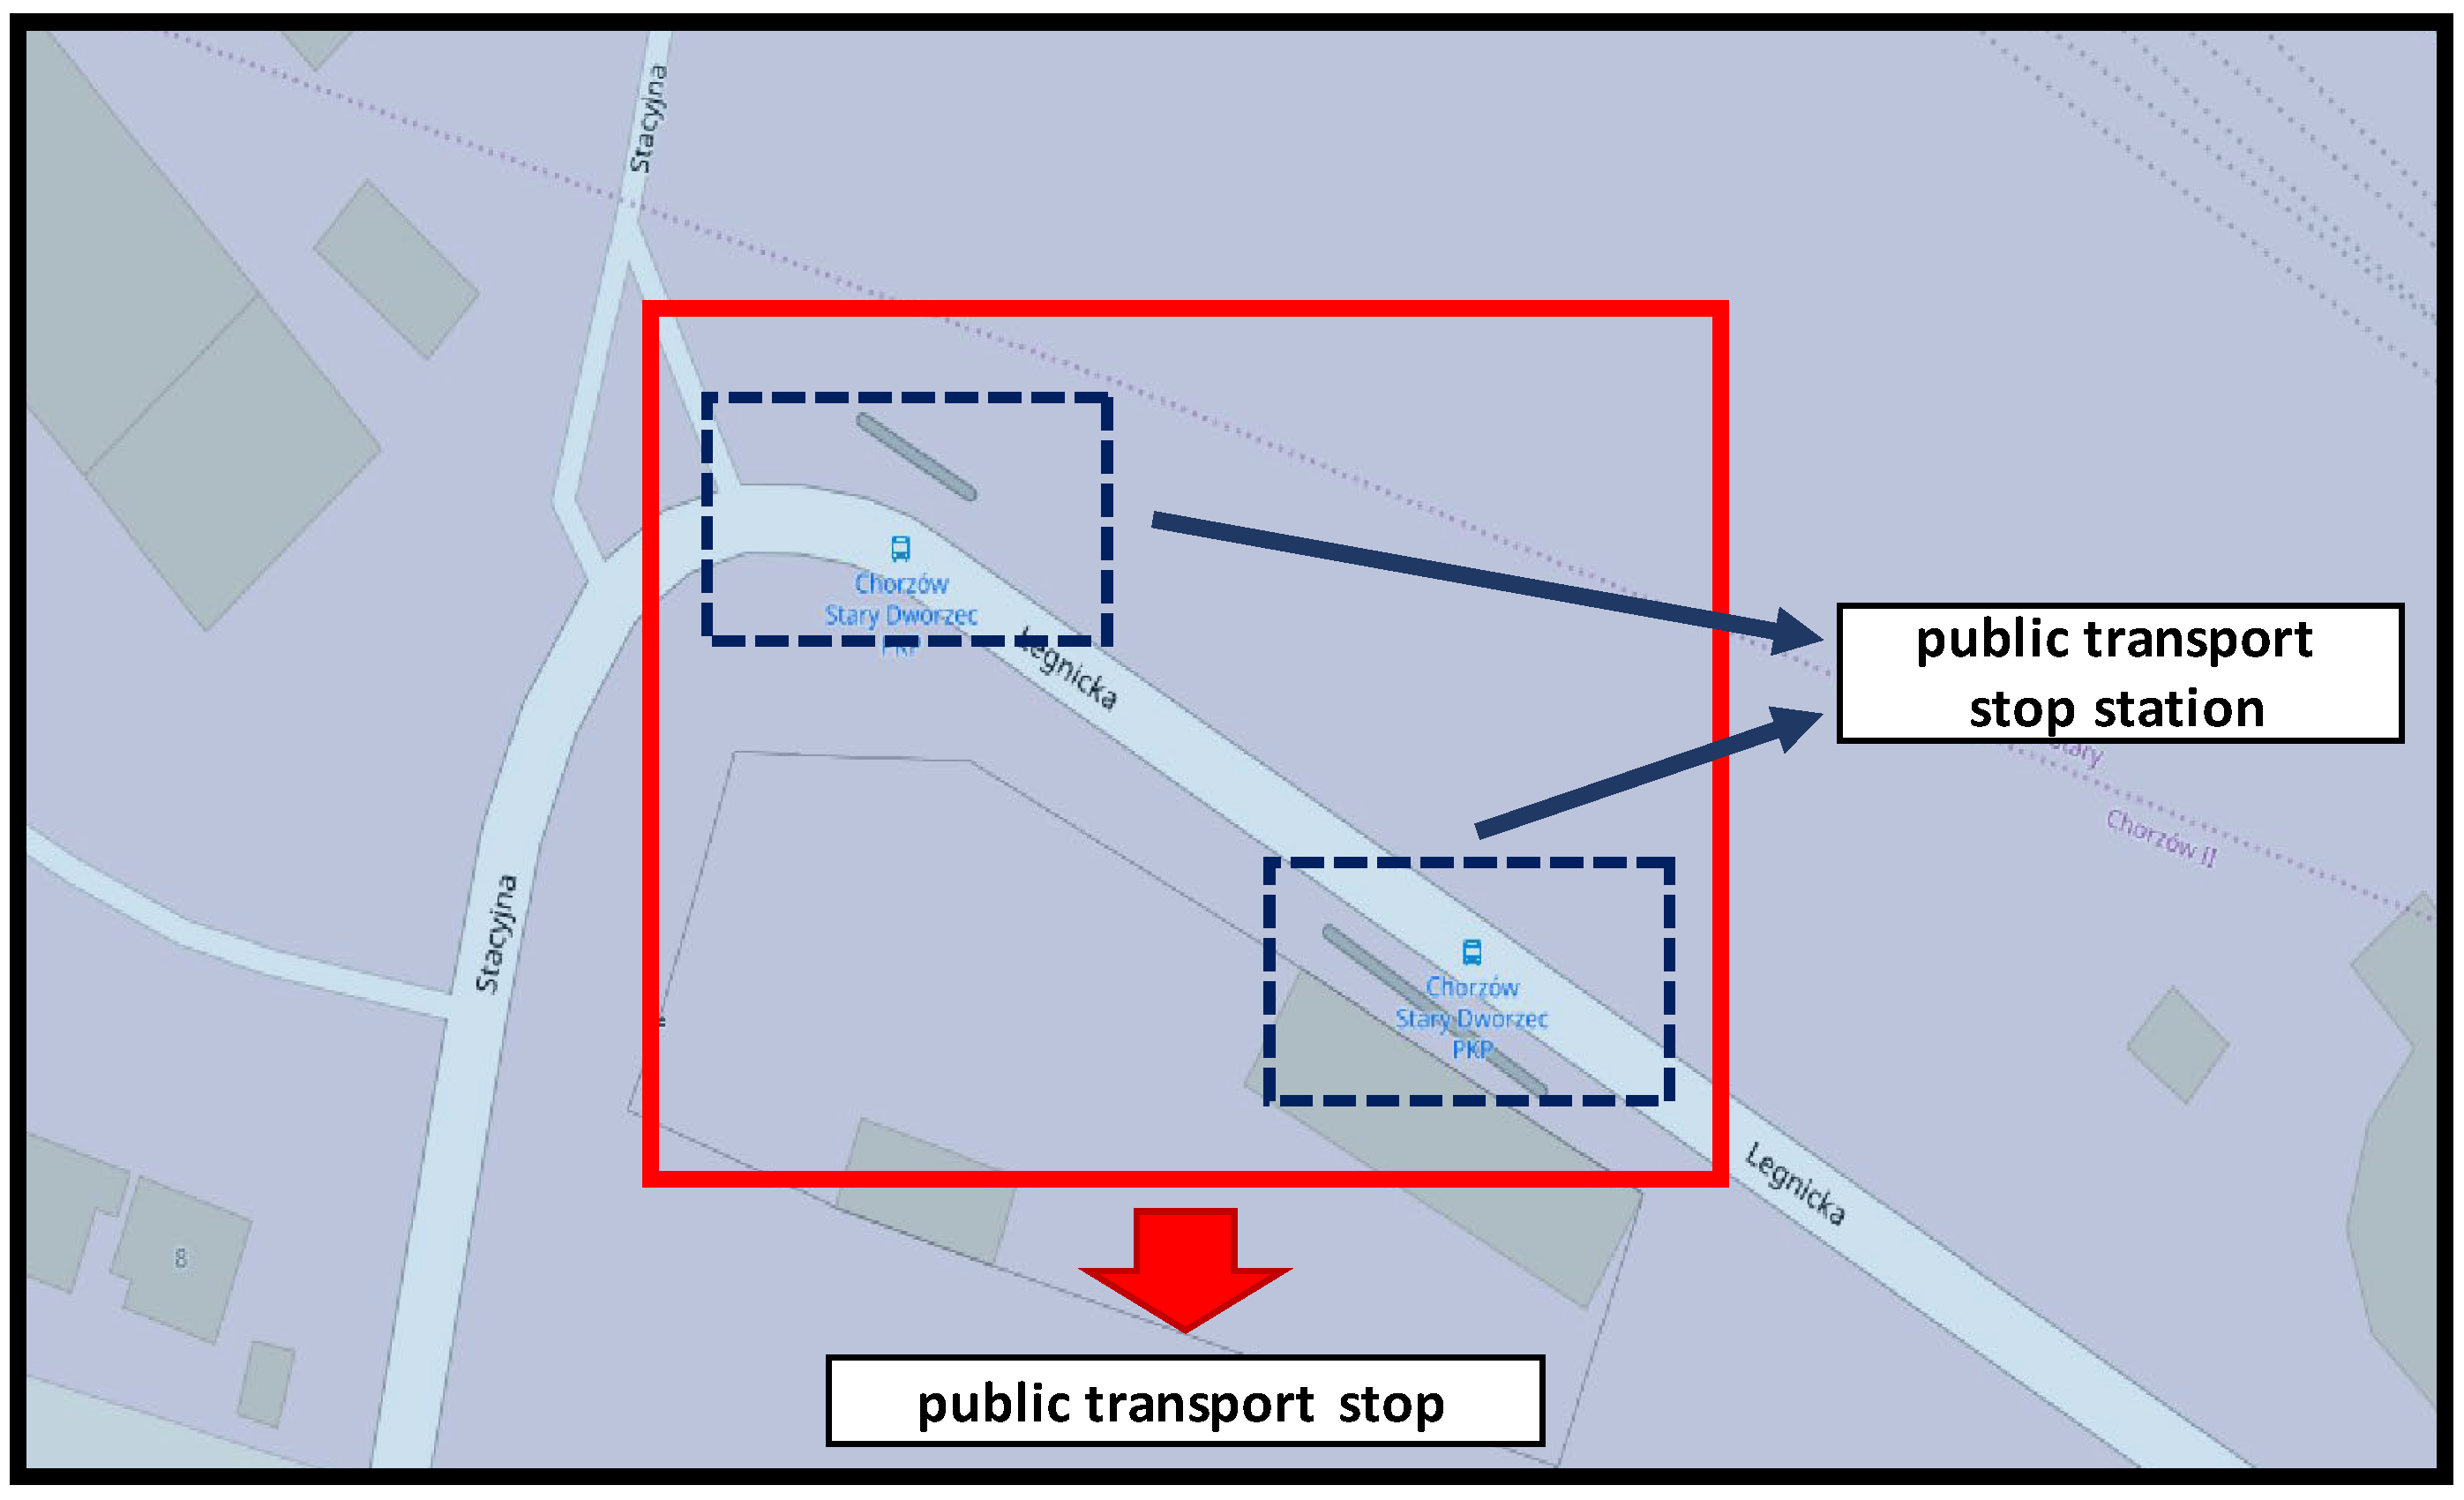
- density of stop stations,
- the average number of lines serving the stops,
- the average time interval between successive departures of public transport vehicles from the stop station at different times during the day,
- the range of direct impact of the basic field by public transport.
3.3. Comparative Analysis
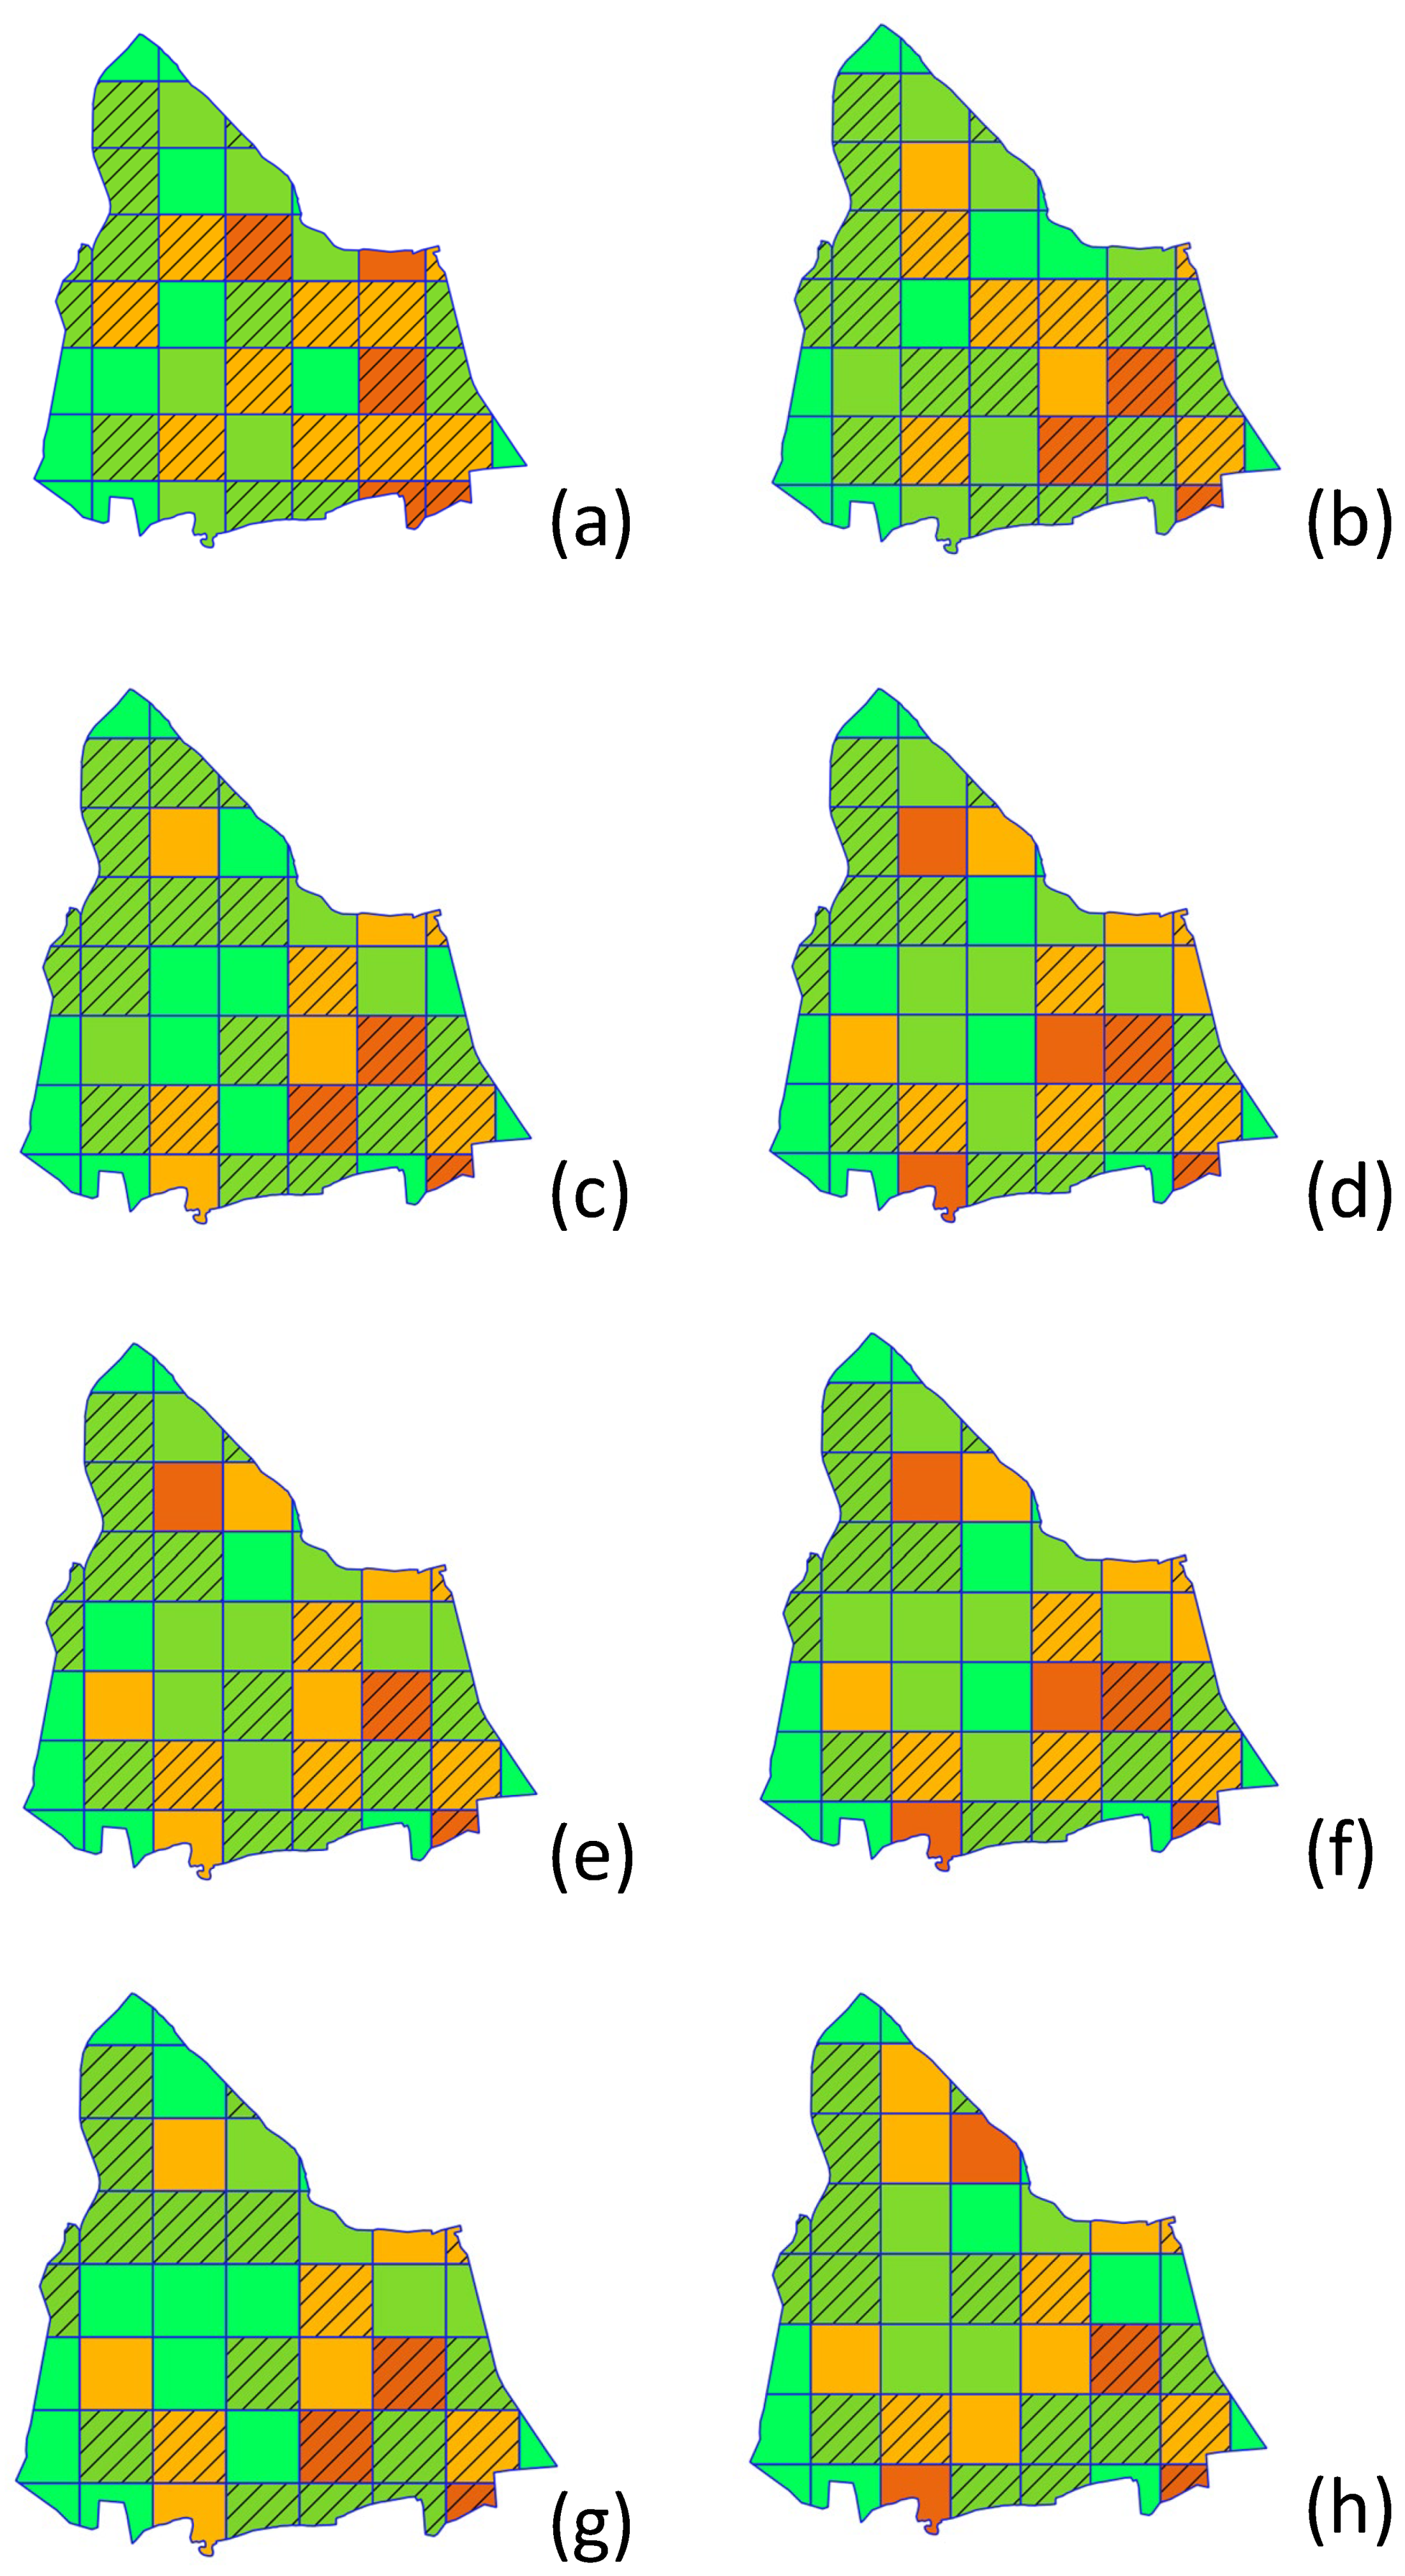
- the absolute difference between the levels of individual measures for assessing the accessibility of public transport and the level of potential transport demand, calculated according to the formulas:
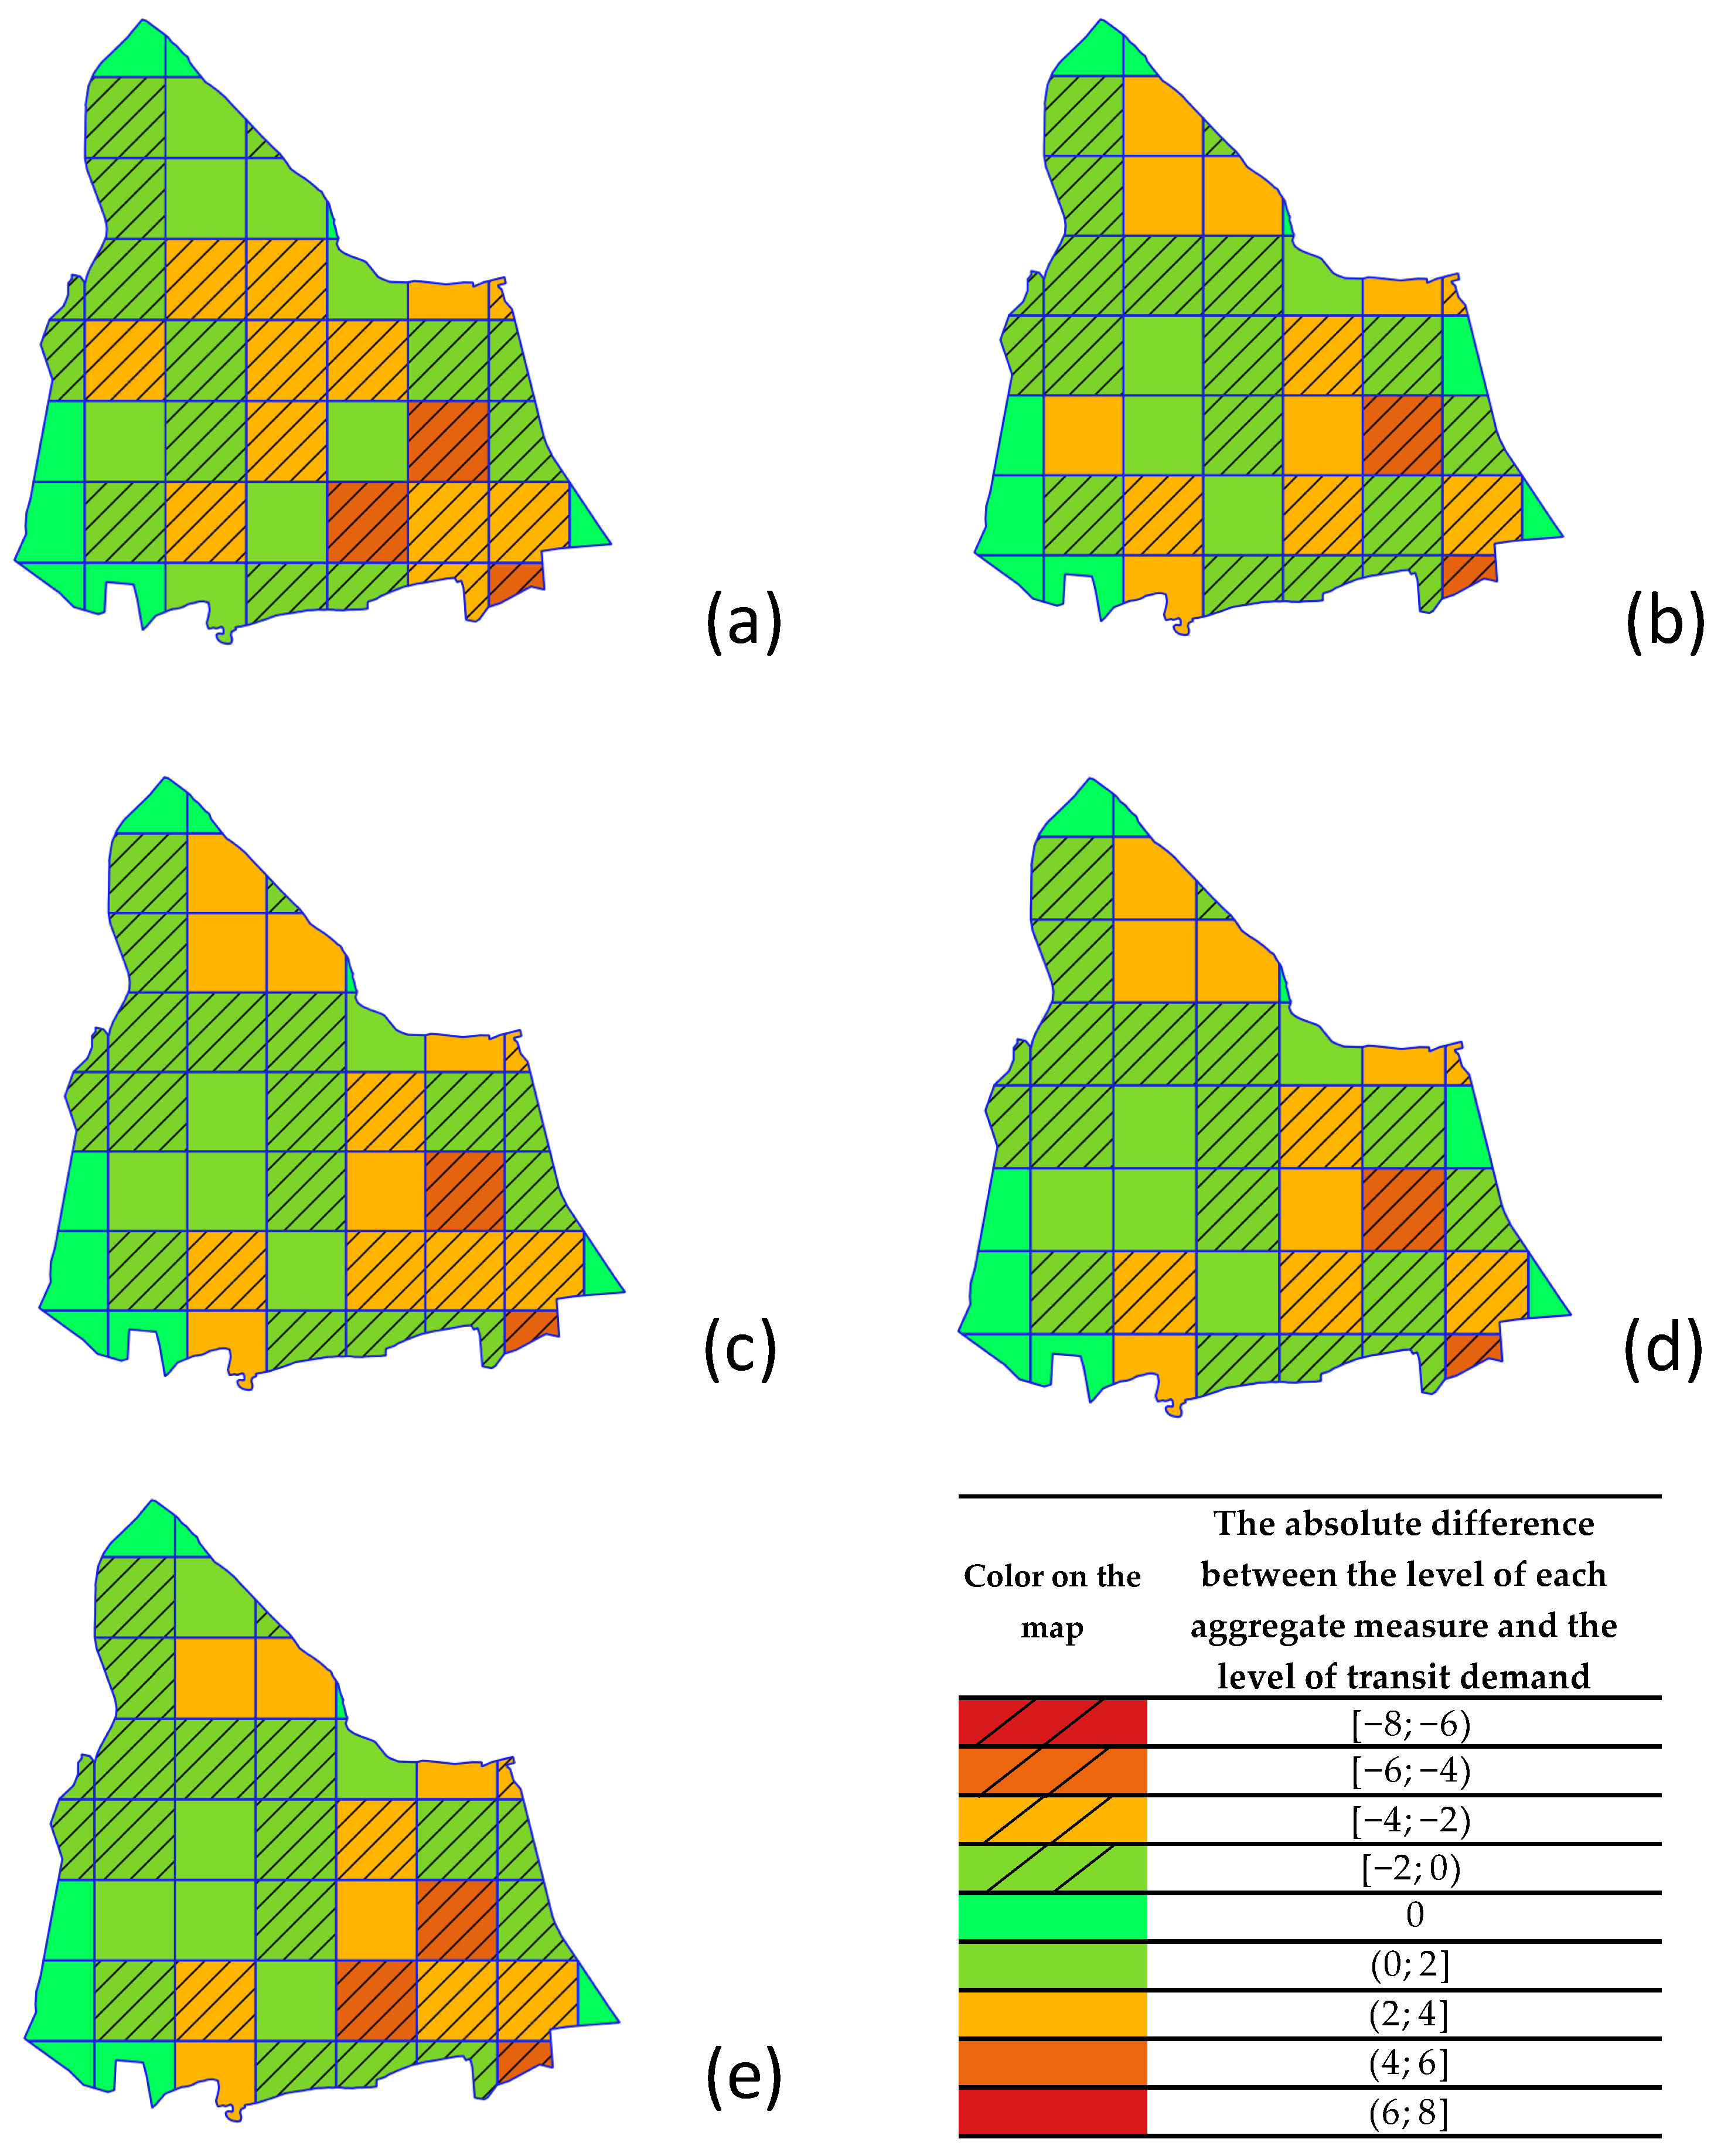
- the absolute difference between the level of aggregate measure for assessing the accessibility of public transport service and the level of potential transport demand, calculated according to the formula:where the level of the aggregate measure is calculated as weighted average of levels of individual measures for assessing the accessibility of public transport, i.e.,:with , , , and denoting weights for individual measures and meeting the following assumptions:
4. Case study
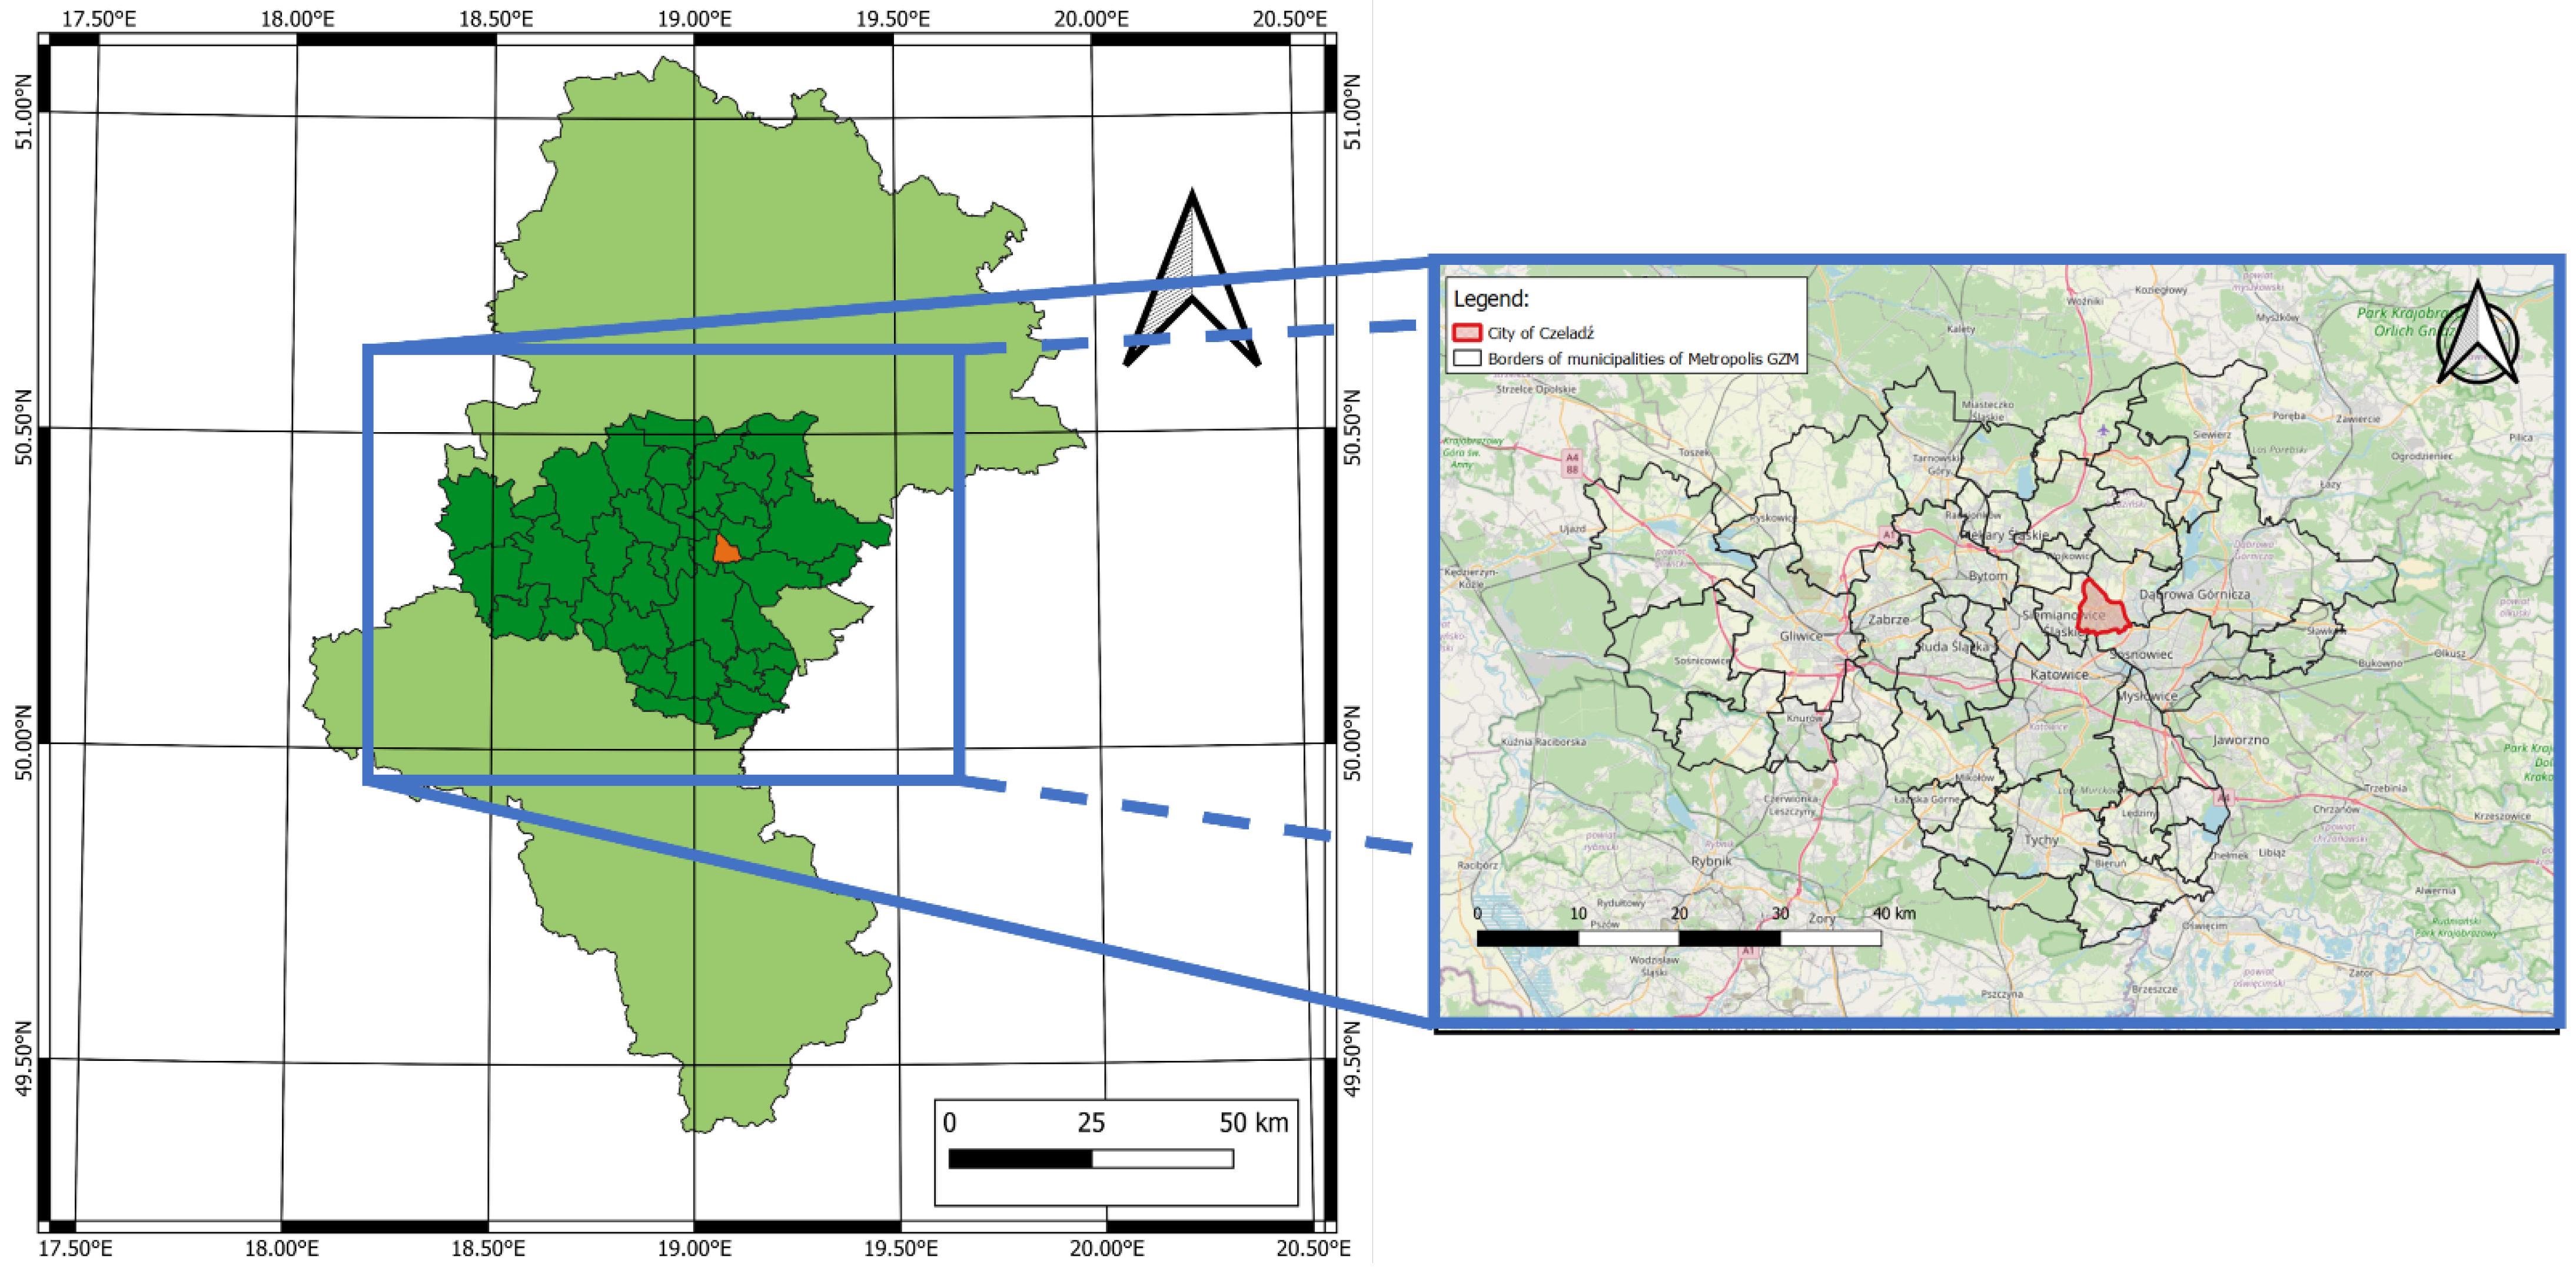
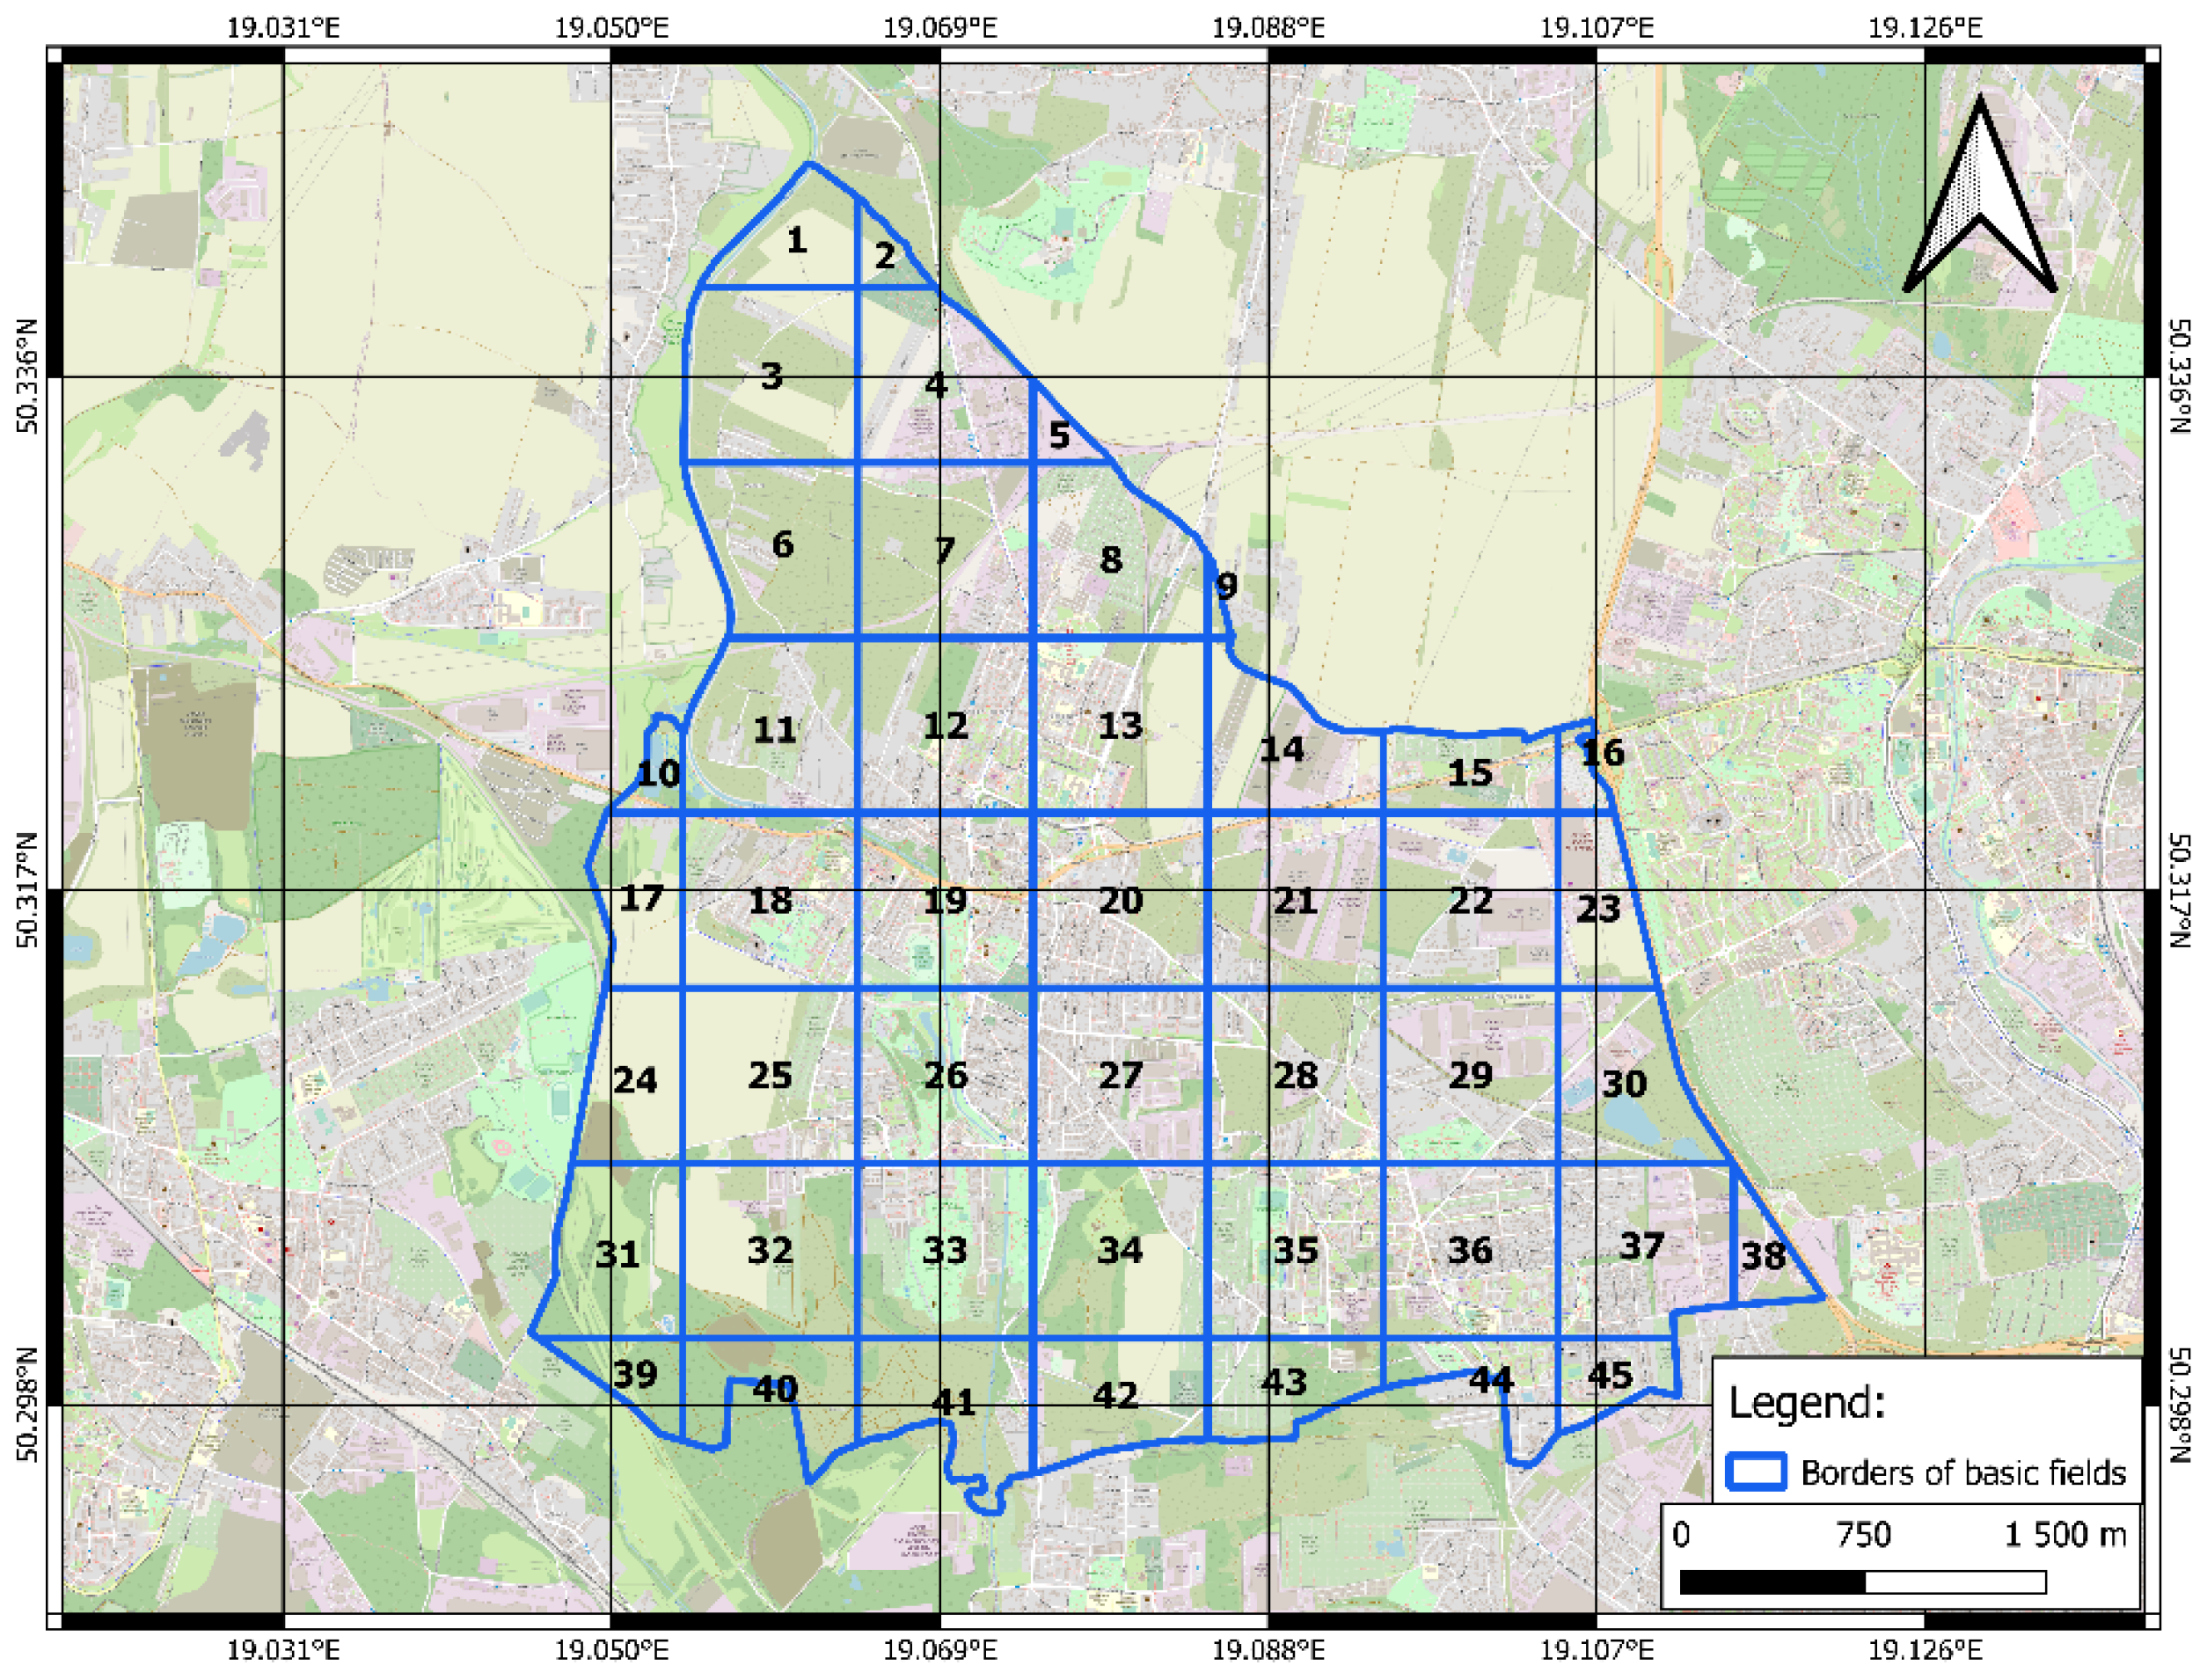
4.1. Research Area
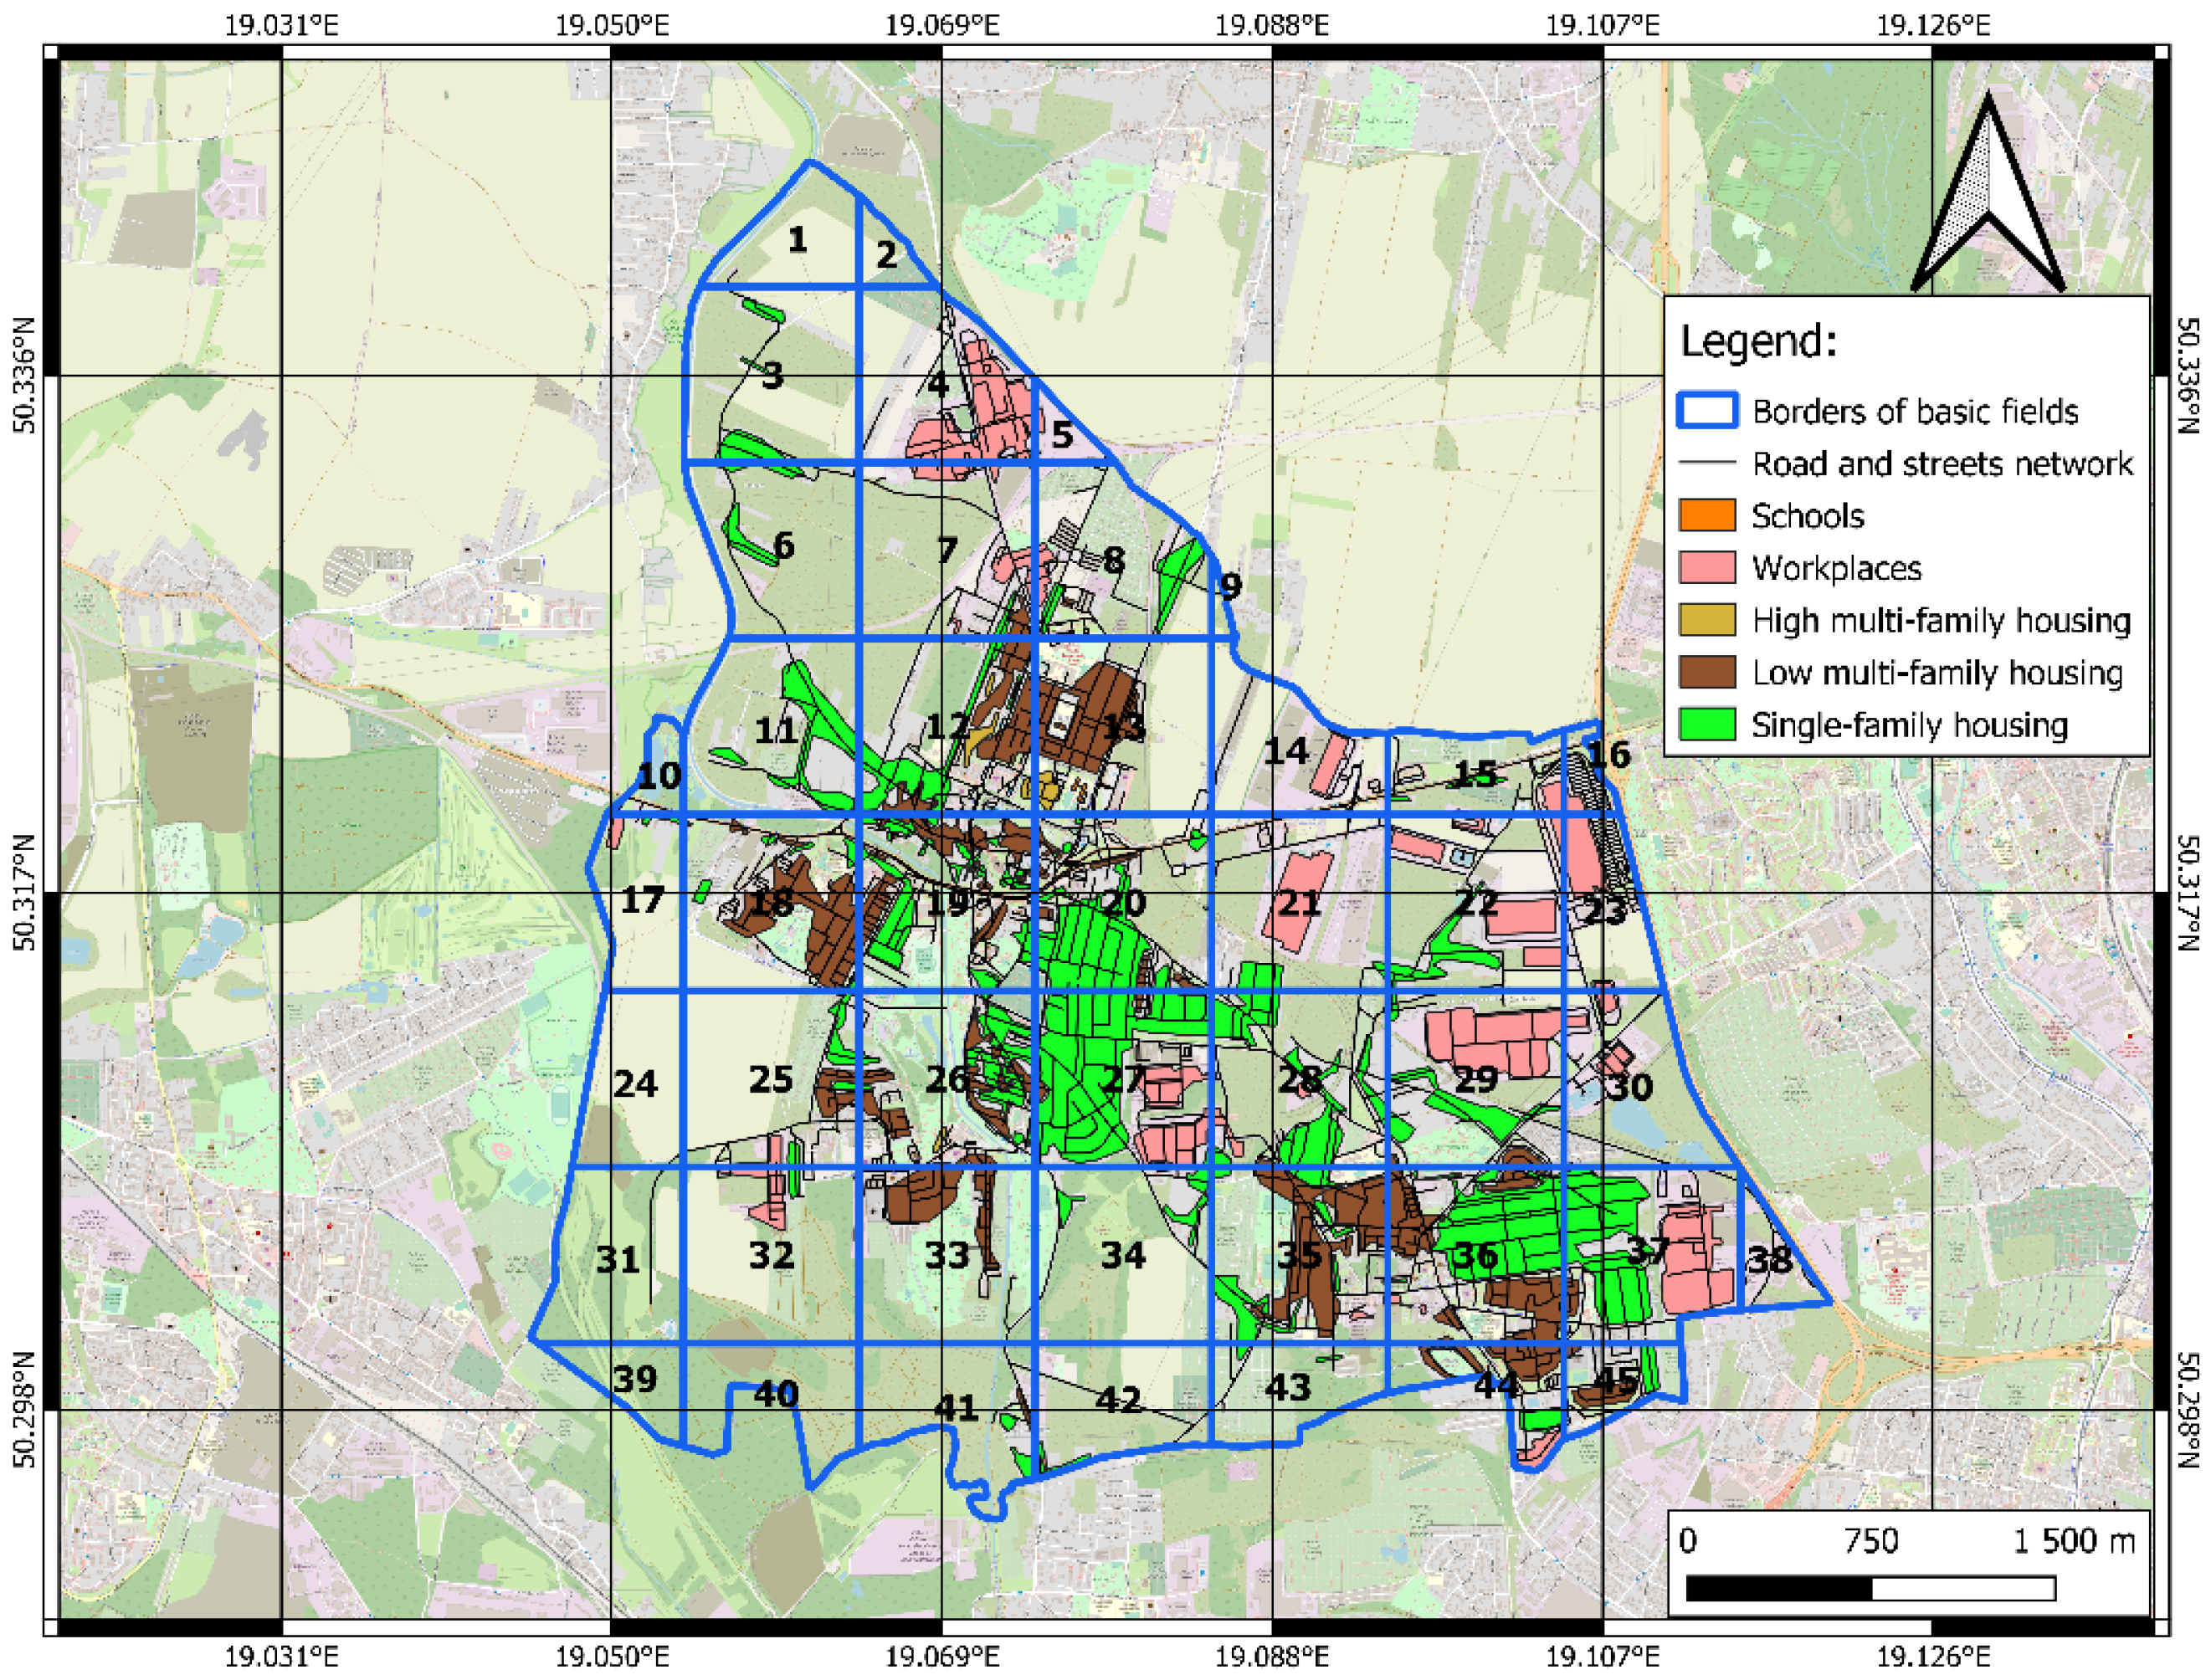
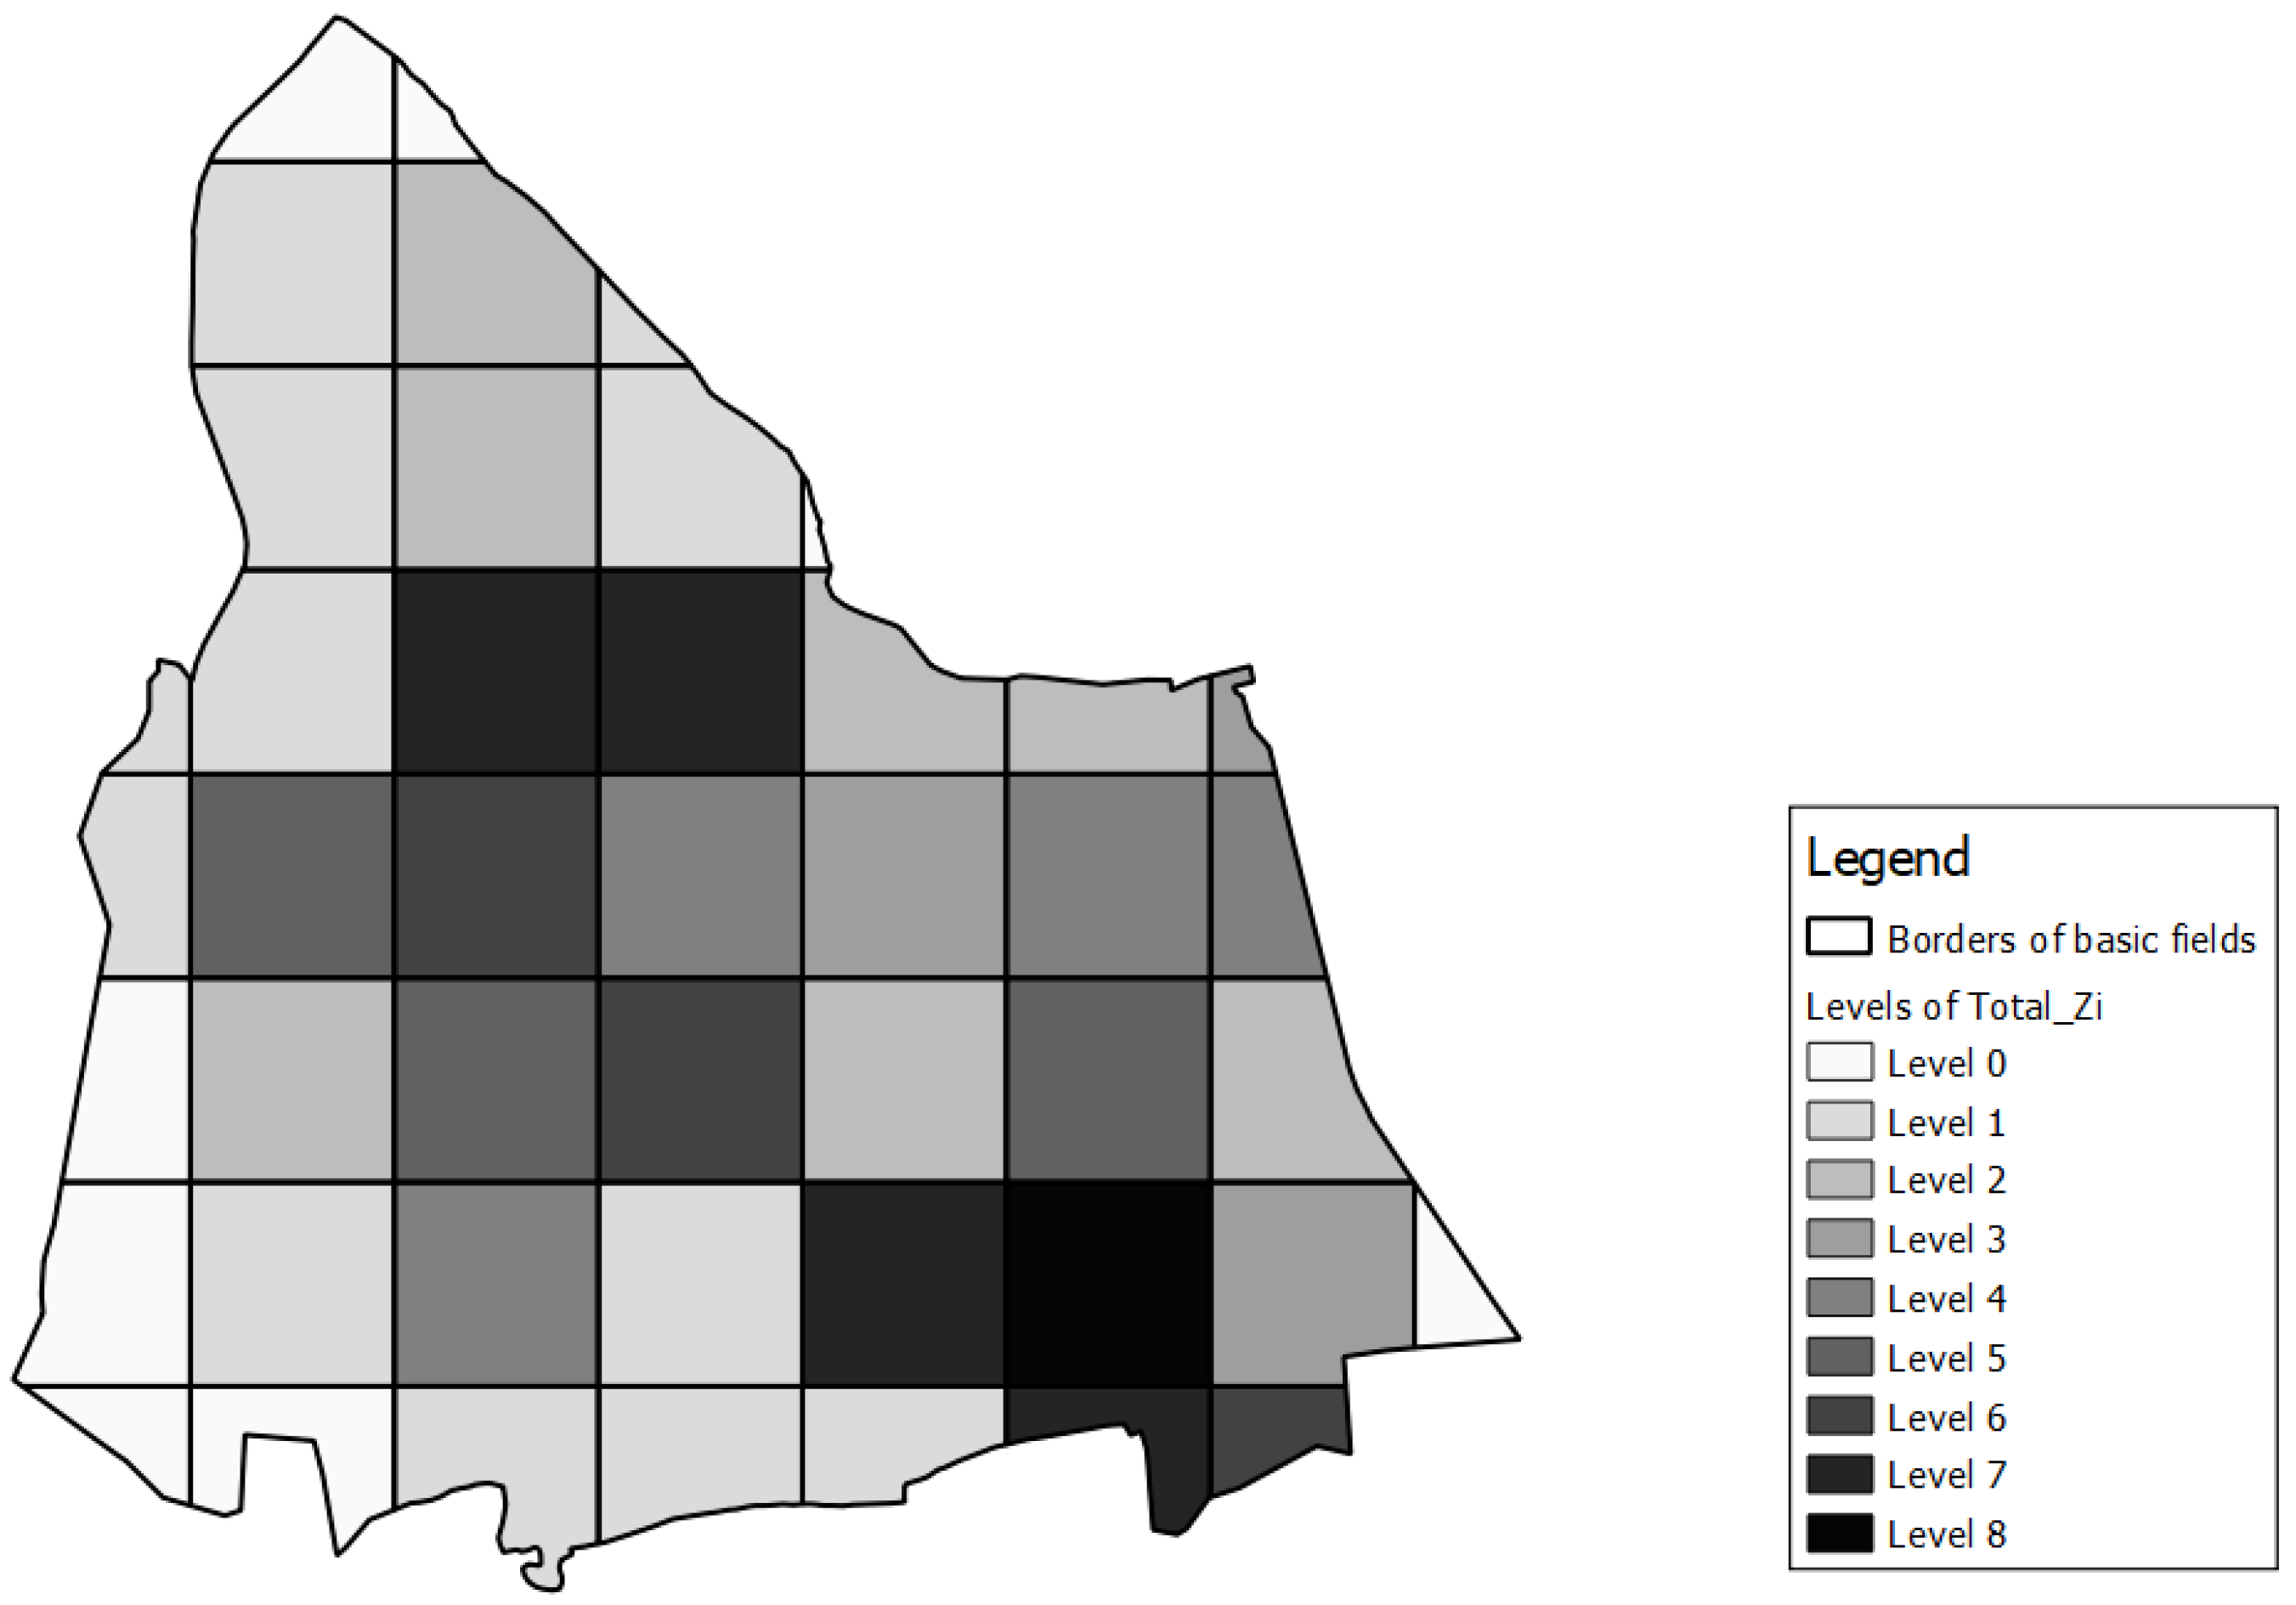
4.2. Results of the Assessment of the Potential Transport Demand
- for single-family housing—4 people per building (i.e., ),
- for multi-family buildings—1 person per 35 m2 (i.e., ),
- for workplaces—2 people per 100 m2.
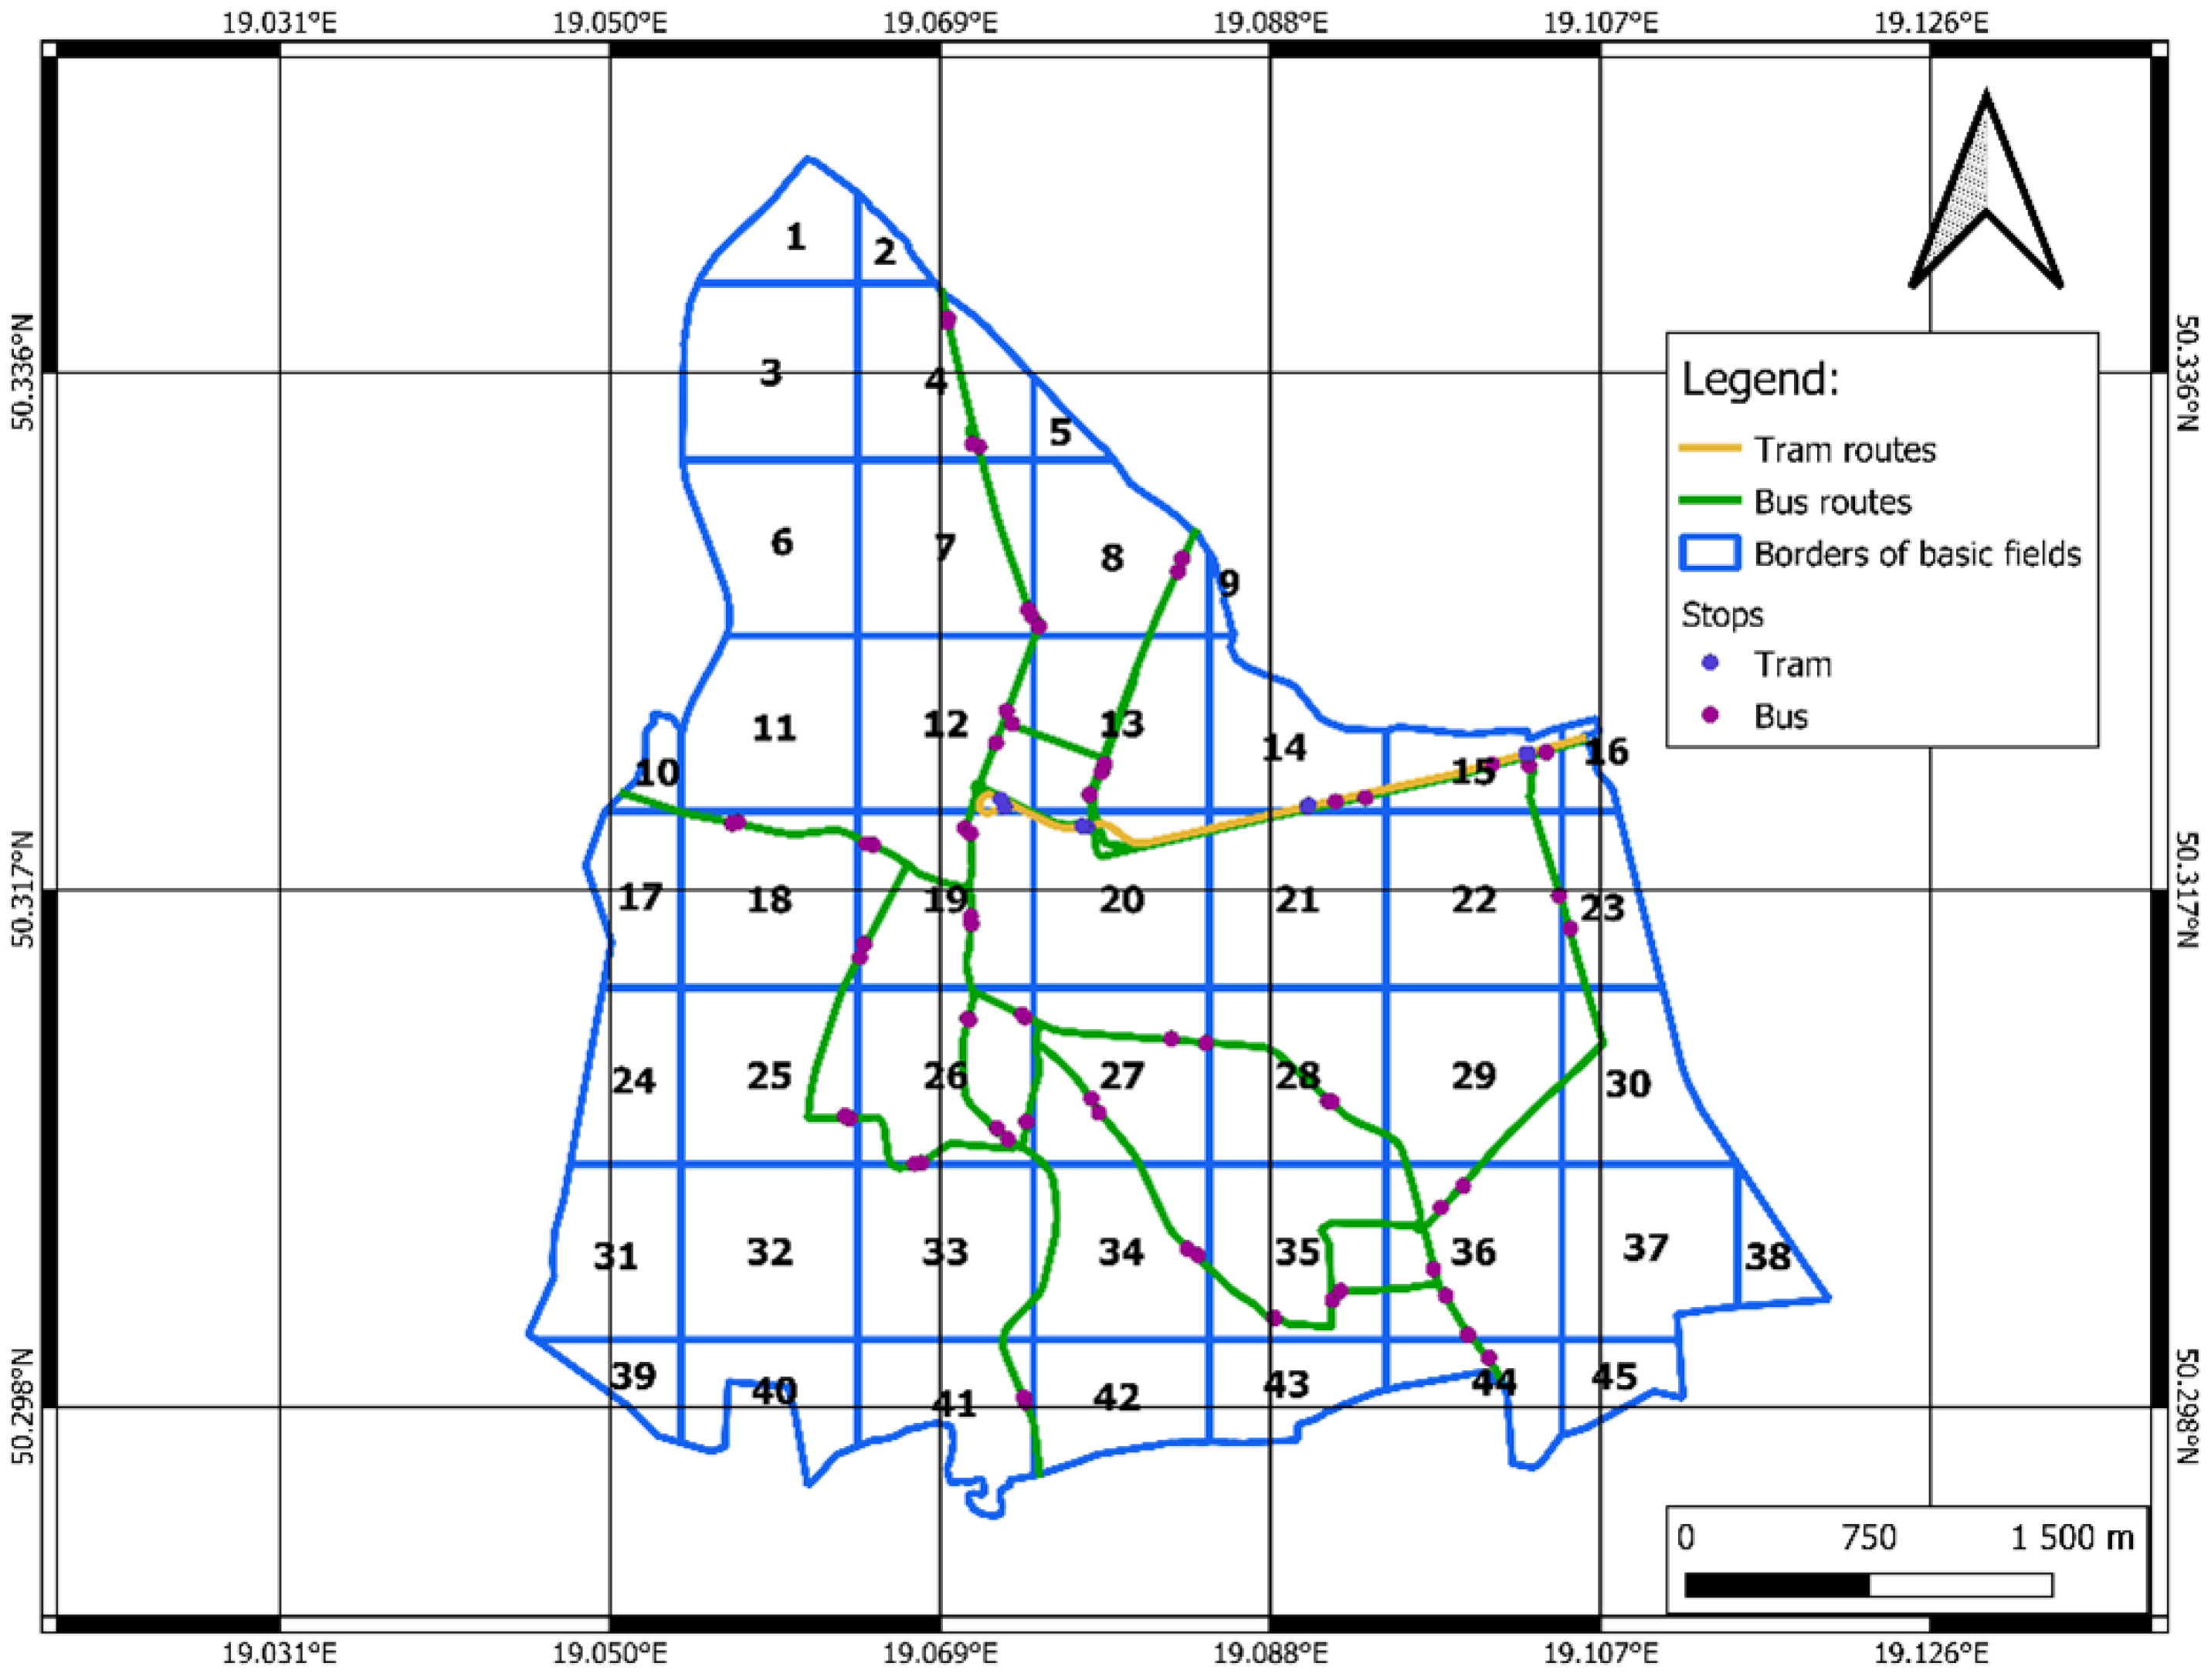
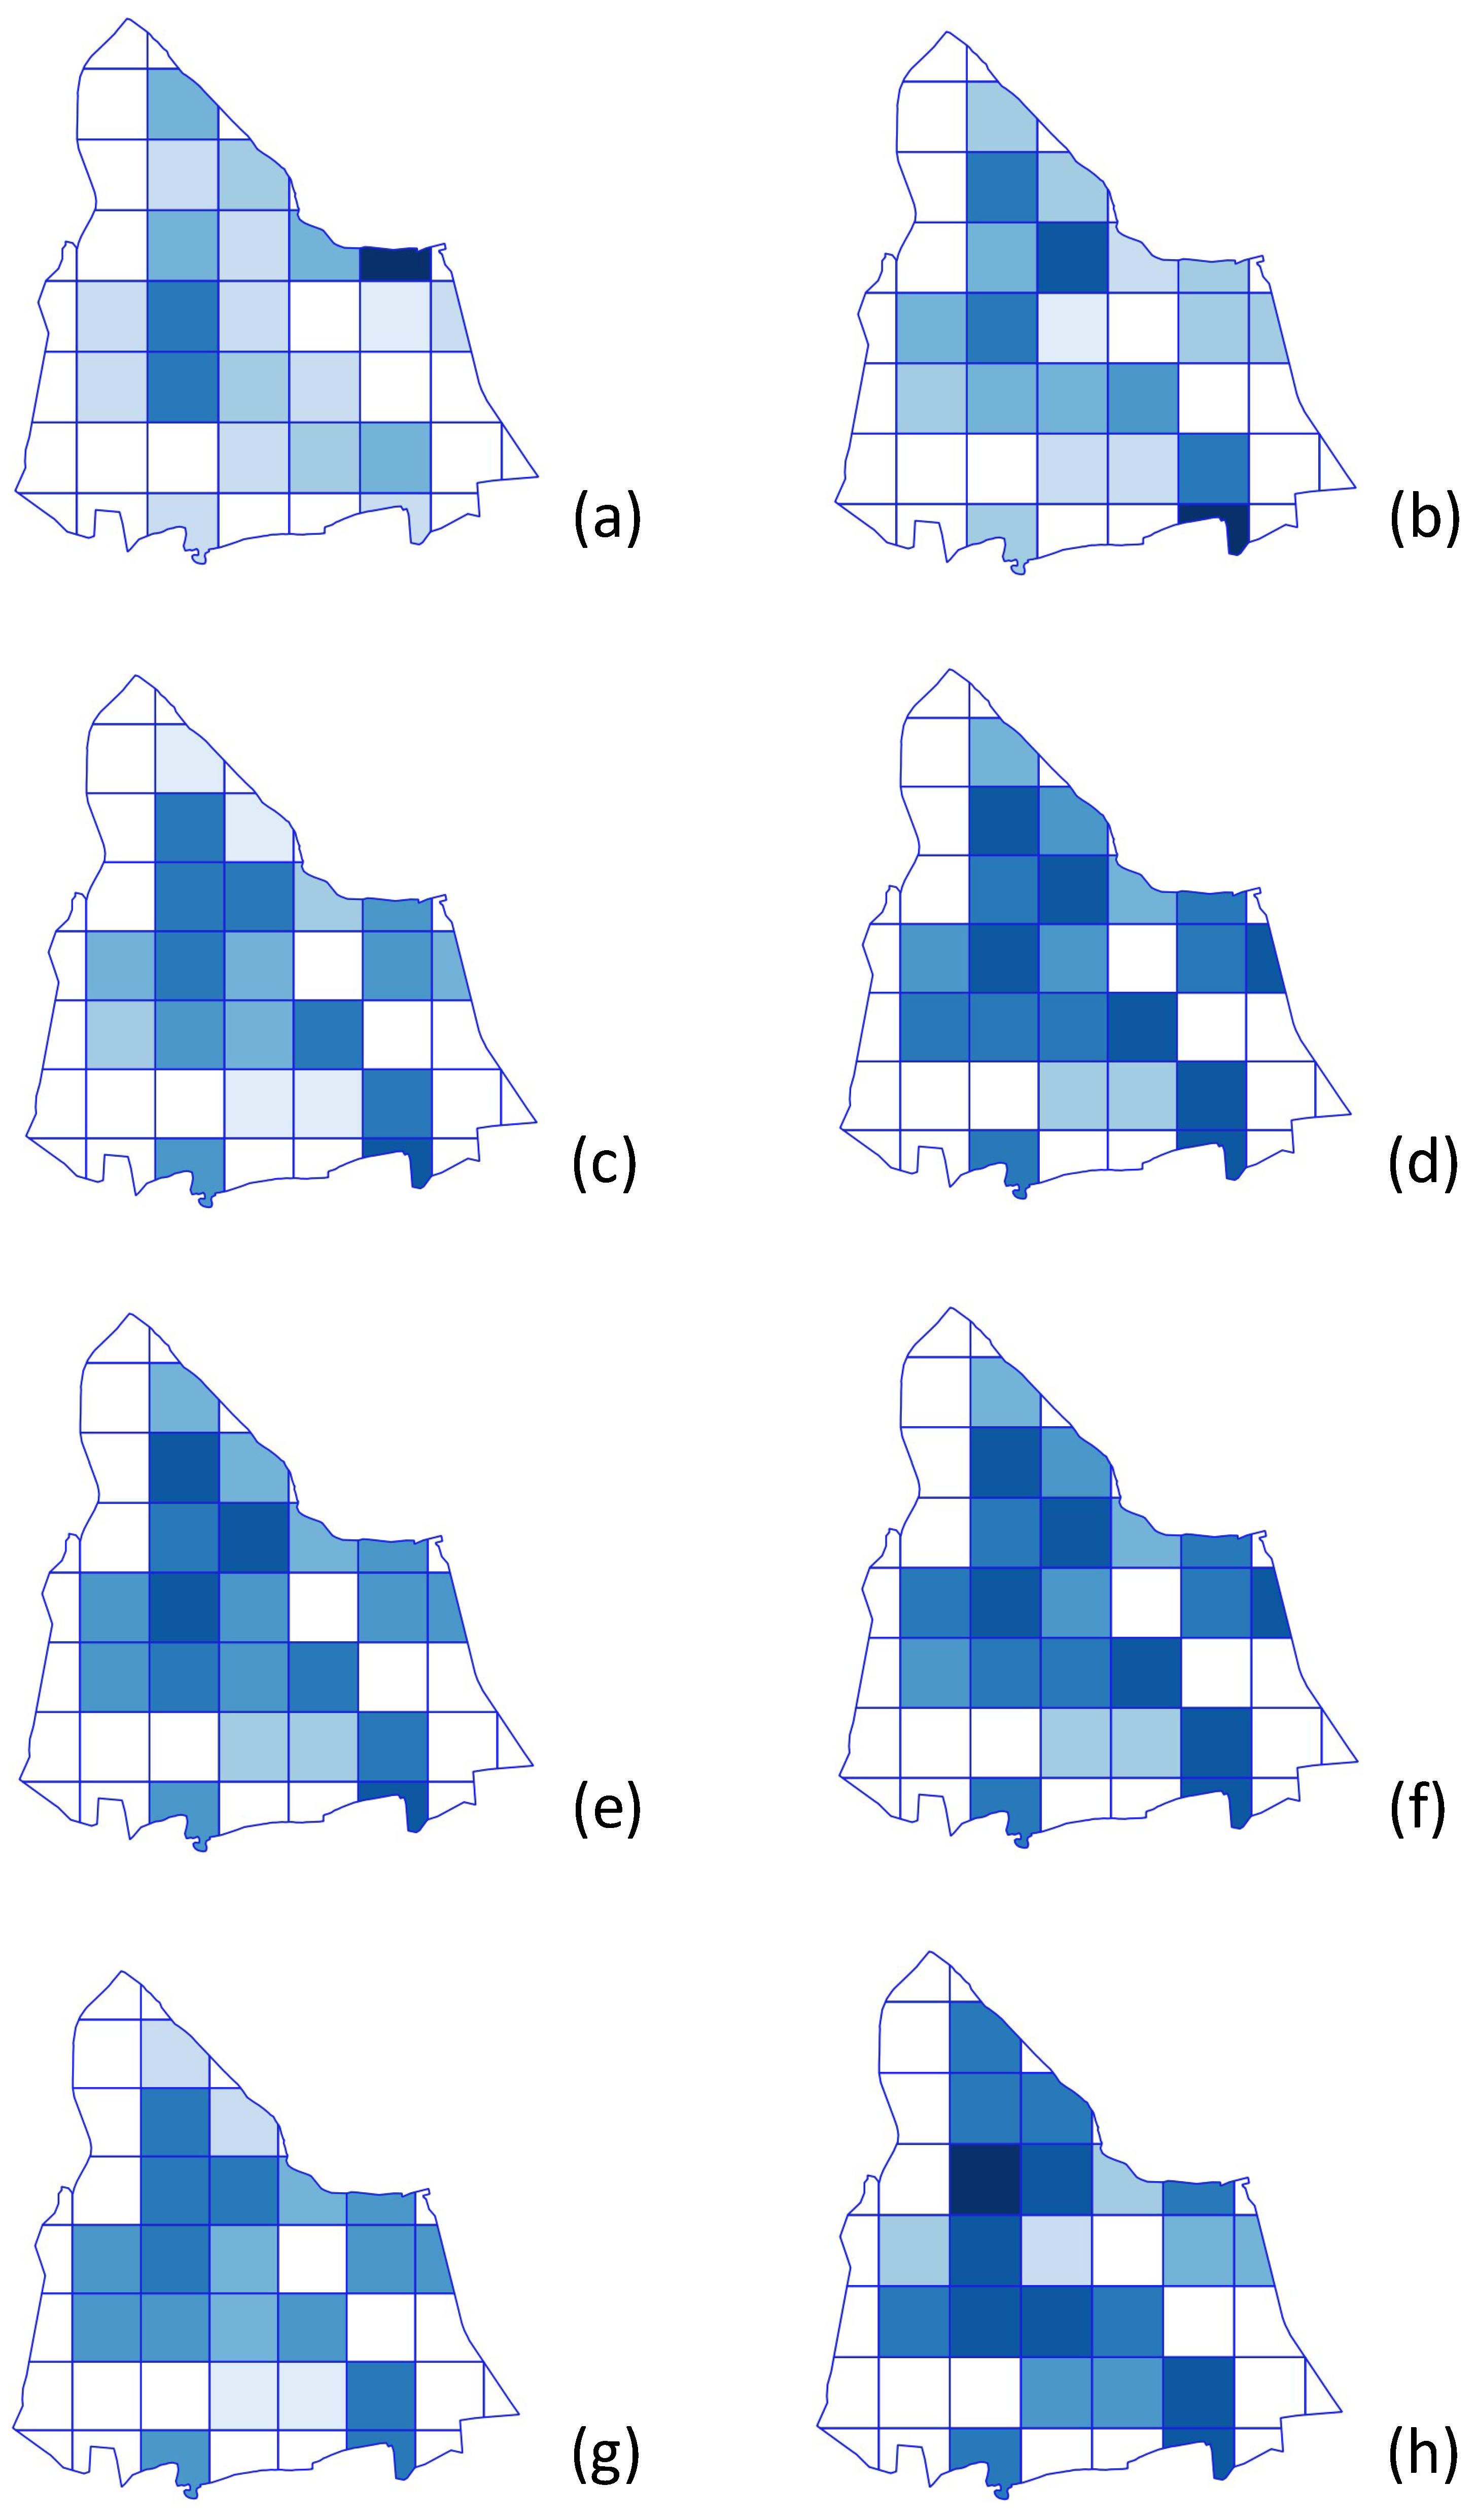
4.3. Results of the Assessment of Accessibility of Public Transport
4.4. Comparative Analysis
5. Discussion
6. Conclusions
- use of transport models built for a given area,
- using other factors to estimate accessibility by public transport,
- conducting questionnaire surveys to identify travel demand flows (OD matrix),
- carrying out careful analyses concerning the supply between individual traffic zones.
Author Contributions
Funding
Institutional Review Board Statement
Informed Consent Statement
Data Availability Statement
Conflicts of Interest
Appendix A
| Number of Line | Direction | Municipalities Serviced | Average Time Interval between Successive Departures (Minutes) | ||||
|---|---|---|---|---|---|---|---|
| 4 a.m. –6 a.m. | 6 a.m. –9 a.m. | 9 a.m. –2 p.m. | 2 p.m. –5 p.m. | 5 p.m. –11 p.m. | |||
| Tram lines | |||||||
| 22 | Tworzeń Huta Katowice—Czeladź Kombatantów | Będzin, Dąbrowa Górnicza | 16 | 20 | 20 | 20 | 23 |
| Czeladź Kombatantów—Tworzeń Huta Katowice | 25 | 20 | 20 | 20 | 22 | ||
| 42 | Czeladź Kombatantów Dąbrowa Górnicza Urząd Pracy Pętla | Będzin, Dąbrowa Górnicza | The line runs only on Saturdays | ||||
| Regular bus lines | |||||||
| 11 | Piotrowice Pętla—Czeladź Wojkowicka Pętla | Sosnowiec, Katowice | 23 | 30 | 30 | 30 | 50 |
| Czeladź Wojkowicka Pętla—Piotrowice Pętla | 26 | 30 | 30 | 30 | 48 | ||
| 27 | Katowice Plac Wolności—Tworzeń Huta Katowice | Katowice, Siemianowice Śląskie, Będzin, Dąbrowa Górnicza | 57 | 35 | 60 | 40 | 66 |
| Tworzeń Huta Katowice—Katowice Plac Wolności | 53 | 50 | 56 | 40 | 80 | ||
| 35 | Kosztowy Pętla—Czeladź Wojkowicka Pętla | Sosnowiec, Mysłowice | 61 | 60 | 60 | 60 | 63 |
| Czeladź Wojkowicka Pętla—Kosztowy Pętla | 60 | 60 | 60 | 61 | 60 | ||
| 42 | Będzin Kościuszki—Bytom Dworzec | Bytom, Piekary Śląskie, Siemianowice Śląskie, Będzin | 46 | 46 | 60 | 45 | 46 |
| Bytom Dworzec—Będzin Kościuszki | 50 | 46 | 60 | 50 | 43 | ||
| 43 | Katowice Plac Wolności—Wojkowice Fabryczna—Katowice Plac Wolności (circular line) | Katowice, Siemianowice Śląskie, Piekary Śląskie, Wojkowice, Będzin | 74 | 39 | 49 | 32 | 50 |
| 61 | Będzin Kościuszki—Katowice Dworzec | Katowice, Sosnowiec, Będzin | 36 | 30 | 45 | 43 | 59 |
| Katowice Dworzec—Będzin Kościuszki | 59 | 30 | 47 | 30 | 55 | ||
| 88 | Sosnowiec Urząd Miasta—Wojkowice Fabryczna | Sosnowiec, Będzin, Wojkowice | 36 | 47 | 50 | 45 | 95 |
| Wojkowice Fabryczna—Sosnowiec Urząd Miasta | 55 | 49 | 50 | 43 | 68 | ||
| 100 | Sosnowiec Urząd Miasta—Wojkowice Fabryczna | Sosnowiec, Będzin, Wojkowice | 63 | 60 | 60 | 67 | 76 |
| Wojkowice Fabryczna—Sosnowiec Urząd Miasta | 60 | 61 | 60 | 65 | 76 | ||
| 133 | Katowice Plac Wolności—Wojkowice Park—Katowice Plac Wolności (circular line) | Katowice, Siemianowice Śląskie, Piekary Śląskie, Wojkowice, Będzin | 64 | 61 | 50 | 49 | 109 |
| 235 | Sosnowiec Szpital Wojewódzki—Czeladź Szpital | Sosnowiec, Będzin | 70 | 90 | 80 | 80 | - |
| Czeladź Szpital—Sosnowiec Szpital Wojewódzki | Sosnowiec | 70 | 84 | 80 | 80 | - | |
| 723 | Zagórze Zajezdnia—Czeladź Wojkowicka Pętla | Sosnowiec | 33 | 31 | 33 | 33 | 54 |
| Czeladź Wojkowicka Pętla—Zagórze Zajezdnia | 50 | 30 | 33 | 36 | 47 | ||
| 911 | Katowice Dworzec—Czeladź Wojkowicka Pętla | Sosnowiec, Katowice | 60 | 125 | 60 | 82 | 53 |
| Czeladź Wojkowicka Pętla—Katowice Dworzec | 60 | 164 | 63 | 47 | |||
| 935 | Ćmok Pętla—Czeladź Wojkowicka Pętla | Sosnowiec, Mysłowice | 66 | 60 | 60 | 60 | 60 |
| Czeladź Wojkowicka Pętla—Ćmok Pętla | 55 | 60 | 60 | 63 | 60 | ||
| Frequent service bus lines | |||||||
| 800 | Będzin Kościuszki—Katowice Piotra Skargi | Katowice, Sosnowiec, Będzin | 33 | 33 | 52 | 33 | 98 |
| Katowice Piotra Skargi—Będzin Kościuszki | 45 | 30 | 57 | 32 | 85 | ||
| 814 | Tworzeń Huta Katowice—Katowice Piotra Skargi | Katowice, Sosnowiec, Będzin, Dąbrowa Górnicza | 30 | 35 | 54 | 30 | 47 |
| Katowice Piotra Skargi—Tworzeń Huta Katowice | 26 | 28 | 42 | 30 | 53 | ||
| Night bus lines | |||||||
| 902N | Zagórze Zajezdnia—Czeladź—Będzin—Dąbrowa Górnicza—Zagórze Zajezdnia | Sosnowiec, Będzin, Dąbrowa Górnicza | The lines run only during the night hours | ||||
| 904N | Zagórze Zajezdnia—Będzin Kościuszki | Sosnowiec, Będzin | |||||
| 911N | Katowice Dworzec—Czeladź Wojkowicka Pętla (-Wojkowice Fabryczna) | Katowice, Sosnowiec (Wojkowice) | |||||
References
- Połom, M.; Wiśniewski, P. Assessment of the Emission of Pollutants from Public Transport Based on the Example of Diesel Buses and Trolleybuses in Gdynia and Sopot. Int. J. Environ. Res. Public Health 2021, 18, 8379. [Google Scholar] [CrossRef] [PubMed]
- Zhang, Y.; Deng, J.; Zhu, K.; Tao, Y.; Liu, X.; Cui, L. Location and Expansion of Electric Bus Charging Stations Based on Gridded Affinity Propagation Clustering and a Sequential Expansion Rule. Sustainability 2021, 13, 8957. [Google Scholar] [CrossRef]
- Chamier Gliszczyński, N. Sustainable Operation of a Transport System in Cities. Key Eng. Mater. 2011, 486, 175–178. [Google Scholar] [CrossRef]
- Pot, F.J.; van Wee, B.; Tillema, T. Perceived Accessibility: What It Is and Why It Differs from Calculated Accessibility Measures Based on Spatial Data. J. Transp. Geogr. 2021, 94, 103090. [Google Scholar] [CrossRef]
- Kłos, M.J. Estimation of Effects Caused by the Implementation of Park&ride System in the Transport Hub. Transp. Probl. 2016, 11, 5–12. [Google Scholar] [CrossRef]
- Kruszyna, M. Investment Challenges Pertaining to the Achievement of the Goals of the Mobility Policy Based on the Analysis of the Results of Traffic Surveys in Wroclaw. Arch. Civ. Eng. 2021, 67, 505–523. [Google Scholar]
- Jacyna, M.; Wasiak, M.; Lewczuk, K.; Karoń, G. Noise and Environmental Pollution from Transport: Decisive Problems in Developing Ecologically Efficient Transport Systems. J. Vibroeng. 2017, 19, 5639–5655. [Google Scholar] [CrossRef]
- Bok, J.; Kwon, Y. Comparable Measures of Accessibility to Public Transport Using the General Transit Feed Specification. Sustainability 2016, 8, 224. [Google Scholar] [CrossRef]
- Karoń, G.; Żochowska, R. Problems of Quality of Public Transportation Systems in Smart Cities—Smoothness and Disruptions in Urban Traffic. In Modelling of the Interaction of the Different Vehicles and Various Transport Modes; Springer: Cham, Switzerland, 2020; pp. 383–414. [Google Scholar]
- Girma, M.; Woldetensae, B. Evaluating users’ satisfaction in public transit service: A case of addis ababa city, ethiopia. Sci. J. Sil. Univ. Technol. Ser. Transp. 2022, 114, 15–30. [Google Scholar] [CrossRef]
- Zehmed, K.; Jawab, F. The Performance of Tramway Service from the Users’ Viewpoint: A Comparative Analysis between Two Moroccan Cities. Arch. Transp. 2021, 60, 7–21. [Google Scholar] [CrossRef]
- Bauer, M.; Bauer, K. Analysis of the Impact of the COVID-19 Pandemic on the Future of Public Transport: Example of Warsaw. Sustainability 2022, 14, 7268. [Google Scholar] [CrossRef]
- Bauer, M.; Dźwigoń, W.; Richter, M. Personal Safety of Passengers during the First Phase COVID-19 Pandemic in the Opinion of Public Transport Drivers in Krakow. Arch. Transp. 2021, 59, 41–55. [Google Scholar] [CrossRef]
- Gramsch, B.; Guevara, C.A.; Munizaga, M.; Schwartz, D.; Tirachini, A. The Effect of Dynamic Lockdowns on Public Transport Demand in Times of COVID-19: Evidence from Smartcard Data. Transp. Policy 2022, 126, 136–150. [Google Scholar] [CrossRef]
- Szczepanek, W.K.; Kruszyna, M. The Impact of COVID-19 on the Choice of Transport Means in Journeys to Work Based on the Selected Example from Poland. Sustainability 2022, 14, 7619. [Google Scholar] [CrossRef]
- Xiaoliang, Z.; Limin, J. Analysis of Bus Line Operation Reliability Based on Copula Function. Sustainability 2021, 13, 8419. [Google Scholar] [CrossRef]
- Hu, X.; Chen, X.; Zhao, J.; Yu, K.; Long, B.; Dai, G. Comprehensive Service Quality Evaluation of Public Transit Based on Extension Cloud Model. Arch. Transp. 2022, 61, 103–115. [Google Scholar] [CrossRef]
- Wang, Y.; Wang, M.; Li, K.; Zhao, J. Analysis of the Relationships between Tourism Efficiency and Transport Accessibility—A Case Study in Hubei Province, China. Sustainability 2021, 13, 8649. [Google Scholar] [CrossRef]
- Żochowska, R.; Jacyna, M.; Kłos, M.J.; Soczówka, P. A GIS-Based Method of the Assessment of Spatial Integration of Bike-Sharing Stations. Sustainability 2021, 13, 3894. [Google Scholar] [CrossRef]
- Krawiec, K.; Kłos, M.J. Parameters of Bus Lines Influencing the Allocation of Electric Buses to the Transport Tasks. In Scientific and Technical Conference Transport Systems Theory and Practice; Springer: Cham, Switzerland, 2018; pp. 129–138. [Google Scholar]
- Jakimavičius, M.; Palevičius, V.; Antuchevičiene, J.; Karpavičius, T. Internet GIS-Based Multimodal Public Transport Trip Planning Information System for Travelers in Lithuania. ISPRS Int. J. Geo-Inf. 2019, 8, 319. [Google Scholar] [CrossRef]
- Corazza, M.V.; Favaretto, N. A Methodology to Evaluate Accessibility to Bus Stops as a Contribution to Improve Sustainability in Urban Mobility. Sustainability 2019, 11, 803. [Google Scholar] [CrossRef]
- Kaczmarczyk, M.; Sowizdzał, A.; Tomaszewska, B. Energetic and Environmental Aspects of Individual Heat Generation for Sustainable Development at a Local Scale—A Case Study from Poland. Energies 2020, 13, 454. [Google Scholar] [CrossRef]
- Fiorio, C.V.; Florio, M.; Perucca, G. User Satisfaction and the Organization of Local Public Transport: Evidence from European Cities. Transp. Policy 2013, 29, 209–218. [Google Scholar] [CrossRef]
- Wong, S. The Limitations of Using Activity Space Measurements for Representing the Mobilities of Individuals with Visual Impairment: A Mixed Methods Case Study in the San Francisco Bay Area. J. Transp. Geogr. 2018, 66, 300–308. [Google Scholar] [CrossRef]
- Żochowska, R.; Kłos, M.J.; Soczówka, P. Analysis of Traffic Safety at Intersections of Roadways and Tram Tracks. Roads Bridges Drog. Mosty 2021, 20, 41–56. [Google Scholar] [CrossRef]
- Pajares, E.; Büttner, B.; Jehle, U.; Nichols, A.; Wulfhorst, G. Accessibility by Proximity: Addressing the Lack of Interactive Accessibility Instruments for Active Mobility. J. Transp. Geogr. 2021, 93, 103080. [Google Scholar] [CrossRef]
- Liu, M.; Luo, S. Exploring Equity in Healthcare Services: Spatial Accessibility Changes during Subway Expansion. ISPRS Int. J. Geo-Inf. 2021, 10, 439. [Google Scholar] [CrossRef]
- Wang, Z.; Chen, F.; Xu, T. Interchange between Metro and Other Modes: Access Distance and Catchment Area. J. Urban Plan. Dev. 2016, 142, 04016012. [Google Scholar] [CrossRef]
- Eboli, L.; Mazzulla, G. Performance Indicators for an Objective Measure of Public Transport Service Quality. Eur. Transp. 2012, 51, 1–21. [Google Scholar]
- Tiznado-Aitken, I.; Lucas, K.; Muñoz, J.C.; Hurtubia, R. Understanding Accessibility through Public Transport Users’ Experiences: A Mixed Methods Approach. J. Transp. Geogr. 2020, 88, 102857. [Google Scholar] [CrossRef]
- Postorino, M.N.; Fedele, V. The Analytic Hierarchy Process to Evaluate the Quality of Service in Transit Systems. In Urban Transport XII: Urban Transport and the Environment in the 21st Century; WIT Press: Southampton, UK, 2006; Volume 1, pp. 775–784. [Google Scholar]
- Ravensbergen, L.; van Liefferinge, M.; Isabella, J.; Merrina, Z.; El-Geneidy, A. Accessibility by Public Transport for Older Adults: A Systematic Review. J. Transp. Geogr. 2022, 103, 103408. [Google Scholar] [CrossRef]
- Kaszczyszyn, P.; Sypion-Dutkowska, N. Walking Access to Public Transportation Stops for City Residents. A Comparison of Methods. Sustainability 2019, 11, 3758. [Google Scholar] [CrossRef]
- Barchański, A.; Żochowska, R.; Kłos, M.J. A Method for the Identification of Critical Interstop Sections in Terms of Introducing Electric Buses in Public Transport. Energies 2022, 15, 7543. [Google Scholar] [CrossRef]
- Olsson, L.E.; Friman, M. Accessibility Barriers and Perceived Accessibility: Implications for Public Transport. Urban Sci. 2021, 5, 63. [Google Scholar] [CrossRef]
- Chen, J.; Ni, J.; Xi, C.; Li, S.; Wang, J. Determining Intra-Urban Spatial Accessibility Disparities in Multimodal Public Transport Networks. J. Transp. Geogr. 2017, 65, 123–133. [Google Scholar] [CrossRef]
- Mohri, S.S.; Mortazavi, S.; Nassir, N. A Clustering Method for Measuring Accessibility and Equity in Public Transportation Service: Case Study of Melbourne. Sustain. Cities Soc. 2021, 74, 103241. [Google Scholar] [CrossRef]
- Tahmasbi, B.; Haghshenas, H. Public Transport Accessibility Measure Based on Weighted Door to Door Travel Time. Comput. Environ. Urban Syst. 2019, 76, 163–177. [Google Scholar] [CrossRef]
- Cavallaro, F.; Dianin, A. An Innovative Model to Estimate the Accessibility of a Destination by Public Transport. Transp. Res. Part D Transp. Environ. 2020, 80, 102256. [Google Scholar] [CrossRef]
- Rosik, P.; Pomianowski, W.; Goliszek, S.; Stępniak, M.; Kowalczyk, K.; Guzik, R.; Kołoś, A.; Komornicki, T. Multimodalna Dostępność Transportem Publicznym Gmin W Polsce. IGiPZ PAN 2017, 1, 11. [Google Scholar]
- Claire, P.; Dupont-Kieffer, A.; Palmier, P. Potential Accessibility to the Workplace by Public Transit and Its Social Distribution in Lille, France: A Scenario-Based Equity Appraisal. Transp. Policy 2022, 125, 256–266. [Google Scholar] [CrossRef]
- Liu, M.; Jiang, Y. Measuring Accessibility of Urban Scales: A Trip-Based Interaction Potential Model. Adv. Eng. Inform. 2021, 48, 101293. [Google Scholar] [CrossRef]
- Tubis, A.A.; Skupień, E.T.; Rydlewski, M. Method of Assessing Bus Stops Safety Based on Three Groups of Criteria. Sustainability 2021, 13, 8275. [Google Scholar] [CrossRef]
- Van Soest, D.; Tight, M.R.; Rogers, C.D.F. Exploring the Distances People Walk to Access Public Transport. Transp. Rev. 2020, 40, 160–182. [Google Scholar] [CrossRef]
- Soczówka, P.; Kłos, M.J.; Żochowska, R.; Sobota, A. An Analysis of the Influence of Travel Time on Access Time in Public Transport. Sci. J. Sil. Univ. Technol. Ser. Transp. 2021, 111, 137–149. [Google Scholar] [CrossRef]
- Śleszyński, P. Dostepność Czasowa i Jej Zastosowania. Prz. Geogr. 2014, 86, 171–215. [Google Scholar] [CrossRef]
- Sierpiński, G.; Staniek, M.; Kłos, M.J. Decision Making Support for Local Authorities Choosing the Method for Siting of In-City Ev Charging Stations. Energies 2020, 13, 4682. [Google Scholar] [CrossRef]
- Sun, Y.; Wu, M.; Li, H. Using Gps Trajectories to Adaptively Plan Bus Lanes. Appl. Sci. 2021, 11, 1035. [Google Scholar] [CrossRef]
- Younes, H.; Nasri, A.; Baiocchi, G.; Zhang, L. How Transit Service Closures Influence Bikesharing Demand; Lessons Learned from SafeTrack Project in Washington, D.C. Metropolitan Area. J. Transp. Geogr. 2019, 76, 83–92. [Google Scholar] [CrossRef]
- Chen, B.Y.; Cheng, X.P.; Kwan, M.P.; Schwanen, T. Evaluating Spatial Accessibility to Healthcare Services under Travel Time Uncertainty: A Reliability-Based Floating Catchment Area Approach. J. Transp. Geogr. 2020, 87, 102794. [Google Scholar] [CrossRef]
- Panagiotopoulos, G.; Kaliampakos, D. Location Quotient-Based Travel Costs for Determining Accessibility Changes. J. Transp. Geogr. 2021, 91, 102951. [Google Scholar] [CrossRef]
- Lahoorpoor, B.; Levinson, D.M. Catchment If You Can: The Effect of Station Entrance and Exit Locations on Accessibility. J. Transp. Geogr. 2020, 82, 102556. [Google Scholar] [CrossRef]
- Śleszyński, P.; Olszewski, P.; Dybicz, T.; Goch, K.; Niedzielski, M.A. The Ideal Isochrone: Assessing the Efficiency of Transport Systems. Res. Transp. Bus. Manag. 2022, 100779, In Press. [Google Scholar] [CrossRef]
- Staricco, L. 15-, 10- or 5-Minute City? A Focus on Accessibility to Services in Turin, Italy. J. Urban Mobil. 2022, 2, 100030. [Google Scholar] [CrossRef]
- Ifeanyi Washington, O.; Dillip Kumar, D.; Mulemwa, A. Assessment of Accessibility of Public Bus Transportation in Durban by GIS-Based Network Analysis. Int. J. Transp. Dev. Integr. 2021, 5, 175–189. [Google Scholar] [CrossRef]
- Singleton, P.A.; Park, K.; Lee, D.H. Varying Influences of the Built Environment on Daily and Hourly Pedestrian Crossing Volumes at Signalized Intersections Estimated from Traffic Signal Controller Event Data. J. Transp. Geogr. 2021, 93, 103067. [Google Scholar] [CrossRef]
- Jun, M.J.; Choi, K.; Jeong, J.E.; Kwon, K.H.; Kim, H.J. Land Use Characteristics of Subway Catchment Areas and Their Influence on Subway Ridership in Seoul. J. Transp. Geogr. 2015, 48, 30–40. [Google Scholar] [CrossRef]
- Mavoa, S.; Boulangé, C.; Eagleson, S.; Stewart, J.; Badland, H.M.; Giles-Corti, B.; Gunn, L. Identifying Appropriate Land-Use Mix Measures for Use in a National Walkability Index. J. Transp. Land Use 2018, 11, 681–700. [Google Scholar] [CrossRef]
- Ewing, R.; Cervero, R. Travel and the Built Environment. J. Am. Plan. Assoc. 2010, 76, 265–294. [Google Scholar] [CrossRef]
- Kłos, M.J.; Sierpiński, G. Building a Model of Integration of Urban Sharing and Public Transport Services. Sustainability 2021, 13, 3086. [Google Scholar] [CrossRef]
- Xiao, W.; Wei, Y.D.; Wan, N. Modeling Job Accessibility Using Online Map Data: An Extended Two-Step Floating Catchment Area Method with Multiple Travel Modes. J. Transp. Geogr. 2021, 93, 103065. [Google Scholar] [CrossRef]
- Murray, A.T. Strategic Analysis of Public Transport Coverage. Socio-Econ. Plan. Sci. 2001, 35, 175–188. [Google Scholar] [CrossRef]
- Ortega, J.; Tóth, J.; Péter, T. Planning a Park and Ride System: A Literature Review. Future Transp. 2021, 1, 82–98. [Google Scholar] [CrossRef]
- Noichan, R.; Dewancker, B. Analysis of Accessibility in an Urban Mass Transit Node: A Case Study in a Bangkok Transit Station. Sustainability 2018, 10, 4819. [Google Scholar] [CrossRef]
- Brost, W.; Funke, T.; Lembach, M. Spatial Analysis of the Public Transport Accessibility for Modelling the Modal Split in the Context of Site Identification for Charging Infrastructure. Infrastructures 2018, 3, 21. [Google Scholar] [CrossRef]
- Truden, C.; Kollingbaum, M.J.; Reiter, C.; Schasché, S.E. A GIS-Based Analysis of Reachability Aspects in Rural Public Transportation. Case Stud. Transp. Policy 2022, 10, 1827–1840. [Google Scholar] [CrossRef]
- Zannat, K.E.; Adnan, M.S.G.; Dewan, A. A GIS-Based Approach to Evaluating Environmental Influences on Active and Public Transport Accessibility of University Students. J. Urban Manag. 2020, 9, 331–346. [Google Scholar] [CrossRef]
- Domènech, A.; Gutiérrez, A. A GIS-Based Evaluation of the Effectiveness and Spatial Coverage of Public Transport Networks in Tourist Destinations. ISPRS Int. J. Geoinf. 2017, 6, 83. [Google Scholar] [CrossRef]
- Ganciu, A.; Balestrieri, M.; Imbroglini, C.; Toppetti, F. Dynamics of Metropolitan Landscapes and Daily Mobility Flows in the Italian Context. An Analysis Based on the Theory of Graphs. Sustainability 2018, 10, 596. [Google Scholar] [CrossRef]
- Owuor, I.; Hochmair, H.H. An Overview of Social Media Apps and Their Potential Role in Geospatial Research. ISPRS Int. J. Geoinf. 2020, 9, 526. [Google Scholar] [CrossRef]
- Stępniak, M.; Pritchard, J.P.; Geurs, K.T.; Goliszek, S. The Impact of Temporal Resolution on Public Transport Accessibility Measurement: Review and Case Study in Poland. J. Transp. Geogr. 2019, 75, 8–24. [Google Scholar] [CrossRef]
- Soczówka, P.; Żochowska, R.; Karoń, G. Method of the Analysis of the Connectivity of Road and Street Network in Terms of Division of the City Area. Computation 2020, 8, 54. [Google Scholar] [CrossRef]
- Karoń, G.; Żochowska, R.; Sobota, A.; Janecki, R. Advances in Intelligent Systems and Computing. In Advanced Solutions of Transport Systems for Growing Mobility; Sierpiński, G., Ed.; Springer International Publishing: Cham, Switzerland, 2018; Volume 631, ISBN 978-3-319-62315-3. [Google Scholar]
- Soczówka, P.; Żochowska, R.; Sobota, A.; Kłos, M.J. The Effect of Delimitation of the Area on the Assessment of the Density of the Road Network Structure; Springer: Cham, Switzerland, 2020; pp. 20–36. [Google Scholar]
- Available online: https://bdl.stat.gov.pl/bdl/start (accessed on 2 October 2022).
- Available online: https://rspo.men.gov.pl/ (accessed on 2 October 2022).
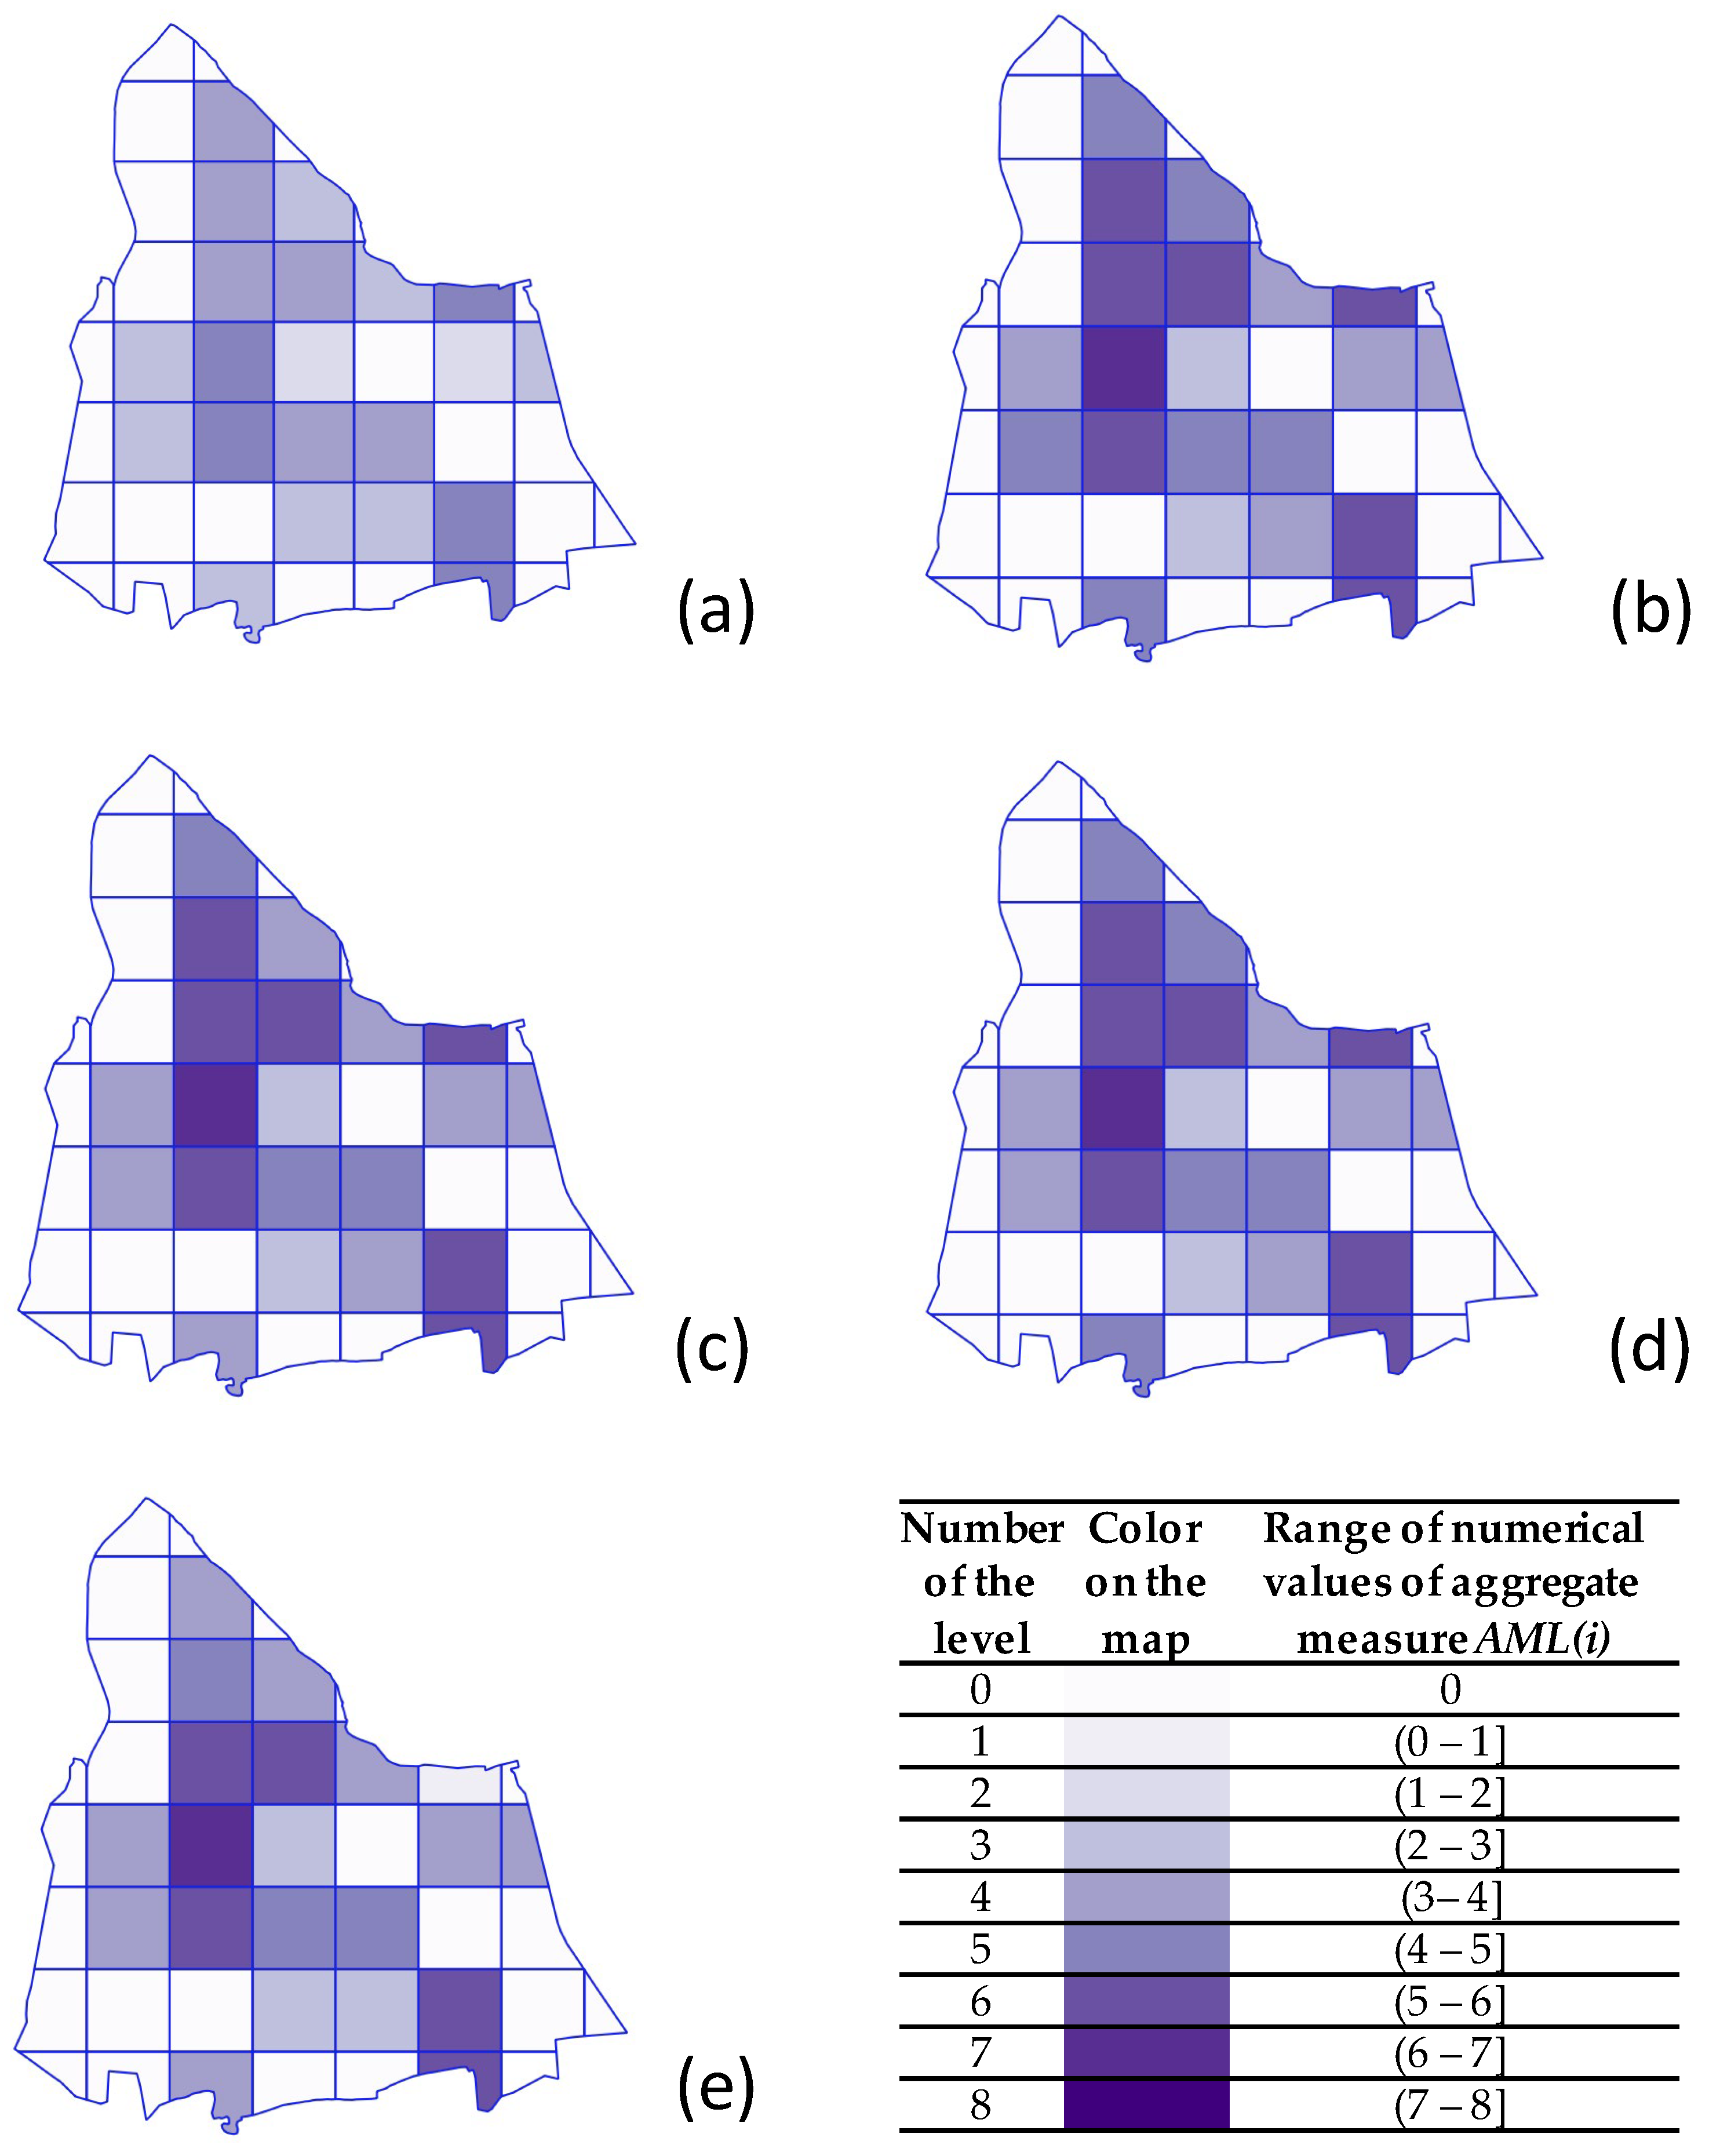
| Color On the Map | Range of Numerical Values of a Measure of the Potential Transport Demand for Each Level | |
|---|---|---|
| 0 | 0 | |
| 1 | (0–1000] | |
| 2 | (1000–2000] | |
| 3 | (2000–3000] | |
| 4 | (3000–4000] | |
| 5 | (4000–5000] | |
| 6 | (5000–6000] | |
| 7 | (6000–7000] | |
| 8 | (7000–8000] |
| Color on the Map | Range of Numerical Values of a Measure of Public Transport Supply for Each Level | ||||
|---|---|---|---|---|---|
| 0 | 0 | 0 | 0 | 0 | |
| 1 | (0–3] | (0–1] | (35–40] | (0.0–2.5] | |
| 2 | (3–6] | (1–2] | (30–35] | (2.5–5.0] | |
| 3 | (6–9] | (2–3] | (25–30] | (5.0–7.5] | |
| 4 | (9–12] | (3–4] | (20–25] | (7.5–10.0] | |
| 5 | (12–15] | (4–5] | (15–20] | (10.0–12.5] | |
| 6 | (15–18] | (5–6] | (10–15] | (12.5–15.0] | |
| 7 | (18–21] | (6–7] | (5–10] | (15.0–17.5] | |
| 8 | (21–24] | (7–8] | (0–5] | (17.5–20.0] | |
| Range of Value of the Measure | Percentage Share of Basic Fields | |||||||
|---|---|---|---|---|---|---|---|---|
| Individual Measures | ||||||||
| {−8; −7} | 0% | 0% | 0% | 0% | 0% | 0% | 0% | 0% |
| {−6; −5} | 9% | 7% | 7% | 4% | 4% | 4% | 7% | 4% |
| {−4; −3} | 22% | 13% | 9% | 11% | 11% | 11% | 9% | 9% |
| {−2; −1} | 27% | 36% | 36% | 27% | 29% | 27% | 33% | 31% |
| 0 | 27% | 24% | 33% | 27% | 24% | 24% | 31% | 27% |
| {1; 2} | 13% | 16% | 7% | 16% | 18% | 18% | 9% | 11% |
| {3; 4} | 0% | 4% | 9% | 9% | 11% | 9% | 11% | 13% |
| {5; 6} | 2% | 0% | 0% | 7% | 2% | 7% | 0% | 4% |
| {7; 8} | 0% | 0% | 0% | 0% | 0% | 0% | 0% | 0% |
| Range of Value of the Measure | Percentage Share of Basic Fields | ||||
|---|---|---|---|---|---|
| Aggregated Measures | |||||
| [−8; −6) | 0% | 0% | 0% | 0% | 0% |
| [−6; −4) | 7% | 4% | 4% | 4% | 7% |
| [−4; −2) | 24% | 11% | 13% | 11% | 11% |
| [−2; 0) | 31% | 40% | 40% | 40% | 40% |
| 0 | 18% | 20% | 18% | 20% | 18% |
| (0; 2] | 18% | 9% | 11% | 11% | 13% |
| (2; 4] | 2% | 16% | 13% | 13% | 11% |
| (4; 6] | 0% | 0% | 0% | 0% | 0% |
| (6; 8] | 0% | 0% | 0% | 0% | 0% |
Publisher’s Note: MDPI stays neutral with regard to jurisdictional claims in published maps and institutional affiliations. |
© 2022 by the authors. Licensee MDPI, Basel, Switzerland. This article is an open access article distributed under the terms and conditions of the Creative Commons Attribution (CC BY) license (https://creativecommons.org/licenses/by/4.0/).
Share and Cite
Żochowska, R.; Kłos, M.J.; Soczówka, P.; Pilch, M. Assessment of Accessibility of Public Transport by Using Temporal and Spatial Analysis. Sustainability 2022, 14, 16127. https://doi.org/10.3390/su142316127
Żochowska R, Kłos MJ, Soczówka P, Pilch M. Assessment of Accessibility of Public Transport by Using Temporal and Spatial Analysis. Sustainability. 2022; 14(23):16127. https://doi.org/10.3390/su142316127
Chicago/Turabian StyleŻochowska, Renata, Marcin Jacek Kłos, Piotr Soczówka, and Marcin Pilch. 2022. "Assessment of Accessibility of Public Transport by Using Temporal and Spatial Analysis" Sustainability 14, no. 23: 16127. https://doi.org/10.3390/su142316127
APA StyleŻochowska, R., Kłos, M. J., Soczówka, P., & Pilch, M. (2022). Assessment of Accessibility of Public Transport by Using Temporal and Spatial Analysis. Sustainability, 14(23), 16127. https://doi.org/10.3390/su142316127


