Abstract
Xi’an is a key city for air-pollution prevention and control in China, and its near-ground ozone (O3) pollution has become a key issue whose resolution is urgent. The spatial and temporal variations in ozone pollution and their relationship with meteorological factors, transport pathways, and potential source distribution in Xi’an City were investigated in this study using the backward trajectory clustering analysis, potential source contribution function (PSCF), and concentration weight trajectory (CWT) methods coupled with the hourly ozone-mass concentration observations and meteorological data from 2014 to 2020. The results indicate that Xi’an City has suffered from increasingly severe ozone pollution in recent years. Overall, the annual average mass concentration of O3_8h_max presented an upward trend, exhibiting a 34.94% increase from 2014 to 2020. A seasonal variation peak occurred in summer, and the monthly variations featured an inverted “V” shape. Furthermore, the diurnal variation was significantly affected by the near-surface atmospheric photochemical process, showing a discernible single-peak and single-valley distribution with a peak between 15:00 and 17:00. The O3 concentration demonstrated a significant linear positive correlation with surface temperature and sunshine duration. When the relative humidity was 30~50%, the temperature was above 30 °C, and the wind speed was ≤4 m/s, high-concentration O3 pollution was liable to occur. The transmission mainly relied on short-distance airflow during periods of heavy O3-polluted weather. In this context, in addition to local O3 generation, high O3 concentrations were also affected by the large NOx and VOC emissions from heavy industries in neighboring cities in Shaanxi Province, southwest Shanxi Province, and northern Henan Province. Therefore, joint prevention and control measures on the O3 pollution in Xi’an City must be adopted throughout the Fenwei Plain area with the aim of strictly controlling the emissions from regional pollution sources.
1. Introduction
Near-ground ozone (O3) pollution is an important source affecting the quality of the atmospheric environment. It is mainly generated by precursor pollutants (such as VOCs, NOx, etc.) generated by anthropogenic and natural sources through a series of photochemical reactions under the condition of solar radiation [1,2]. High concentrations of O3 harm the growth of vegetation and crops and seriously affect human health [3,4,5,6,7]. Urban air-quality environmental monitoring data show that in recent years, China’s near-ground O3 concentration has shown a significant increasing trend [8]. Under the premise of further control of fine particulate matter, the days of O3 as the primary pollutant have increased year by year. Therefore, O3 pollution has become another important problem that needs to be solved urgently as part of China’s air pollution control.
The research results of previous studies have shown that the phenomenon of near-ground O3 concentrations exceeding the standard value in China is relatively common, and urban and regional O3 pollution is intensifying [9,10]. For example, Xu et al. [11], Yin et al. [12], and Ma et al. [13] found that the concentration of O3 showed an upward trend in Shanghai, Guangzhou, and the northern suburbs of Beijing, respectively. Yi et al. [14] researched the change characteristics of the O3 concentrations of 25 cities in the Yangtze River Delta in 2013, and the results indicated that the spatial distribution of the O3 pollution showed obvious patchy distribution characteristics, and the pollution in Shanghai and its surrounding cities was the most serious. Hu et al. [15] studied the variation characteristics of the O3 concentrations in the Beijing–Tianjin–Hebei region and concluded that the O3 concentrations increased over the years from 2014 to 2018, and the concentrations’ growth rates in different regions were significantly different; the O3 high-value belt areas were concentrated in coastal cities, such as Tianjin, Qinhuangdao, Tangshan, etc. With the increase in the proportion of cities with O3 exceeding the standard value, an increasing number of studies have begun to focus on the relationship between the spatial and temporal distribution characteristics of O3 pollution and meteorological factors and other environmental factors, such as NOx [16,17,18]. The research on atmospheric O3 concentration and meteorological factors shows that high O3 pollution events are usually related to meteorological conditions, such as high temperatures, strong radiation, low wind speed, and low relative humidity [19,20]. Gu et al. [21] found that the O3 concentration increased more rapidly with the increase in temperature when the temperature in Shanghai was higher than 30 ℃ in summer. Wang et al. [22] found that temperature had the greatest impact on the O3 concentration in Beijing, followed by air pressure and humidity. Zhao et al. [23] found that sunny days with less rain, higher temperature, stronger radiation, lower relative humidity, and lower wind speed were typical meteorological characteristics of O3 concentrations above the standard values in Hong Kong.
Near-ground ozone has a relatively long atmospheric lifetime and regional transport characteristics. [24]. The local O3 concentration is not only affected by the photochemical reaction of locally emitted precursors, but also by the transport of externally generated O3 or O3 precursors. Scholars have used the hybrid single-particle Lagrangian integrated trajectory (HYSPLIT), potential source contribution function (PSCF), and concentration weight trajectory (CWT) methods to study the cross-regional transport of O3. For example, Dimitriou et al. [25] used backward trajectory analysis to find that the potential O3 transboundary sources for Athens were mainly localized over the Balkan Peninsula, Greece, and the Aegean Sea, while Ioannina was mainly influenced by northern Greece and the Balkans Peninsula, and the difference in the pollution transmission between the two cities was mainly influenced by topography. Sharma et al. [26] used the PSCF and CWT methods to find that the Ganges Plain was the major potential source area of O3 pollution in Delhi, India. Zhang et al. [27] used the backward trajectory and PSCF methods to find that O3 pollution in Hangzhou was affected by the transport of pollutants in Zhejiang, Jiangsu, and Anhui Provinces. Fu et al. [28] discussed the potential source area of an O3 pollution process in Hainan Province, and the results showed that Guangdong Province was the major potential source area of O3 pollution in Hainan Province.
To sum up, in China, the current studies about the variation characteristics of O3 pollution, its relationship with meteorological factors and transport pathways, and its potential source are mostly concentrated in North China, East China, and coastal cities. Although, against the background of China’s vigorous implementation of the Western development strategy, the urban economy in the central and western regions has developed rapidly, and this has caused serious atmospheric environmental problems, such as O3 pollution. Therefore, it is necessary to carry out research on the characteristics of O3 pollution, its transport path, and the distribution of potential sources in central and western cities.
Xi’an is the economic and cultural center of Northwest China. Its geographical location is between the northern Shaanxi Plateau and the Qinling Mountains. The terrain of the basin makes the natural diffusion capacity of air pollutants in Xi’an relatively weak. Moreover, in the past ten years, the rapid urbanization and industrialization of Xi’an have led to the increasing consumption of energy. However, this has been accompanied by the emissions of a large number of pollutants, such as NOx and VOCs, into the atmosphere, resulting in increasingly serious O3 pollution problems. The impact of O3 on air quality is next only to PM2.5 and PM10, and the concentration of O3 has risen rapidly in recent years. From 2016 to 2019, the 90th-percentile concentrations of O3 during the 8 h of highest concentrations in Xi’an were 162, 185, 180, and 166 μg/m3, respectively [29]. Although more efforts have been made to control air pollution in recent years, Xi’an still featured in the bottom 20 in the air-quality rankings of 168 key cities in 2021, and the prevention and control of air pollution in Xi’an still require improvement.
Taking Xi’an as an example, this study first analyzed the O3 concentration in Xi’an from 2014 to 2020 from the temporal and spatial change characteristics of different scales and analyzed O3 concentration’s relationship with meteorological factors, such as daytime hours, surface temperature, relative humidity, wind speed, and O3 concentration. Second, using the backward trajectory clustering, PSCF, and CWT analysis methods to explore the main transport pathways of O3 in Xi’an during periods of heavy pollution, the potential source areas that affect O3 pollution in Xi’an were revealed. This study is expected to provide data support for the prevention and control of air pollution in Xi’an and the joint prevention and control of that in the Fenwei Plain.
2. Materials and Methods
2.1. Data Sources
The hourly O3 mass concentration and nitrogen dioxide (NO2) data in Xi’an were obtained from China’s National Ambient Air Quality Monitoring Network from 2014 to 2020. The average value of the O3 concentration data represents the overall O3 mass concentration in Xi’an. In the process of data collection, when the data are missing or abnormal, it is necessary to eliminate abnormal data and then fill in the missing data through linear interpolation. The annual mean value of the mass concentration of pollutant O3_8h_max (moving average of the maximum 8-h concentration) refers to the arithmetic mean value of O3_8h_max on all days in the study year, the quarterly mean value refers to the arithmetic mean value of O3_8h_max on all days in the research season, the monthly mean value refers to the arithmetic mean value of O3_8h_max on all days in the research month, and the daily mean value refers to the moving average value of the daily maximum 8-h concentrations. A single-day pollutant O3_8h_max concentration exceeding the standard means that the concentration is higher than 160 μg/m3, and hourly pollutant O3 concentration exceeding the standard means that the concentration is higher than 200 μg/m3. Meteorological data, such as temperature, relative humidity, daytime hours, and wind speed were obtained from the hourly monitoring data of the Xi’an Meteorological Station. The descriptive statistical summary of meteorological data and air quality variables show in Table 1. The meteorological data used in the backward trajectory (HYSPLIT) model were the Global Data Assimilation System (GDAS) data provided by the US Center for Environmental Prediction (NCEP), with a spatial resolution of 1° × 1°.

Table 1.
Descriptive statistical summary of meteorological data and air quality variables.
2.2. Research Method
2.2.1. HYSPLIT Model
The HYSPLIT model is an integrated model that has the function of dealing with various input fields of meteorological elements, various physical processes, and different types of pollutant emission sources, and was developed by the National Oceanic and Atmospheric Center in the United States and the Australian Bureau of Meteorology [30]. This model is a mixture of the Euler and Lagrangian diffusion models. The Lagrangian method is used for advection and diffusion calculation, and the Euler method is used for concentration calculation. It is widely used to analyze and calculate the transport path, settlement mode, and diffusion trajectory of air pollutants. In this study, the transport trajectories of air masses were calculated and clustered using the HYSPLIT model so as to track the transport paths of airflows arriving in Xi’an (34.23° N, 108.93° E) based on the Meteoinfo software and the GDAS data provided by NCEP. The backward trajectory of the air mass arriving in Xi’an every hour (0:00–23:00) each day from 2016 to 2020 during the heavy O3 pollution period was calculated. The trajectory was delayed for 48 h, and the simulation height was 500 m above ground level.
2.2.2. PSCF
The PSCF is a method for judging the possible orientation and location of emission sources based on the conditional probability function, and the possible location of the emission source is given by combining the air-mass trajectory and the feature values. The PSCF function is defined as the conditional probability that the corresponding element value exceeds the set threshold when the air mass passing through the ij grid (i and j represent longitude and latitude, respectively) reaches the observation point. The larger the PSCF value, the greater the contribution of the grid point to the pollutant mass concentration of the starting point [31]. The grid area corresponding with the high PSCF value is the potential source area of O3 in Xi’an, and the trajectories passing through this area are the transport paths that affect the O3 concentration. The grid of the study area is divided into 0.2° × 0.2°. In this study, the exceeding threshold was set as the O3 secondary mass concentration limit of 160 μg/m3. When the O3 mass concentration corresponding to the trajectory is higher than the set exceeding threshold, the trajectory is a pollution trajectory. PSCFij is the ratio of the number of polluted tracks passing through a grid (Pij) to the total number of tracks in the grid (Qij). The formula is as follows:
Since PSCF is a function based on conditional probability, the error of PSCF can increase as the distance between the starting point and the sampling point increases. When nij is small, there is large uncertainty. To reduce the error, the weight function WPSCF is usually applied to reduce the uncertainty of PSCF [32].
Among which,
2.2.3. CWT
The input data and applicable grid resolution for the PSCF and CWT methods are the same. PSCF methods typically use concentration thresholds to assess potential sources of pollutants, meaning that some tracks may have the same PSCF value when pollutant concentrations are slightly or well above the standard, and therefore, it may not be possible to distinguish between moderate and heavy sources of pollution. However, the CWT method can calculate the weight concentration of each track. In the process of meshing, each grid point can be assigned a weight concentration by calculating the average pollutant concentration corresponding to all tracks passing through the grid, thus overcoming the limitations brought by the PSCF method. A larger CWT value indicates a higher regional transmission concentration value [33]. The formula is as follows:
Cij is the average weighted concentration of each grid (i, j), T represents the trajectory, N is the total number of tracks, CT is the pollutant concentration (μg/m3) when the track T passes through a grid (i, j), and is the time that the trajectory T stays in a grid (i, j). The CWT method also uses the same weight function (Wij) to reduce the uncertainty, thus obtaining the WCWT values. Therefore, the main source areas of external contribution to O3 pollution in Xi’an are the grid areas with higher Cij values, and the pollution trajectories passing through these grid areas are the main transport pathways that cause the increases in O3 concentration.
3. Results and Discussion
3.1. Variation Characteristics of O3 Mass Concentration from 2014 to 2020
From 2014 to 2020, the annual average mass concentration of O3_8h_max in Xi’an shows a rising and fluctuating trend (Figure 1a). The annual average concentrations were 65.58, 74.92, 87, 93.5, 89.5, 88.33, and 88.5 μg/m3, among which the highest concentration of O3_8h_max was in 2017, and an increase of 34.94% was observed in 2020 compared to 2014. In addition, the number of days exceeding the standard rate of O3 pollution in Xi’an generally shows an upward trend; in particular, the number of days exceeding the standard of O3 in 2017 reached 68, an increase of 30 days compared to 2016. In addition, the earliest and latest dates of the O3 concentration exceeding the standard value have continued to advance. The earliest dates of the O3 concentration exceeding the standard value were 3 April, 18 April, and 27 April, respectively, in 2018, 2019, and 2020. The latest dates of the O3 concentration exceeding the standard value were 30 August 2018, 8 September 2019, and 8 September 2020, with concentrations of 168, 171, and 162 μg/m3, respectively. In view of the current state of O3 pollution, Xi’an City has carried out special rectification for volatile organic matter pollution and motor vehicle pollution in recent years, including for industrial enterprises, auto repair painting, catering fumes, oil and gas storage and transportation, decorative coatings, high-pollution and high-emission vehicles, etc. In the last three years, the number of days on which O3 pollution exceeded the standard rate decreased significantly compared to 2017; however, the state of O3 pollution prevention and control is still not optimistic, and sudden heavy O3 pollution events often occur. Therefore, it is necessary to strengthen the efforts to reduce O3 pollution.
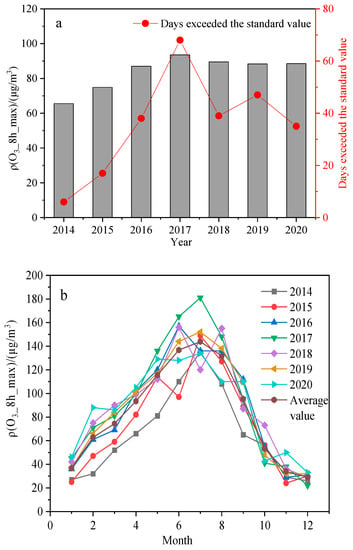
Figure 1.
Characteristics of annual (a) and monthly (b) variation in O3 mass concentration in Xi’an City during 2014~2020.
The monthly variation trend of the O3_8h_max mass concentrations in Xi’an shows an obvious inverted “V” shape (Figure 1b). They gradually increased from January to the highest value in June to July, with a concentration range of 97–181 μg/m3, and then began to decline. In 2017, the O3 mass concentration presented an abnormally high value (181 μg/m3 in July), which was related to the high temperature that year (the highest temperature range, from June to August, reached 35.72–39.45 °C) and less precipitation. From June to July, the solar radiation was strong, the temperature was high, the sunshine duration was long, and the photochemical reactions were strong, resulting in a high O3 mass concentration [34,35]. In winter, the temperature was low, the sunshine duration was short, and the photochemical reaction was weak, meaning that the high concentrations of particulate matter increased the aerosol optical thickness and reduced the photochemical reaction rate of O3 [36]. Therefore, the mass concentration of O3 was at its lowest from December to January.
Figure 2 shows the diurnal cycle trend of the hourly average mass concentrations of the pollutants, NO2 and O3, in different seasons in Xi’an from 2014 to 2020. It can be seen in the figure that the daily variation trend of the O3 mass concentration in different seasons presents a single-peak and single-valley distribution. Especially in summer, the maximum diurnal ranges of the O3 concentration were reached. This is also confirmed by the maximum standard deviation in summer in Table 2. The lowest values of the O3 concentration appeared at 06:00–08:00. The highest values of the O3 concentration appeared at 15:00–17:00 (the time at which the O3 concentration reached its highest values in summer was earlier due to the sun rising earlier and the temperature rising faster) and the O3 concentration gradually decreased after reaching the peak. Higher temperatures and stronger solar radiation were the main reasons for the higher O3 mass concentrations in the afternoons. In this study, the diurnal variation of the O3 precursor, NO2, exhibited a bimodal distribution. The first peak generally appeared at 8:00–10:00, which was caused by the morning peak Xi’an. After sunrise, the solar radiation increased, and NO underwent a photochemical reaction to generate NO2. With the weakening of the solar radiation, the generation rate gradually slowed down, and the NO and O3 underwent a titration reaction at night to generate NO2, resulting in the second peak of NO2, which generally appeared at 20:00–23:00. In addition, a study showed that vehicles have become an important source of NO2 [37]. After 17:00, vehicles produce a large amount of exhaust gas during the rush hour, and the concentration of NO2 rises again. At night, NO reacts with O3 to generate NO2, while the photolysis reaction between NO2 and O3 stagnates, which is an important reason for the occurrence of the peak value of NO2 at night.
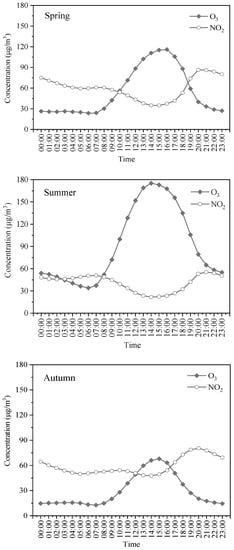
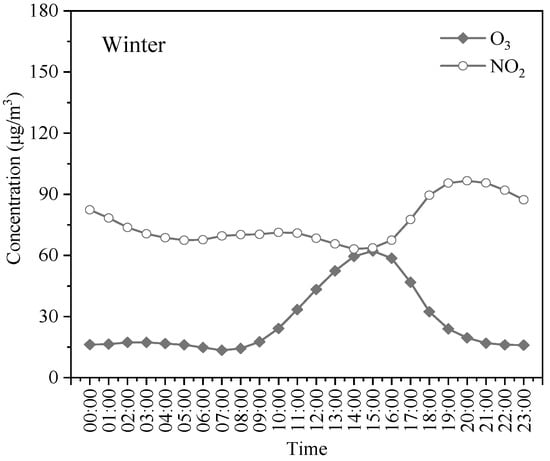
Figure 2.
Daily variations in the O3 and nitrogen dioxide concentrations in the four seasons from 2014 to 2020 in Xi’an City.

Table 2.
The standard deviation of daily variations of O3 concentrations in the four seasons from 2014 to 2020 in Xi’an City.
3.2. Relationship between O3 Pollution and Meteorological Conditions
The production of high concentrations of O3 pollution requires certain meteorological conditions. Meteorological factors play a critical role in the formation, deposition, transport, and dilution of O3. Large-scale circulation also exerts an important impact on the changes of O3. The authors analyzed the relationship between the monitoring data of the O3 concentrations and the meteorological data from September 2020 to August 2021. Among these, the daily data were used to analyze the relationship between the sunshine duration and the ozone concentration, and the hourly data were used to analyze the relationships between the surface temperature, relative humidity, and wind speed and the O3 concentration.
3.2.1. Sunshine Duration
The influence of photochemical reactions on the O3 concentration is mainly reflected by sunshine duration. The conditions of photochemical reactions are closely related to sunshine. With the increase in the sunshine duration, the rate of photochemical reaction increases correspondingly, thus accelerating the generation of O3. As shown in Figure 3, with the continuous increase in the sunshine duration, the concentration of pollutant O3_8h_max increased correspondingly, and the over-standard rate of the O3_8h_max concentration also shows an upward trend. When the sunshine duration exceeded 8 h, the over-standard rate of O3_8h_max concentration had a significant upward trend. Especially when the sunshine duration was more than 10 h, the over-standard rate of O3_8h_max concentration reached 60%, and the average concentration was 170.4 μg/m3. In addition, the sunshine duration and the O3 concentration show a significant positive correlation (the correlation coefficient is 0.66, with a significant correlation at the 0.01 level).
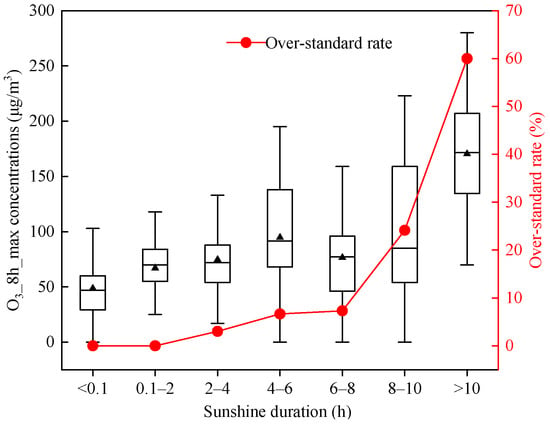
Figure 3.
Variations in O3 concentration and the over-standard rate with different sunshine durations in Xi’an City (the upper edge, midline, small triangle, and lower edge of each box in the box diagram represent the upper quartile, median, mean, and lower quartile, respectively; the same applies below).
3.2.2. Temperature
O3 can undergo a photochemical reaction under the action of solar radiation, and the change in the solar radiation intensity is reflected by the temperature. As shown in Figure 4, the average mass concentration of O3 and its over-standard rate show an increasing trend with the increase in temperature. When the temperature was lower than 25 ℃, the O3 mass concentration did not exceed the standard value. However, when the temperature exceeded 25 ℃, the O3 concentration value appears to have exceeded the standard value. Especially when the temperature exceeded 30°, the over-standard rate reached 42.66%, and the average mass concentration was 153.72 μg/m3. The fitting analysis of the O3 concentration and surface temperature shows a significant positive correlation (the correlation coefficient is 0.68, which is significantly correlated at the 0.01 level).
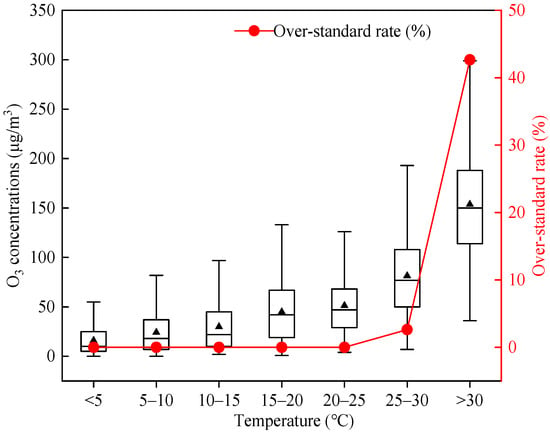
Figure 4.
Variations in the O3 concentration and the over-standard rate with different temperatures in Xi’an City.
3.2.3. Relative Humidity
Under certain conditions, solar radiation is affected by water vapor in the atmosphere, which can affect photochemical reactions and consume O3 in the atmosphere. As shown in Figure 5, the average mass concentration of O3 increased first and then decreased with the increase in relative humidity, and the over-standard rate of the O3 concentration shows the same trend. When the relative humidity was lower than 30%, the over-standard rate of O3 concentration was relatively low. When the relative humidity was between 30–40% and 40–50%, a high O3 concentration occurred frequently, and the over-standard rate reached 13.03% and 14.19%, respectively. However, when the relative humidity was greater than 60%, the over-standard rate dropped sharply, which is related to the fact that O3 near the surface tends to produce wet deposition under the condition of high relative humidity, leading to a decrease in its concentration.
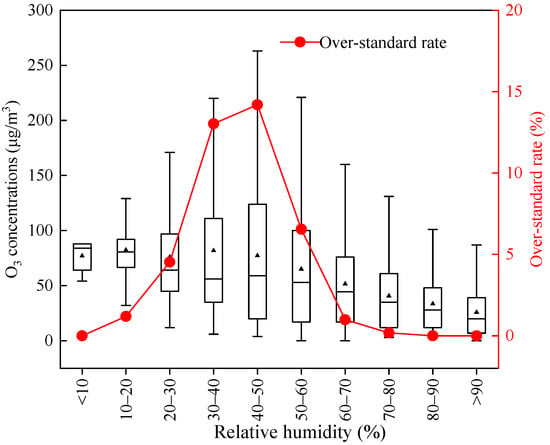
Figure 5.
Variations in the O3 concentration and the over-standard rate with different relative humidity in Xi’an City.
3.2.4. Wind Speed
Wind speed has a significant influence on the strength of stability in the atmospheric boundary layer. Different wind speeds also determine the removal efficiency and transport efficiency of pollutant O3, and its action mechanism is relatively complex. As shown in Figure 6, when the wind speed was less than 4 m/s, the over-standard rate of O3 concentration shows an upward trend with the increase in the wind speed. Among them, when the wind speed was between 3 and 4 m/s, the over-standard rate of O3 concentration reached the highest value, reaching 10.15%. When the wind speed was between 5 and 6 m/s, the average O3 mass concentration and over-standard rate began to decrease. When the wind speed was greater than 6 m/s, O3 concentration did not exceed the standard. When the wind speed was small, it was conducive to the photochemical reaction and agglomeration of O3 and its precursors, and then produced high concentrations of O3 pollution. When the wind speed gradually increased, O3 and its precursors may have been transported across regions, thus forming regional pollution. When the wind speed was greater than 6 m/s, the higher wind speed could diffuse and dilute O3, leading to a decrease in its concentration.
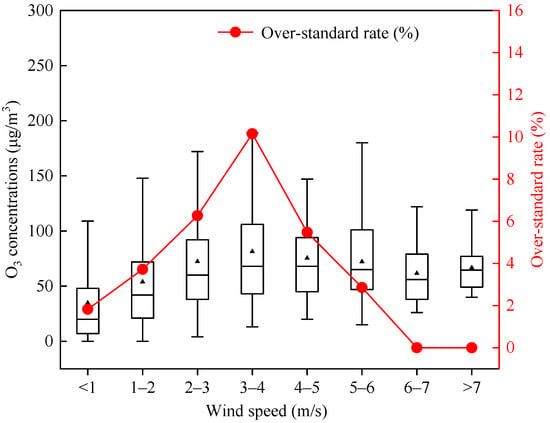
Figure 6.
Variations in the O3 concentration and the over-standard rate with different wind speeds in Xi’an City.
The relationships between the temperature, relative humidity, and wind speed and the average mass concentration of O3 are shown in Figure 7. The meteorological conditions for the formation of high concentrations of O3 are: temperature ≥ 30 °C, relative humidity 30% to 50%, and wind speed ≤ 4 m·s−1. The higher the temperature, the stronger the solar radiation and the more frequent molecular collisions, which are beneficial to the photochemical reactions that generate O3 [38]. The conditions of high temperature and low humidity are conducive to the rapid generation of O3. High temperatures usually occur in sunny weather conditions, with low water vapor content and less cloud cover in the atmosphere; consequently, the solar radiation reaching the ground increases, the rate of the photochemical reactions of O3 precursors in the atmosphere increases, and the average mass concentration of O3 increases. Higher relative humidity is not conducive to the formation of O3 because there is sufficient water vapor under high-humidity weather conditions, and the possibility of cloud formation and precipitation is high, thereby weakening ultraviolet radiation and photochemical reactions [39,40]. An et al., (2009) found that when the relative humidity is around 60%, the photochemical reaction intensity has a limited value. When the relative humidity is too high, the photochemical reaction intensity of the O3 precursor NOx and CO decreases with the increase in relative humidity [41].
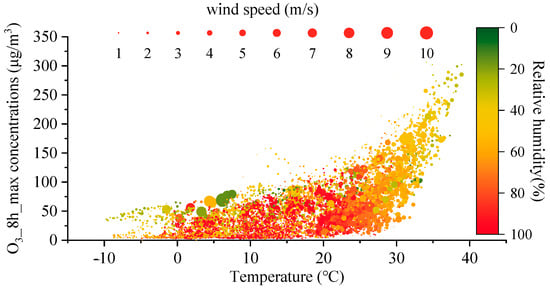
Figure 7.
Relationships between the temperature, relative humidity, and wind speed and the O3 concentrations.
According to the previous analysis, the main meteorological factors affecting the O3 concentration are temperature, sunshine, relative humidity, and wind speed. Therefore, the O3_8h_max concentration (Y) was set as the explained variable, and the daily maximum temperature (X1), sunshine duration (X2), daily average relative humidity (X3), and daily maximum wind speed (X4) were set as the explanatory variables to establish a regression model. According to the regression analysis results, the estimation equation of O3 concentration can be obtained:
According to the regression equation, the higher the daily maximum temperature, the longer the sunshine duration, the smaller the daily average relative humidity, and the smaller the daily maximum wind speed in Xi’an City, the more beneficial it is to increase the O3 photochemical reaction rate, that is, the higher the concentration of O3_8h_max, the more likely an exceeding O3 phenomenon will occur.
3.3. O3 Transport Pathways and Potential Source Analysis in Xi’an during Heavy Pollution
Due to the high concentration of O3 during the heavy pollution period, the variation characteristics of the O3 concentration and the transport path of the external sources were more obvious. This section reports on the selection of the O3 trajectories during the heavy pollution period from 2014 to 2020 for clustering and potential source analysis. The heavy pollution periods were as follows: 17–20 June 2016 (the O3_8h_max average concentration was 217 μg/m3); 25–28 June 2017 (the O3_8h_max average concentration was 219.25 μg/m3); 1–4 July 2017 (the O3_8h_max average concentration was 239.5 μg/m3); 9–15 July 2017 (the O3_8h_max average concentration was 219.86 μg/m3); 1–5 August 2017 (the O3_8h_max average concentration was 216 μg/m3); and 5–9 July 2020 (the O3_8h_max average concentration was 213.6 μg/m3).
During the periods of heavy pollution, the backward trajectory cluster analysis shows that Xi’an was dominated by short-distance transport airflow (Figure 8). Trajectory 1 originated from the southwest direction and reached Xi’an through the southwest of Shaanxi Province, accounting for a relatively high proportion of 25.12%. Trajectory 2, which had a longer conveying distance, originated from the northwest direction and reached Xi’an via Ningxia, eastern Gansu, and central Shaanxi, and features the lowest proportion of 13.33%. Trajectory 3 originated in the vicinity of Xi’an City. It features the shortest conveying distance and the highest proportion of 45.36%. Trajectory 4 originated from the northeast direction and reached Xi’an via southern Shanxi, northern Henan, and eastern Shaanxi, accounting for 16.19%. During the periods of heavy O3 pollution, the air mass in Xi’an mainly came from the surrounding areas and the northeast and southwest of Xi’an. These air masses had a short transmission distance and slow-moving speed, and easily carried O3 precursor pollutants (NOx and VOCs) on the path to Xi’an, which had a major impact on the O3 concentration in Xi’an through their superimposition on local pollution emissions.
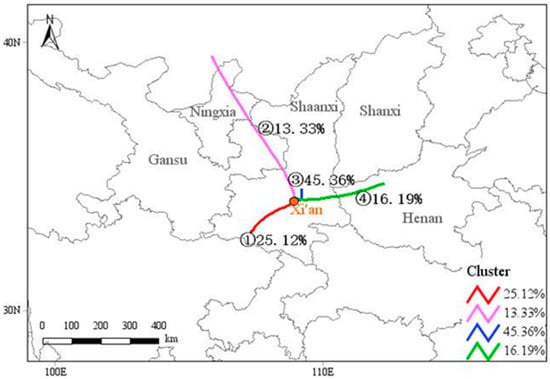
Figure 8.
Cluster-mean back trajectories during heavy pollution.
During the periods of heavy pollution, the analysis results of the potential sources of O3 pollution in Xi’an show (Figure 9) that the areas with high WPSCF values (>0.5) were located in the southwest and southeast of Shaanxi Province, the northwest of Henan Province, the southwest of Shanxi Province, and the central region of Shaanxi Province. In addition, the WPSCF value in the surrounding areas of Xi’an was also relatively large (>0.4), and its influence cannot be ignored. The WCWT results (Figure 9) show that the areas with the greatest contribution to the O3 concentrations in Xi’an during heavy pollution were mainly concentrated in the areas surrounding Xi’an; they were mainly distributed in the southwest and south of Shaanxi Province and the northeast area of Xi’an, with CWT values > 90 μg/m3. Xi’an City is located in the center of Guanzhong, between the northern Shaanxi Plateau and the Qinling Mountains, in the middle of the long and narrow section of the trumpet basin, with a trumpet-mouth-shaped topography to the northeast. A center of the coal chemical industry is located in the southwest of Shanxi Province, upwind of the east and northeast of Xi’an City. Consequently, large volumes of pollutants, such as NOx and VOCs, are discharged, and the polluted air flow easily reaches Xi’an along the trumpet-shaped topography. The stable meteorological conditions and the topography of the bell mouth in Xi’an make it difficult for the precursor pollutants to diffuse. These meteorological conditions and the concentration ratio of precursor pollutants in the areas surrounding Xi’an favor the occurrence of photochemical reactions. Therefore, the joint prevention and control of O3 pollution in the Fenwei Plain must be strengthened in order to strictly control local pollution source emissions.
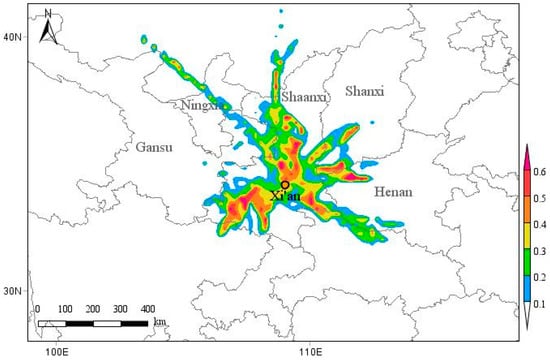
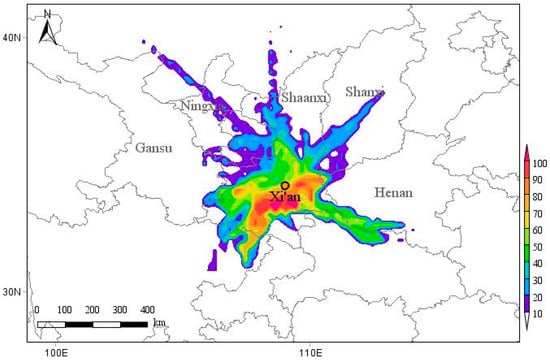
Figure 9.
Weighted potential source contribution function (above) and concentration-weighted trajectory (below) maps of O3 during heavy pollution periods.
4. Conclusions
(1) From 2014 to 2020, the annual variation in the O3_8h_max mass concentration in Xi’an shows a large interannual variability, rising from 65.58 μg/m3 in 2014 to 88.5 μg/m3 in 2020, with an increase of 34.94%. The monthly variation features an inverted “V” shape, rising from January, reaching the maximum value in June and July, and then showing a downward trend. The diurnal variation was significantly affected by the photochemical process of the near-surface atmosphere, presenting an obvious single-peak and single-valley distribution, and the O3 concentrations were low in the morning and night. The variation trend of the mass concentration of NO2, an important precursor pollutant for O3 formation, was opposite to that of the O3 in different seasons.
(2) The average mass concentration of O3 was positively correlated with sunshine duration and surface temperature but had a complex correlation with the relative humidity and wind speed. With the increase in the sunshine duration and surface temperature, the mass concentration of O3 increased correspondingly. However, with the increase in the relative humidity and wind speed, the average mass concentration of O3 rose gently at first and then decreased rapidly. When the temperature was ≥30 °C, the relative humidity was 30~50%, and the wind speed was ≤4 m·s−1, high concentrations of O3 pollution easily occurred.
(3) The cluster analysis of the heavy O3 pollution period in Xi’an from 2014 to 2020 shows that the air mass in Xi’an during the heavy O3 pollution period was dominated by short-distance air flow, of which the short-range air flow in the northerly direction and the air flow in the southwest and northeast directions accounted for a large proportion.
(4) The analysis of the transport pathways and potential source during the heavy O3 pollution period in Xi’an shows that the O3 pollution in Xi’an was based on local sources and was superimposed on adjacent areas, such as the southwest of Northeast China, as well as the central part of Shaanxi Province, the southwest of Shanxi Province, and the northern part of Henan Province. A large number of O3 precursors were jointly polluted, and the main pollution areas were concentrated in the Fenwei Plain. It is necessary to strengthen regional joint prevention and control to effectively curb the occurrence of O3 pollution.
Author Contributions
Conceptualization, X.S.; investigation, X.S. and Y.H.; methodology, X.S. and Y.H.; data curation, X.S. and Y.H.; software, Y.H.; writing—original draft preparation, X.S.; writing—reviewing and editing, Y.H. All authors have read and agreed to the published version of the manuscript.
Funding
This research was funded by the National Natural Science Foundation of China (72104132), the Humanities and Social Science Fund of the Ministry of Education of China (21YJCZH136), and the Scientific and Technological Innovation Programs of Higher Education Institutions in Shanxi (STIP, 2020L0251).
Institutional Review Board Statement
Not applicable.
Informed Consent Statement
Not applicable.
Data Availability Statement
All data included in this study are available upon request by contact with the corresponding author.
Conflicts of Interest
The authors declare no conflict of interest.
References
- Fishman, J.; Grutzen, P.J. The origin of ozone in troposphere. Nature 1978, 274, 855–858. [Google Scholar] [CrossRef]
- Qi, B.; Niu, Y.W.; Du, R.G.; Yu, Z.F.; Ying, F.; Xu, H.H.; Hong, S.M.; Yang, H.Q. Characteristics of surface ozone concentration in urban site of Hangzhou. China Environ. Sci. 2017, 37, 443–451. (In Chinese) [Google Scholar]
- Huang, J.; Zhou, C.; Lee, X.; Bao, Y.; Zhao, X.; Fung, J.; Richter, A.; Liu, X.; Zheng, Y. The effects of rapid urbanization on the levels in tropospheric nitrogen dioxide and ozone over East China. Atmos. Environ. 2013, 77, 558–567. [Google Scholar] [CrossRef]
- Feng, Z.; Hu, E.; Wang, X.; Jiang, L.; Liu, X. Ground-level O3 pollution and its impacts on food crops in China: A review. Environ. Pollut. 2015, 199, 42–48. [Google Scholar] [CrossRef] [PubMed]
- Zhang, Y.; Cooper, O.R.; Gaudel, A.; Thompson, A.M.; Nedelec, P.; Ogino, S.-Y.; West, J. Tropospheric ozone change from 1980 to 2010 dominated by equatorward redistribution of emissions. Nat. Geosci. 2016, 9, 875–879. [Google Scholar] [CrossRef]
- Feng, Z.; Sun, J.; Wan, W.; Hu, E.; Calatayud, V. Evidence of widespread ozone-induced visible injury on plants in Beijing, China. Environ. Pollut. 2014, 193, 296–301. [Google Scholar] [CrossRef]
- Feng, Z.Z.; Li, P.; Yuan, X.Y.; Gao, F.; Jiang, L.; Dai, L. Progress in ecological and environmental effects of ground-level O3 in China. Atca Ecol. Sin. 2018, 38, 1530–1541. (In Chinese) [Google Scholar]
- Ministry of Ecology and Environment of the People’s Republic of China. Bulletin on the State of China’s Ecological Environment; Ministry of Ecology and Environment: Beijing, China, 2019; pp. 8–11.
- Wang, T.; Xue, L.; Brimblecombe, P.; Lam, Y.; Li, L.; Zhang, L. Ozone pollution in China: A review of concentrations, meteorological influences, chemical precursors, and effects. Sci. Total Environ. 2017, 575, 1582–1596. [Google Scholar] [CrossRef]
- Guo, X.T.; Song, H.Q.; Liang, L.K.; Liu, P.F. Spatial and temporal variations of ozone concentration in China during 2015–2017. Meteorol. Environ. Sci. 2020, 43, 41–50. (In Chinese) [Google Scholar]
- Xu, J.; Tie, X.; Gao, W.; Lin, Y.; Fu, Q. Measurement and model analyses of the ozone variation during 2006 to 2015 and its response to emission change in megacity Shanghai, China. Atmos. Chem. Phys. 2019, 19, 9017–9035. [Google Scholar] [CrossRef]
- Yin, C.; Deng, X.; Zou, Y.; Fabien, S.; Li, F.; Deng, T. Trend analysis of surface ozone at suburban Guangzhou, China. Sci. Total Environ. 2019, 695, 133880. [Google Scholar] [CrossRef]
- Ma, Z.; Xu, J.; Quan, W.; Zhang, Z.; Lin, W.; Xu, X. Significant increase of surface ozone at a rural site, north of eastern China. Atmos. Chem. Phys. 2016, 16, 3969–3977. [Google Scholar] [CrossRef]
- Yi, R.; Wang, Y.L.; Zhang, Y.J.; Shi, Y.; Li, S.M. Pollution characteristics and influence factors of ozone in Yangtze River Delta. Acta Sci. Circumstantiae 2015, 35, 2370–2377. (In Chinese) [Google Scholar]
- Hu, L.M.; Li, Y.X.; Shi, N.F.; Su, Y. Spatio-temporal change characteristics of ozone concentration in Beijing–Tianjin–Hebei region. Environ. Sci. Technol. 2019, 42, 39. (In Chinese) [Google Scholar]
- Chen, X.; Liu, Y.; Lai, A.; Han, S.; Fan, Q.; Wang, X.; Ling, Z.; Huang, F.; Fan, S. Factors dominating 3-dimensional ozone distribution during high tropospheric ozone period. Environ. Pollut. 2018, 232, 55–64. [Google Scholar] [CrossRef]
- He, Z.; Wang, X.; Ling, Z.; Zhao, J.; Guo, H.; Shao, M.; Wang, Z. Contributions of different anthropogenic volatile organic compound sources to ozone formation at a receptor site in the Pearl River Delta region and its policy implications. Atmos. Chem. Phys. 2019, 19, 8801–8816. [Google Scholar] [CrossRef]
- Chen, Z.; Li, R.; Chen, D.; Zhuang, Y.; Guo, B.; Yang, L.; Li, M. Understanding the causal influence of major meteorological factors on ground ozone concentrations across China. J. Clean. Prod. 2020, 242, 118498. [Google Scholar] [CrossRef]
- Wang, L.; Liu, R.; Han, G.; Wang, Y.; Qing, T.; Jiang, L. Study on the relationship between surface ozone concentrations and meteorological conditions in Nanjing, China. Acta Sci. Circumstantiae 2018, 38, 1285–1296. (In Chinese) [Google Scholar]
- Yu, Z.; Ma, J.; Mao, Z.; Cao, Y.; Qu, Y.; Xu, J. Study on the meteorological conditions and synoptic classifications of O3 pollution in Shanghai in 2017. J. Meteorol. Environ. 2019, 35, 46–54. (In Chinese) [Google Scholar] [CrossRef]
- Gu, Y.; Li, K.; Xu, J.; Liao, H.; Zhou, G. Observed dependence of surface ozone on increasing temperature in Shanghai, China. Atmos. Environ. 2020, 221, 117108. [Google Scholar] [CrossRef]
- Wang, Z.-S.; Li, Y.-T.; Aa, X.-X.; Li, Q.; Sun, N.D.; Wang, B.Y.; Pan, J.X. Variation of O3 concentration in different regions of Beijing from 2006–2015. Environ. Sci. 2018, 39, 1–8. (In Chinese) [Google Scholar]
- Zhao, W.; Gao, B.; Liu, M.; Lu, Q.; Ma, S.-X.; Sun, J.-R.; Chen, L.-G.; Fan, S.-J. Impact of Meteorological Factors on the Ozone Pollution in Hong Kong. Environ. Sci. 2019, 40, 55–66. (In Chinese) [Google Scholar]
- Sahu, S.K.; Liu, S.; Liu, S.; Ding, D.; Xing, J. Ozone pollution in China: Background and transboundary contributions to ozone concentration & related health effects across the country. Sci. Total Environ. 2021, 761, 144131. [Google Scholar] [PubMed]
- Dimitriou, K.; Kassomenos, P. Three year study of tropospheric ozone with back trajectories at a metropolitan and a medium scale urban area in Greece. Sci. Total Environ. 2015, 502, 493–501. [Google Scholar] [CrossRef] [PubMed]
- Sharma, A.; Mandal, T.K.; Sharma, S.K.; Shukla, D.K.; Singh, S. Relationships of surface ozone with its precursors, particulate matter and meteorology over Delhi. J. Atmos. Chem. 2017, 74, 451–474. [Google Scholar] [CrossRef]
- Zhang, G.; Xu, H.; Qi, B.; Du, R.; Gui, K.; Wang, H.; Jiang, W.; Liang, L.; Xu, W. Characterization of atmospheric trace gases and particulate matter in Hangzhou, China. Atmos. Chem. Phys. 2018, 18, 1705–1728. [Google Scholar] [CrossRef]
- Fu, C.B.; Dan, L.; Tang, J.X.; Tong, J.H. Potential source contribution and transported route analysis in Hainan Province during the ozone polluted episode in October, 2017. Res. Environ. Sci. 2021, 34, 863–871. (In Chinese) [Google Scholar]
- Xi’an Municipal Bureau of Statistics. Xi’an Statistical Yearbook; China Statistics Press: Beijing, China, 2020.
- Wang, Y.Q.; Zhang, X.Y.; Draxler, R.R. TrajStat: GIS-based software that uses various trajectory statistical analysis methods to identify potential sources from long-term air pollution measurement data. Environ. Modell. Softw. 2009, 24, 938–939. [Google Scholar] [CrossRef]
- John, K.; Karnae, S.; Crist, K.; Kim, M.; Kulkarni, A. Analysis of trace elements and ions in ambient fine particulate matter at three elementary schools in Ohio. J. Air Waste Manag. Assoc. 2012, 57, 394–406. [Google Scholar] [CrossRef]
- Cheng, M.D.; Hopke, P.K.; Barrie, L.; Rippe, A.; Olson, M.; Landsberger, S. Qualitative determination of source regions of aerosol in Canadian high arctic. Environ. Sci. Technol. 1993, 27, 2063–2071. [Google Scholar] [CrossRef]
- Hsu, Y.K.; Holsen, T.M.; Hopke, P.K. Comparison of hybrid receptor models to locate PCB sources in Chicago. Atmos. Environ. 2003, 37, 545–562. [Google Scholar] [CrossRef]
- Zhao, H.; Zheng, Y.; Li, C. Spatiotemporal distribution of PM2.5 and O3 and their interaction during the summer and winter seasons in Beijing, China. Sustainability 2018, 10, 4519. [Google Scholar] [CrossRef]
- Monks, P.S. A review of the observations and origins of the spring ozone maximum. Atmos. Environ. 2000, 34, 3545–3561. [Google Scholar] [CrossRef]
- Cao, W.T.; Wu, K.; Kang, P.; Wen, X.H.; Li, H.; Wang, Y.; Lu, X.Y.; Li, A.Q.; Pan, W.H.; Fan, W.B. Study on ozone pollution characteristics and meteorological cause of Chengdu–Chongqing urban agglomeration. Acta Sci. Circunstantiae 2018, 38, 1275–1284. (In Chinese) [Google Scholar]
- Song, X.; Hao, Y.; Zhang, C.; Peng, J.; Zhu, X. Vehicular emission trends in the Pan-Yangtze River Delta in China between 1999 and 2013. J. Clean. Prod. 2016, 137, 1045–1054. [Google Scholar] [CrossRef]
- Shao, P.; Xin, J.Y.; An, J.L.; Wang, J.X.; Wu, F.K.; Ji, D.S.; Wang, Y.S. An analysis on the relationship between ground-level ozone and particulate matter in an industrial area in the Yangtze River Delta during summer time. Chin. J. Atmos. Sci. 2017, 41, 618–628. (In Chinese) [Google Scholar]
- Pu, X.; Wang, T.J.; Huang, X.; Melas, D.; Zanis, P.; Papanastasiou, D.K.; Poupkou, A. Enhanced surface ozone during the heat wave of 2013 in Yangtze River Delta, China. Sci. Total Environ. 2017, 603–604, 807–816. [Google Scholar] [CrossRef]
- Li, K.; Chen, L.; Ying, F.; White, S.J.; Jang, C.; Xu, X.; Gao, X.; Hong, S.; Shen, J.; Azzi, M.; et al. Meteorological and chemical impacts on ozone formation: A case study in Hangzhou, China. Atmos. Res. 2017, 196, 40–52. [Google Scholar] [CrossRef]
- An, J.L.; Wang, Y.S.; Sun, Y. Assessment of ozone variations and meteorological effects in Beijing. Ecol. Environ. Sci. 2009, 18, 944–951. (In Chinese) [Google Scholar]
Publisher’s Note: MDPI stays neutral with regard to jurisdictional claims in published maps and institutional affiliations. |
© 2022 by the authors. Licensee MDPI, Basel, Switzerland. This article is an open access article distributed under the terms and conditions of the Creative Commons Attribution (CC BY) license (https://creativecommons.org/licenses/by/4.0/).