Article

The Characteristics of Net Anthropogenic Nitrogen and Phosphorus Inputs (NANI/NAPI) and TN/TP Export Fluxes in the Guangdong Section of the Pearl River (Zhujiang) Basin

1
Key Laboratory of Poyang Lake Environment and Resource Utilization, Ministry of Education, School of Resources & Environment, Nanchang University, Nanchang 330031, China
2
National Observation and Research Station of Coastal Ecological Environments in Macao, Macao Environmental Research Institute, Faculty of Innovation Engineering, Macau University of Science and Technology, Macao SAR 999078, China
3
Key Laboratory of Land Surface Pattern and Simulation, Institute of Geographical Sciences and Natural Resources Research, Chinese Academy of Sciences, Beijing 100101, China
4
Academy of Agricultural Planning and Engineering, MARA, Beijing 100125, China
*
Authors to whom correspondence should be addressed.
Sustainability 2022, 14(23), 16166; https://doi.org/10.3390/su142316166
Submission received: 3 November 2022 / Revised: 25 November 2022 / Accepted: 30 November 2022 / Published: 3 December 2022

Abstract

:
Human activities have greatly influenced the inputs and cycling pathways of nitrogen (N) and phosphorus (P), causing dramatic environmental problems in the Pearl River Basin. In this study, the characteristics of net anthropogenic nitrogen and phosphorus inputs (NANI/NAPI) were analyzed in the Guangdong section of the Pearl River Basin from 2016 to 2020. NANI showed a very slight decrease trend from (1.51 ± 0.09) × 104 to (1.36 ± 0.08) × 104 kg·N·km−2·yr−1, while the average intensity of NAPI was 3.8 × 10³ kg·P·km−2·yr−1. Both NANI and NAPI intensities were at high levels, resulting in the serious deterioration of water quality in the Pearl River Basin. Fertilizer input was the most important component for the intensities of NANI and NAPI, accounting for 38–42% and 53–56%. However, in the Pearl River Delta, the major components of NANI and NAPI were the human and animal consumption (food/feed) inputs and non-food net phosphorus input. The input of NANI and NAPI should be controlled for different areas, based on the differing driving forces, to alleviate the deterioration of water quality. This study of NANI and NAPI in the Pearl River Basin is one of the important prerequisites for clarifying the input and water quality, providing support for further effective control of nitrogen and phosphorus pollution in the Pearl River.

1. Introduction

Biochemical flows (nitrogen and phosphorus), together with climate change, land-system change, and biodiversity loss, have become the most noteworthy ecological problems in the world, exceeding the “Planetary Boundaries” [1]. These extensive biochemical flows lead to severe environmental problems in watersheds or oceans, such as eutrophication, algal blooms, and ocean acidification [2]. However, with economic development, population growth, and food demand, the use of chemicals containing nitrogen (N) and phosphorus (P) are rapidly increasing, leading to excessive N and P input in the watershed system [3]. Therefore, it is essential to identify the main sources of anthropogenic N and P inputs and take abatement actions to prevent the deterioration of water quality.
Reasonable and effective control measures need to make an inventory of the input intensity of each source. To accurately estimate the nutrient inputs and pathways, various models were used for cycling pathways, such as SWAT [4], MARINA [5], and HSPF [6]. In addition, the establishment of a pollutant input inventory, based on the mass balance method to calculate the input rates, was applied to large watersheds [7]. To assess the amount of nitrogen input caused by human activities in the watershed, the concept of net anthropogenic nitrogen input (NANI) was proposed by Howarth et al. in 1996 [8]. Compared with other models, the NANI model can more accurately predict nitrogen flux as a linear or index function of NANI, especially in less agricultural and more forested watersheds [9,10,11,12]. Based on the method of the NANI estimation model, net anthropogenic phosphorus input (NAPI) was expanded by Russell et al., adding the net flow input module of human activities in the basin, including the amount of fertilizer consumption, net phosphorus input of food/feed, and non-food phosphorus (mainly from detergents used by humans) [13]. In addition, the spatiotemporal distributions of NANI and NAPI have been calculated by studies, providing precise information for pollution control management for policymakers [14,15,16,17]. These NANI and NAPI intensity estimations, applied to all river basins, can assess the nitrogen and phosphorus inputs caused by human activities in the region and analyze their input sources and spatial and temporal distributions; this can effectively identify the regions and influencing factors with more nitrogen and phosphorus accumulation, and put forward management suggestions according to local conditions.
Guangdong province has the most developed economy and the highest population density in the Pearl River Basin of China, with high-density industrial and agricultural activities. A large number of industrial, agricultural, and other human activities has led to excessive N and P inputs, which are mainly responsible for environmental risk in the Pearl River Basin. Especially in the Pearl River Delta, nitrogen and phosphorus inputs are extremely high [7]. However, there are obvious differences between the Pearl River Delta and other regions, because agricultural activities are frequent in non-Pearl River Delta regions. The agricultural and industrial activities in the rapidly urbanizing basin have dramatically altered the nitrogen and phosphorus cycles compared to other areas. In this study, based on the NANI/NAPI estimation approach, we evaluated the NANI and NAPI intensities in the Guangdong section of the Pearl River Basin. Specifically, this study (a) calculates the NANI and NAPI in the Guangdong section of the Pearl River Basin from 2016 to 2020, (b) analyzes the temporal and spatial intensity of NANI and NAPI, especially between the Pearl River Delta and other regions, (c) analyzes the variation and driving force of NANI and NAPI, and (d) to explores the relationship between TN and TP flux, and NANI and NAPI.

2. Materials and Methods
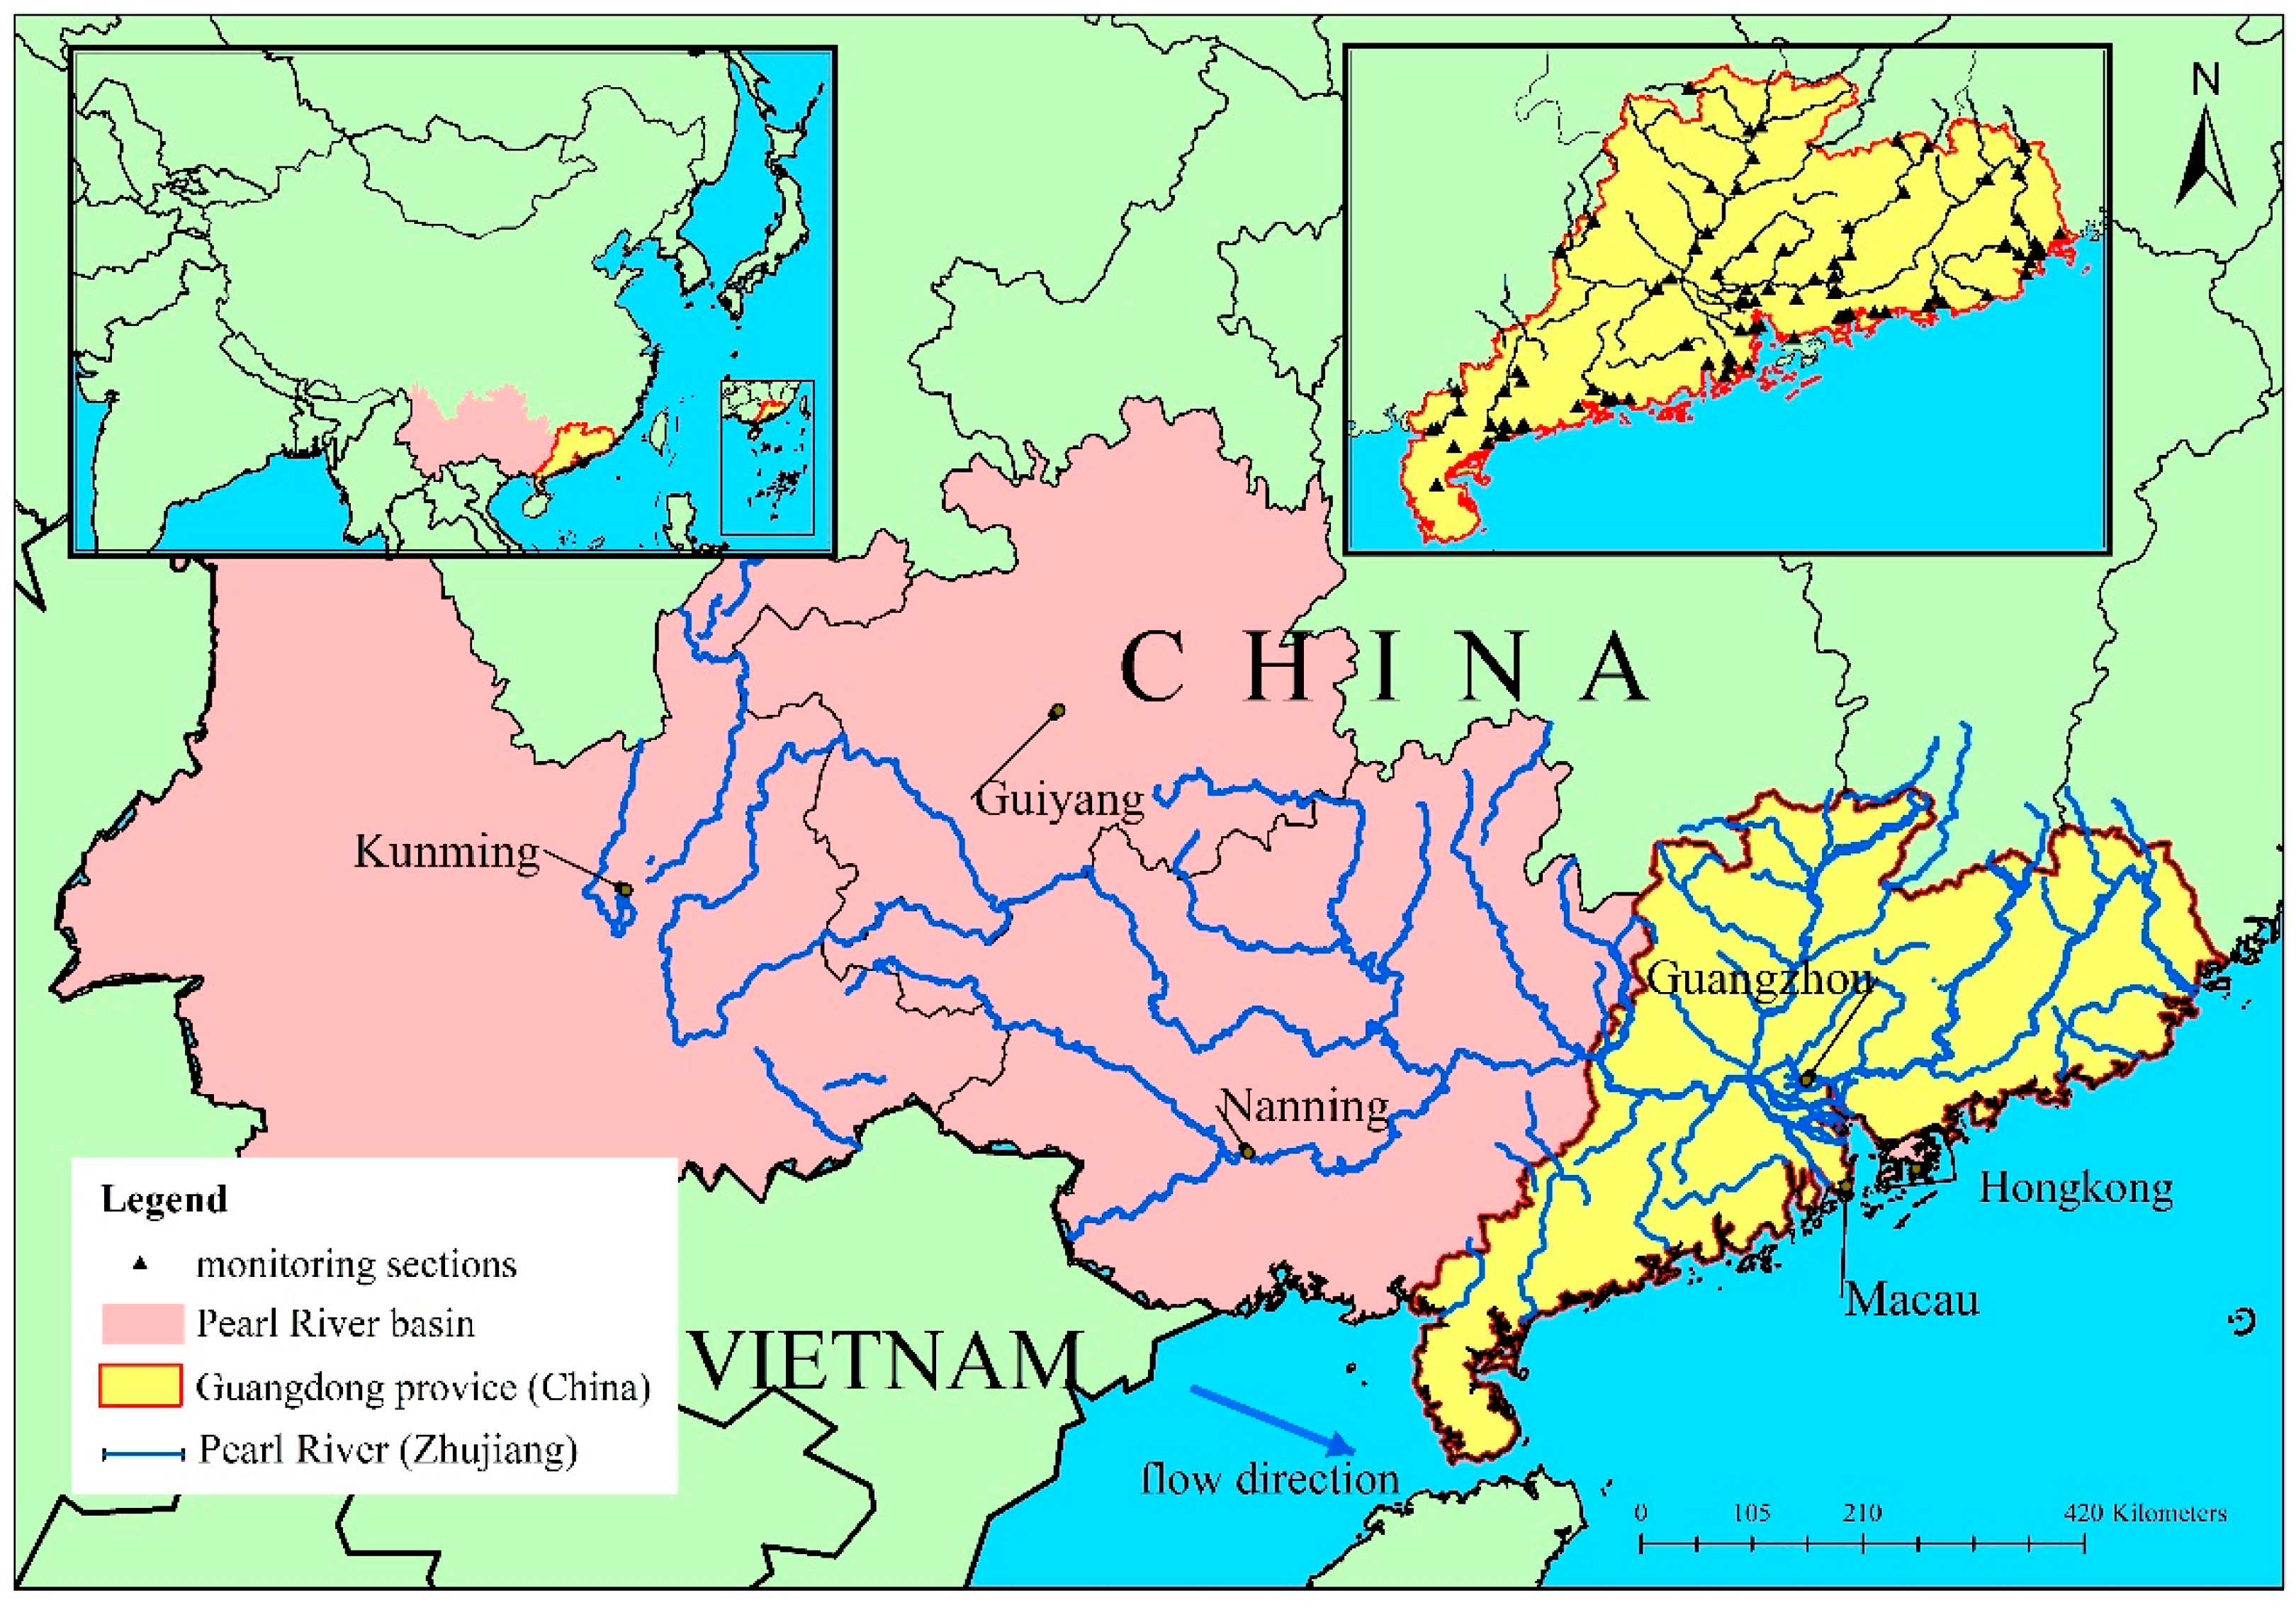
2.1. Study Area

The Pearl River, the second largest river and the third longest river in China with an annual runoff of more than 300 billion m3, is the most economically developed and densely populated region of China, and contributed 9.2% of the gross domestic product in 2016. In particular, the Guangdong section of the Pearl River Basin (21°13′–25°31′ N, 109°39′–117°19′ E) has the most developed economy and the highest population density. The downstream of the Pearl River overflows into a river network in Guangdong Province, converging in the Pearl River Delta network river area and finally flowing into the South China Sea. However, due to high-density industrial and agricultural activities, a large amount of N and P pollution has input in the Pearl River Basin, leading to the deterioration of water quality [18,19,20]. The poor-quality water has serious impacts on the acidification or eutrophication of the ecological environment of the basin, estuary, and oceans [21,22,23]. Therefore, Guangdong province was selected to calculate NAPI and NAPI intensities. The statistics and analysis of nitrogen and phosphorus input intensities were conducted in Guangdong Province and its 21 major cities, and the monitoring sections were selected in the drainage system of the Pearl River Basin, including West River, East River, North River, and various rivers on the Pearl River Delta (Figure 1).

2.2. Data Collection

To estimate NANI and NAPI intensities, the basic data used to calculate intensity included three categories: social data (population, land-use type), agricultural activities data (fertilizer application amount, agricultural product planting area and yield, and poultry stock), economic data (Gross Domestic Product—GDP, Gross Output Value of Agriculture—GOVA, and Gross Output Value of Industrial—GOVI. et al.). The data were obtained from Statistical Yearbook of Guangdong (2016–2020), Agricultural Statistical Yearbook of Guangdong (2016–2020) (http://stats.gd.gov.cn/gdtjnj/index.html (accessed on 5 May 2022), the National Bureau of Statistics (http://www.stats.gov.cn/ (accessed on 13 May 2022)), China Yearbook Online Publishing Repository (https://kns.cnki.net/kns8?dbcode=CYFD (accessed on 15 June 2022)), and China’s economic and social big data research platform (https://data.cnki.net/ (accessed on 5 April 2022)).
To evaluate the quality and flux of nitrogen and phosphorus in the Pearl River Basin, the water quality data for 2016–2020 from 96 monitoring sections of the Pearl River Basin in Guangdong were collected from the automatic water quality monitoring platform of the China General Environmental Monitoring Station (www.cnemc.cn (accessed on 12 July 2022)) (Figure 1). The data were the monthly average data of monitoring sections. The data were filtered to eliminate the extreme values and then the missing points were completed by using the spatial interpolation of inverse distance weighting (IDW) and the Kriging method in GIS (ArcGIS 10.5) [24,25].

2.3. The Flux Calculation

The fluxes of nitrogen and phosphorus are obtained via the product of average period concentration and average period flow, showing the period averaging method.
W = T F ( t ) d t = T Q ( t ) C ( t ) d t
W = K i = 1 n C i Q i i = 1 n Q i Q r ¯
where W is the flux of nutrient elements in the Pearl River; Q(t) is the function of the period, and C(t) is the function of the period; Qi is the instantaneous runoff flux; Ci is the instantaneous concentration of the nutrient element; K is adjustable constant; Q r ¯ is the monthly average runoff flux.

2.4. Calculation of NANI and NAPI

Net anthropogenic nitrogen and phosphorus inputs are accounting methods for controlling the input intensities of nitrogen and phosphorus sources in watershed human activities, generally including 6 parts: (a) atmospheric deposition, (b) fertilizer input, (c) seeding input, (d) agricultural fixation, (e) human and animal consumption (food/feed) inputs, and (f) other input (the non-food inputs of N and P by rural residents), which represents the input of exogenous nitrogen and phosphorus in the basin caused by human activities. The calculations are as follows:
NANI = Ndep + Nfer + Nseed + Nfix + Nim
NAPI = Pdep + Pfer + Pseed + Pnon + Pim
where Ndep and Pdep are atmospheric depositions; Nfer and Pfer are chemical fertilizer inputs; Nseed and Pseed are the seeds input intensity of each crop; Nim and Pim are the net food and feed inputs of N and P; Nfix is the agricultural fixation by crops, while Pnon is the non-food inputs of P by rural residents (such as the P-based detergents used for household cleaning). All the units are kg·km−2·yr−1.
(1) Calculation of atmospheric deposition
To accurately estimate atmospheric nitrogen deposition in the Pearl River Basin, the literature on nitrogen dry and wet deposition from 2016 to 2020 was comprehensively gathered. The data were from scientific databases, including the CNKI database, WanFang database, ISI Web of Science, Google Scholar, and Science Direct databases, listed in Table 1. In the Pearl River and nationwide Pearl River Basin, the atmospheric nitrogen deposition presents a stable trend, with an approximate decrease from 2016 to 2020 [26]. The average atmospheric total nitrogen deposition was 3567 kg·km−2·yr−1, mainly including NOx, NHy, and organic nitrogen (ON). The rate of NHy and NOx were approximately 1.1–1.3 [27,28]. NOx and ON were derived from fuel combustion sources, dust, and vehicle input [29,30,31]. However, NHy was derived from agricultural activities, such as animal husbandry and agricultural fertilization, accounting for more than 80% [32,33,34,35], and just a little from vehicle inputs [36,37]. Therefore, to avoid duplicate calculations with agricultural sources, 80% of NHy deposition was subtracted from the atmospheric nitrogen deposition calculation. Based on the comprehensive literature, the atmospheric nitrogen deposition rate (Ndep) in the Pearl River Basin was determined as 2.4 × 10³ kg·N·km−2·yr−1.
For atmospheric phosphorus deposition, it can be almost limited. Based on Pan et al., the global P deposition was ~100 kg·P·km−2·yr−1 covering the years 1954 to 2020, and P atmospheric deposition in Asia was slightly higher than that in Europe [38]. Therefore, according to Ma et al. and Zhang et al., the phosphorus deposition rates (Pdep) in the Pearl River Basin was 92 kg·P·km−2·yr−1 from 2016 to 2018 and 108 kg·P·km−2·yr−1 from 2019 to 2020 [39,40].
Table 1. Atmospheric nitrogen deposition observation in the Pearl River Basin.
TimeNHy
(kg·km−2·yr−1)
NOx
(kg·km−2·yr−1)
Organic Nitrogen
(kg·km−2·yr−1)
Total
(kg·km−2·yr−1)
Ref
2016–2018590–1780 (w)
410–670 (d)
520–940 (w)
300–720 (d)
520–147 (w)
270–670 (d)
urban 3980 (b),
rural 3380 (b),
forest sites 5200 (b)
[41]
2008–2017PRD region 2210 ± 140 (a, b),
non-PRD region 1850 ± 140 (a, b)
PRD region 1850 ± 190, (a, b)
non-PRD region 980 ± 90 (a, b)
/PRD region 4060 ± 280 (a, b),
non-PRD region 2830 ± 210 (a, b)
[42]
2010–2014334 (d)540 (d)116 (d)/[43]
2014–2016400 (a)1300 (a)//[44]
2010–2017150–1890 (w)140–1840 (w)/520–3730 (w)[27]
2016–20181560 (w)880 (w)1122 (w)/[45]
2010–2017urban 1795 (a, b)
natural site 1140 (a, b)
urban 1509 (a, b)
natural site 912 (a, b)
/urban 3304 ± 952 (a, b)
natural site 2052 ± 1022 (a, b)
[28]
2018–2019/1800 (b)//[46]
Note: a is obtained by the chemical composition of precipitation; b by mixed deposition; d by dry deposition; w by wet deposition.
(2) Calculation of fertilizer input
The fertilizers required for agricultural activities included chemical fertilizers and organic fertilizers. Since organic fertilizer mainly comes from the interior of the region and is not an external nitrogen source input, only chemical fertilizer was considered in fertilizer input. The input amount of nitrogen fertilizer (Nfer) was derived from chemical N (ammonium nitrate, ammonium bicarbonate, urea-N, etc.) and combined fertilizers with N content of 12.8% [12]. Similarly, the input amount of phosphorus fertilizer (Pfer) was derived from chemical P and combined fertilizers with P content of 15.0% [14].
(3) Calculation of seeds input intensity of each crop
The content of seed was also an input for agricultural budgets. Wheat, rice, yam, soybeans, vegetables, and peanuts were considered to estimate seed nitrogen and phosphorus inputs, which were the major agricultural plants in the Pearl River Basin [7]. The estimation of Nseed and Pseed was based on the area of cultivated land in the Pearl River Basin, multiplied by the input of nitrogen and phosphorus per unit area of the seed of each crop, with the different correlation coefficients shown in Table 2.
(4) Calculation of agricultural fixation
Some crops have the quality of nitrogen fixation, which is an important source of nitrogen input in the Pearl River Basin. On the contrary, there is no phosphorus fixation. Therefore, Nfix was calculated via multiplying each N-fixing crop area by its N fixation rate, as shown in Table 3.
(5) Calculation of net food and feed inputs of N and P
Net food and feed nitrogen and phosphorus inputs refer to the quality balance between the N and P outputs of livestock and crops and the N and P consumptions of humans and livestock, calculated by subtracting the content of nitrogen and phosphorus in livestock products and crop products from the consumption of nitrogen and phosphorus in human food and livestock feed:
Nim and Pim = HC + LC − (CP − CPL) − (LP − LPL)
where HC and LC were the consumption of nitrogen and phosphorus by humans and livestock, respectively. CP was the nitrogen output of crop products, while CPL was the nitrogen loss of crop products due to corruption; similarly, LP was the nitrogen output of livestock products, and LPL was the nitrogen loss due to corruption and inedibility of livestock products. The different correlation coefficients were shown in Table 4, and the loss due to corruption and inedibility was calculated as 10% of the total. When the production of food and feed in the Pearl River Basin was not enough to meet the needs of humans and animals, the result is positive and needs to be input, i.e., net food and feed inputs of Nim and Pim, and vice versa.
(6) Calculation of the non-food input
Due to the economic development and population density increase in the Pearl River Basin, non-food net phosphorus input (Pnon) was also one of the important sources of NAPI. Pnon mainly comes from detergents used in people’s daily life. Pnon was calculated by multiplying the total number of study units by the per capita non-food phosphorus input coefficient (0.63 kg·P·ind−1·yr−1) [20].

2.5. Uncertainty Analysis

To gain insight into the uncertainty of NANI and NAPI estimates, an uncertainty analysis was performed using the Monte Carlo simulation. Due to the regional characteristics of N and content input intensity of nitrogen and phosphorus sources, it was assumed that all the coefficients of NANI and NAPI calculation models approximately follow a normal distribution with a coefficient of variation of 30% [18]. A total of 10,000 Monte Carlo simulations were performed to obtain the mean and 95% confidence interval.

2.6. Grey Relational Analysis

Grey relational analysis is one of the grey system theories of the geometric proximity between different discrete sequences, to solve certain problems for solving the complicated interrelationships among the multiple performance characteristics [48,49]. The grey relational degree, which is viewed as a measure of the similarities of discrete data that may be ordered in a sequential sequence, is used to characterize closeness, i.e., the higher grey relational degree has a higher relationship [50]. Furthermore, grey relational analysis has also been used in amounts of studies evaluating environmental water quality and the impact of socioeconomic factors [7,50,51,52]. To analyze the impact of socioeconomic factors, grey relational grade analysis was conducted between NANI and NAPI intensities and the socioeconomic factors, such as Gross Domestic Product (GDP), Gross Agricultural Output Value (GAOV), N Fertilizer (NF), P Fertilizer (PF), Population Density (PD), and Urbanization Rate (UR).

3. Results and Discussion

3.1. Temporal and Spatial of NANI and NAPI

The temporal and spatial changes of NANI in the Guangdong section of the Pearl River Basin from 2016 to 2020 are shown in Figure 2 and Figure 3. On the spatial scale, it exhibited obvious regional distribution, the areas being the southwest coast (Zhanjiang, Maoming), eastern coast (Shantou, Jieyang), northern region (Shaoguan, Qingyuan, Heyuan), and the Pearl River Delta. The intensity of NANI in the Pearl River Basin was higher in the Pearl River Delta and coastal (southwest and eastern) regions than that in the northern region (Figure 2). The highest area was the Pearl River Delta, with an average NANI intensity of (2.2–2.3) × 104 kg·N·km−2·yr−1 from 2016 to 2020. In particular, Shenzhen, the most developed city with the highest population density, had a NANI intensity of (4.1–4.9) × 104 kg·N·km−2·yr−1. The intensity of NANI in the northern region was the lowest, with an average intensity NANI of (8.1–9.4) × 103 kg·N·km−2·yr−1 from 2016 to 2020. On the temporal scale, the NANI intensity of Shenzhen continued to increase, while all other cities showed a slight trend of decreasing or maintaining NANI intensities from 2016 to 2020. This decreasing or maintaining trend began in 2012, with a decrease in chemical product consumption [7]. The temporal and spatial changes of NAPI were similar to NANI, which also presents higher in the Pearl River Delta and coastal regions than that in the northern region (Figure 3). Unlike NANI, on the temporal scale, NAPI remained stable from 2016 to 2020. The unbalanced population distribution and uneven economic growth across the sub-basins were connected to the temporal and geographical disparities in the distribution of NANI and NAPI intensities across the Guangdong region of the Pearl River Basin [53,54]. This spatial pattern of NANI and NAPI was similar to other basins or watersheds in the world [10].
The temporal and spatial changes of nutrient element concentrations had similar patterns compared with NANI and NAPI intensities, which were higher in the Pearl River Delta and coastal regions than that in the northern region (Figure 2 and Figure 3). It indicated that NANI and NAPI had a positively correlated influence on the N and P concentration in the Pearl River. The concentration of TN and TP had different pollution degrees and patterns; these showed that that TN was exceeding the standard across of basin, while the water quality of the Pearl River was fine for phosphorus. High intensities of NANI and NAPI had a very serious impact on the water quality of the Pearl River. The average concentration of TN in the Guangdong section of The Pearl River were 2.65, 2.96, 2.86, 2.40, and 2.31 mg·L−1 from 2016 to 2020, respectively, and the average concentration of TP was 0.15, 0.17, 0.16, 0.15, and 0.08 mg·L−1 from 2016 to 2020, respectively. As shown in Figure 4, poor quality water sections for TN were 52%, 55%, 50%, 39%, and 47% from 2016 to 2020, respectively, based on the Quality Standard and Limit of Surface Water Environment of China (GB3838-2002). As for phosphorus, the poor quality water sections at the source of drinking water were 83%, 86%, 87%, and 94% from 2016 to 2020, respectively, which had been alleviated in 2020. In addition, there was a difference between nutrient element concentrations and NANI and NAPI intensities on the spatial scale, which was evident in the two cities on the west bank of the Pearl River Estuary, i.e., Zhuhai and Zhongshan. Since the population density and agricultural activities of these two cities are not very high, the calculation of NANI and NAPI showed low intensity. The TN and TP in the Pearl River Estuary converged the pollution from upstream, showing a higher TN and TP concentration distribution [18,20]. Therefore, the high intensity of NANI led to serious TN pollution in the Pearl River Basin of Guangdong Province, carrying great risks, especially in the Pearl River Delta region. Similarly, the Pearl River Delta region exhibited TP pollution by NAPI. The water quality deterioration had a very adverse impact on the ecological environment and domestic water safety of the Pearl River Basin.

3.2. NANI and NAPI and the Driving Force

The annual changes in NANI and NAPI intensities in the Guangdong section of the Pearl River Basin from 2016 to 2020 are shown in Figure 5. The intensities of NANI and NAPI tend to be stable. NANI showed a very slight trend of decrease from (1.51 ± 0.09) × 104 kg·N·km−2·yr−1 to (1.36 ± 0.08) × 104 kg·N·km−2·yr−1, however, that was much higher than the Chinese average (3791 kg·N·km−2·yr−1) [15]. Compared with N, the intensity of NAPI remained stable, and the average intensity of NAPI in the Guangdong section of the Pearl River Basin was 3.8 × 10³ kg·P·km−2·yr−1, but still at a moderate level compared with other watersheds (Figure 5b) [14,17]. In the Guangdong section of the Pearl River Basin, fertilizer input was the most important component for the intensities of NANI and NAPI, accounting for 38.0–42.3% and 53.1–56.1%, respectively. The human and animal consumption (food/feed) inputs were the second dominating contributor of NANI, accounting for 31.4–33.2% and the non-food net phosphorus input was the second dominating contributor of NAPI, accounting for 27.8–30.2%. Similarly, there were regional differences in the driving force of NANI and NAPI. In the Pearl River Delta, economically developed and densely populated, human food and animal feed are the main components [7]. However, the components of NANI and NAPI had strong regional deviations. For instance, the major component of NANI in Shenzhen, the core city of the Pearl River Delta region, was the human and animal consumption (food/feed) inputs, accounting for 83–92%. The major components of NAPI in Shenzhen were the net food and feed inputs, and the non-food inputs, accounting for 35–43% and 45–53%, respectively. Shenzhen requires many food imports due to extremely high population density (8828 person·km−2 in 2020) and almost no agricultural activities. On the contrary, in the northern region of the Pearl River Basin, fertilizer input was the most important component for the intensities of NANI and NAPI, due to intensive agricultural activities. For example, fertilizer input accounted for 43–54% of NANI intensity, and 66–75% of NAPI intensity in Heyuan.
To analyze regional differences, grey relational grade analysis was conducted between NANI and NAPI intensities and the socioeconomic factors [7,52]. From the perspective of the whole Guangdong Province, the grey relational grade analysis showed that the primary factor in changing NANI and NAPI intensities was the Gross Agricultural Output Value in the Guangdong section of the Pearl River Basin, with relational grades of 0.914 and 0.923 for NANI and NAPI, respectively (Table 5). Fertilizers N and P also had a high grey correlation with the inputs of NANI and NAPI. Although Guangdong Province has a developed economy, high population density, and high urbanization rate, its NANI and NAPI mainly come from agricultural non-point source emissions. Therefore, agricultural activities were still the main factor for NANI and NAPI intensities in Guangdong Province. However, there were regional differences within Guangdong Province, i.e., the Pearl River Delta and non-Pearl River Delta region. In urbanized areas of the Pearl River Delta region, the industrial and agricultural structure changed rapidly, and intensive fertilizer application was no longer the primary cause of NANI and NAPI. In the Pearl River Delta, the population density and urbanization rate can explain the sources of NANI and NAPI, with higher grey relational grades. However, this tight correlation was lost in the non-Pearl River Delta region and had been replaced by the Fertilizers N and P, directly reflecting high-density agricultural activities rather than GAOV. The primary input components of NANI and NAPI upstream of Pearl River were mostly caused by agricultural systems as fertilizer (>40% NANI, >60% NAPI). The Pearl River Delta Basin’s fertilizer input intensities for N and P were not high, because of a lower amount of agricultural land (only 15%) [7]. This discrepancy results from the different rates of urbanization and growth of the population. To meet the demand for nitrogen and phosphorus consumption, due to the high urbanization rate of cities, there might be an increase in agricultural activities in surrounding cities and increase the budget of N and P [55,56].

3.3. Riverine Fluxes and Linking Basin NAPI and NAPI Budget

To explore the relationship between the transportation of the nutrient elements and NANI and NAPI in the Guangdong section of the Pearl River Basin, the temporal and spatial changes of the TN and TP fluxes were plotted on a thematic map, as shown in Figure 6 and Figure 7. Both the TN and TP fluxes were significantly larger in the Pearl River Estuary than those in the upstream monitoring sections, and obviously, it was clear that the fluxes of TN and TP increased from upstream to downstream of the Pearl River Basin. Similar to the temporal and spatial changes of the NANI and NAPI intensities, the TN and TP fluxes were higher in the Pearl River Delta and coastal regions than that in the northern region. It might indicate that the fluxes of nutrient elements in the Pearl River Basin were accumulating throughout the basin. The average TN flux of each monitoring section was 6.4 × 10⁵, 7.4 × 10⁵, 7.0 × 10⁵, 6.6 × 10⁵, and 3.2 × 10⁵ t·yr−1 from 2016 to 2020, respectively. As for TP, the average TN flux was 3.7 × 10³, 4.2 × 10³, 4.4 × 10³, 3.8 × 10³, and 1.3 × 10³ t·yr−1, from 2016 to 2020, respectively. The fluxes of TN and TP were decreased compared with previous studies, but they were still at a high level and had adverse effects on the marine ecological environment [17,57,58].
The estimation methods of NANI and NAPI intensities were calculated by the coefficient of each pollution source from scientific databases, references, field scale measurement, small watershed monitoring, and model inversion, which existed for regional deviation. To better estimate the NANI and NAPI intensities in different regions, water quality monitoring, and sewage discharge were used for comprehensive evaluation. The riverine TN and TP fluxes were significantly correlated with NANI and NAPI via nonlinear correlation, which was tightly linked to human activities [16,59]. A multivariate regression model for predicting the TN and TP output fluxes ([FN, kg·N·km−2·yr−1] and ([FP, kg·N·km−2·yr−1]) with flow Q (1010 m3/yr), and NANI or NAPI in the Guangdong section of the Pearl River Basin, was constructed. According to the simulation accuracy index (R2), the model formed of various combinations of the variables was compared and selected, and the following optimal multiple regression model forms were selected:
FN = 4913 × Q1.22 × [exp(1.12 × 10⁻⁴× NANI)] (R2 = 0.92, MRSE = 2800)
FP = 186 × Q0.73 × [exp(4.46 × 10⁻⁴× NAPI)] (R2 = 0.78, MRSE = 129)
The above models accounted for 92% and 78% of the variation in annual TN and TP fluxes. This model’s output showed that, in comparison to individual variables, the combined effect of NANI and water discharge may better explain the interannual variations in riverine TN and TP export from the Pearl River Basin. The TN and TP fluxed accounted for 0.49–45.3% and 0.62–24.8% of NANI and NAPI in all cities, respectively, except Zhuhai and Zhongshan. Howarth et al. also found that 20–25% of the total nitrogen input from human activities in the watershed finally enters the water body, and 75–80% of the nitrogen was stored in the terrestrial ecosystem or enters the atmosphere [8]. By comparing the relevant research results of NANI in various regions, Swaney et al. proved the relationship between the input of human nitrogen into rivers and the output of nitrogen to coastal waters, indicating that rivers usually export 15–30% of NANI to coastal waters. This indicates that the nitrogen input into the basin by human activities is the main nitrogen source in most of the world’s watersheds and coastal waters [11]. Therefore, the high intensities of NANI and NAPI might cause N and P to remain in the sediment, which will increase the N and P input load into the ocean. This N and P might accumulate long after inputs and continue to be released, by balance calculation of input and output flux, over the past 30–70 years [60]. Strengthening the collaborative management of NANI and NAPI and residual N and P is the key to effectively controlling nitrogen and phosphorus pollution in the Pearl River.

3.4. Ecological and Management Implications

The riverine TN and TP fluxes were significantly correlated with NANI and NAPI via nonlinear correlation. Therefore, the input of NANI and NAPI should be controlled based on the driving force, to alleviate the deterioration of water quality and its impact on the oceans. The majority of environmental management studies on regulating N and P in intensive agriculture systems were geared toward reducing pollution in river basins [7]. However, it is necessary to consider the NANI and NAPI input of regional heterogeneity. Human food and animal feed were the most important contributors of NANI and NAPI in the Pearl River Delta, while fertilizers N and P were the most important contributors in the non-Pearl River Delta region. Therefore, the investigation of pollutant sources and the implementation of source-control policies is indispensable. According to the contributors of NANI and NAPI of regions in the Guangdong Province, the management and control measures of N and P can be established in agricultural activities and personal consumption habits. In the Pearl River Delta, the reduction in the consumption of food N and P would benefit from actions taken to build a more sustainable social and environmental food system. In the non-Pearl River Delta region, measures such as precision fertilization should be taken to improve the fertilizer utilization rate and reduce fertilizer N and P usage. In addition, intensive water treatment facilities are required to improve discharge efficiency, to improve the water quality of the Pearl River Basin.

4. Conclusions

The data of average riverine nitrogen and phosphorus fluxes and net anthropogenic inputs of nitrogen and phosphorus from 2016 to 2020 in the Guangdong section of the Pearl River Basin were summarized and analyzed, in order to further effectively control nitrogen and phosphorus problems in the Pearl River. It provided a better understanding of anthropogenic inputs of N and P by the calculation of NANI and NAPI in the Guangdong section of Pearl River, where the intensities of NANI and NAPI were still higher than levels in China. The driving force of the intensity of NANI and NAPI in the Pearl River Basin was different from Pearl River Delta, coastal and northern regions. Agricultural activities were still the primary factor in changing NANI and NAPI intensities, however, the consumption of food/feed N and P had changed the main contributor in the Pearl River Delta due to rapid population growth and urban development. The high intensities of NANI and NAPI caused the Pearl River to deteriorate in water quality, which made ~50% of the Pearl River seriously substandard. Strengthening the collaborative management of NANI and NAPI is, therefore, the key to effectively controlling nitrogen and phosphorus pollution in the Pearl River.

Author Contributions

Conceptualization, Y.W. and X.Z.; methodology, Y.B. and Y.W.; software, C.S. and Y.W.; validation, Y.B., X.Z. and Y.W.; investigation, J.Q.; data curation, Y.B. and L.W.; writing—original draft preparation, Y.B. and Y.W.; writing—review and editing, Y.B., X.Z. and Y.W.; funding acquisition, Y.W. All authors have read and agreed to the published version of the manuscript.

Funding

This work was supported by The Science and Technology Development Fund, Macau SAR [0023/2021/A], [0159/2019/A3].

Institutional Review Board Statement

Not applicable.

Informed Consent Statement

Not applicable.

Data Availability Statement

No report data.

Conflicts of Interest

The authors declare no conflict of interest.

References

  1. Steffen, W.; Richardson, K.; Rockstrom, J.; Cornell, S.E.; Fetzer, I.; Bennett, E.M.; Biggs, R.; Carpenter, S.R.; de Vries, W.; de Wit, C.A.; et al. Planetary boundaries: Guiding human development on a changing planet. Science 2015, 347, 1259855. [Google Scholar] [CrossRef] [PubMed] [Green Version]
  2. Galloway, J.N.; Schlesinger, W.H.; Levy, H.; Michaels, A.; Schnoor, J.L. Nitrogen fixation: Anthropogenic enhancement-environmental response. Glob. Biogeochem. Cycles 1995, 9, 235–252. [Google Scholar] [CrossRef] [Green Version]
  3. Wan, S.-Z.; Chen, F.-S.; Hu, X.-F.; Zhang, Y.; Fang, X.-M. Urbanization aggravates imbalances in the active C, N and P pools of terrestrial ecosystems. Glob. Ecol. Conserv. 2020, 21, e00831. [Google Scholar] [CrossRef]
  4. Paul, S.; Cashman, M.; Szura, K.; Pradhanang, S. Assessment of Nitrogen Inputs into Hunt River by Onsite Wastewater Treatment Systems via SWAT Simulation. Water 2017, 9, 610. [Google Scholar] [CrossRef] [Green Version]
  5. Strokal, M.; Kroeze, C.; Wang, M.; Bai, Z.; Ma, L. The MARINA model (Model to Assess River Inputs of Nutrients to seAs): Model description and results for China. Sci. Total Environ. 2016, 562, 869–888. [Google Scholar] [CrossRef] [Green Version]
  6. Chen, D.; Dahlgren, R.A.; Lu, J. A modified load apportionment model for identifying point and diffuse source nutrient inputs to rivers from stream monitoring data. J. Hydrol. 2013, 501, 25–34. [Google Scholar] [CrossRef] [Green Version]
  7. Mao, Y.; Zhang, H.; Tang, W.; Zhao, J.; Wang, Z.; Fan, A. Net anthropogenic nitrogen and phosphorus inputs in Pearl River Delta region (2008–2016). J. Environ. Manag. 2021, 282, 111952. [Google Scholar] [CrossRef]
  8. Howarth, R.W.; Swaney, D.P.; Boyer, E.W.; Marino, R.; Jaworski, N.; Goodale, C. The influence of climate on average nitrogen export from large watersheds in the Northeastern United States. Biogeochemistry 2006, 79, 163–186. [Google Scholar] [CrossRef]
  9. Alexander, R.B.; Johnes, P.J.; Boyer, E.W.; Smith, R.A. A comparison of models for estimating the riverine export of nitrogen from large watersheds. Biogeochemistry 2002, 57, 295–339. [Google Scholar] [CrossRef]
  10. Chen, F.; Hou, L.; Liu, M.; Zheng, Y.; Yin, G.; Lin, X.; Li, X.; Zong, H.; Deng, F.; Gao, J.; et al. Net anthropogenic nitrogen inputs (NANI) into the Yangtze River basin and the relationship with riverine nitrogen export. J. Geophys. Res. Biogeosci. 2016, 121, 451–465. [Google Scholar] [CrossRef]
  11. Swaney, D.P.; Hong, B.; Ti, C.; Howarth, R.W.; Humborg, C. Net anthropogenic nitrogen inputs to watersheds and riverine N export to coastal waters: A brief overview. Curr. Opin. Environ. Sustain. 2012, 4, 203–211. [Google Scholar] [CrossRef]
  12. Chen, D.; Hu, M.; Guo, Y.; Dahlgren, R.A. Modeling forest/agricultural and residential nitrogen budgets and riverine export dynamics in catchments with contrasting anthropogenic impacts in eastern China between 1980–2010. Agric. Ecosyst. Environ. 2016, 221, 145–155. [Google Scholar] [CrossRef] [Green Version]
  13. Russell, M.J.; Weller, D.E.; Jordan, T.E.; Sigwart, K.J.; Sullivan, K.J. Net anthropogenic phosphorus inputs: Spatial and temporal variability in the Chesapeake Bay region. Biogeochemistry 2008, 88, 285–304. [Google Scholar] [CrossRef]
  14. Han, Y.; Yu, X.; Wang, X.; Wang, Y.; Tian, J.; Xu, L.; Wang, C. Net anthropogenic phosphorus inputs (NAPI) index application in Mainland China. Chemosphere 2013, 90, 329–337. [Google Scholar] [CrossRef]
  15. Han, Y.; Fan, Y.; Yang, P.; Wang, X.; Wang, Y.; Tian, J.; Xu, L.; Wang, C. Net anthropogenic nitrogen inputs (NANI) index application in Mainland China. Geoderma 2014, 213, 87–94. [Google Scholar] [CrossRef]
  16. Hong, B.; Swaney, D.P.; Howarth, R.W. Estimating net anthropogenic nitrogen inputs to U.S. watersheds: Comparison of methodologies. Environ. Sci. Technol. 2013, 47, 5199–5207. [Google Scholar] [CrossRef]
  17. Wang, Y.; Xie, X.; Liu, C.; Wang, Y.; Li, M. Variation of net anthropogenic phosphorus inputs (NAPI) and riverine phosphorus fluxes in seven major river basins in China. Sci. Total Environ. 2020, 742, 140514. [Google Scholar] [CrossRef]
  18. Zhao, Y.; Song, Y.; Cui, J.; Gan, S.; Yang, X.; Wu, R.; Guo, P. Assessment of Water Quality Evolution in the Pearl River Estuary (South Guangzhou) from 2008 to 2017. Water 2020, 12, 59. [Google Scholar] [CrossRef] [Green Version]
  19. Niu, L.; Luo, X.; Hu, S.; Liu, F.; Cai, H.; Ren, L.; Ou, S.; Zeng, D.; Yang, Q. Impact of anthropogenic forcing on the environmental controls of phytoplankton dynamics between 1974 and 2017 in the Pearl River estuary, China. Ecol. Indic. 2020, 116, 106484. [Google Scholar] [CrossRef]
  20. Wu, Y.; Sun, C.; Zhang, X.; Wang, L.; Bai, Y.; Zhang, P. Spatio-Temporal Patterns and the Fluxes of Regional Nutrient Pollution in the Pearl River Basin, China. Pol. J. Environ. Stud. 2022, 31, 4371–4382. [Google Scholar] [CrossRef]
  21. Yu, J.; Ho, W.-T.; Lu, H.-M.; Yang, Y.-F. Study on water quality and genotoxicity of surface microlayer and subsurface water in Guangzhou section of Pearl River. Environ. Monit. Assess. 2011, 174, 681–692. [Google Scholar] [CrossRef] [PubMed]
  22. Wei, P.; Huang, L. Water quality and eutrophication in the Guangzhou Sea Zone of the Pearl River estuary. Chin. J. Oceanol. Limnol. 2010, 28, 113–121. [Google Scholar] [CrossRef]
  23. Liu, J.; Du, J.; Wu, Y.; Liu, S. Nutrient input through submarine groundwater discharge in two major Chinese estuaries: The Pearl River Estuary and the Changjiang River Estuary. Estuarine Coast. Shelf Sci. 2018, 203, 17–28. [Google Scholar] [CrossRef]
  24. Ishida, T.; Uehara, Y.; Iwata, T.; Cid-Andres, A.P.; Asano, S.; Ikeya, T.; Osaka, K.; Ide, J.; Privaldos, O.L.A.; Jesus, I.B.B.; et al. Identification of Phosphorus Sources in a Watershed Using a Phosphate Oxygen Isoscape Approach. Environ. Sci. Technol. 2019, 53, 4707–4716. [Google Scholar] [CrossRef] [PubMed]
  25. Jia, Z.; Li, S.; Liu, Q.; Jiang, F.; Hu, J. Distribution and partitioning of heavy metals in water and sediments of a typical estuary (Modaomen, South China): The effect of water density stratification associated with salinity. Environ. Pollut. 2021, 287, 117277. [Google Scholar] [CrossRef]
  26. Wen, Z.; Xu, W.; Li, Q.; Han, M.; Tang, A.; Zhang, Y.; Luo, X.; Shen, J.; Wang, W.; Li, K.; et al. Changes of nitrogen deposition in China from 1980 to 2018. Environ. Int. 2020, 144, 106022. [Google Scholar] [CrossRef]
  27. Zheng, L.; Chen, W.; Jia, S.; Wu, L.; Zhong, B.; Liao, W.; Chang, M.; Wang, W.; Wang, X. Temporal and spatial patterns of nitrogen wet deposition in different weather types in the Pearl River Delta (PRD), China. Sci. Total Environ. 2020, 740, 139936. [Google Scholar] [CrossRef]
  28. He, S.; Huang, M.; Zheng, L.; Chang, M.; Chen, W.; Xie, Q.; Wang, X. Seasonal variation of transport pathways and potential source areas at high inorganic nitrogen wet deposition sites in southern China. J. Environ. Sci. 2022, 114, 444–453. [Google Scholar] [CrossRef]
  29. Fang, Z.; Deng, W.; Zhang, Y.; Ding, X.; Tang, M.; Liu, T.; Hu, Q.; Zhu, M.; Wang, Z.; Yang, W.; et al. Open burning of rice, corn and wheat straws: Primary emissions, photochemical aging, and secondary organic aerosol formation. Atmos. Chem. Phys. 2017, 17, 14821–14839. [Google Scholar] [CrossRef] [Green Version]
  30. Zheng, J.Y.; Yin, S.S.; Kang, D.W.; Che, W.W.; Zhong, L.J. Development and uncertainty analysis of a high-resolution NH3 emissions inventory and its implications with precipitation over the Pearl River Delta region, China. Atmos. Chem. Phys. 2012, 12, 7041–7058. [Google Scholar] [CrossRef]
  31. Yu, X.; Yu, Q.; Zhu, M.; Tang, M.; Li, S.; Yang, W.; Zhang, Y.; Deng, W.; Li, G.; Yu, Y.; et al. Water Soluble Organic Nitrogen (WSON) in Ambient Fine Particles Over a Megacity in South China: Spatiotemporal Variations and Source Apportionment. J. Geophys. Res. Atmos. 2017, 122, 13–45. [Google Scholar] [CrossRef]
  32. Liu, M.; Huang, X.; Song, Y.; Tang, J.; Cao, J.; Zhang, X.; Zhang, Q.; Wang, S.; Xu, T.; Kang, L.; et al. Ammonia emission control in China would mitigate haze pollution and nitrogen deposition, but worsen acid rain. Proc. Natl. Acad. Sci. USA 2019, 116, 7760–7765. [Google Scholar] [CrossRef] [Green Version]
  33. Zhang, L.; Chen, Y.; Zhao, Y.; Henze, D.K.; Zhu, L.; Song, Y.; Paulot, F.; Liu, X.; Pan, Y.; Lin, Y.; et al. Agricultural ammonia emissions in China: Reconciling bottom-up and top-down estimates. Atmos. Chem. Phys. 2018, 18, 339–355. [Google Scholar] [CrossRef] [Green Version]
  34. Huang, X.; Song, Y.; Li, M.; Li, J.; Huo, Q.; Cai, X.; Zhu, T.; Hu, M.; Zhang, H. A high-resolution ammonia emission inventory in China. Glob. Biogeochem. Cycles 2012, 26, GB1030. [Google Scholar] [CrossRef]
  35. Paulot, F.; Jacob, D.J.; Pinder, R.W.; Bash, J.O.; Travis, K.; Henze, D.K. Ammonia emissions in the United States, European Union, and China derived by high-resolution inversion of ammonium wet deposition data: Interpretation with a new agricultural emissions inventory (MASAGE_NH3). J. Geophys. Res. Atmos. 2014, 119, 4343–4364. [Google Scholar] [CrossRef]
  36. Liu, T.Y.; Wang, X.M.; Wang, B.G.; Ding, X.; Deng, W.; Lu, S.J.; Zhang, Y.L. Emission factor of ammonia (NH3) from on-road vehicles in China: Tunnel tests in urban Guangzhou. Environ. Res. Lett. 2014, 9, 064027. [Google Scholar] [CrossRef]
  37. Pan, Y.; Tian, S.; Liu, D.; Fang, Y.; Zhu, X.; Zhang, Q.; Zheng, B.; Michalski, G.; Wang, Y. Fossil Fuel Combustion-Related Emissions Dominate Atmospheric Ammonia Sources during Severe Haze Episodes: Evidence from 15N-Stable Isotope in Size-Resolved Aerosol Ammonium. Environ. Sci. Technol. 2016, 50, 8049–8056. [Google Scholar] [CrossRef] [Green Version]
  38. Pan, Y.; Liu, B.; Cao, J.; Liu, J.; Tian, S.; Du, E. Enhanced atmospheric phosphorus deposition in Asia and Europe in the past two decades. Atmos. Ocean Sci. Lett. 2021, 14, 100051. [Google Scholar] [CrossRef]
  39. Wen, Z.; Wang, R.; Li, Q.; Liu, J.; Ma, X.; Xu, W.; Tang, A.; Collett, J.L.; Li, H.; Liu, X. Spatiotemporal variations of nitrogen and phosphorus deposition across China. Sci. Total Environ. 2022, 830, 154740. [Google Scholar] [CrossRef]
  40. Ma, X.; Jiao, X.; Sha, Z.; Ding, F.; Li, Y.; Xu, W.; Tang, A.; Xia, X.; Fangmeier, A.; Liu, X. Characterization of atmospheric bulk phosphorus deposition in China. Atmos. Environ. 2022, 279, 119127. [Google Scholar] [CrossRef]
  41. Yu, X.; Pan, Y.; Song, W.; Li, S.; Li, D.; Zhu, M.; Zhou, H.; Zhang, Y.; Li, D.; Yu, J.; et al. Wet and Dry Nitrogen Depositions in the Pearl River Delta, South China: Observations at Three Typical Sites with an Emphasis on Water-Soluble Organic Nitrogen. J. Geophys. Res. Atmos. 2020, 125, e2019JD030983. [Google Scholar] [CrossRef]
  42. Zhong, B.; Wang, X.; Ye, L.; Ma, M.; Jia, S.; Chen, W.; Yan, F.; Wen, Z.; Padmaja, K. Meteorological variations impeded the benefits of recent NOx mitigation in reducing atmospheric nitrate deposition in the Pearl River Delta region, Southeast China. Environ. Pollut. 2020, 266 Pt 2, 115076. [Google Scholar] [CrossRef] [PubMed]
  43. Han, X.; Zhang, M.; Skorokhod, A.; Kou, X. Modeling dry deposition of reactive nitrogen in China with RAMS-CMAQ. Atmos. Environ. 2017, 166, 47–61. [Google Scholar] [CrossRef]
  44. Ma, M.; Chen, W.; Jia, S.; Chang, M.; Zhong, B.; Wang, X. A new method for quantification of regional nitrogen emission—Deposition transmission in China. Atmos. Environ. 2020, 227, 117401. [Google Scholar] [CrossRef]
  45. Yu, X.; Li, D.; Li, D.; Zhang, G.; Zhou, H.; Li, S.; Song, W.; Zhang, Y.; Bi, X.; Yu, J.; et al. Enhanced Wet Deposition of Water-Soluble Organic Nitrogen During the Harvest Season: Influence of Biomass Burning and In-Cloud Scavenging. J. Geophys. Res. Atmos. 2020, 125, e2020JD032699. [Google Scholar] [CrossRef]
  46. Yau, Y.Y.Y.; Geeraert, N.; Baker, D.M.; Thibodeau, B. Elucidating sources of atmospheric NOX pollution in a heavily urbanized environment using multiple stable isotopes. Sci. Total Environ. 2022, 832, 154781. [Google Scholar] [CrossRef]
  47. Zhang, W.S.; Swaney, D.P.; Li, X.Y.; Hong, B.; Howarth, R.W.; Ding, S.H. Anthropogenic point-source and non-point-source nitrogen inputs into Huai River basin and their impacts on riverine ammonia–nitrogen flux. Biogeosciences 2015, 12, 4275–4289. [Google Scholar] [CrossRef] [Green Version]
  48. Julong, D. Introduction to grey system theory. J. Grey Syst. 1989, 1, 1–24. [Google Scholar]
  49. Huang, Y.P.; Huang, C.C. The integration and application of fuzzy and grey modeling methods. Fuzzy Sets Syst. 1996, 78, 107–119. [Google Scholar] [CrossRef]
  50. Ip, W.C.; Hu, B.Q.; Wong, H.; Xia, J. Applications of grey relational method to river environment quality evaluation in China. J. Hydrol. 2009, 379, 284–290. [Google Scholar] [CrossRef]
  51. Li, S.; Lu, L.; Gao, Y.; Zhang, Y.; Shen, D. An Analysis on the Characteristics and Influence Factors of Soil Salinity in the Wasteland of the Kashgar River Basin. Sustainability 2022, 14, 3500. [Google Scholar] [CrossRef]
  52. Pei, W.; Yan, T.; Lei, Q.; Zhang, T.; Fan, B.; Du, X.; Luo, J.; Lindsey, S.; Liu, H. Spatio-temporal variation of net anthropogenic nitrogen inputs (NANI) from 1991 to 2019 and its impacts analysis from parameters in Northwest China. J. Environ. Manag. 2022, 321, 115996. [Google Scholar] [CrossRef]
  53. Cui, X.; Huang, C.; Wu, J.; Liu, X.; Hong, Y. Temporal and spatial variations of net anthropogenic nitrogen inputs (NANI) in the Pearl River Basin of China from 1986 to 2015. PLoS ONE 2020, 15, e0228683. [Google Scholar] [CrossRef] [PubMed] [Green Version]
  54. Hu, M.; Wang, Y.; Xia, B.; Huang, G. What is the relationship between energy consumption and economic development? New evidence from a rapidly growing economic development region. Environ. Dev. Sustain. 2022. [Google Scholar] [CrossRef]
  55. Hobbie, S.E.; Finlay, J.C.; Janke, B.D.; Nidzgorski, D.A.; Millet, D.B.; Baker, L.A. Contrasting nitrogen and phosphorus budgets in urban watersheds and implications for managing urban water pollution. Proc. Natl. Acad. Sci. USA 2017, 114, 4177–4182. [Google Scholar] [CrossRef] [PubMed] [Green Version]
  56. Gold, A.C.; Thompson, S.P.; Piehler, M.F. The Effects of Urbanization and Retention-Based Stormwater Management on Coastal Plain Stream Nutrient Export. Water Resour. Res. 2019, 55, 7027–7046. [Google Scholar] [CrossRef]
  57. Lu, F.-H.; Ni, H.-G.; Liu, F.; Zeng, E.Y. Occurrence of nutrients in riverine runoff of the Pearl River Delta, South China. J. Hydrol. 2009, 376, 107–115. [Google Scholar] [CrossRef]
  58. Huang, F.; Lin, X.; Hu, W.; Zeng, F.; He, L.; Yin, K. Nitrogen cycling processes in sediments of the Pearl River Estuary: Spatial variations, controlling factors, and environmental implications. Catena 2021, 206, 105545. [Google Scholar] [CrossRef]
  59. Hong, B.; Swaney, D.P.; McCrackin, M.; Svanbäck, A.; Humborg, C.; Gustafsson, B.; Yershova, A.; Pakhomau, A. Advances in NANI and NAPI accounting for the Baltic drainage basin: Spatial and temporal trends and relationships to watershed TN and TP fluxes. Biogeochemistry 2017, 133, 245–261. [Google Scholar] [CrossRef] [Green Version]
  60. Powers, S.M.; Bruulsema, T.W.; Burt, T.P.; Chan, N.I.; Elser, J.J.; Haygarth, P.M.; Howden, N.J.; Jarvie, H.P.; Lyu, Y.; Peterson, H.M. Long-term accumulation and transport of anthropogenic phosphorus in three river basins. Nat. Geosci. 2016, 9, 353–356. [Google Scholar] [CrossRef]
Figure 1. The geographic location of the Pearl River in Guangdong Province.
Sustainability 14 16166 g001
Figure 2. Spatial and temporal changes of NANI intensities from 2016 to 2020. (a) 2016; (b) 2017; (c) 2018; (d) 2019; (e) 2020.
Sustainability 14 16166 g002
Figure 3. Spatial and temporal changes of NAPI intensities from 2016 to 2020. (a) 2016; (b) 2017; (c) 2018; (d) 2019; (e) 2020.
Sustainability 14 16166 g003
Figure 4. The distribution of Pearl River water quality assessment from 2016 to 2020. (a) TN; (b) TP.
Sustainability 14 16166 g004
Figure 5. The changes in each component of NANI and NAPI intensities from 2016 to 2020. (a) NANI; (b) NAPI.
Sustainability 14 16166 g005
Figure 6. Spatial and temporal changes of TN flux from 2016 to 2020.
Sustainability 14 16166 g006
Figure 7. Spatial and temporal changes of TP flux from 2016 to 2020.
Sustainability 14 16166 g007
Table 2. The input of seeding correlation coefficients by each crop. (Reprinted/Adapted with permission from reference [12,14,15]. Copyright 2013, 2014, 2016, Copyright Elsevier B.V.).
Crop TypeNseed (kg·N·km−2·yr−1)Pseed (kg·N·km−2·yr−1)
Wheat227102881
Rice6920634
Yam6320790
Soybean10750890
Vegetable2803
Peanut352058
Table 3. The input of agricultural fixation correlation coefficients by each crop. (Reprinted/Adapted with permission from reference [47]. Copyright 2015, Copyright Author(s) 2015. CC Attribution 3.0 License.).
Land TypesN Fixation Rate (kg·N·km−2·yr−1)
Green manure15,000
Leguminous plants6400
Paddy field4500
Dryland1500
Table 4. Correlation coefficients of net food and feed inputs of N and P. (Reprinted/Adapted with permission from reference [14,15]. Copyright 2013, 2016, Copyright Elsevier B.V.).
TypeConsumption Rate (kg·N·ind−1·yr−1)Production Rate (kg·N·ind−1·yr−1)Consumption Rate (kg·P·ind−1·yr−1)Production Rate (kg·P·ind−1·yr−1)
Human4.94-0.49-
Pig16.685.174.591.42
Cattle54.826.0310.991.21
Chicken0.570.200.180.06
Duck0.630.220.340.12
Sheep6.851.101.260.20
Table 5. Relational grade by grey relational analysis.
Region NFPFGAOVGDPPDUR *
Guangdong section of the Pearl River basinNANI0.884\0.9140.8160.8640.891
NAPI\0.9170.9230.8130.8530.900
Pearl River DeltaNANI0.663\0.7010.7540.7800.731
NAPI\0.6960.7320.7310.7580.735
non-Pearl River DeltaNANI0.913\0.8890.7910.7790.783
NAPI\0.9110.8710.7510.7410.806
* Gross Domestic Product (GDP), Gross Agricultural Output Value (GAOV), N Fertilizer (NF), P Fertilizer (PF), Population Density (PD), and Urbanization Rate (UR).
Publisher’s Note: MDPI stays neutral with regard to jurisdictional claims in published maps and institutional affiliations.

