Article

Effects of Sleep Deprivation on Functional Connectivity of Brain Regions after High-Intensity Exercise in Adolescents

1
School of Sports, Shaanxi Normal University, Xi’an 710119, China
2
Faculty of Business and Law, Coventry University, West Midlands, Coventry CV1 5FB, UK
*
Author to whom correspondence should be addressed.
Sustainability 2022, 14(23), 16175; https://doi.org/10.3390/su142316175
Submission received: 30 September 2022 / Revised: 4 November 2022 / Accepted: 30 November 2022 / Published: 3 December 2022

Abstract

:
Lack of sleep causes central fatigue in the body, which in turn affects brain function, and similarly, intense exercise causes both central and peripheral fatigue. This study aims to characterize the brain state, and in particular the functional changes in the relevant brain regions, after intense exercise in sleep-deprived conditions by detecting EEG signals. Thirty healthy adolescents were screened to participate in the trial, a sleep-deprivation model was developed, and a running exercise was performed the following morning. Meanwhile, pre-exercise and post-exercise Electroencephalogram (EEG) data were collected from the subjects using a 32-conductor electroencephalogram acquisition system (Neuroscan), and the data were analyzed using MATLAB (2013b) to process the data and analyzed Phase Lag Index (PLI) and graph theory metrics for different brain connections. Compared with the control group, the pre-exercise sleep-deprivation group showed significantly lower functional brain connectivity in the central and right temporal lobes in the Delta band (p < 0.05), significantly lower functional brain connectivity in the parietal and occipital regions in the Theta band (p < 0.05), and significantly higher functional brain connectivity in the left temporal and right parietal regions in the Beta2 band (p < 0.05). In the post-exercise sleep-deprivation group, functional brain connectivity was significantly lower in the central to right occipital and central regions in the Delta band (p < 0.05), significantly higher in the whole brain regions in the Theta, Alpha2, and Beta1 bands (p < 0.05 and 0.001), significantly higher in the right central, right parietal, and right temporal regions in the Alpha1 band (p < 0.05), and in the Beta2 band, the functional brain connections from the left frontal region to the right parietal region were significantly lower (p < 0.05). The results of the brain functional network properties showed that the clustering coefficients in the Delta band were significantly lower in the pre-exercise sleep-deprivation group compared to the control group (p < 0.05); the characteristic path length and global efficiency in the Theta band were significantly lower (p < 0.05 and 0.001). The post-exercise sleep-deprivation group showed significantly higher clustering coefficients, input lengths, and local efficiencies (p < 0.001), and significantly lower global efficiencies in the Delta and Theta bands (p < 0.001), and significantly higher clustering coefficients and local efficiencies (p < 0.001) and significantly lower input lengths and global efficiencies in the Alpha1 band compared with the control group (p < 0.001). After sleep deprivation, the pre-exercise resting state reduces the rate of information transfer in the functional networks of the adolescent brain, slowing the transfer of information between brain regions. After performing strenuous exercise, sleep deprivation leads to decreased athletic performance in adolescents. After a prolonged period of intense exercise, brain activity is gradually suppressed, resulting in even slower work efficiency and, eventually, increased information transfer in adolescents.

1. Introduction

High-quality sleep restores energy and strength, while low quality sleep affects the body’s functional state and can lead to a gradual decline in athletic performance. It was found that during 15 min of cycling, 4 h partial sleep deprivation reduced the exercise duration in subjects compared to the normal sleep group [1]. Roberts SSH et al. studied the effects of prolonged sleep, normal sleep, and restricted sleep on endurance performance and found that prolonged sleep maintained endurance performance in athletes, while restricted sleep impaired endurance performance [2].
The functional connectivity approach aims to integrate information in brain networks and plays a crucial role in optimal brain function [3]. Node-edge analysis is the main analytical tool for assessing functional brain networks, where COH and PLV are susceptible to volumetric conduction effects while PLI is not [4]. In addition, graph theory analysis has the advantage of allowing the analysis of brain network properties to be quantified and reproducible [5]. It was found that after 36 h of sleep deprivation, subjects showed an increase in the strength of functional connectivity and a significant increase in the number of connections, along with changes in clustering coefficients, small-world properties, and characteristic path lengths [6]. Moreover, the characteristic path length on the Theta band increased significantly after 36 h of acute sleep deprivation and the clustering coefficient on the Alpha band decreased significantly [7]. It was found that the use of power bikes to induce exercise fatigue in subjects had diminished thalamic and striatal activation, along with reduced neuronal activity [8]. It is worth noting that basketball players undergo different changes in feature path length, global efficiency, and small-world properties relative to the general population [9]. In summary, both sleep deprivation and intense exercise affect brain function networks.
How sleep deprivation affects the functional connectivity of brain regions of ado-lescents before and after high-intensity exercise is still seldom reported. Thus, by constructing a sleep-deprivation model and an exercise model, this experiment has the potential to reveal the characteristics of functional changes in adolescent brain regions after participating in intense exercise in the presence of sleep deprivation.

2. Materials and Methods

2.1. Materials

2.1.1. Participants

In the study, 32 physically fit adolescents were screened through recruitment at Shaanxi Normal University’s School of Physical Education to serve as subjects for the experiment. The screening criteria were: (1) normal vision or corrected vision and right-handedness; (2) subjects did not smoke, drink alcohol, coffee, strenuous exercise, or mood swings within 24 h; and (3) all subjects had normal sleep quality and no sleep-related diseases.
Exclusion criteria: (1) history of heart disease, mental illness, family illness, etc.; (2) poor sleep quality. Based on the screening criteria described above, two subjects were excluded due to sleep quality issues. A final selection of 30 normal adolescents was used for the experiment. Subjects volunteered to participate in the trial, were informed of the process and purpose of the trial prior to the trial, and then signed an informed consent form. The project was approved and supervised by the Academic Ethics Committee of Shaanxi Normal University, and the subjects were paid at the end of the experiment. Table 1 shows the demographic characteristics of the subjects:

2.1.2. Random Groups

The present study was conducted by subjecting 30 subjects to data collection under both sleep deprivation and sleep sufficiency models separately. In order to eliminate the negative effects of both sleep deprivation and sleep sufficiency models on the results of this study, a fully randomized design was used to randomize the 30 subjects who met the screening criteria. Group 1: Sleep deprivation experiments followed by data collection for sleep sufficiency experiments. Group 2: Sleep deprivation experiments data collection for the sleep deprivation experiments followed by the sleep deprivation experiments.

2.2. Research Methods

2.2.1. Development of a Sleep-Deprivation Model

Based on the American Sleep Foundation’s recommendations for the amount of sleep at night for young people aged 18–25 years (2015) [10], sleep duration < 4 h is considered severe sleep deprivation, 4 h ≤ sleep duration < 6 h is considered mild sleep deprivation, and sleep duration ≥7 h is considered normal sleep. The operational details of the sleep-deprivation model developed in this experiment were as follows: (1) 30 participants were guaranteed to have slept well and not to have accumulated somatic and mental fatigue before the modeling; (2) at 10:00 pm on the day before the exercise, a sleep detector (GT9X-BT, ActiLife, Pensacola, FL, USA) was worn and the sleep time, intensity and duration of physical activity were recorded for 24 h. The acquisition frequency was 1000 Hz; (3) The participants rested in the laboratory before the test until 3:00 a.m. and were awakened before 7:00 a.m. to ensure that the actual sleep time was <4 h. The participants were considered to be the sleep-deprivation group; (4) The control group was still the same group of subjects, with the sleep time at 10:00 p.m. and the awakening time at 7:00 a.m. to ensure that the sleep time was 7:00 a.m. The actual sleep time was guaranteed to be ≥7 h.

2.2.2. Exercise Protocol and EEG Testing

The exercise protocol and Electroencephalography (EEG) tests are shown in Figure 1: subjects were awakened at 7 am on the same day, after breakfasted, pre-preparation (cleaning hair dandruff and oil) and pre-exercise Electroencephalography (EEG) data collection were performed, and 20 min later the running platform (h/p/cosmos cos10253 Germany) exercise was performed. After the exercise, the post-exercise EEG data were again collated. In addition to this, the subjects were not allowed to perform any other moderate-intensity exercise during the day.
The motion protocol is based on the Bruce motion protocol and the parameters shown in Table 2 are used to set the running platform. The exercise test was performed on the running platform (h/p/cosmos cos10253 Germany), and in order to prevent the subject from falling, the subject wore a safety harness and a Polar meter to monitor and record the ambulatory heart rate before stepping on the running platform; the running platform was started by clicking start, and the subject started from the first level (During the exercise, the subject wore a portable blood pressure monitor (Omron, Liaoning, China) to record the ambulatory blood pressure and heart rate during exercise, and a subjective perceptual evaluation of exercise load (Rating of Perceived Exertion (RPE)) was used to measure the heart rate). Perceived Exertion (RPE) was used to ask subjects about their subjective perceptions at the end of each exercise level and recorded. Subjects were given at least 1 week between exercise and normal sleep and sleep deprivation to ensure full recovery of body function after previous exercise and to avoid any impact on subsequent exercise.
The criteria for campaign termination are based on the literature [11]. Namely, the subject terminates if any three of the following four conditions occur. (1) Behavioral manifestations: the subject exhibits a dyspnoea condition; (2) Blood pressure changes: the subject had a systolic blood pressure (SBP) > 150 mm Hg and a diastolic blood pressure (DBP) > 75 mm Hg; (3) Heart rate: the subjects heart rate approached or reached my HRmax = 208 − 0.7 × age [12]; (4) RPE rating: Subjects with an RPE of 18–19 are unable to continue exercise after encouragement.

2.2.3. EEG Data Collection and Processing

A high-resolution EEG acquisition system (Brain Vision Recorder; Neuroscan, El Paso, TX, USA) with 32 conductive polar caps extended by the International 10–20 system was used to complete the acquisition of EEG signals from the functional state of the subject’ brain, as shown in Figure 2. EEG signal acquisition conditions: Online EEG data were recorded using a 0.05–100 Hz filtered bandpass with a sampling frequency of 1000 Hz/conductor, using the bilateral mastoid as the reference electrode and the forehead grounded; vertical Electrooculography (EOG) activity was recorded with electrodes placed above and below the left eye, and horizontal Electrooculography (EOG) activity was recorded with electrodes placed laterally in both eyes. All electrodes had an impedance of less than 5 kΩ between the electrodes and the scalp. The acquisition times were 8 min each for the baseline values and after a one-time heavy-duty motion sweep, of which 5 min were selected for analysis.
The data preprocessing process was performed using the sub-toolkit EEGLAB (Delorme and Makeig, 2004 [13]) with the following steps: Loading of raw data, positioning of channel positions; remove useless channels; perform bandpass filtering (0.5~100 Hz) and depression filtering (49~51 Hz); conversion of the reference electrode to a bilateral mastoid (M1, M2) mean reference; data segments are selected for 2 s/segment (no overlap) and segments with voltage amplitudes exceeding plus or minus 100 μV are removed; the sampling rate was reduced to 500 Hz; independent principal component analysis (ICA) algorithm was used to correct for possible ocular and other artifacts in the signal, such as Electromyography (EMG), Electrocardiography (ECG); observe the properties of each independent component and identify independent components associated with artifacts. Independent components were identified and the artifacts related to independent components were identified and removed.

2.2.4. Mathematical and Statistical Methods

(1)
Selection of threshold values
Brain functional networks are constructed with the help of cutting-edge brain functional connectivity mapping [14], and GRETNA software is used to analyze and study brain regions. There is no clear criterion or method for selecting threshold values based on previous expert studies. This study determined the step size as 0.02 and the minimum and maximum values as 0.1 and 0.6 sparsity thresholds (0.1 ≤ T ≤ 0.6) after repeated validation and testing.
(2)
Statistical analysis
All data were analyzed by SPSS 26.0 (IBM SPSS Statistics, Chicago, IL, USA) software, and the Shapiro–Wilk test was used to determine whether each set of data conformed to a normal distribution. A non-parametric test is used if the data does not conform to a normal distribution. A non-parametric test is used if the data does not conform to a normal distribution, and a parametric test is used if the data conforms to a normal distribution. Wilcoxon tests in nonparametric tests were used for statistical analysis of demographic characteristics, evaluation of motion models, clustering coefficients, characteristic path lengths, global, and local efficiencies. Data results are expressed as “mean ± standard deviation”, with p < 0.05 being the criterion for a significant difference.

3. Results

3.1. Evaluation of the Motion Model

This experiment identified sleep duration <4 h and used it as the primary condition for successful termination of sleep-deprivation modeling by recording the actual amount of sleep the test subjects received during the night. Four criteria, including dyspnoea, significantly elevated blood pressure, a maximum heart rate of 180 beats per minute or more, and an RPE rating of 18 during exercise, were used as screening conditions for exercise-related psychosis. In addition, the duration of the exercise, from the start of the exercise to its termination, was used as a basis to evaluate the performance of the subject’s exercise. The results of the experiment are given in Table 3.
The results in Table 3 show that after sleep deprivation, the sleep duration of the subjects was less than 4 h, indicating that the sleep-deprivation model was accomplished, while the sleep duration of the normal sleep group was ≥7 h, which was in line with the “American Sleep Foundation’s recommendation of normal sleep duration at night for young people”. Exercise was terminated in any three of the following four situations according to the criteria for termination of exercise: in both sleep deprivation and normal sleep situations, all subjects felt breathless at the end of exercise, had a heart rate of 180 beats/min or more, had an RPE rating of 18 or more, and the mean systolic and diastolic blood pressures at the end of exercise exceeded 150 mm Hg and 75 mm Hg. The above results confirm that all test subjects met the exercise termination condition; furthermore, the subjects’ exercise duration was significantly lower in the sleep deprivation compared to the normal sleep group (p < 0.01), indicating that sleep deprivation causes a significant reduction in the subjects’ athletic performance.

3.2. Results of the Network Distribution Map Comparison

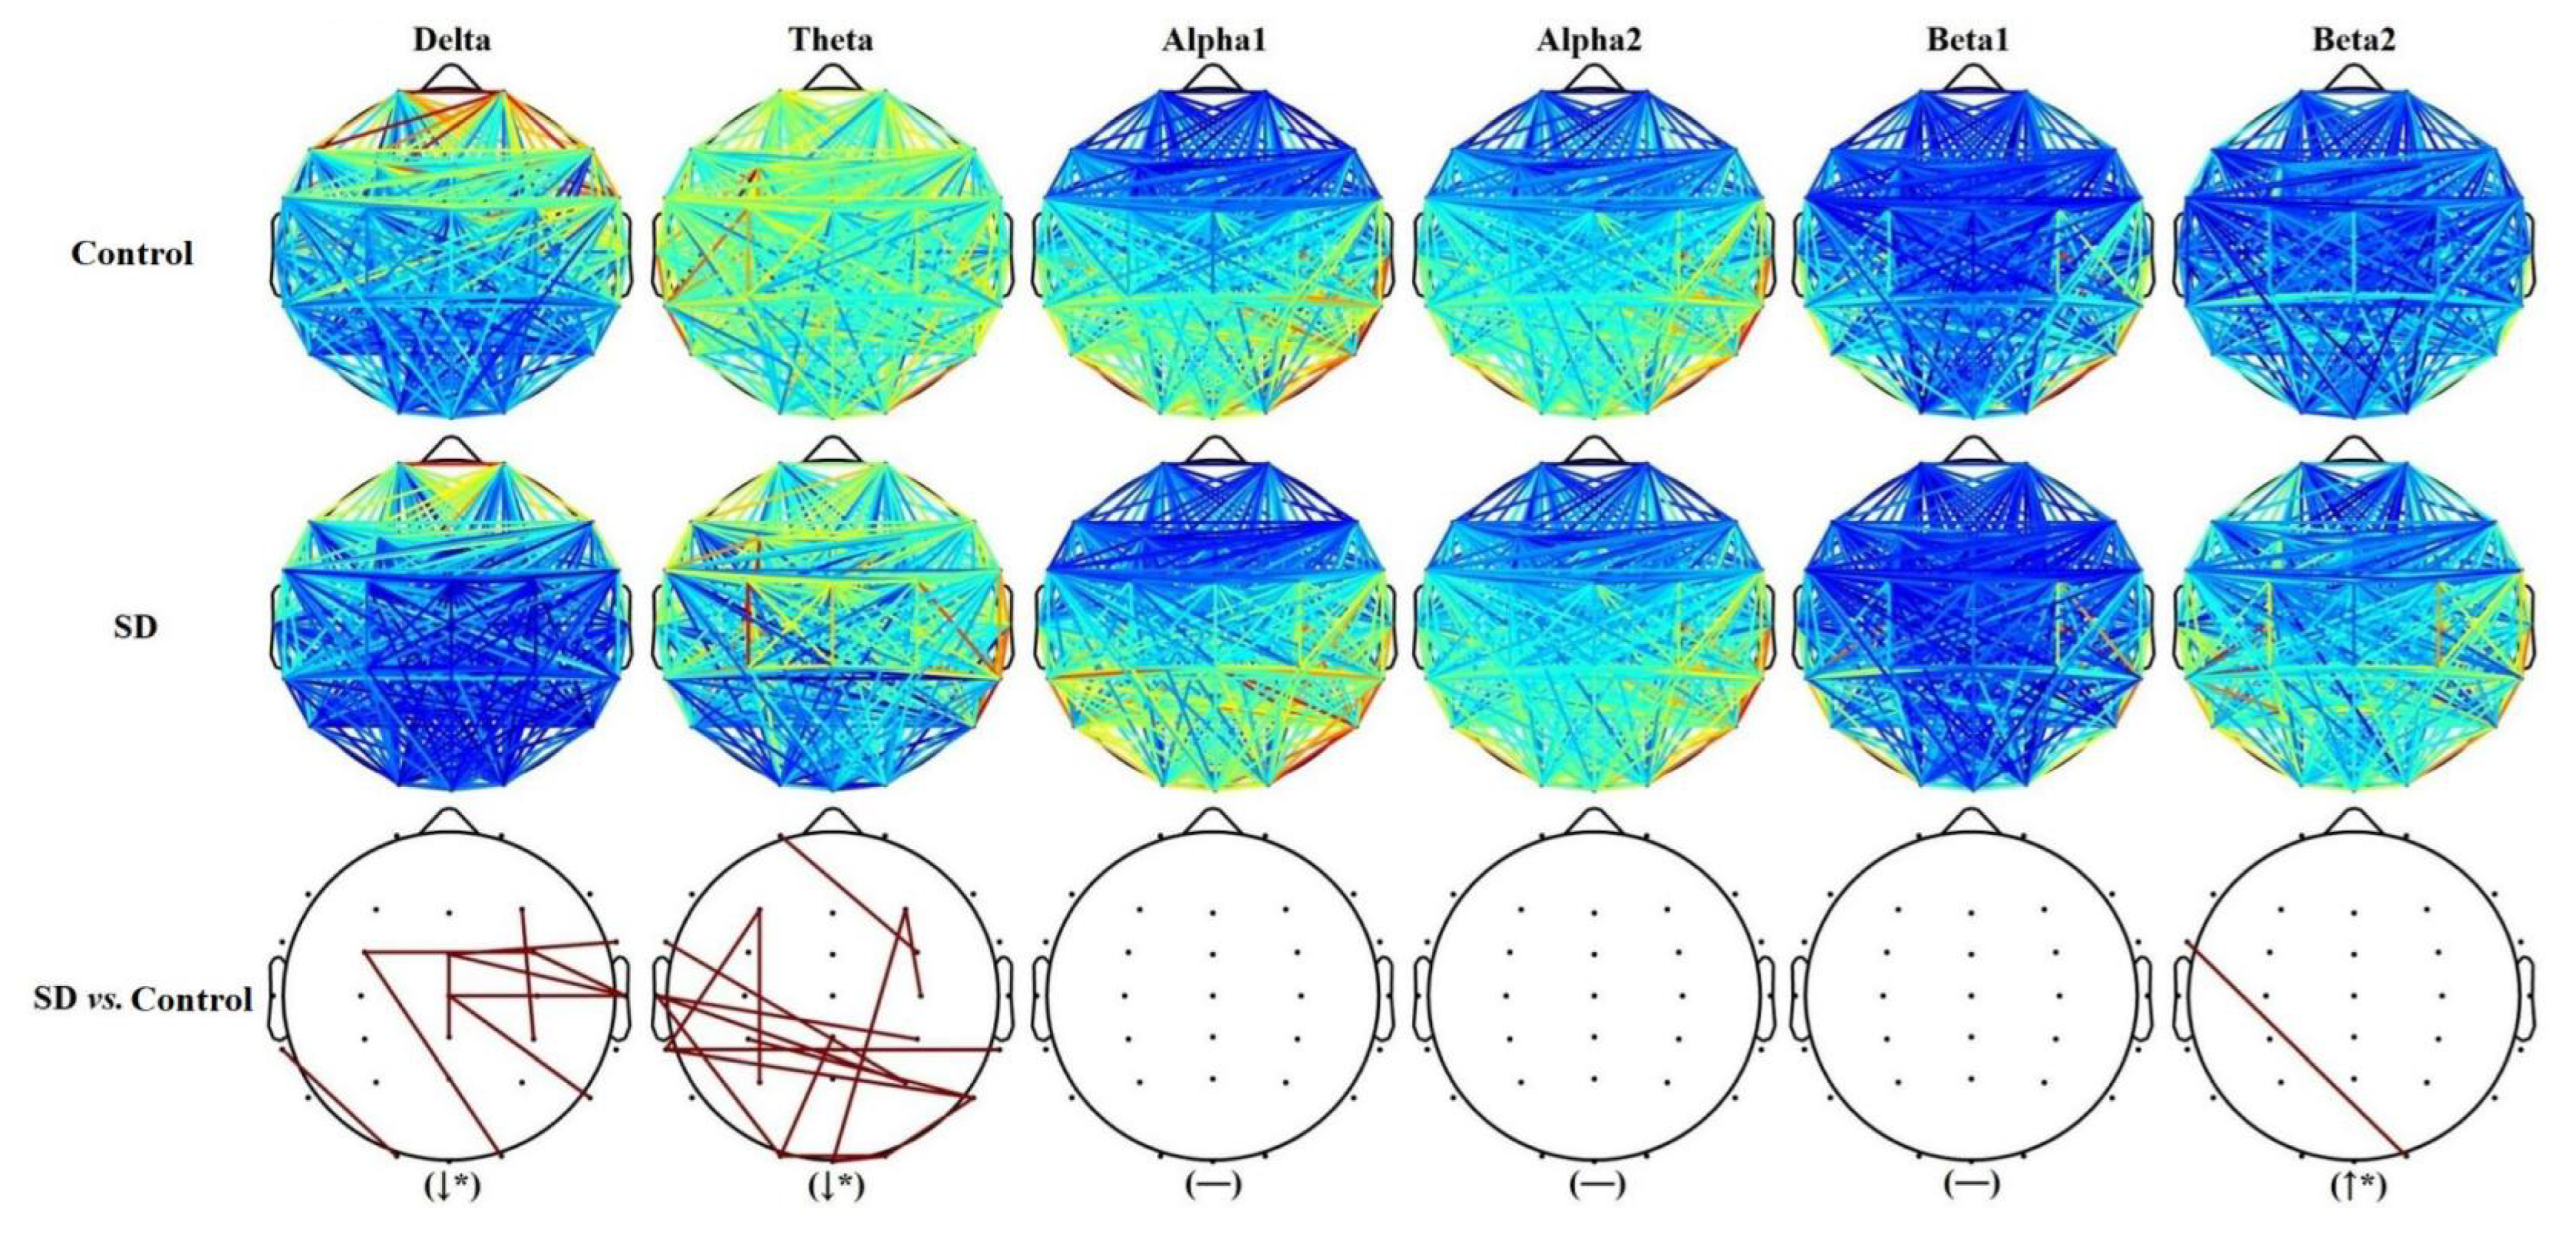
As the results in Figure 3 and Figure 4 show, before exercise, brain functional connectivity in the central and right temporal regions of the Delta band was significantly lower in the sleep-deprived group compared to the control group (p < 0.05); there was significantly lower functional brain connectivity in the parietal and occipital regions in the Theta band (p < 0.05); and functional brain connectivity was significantly elevated in the left temporal and right parietal regions (FT7-O2) in the Beta2 band (p < 0.05).
However, for the post-exercise period, compared to the control group, the sleep-deprived group showed significantly lower functional brain connectivity in both the central to right occipital (FCZ-O1) and central (CPZ-C4) regions of the Delta band (p < 0.05), significantly higher functional brain connectivity in whole brain regions of the Theta, Alpha2, and Beta1 bands (p < 0.05 and 0.001), and significantly higher functional brain connectivity in the right central, right parietal, and right temporal regions of the Alpha1 band (p < 0.05 and 0.001). Functional brain connectivity was significantly higher in the right central, right parietal, and right temporal regions in the Alpha1 band (p < 0.05), and it was significantly lower in the left frontal to right parietal region (FC3-CPZ-P4) in the Beta2 band (p < 0.05).

3.3. Results of the Graphical Comparison

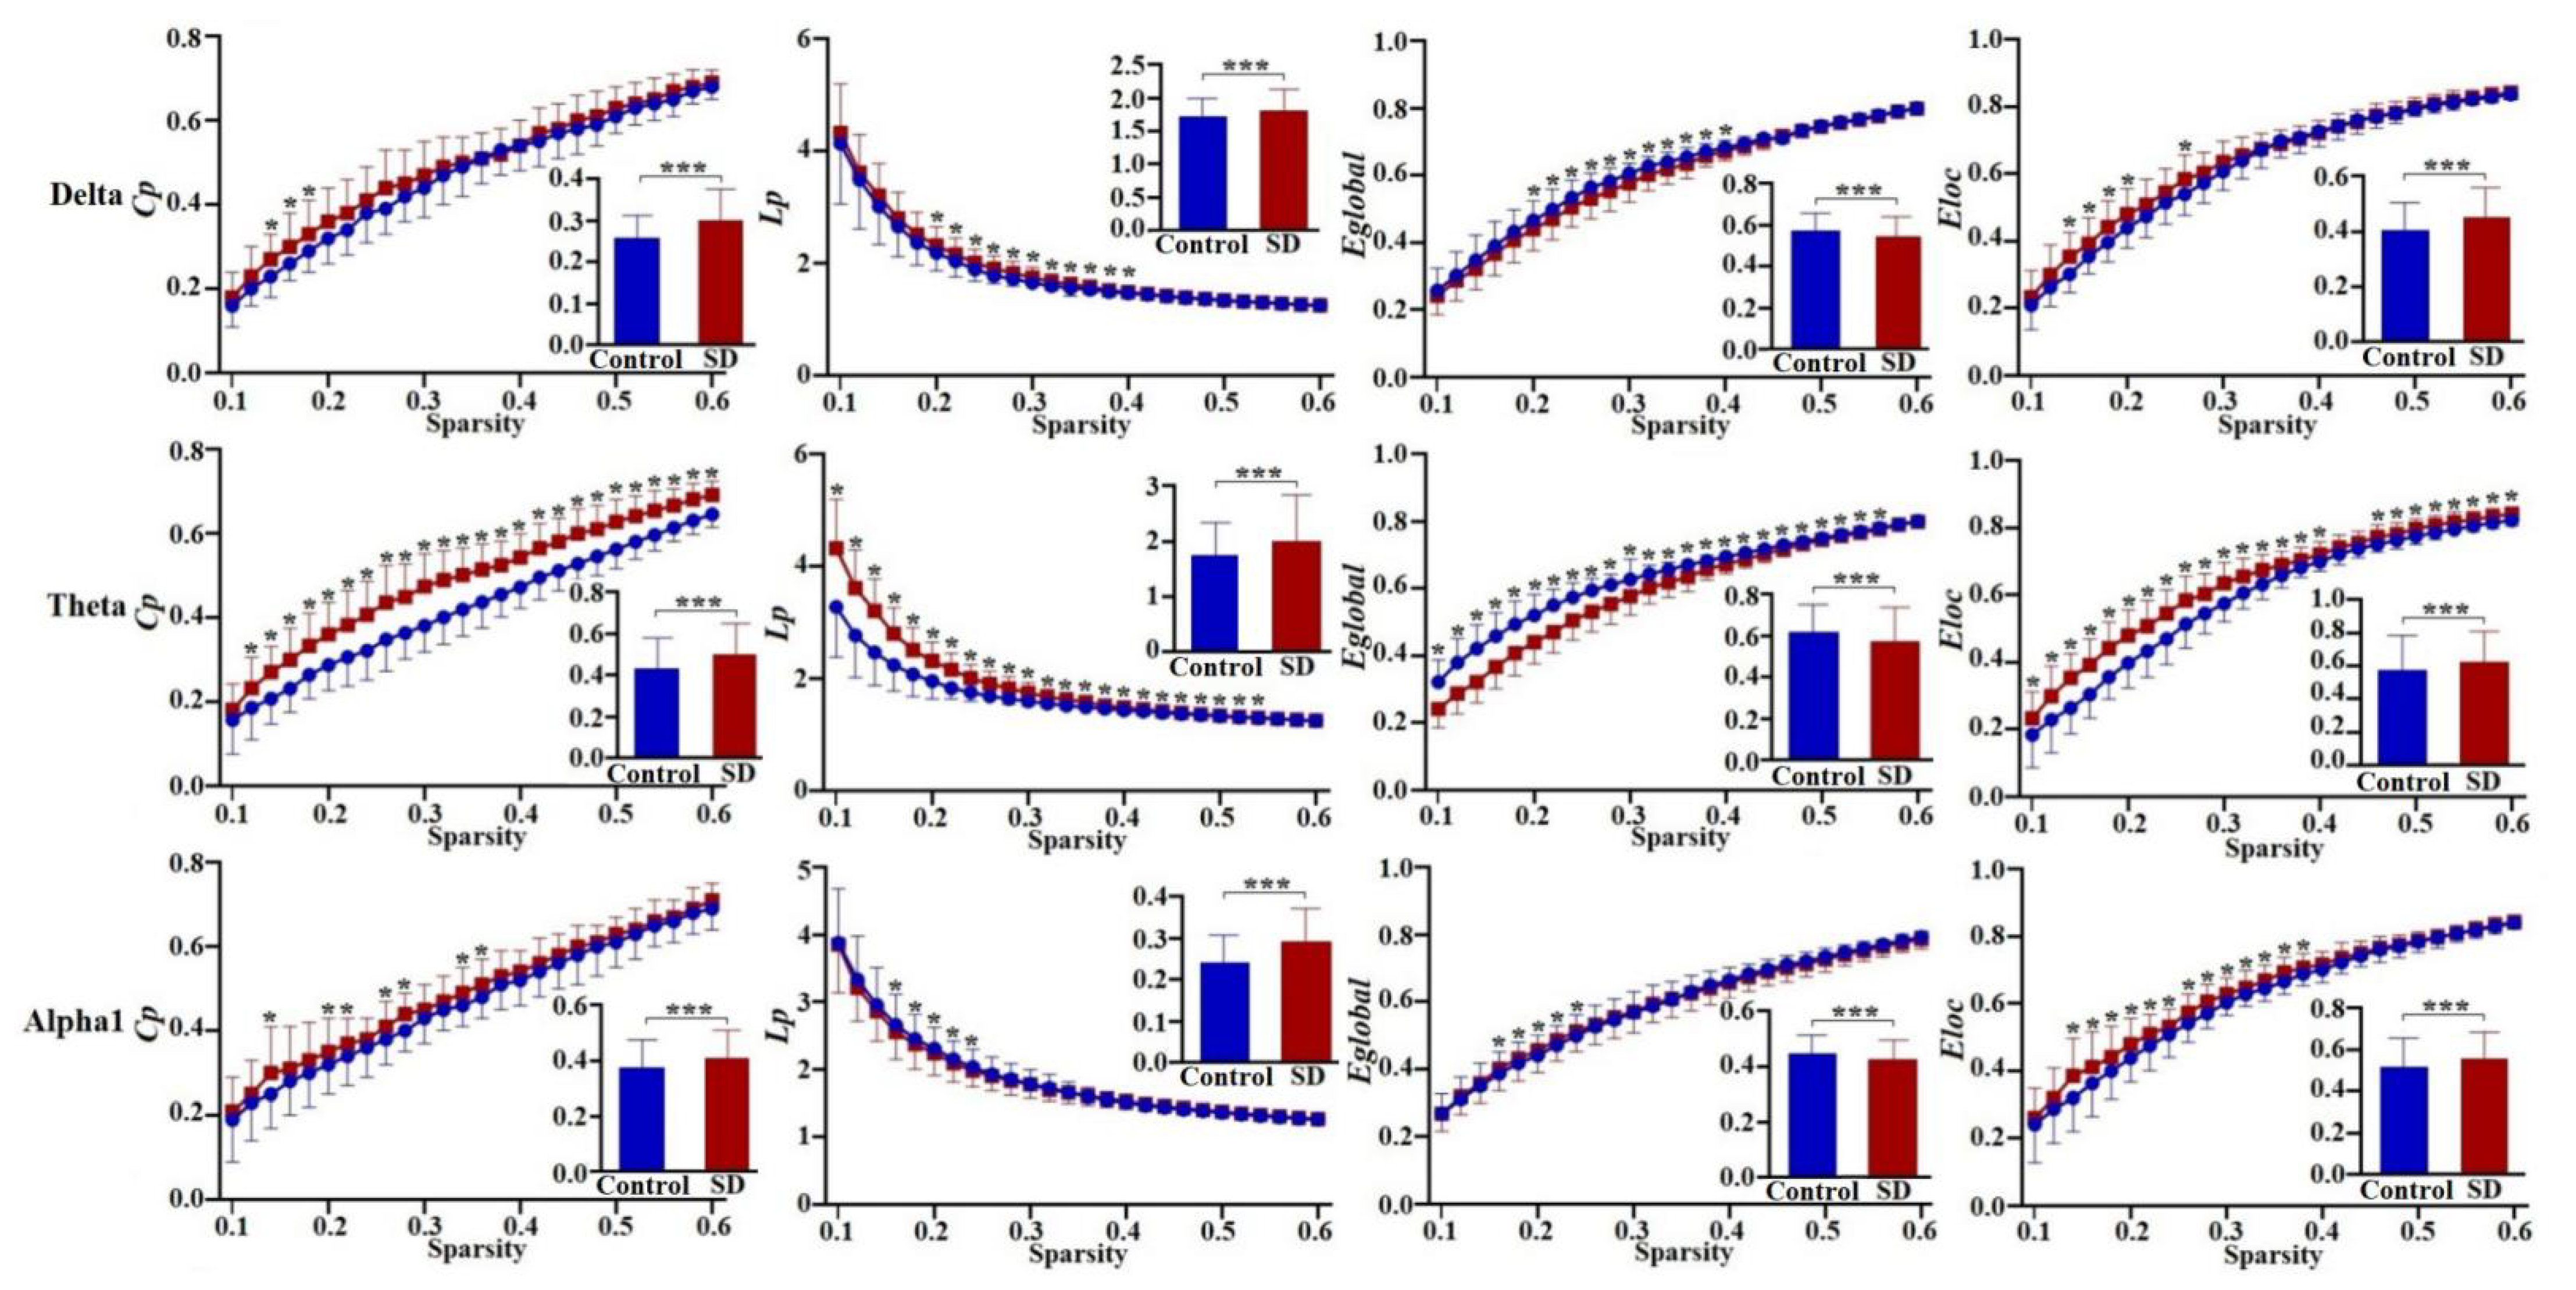
As shown in Figure 5 and Figure 6, at a particular level of sparsity, the clustering coefficients in the Delta band were significantly lower in the pre-exercise sleep-deprivation group compared to the control group (p < 0.05); the characteristic path length and global efficiency were significantly lower in the Theta band (p < 0.05 and 0.001). In the Delta and Theta bands in the post-exercise sleep-deprivation group, clustering coefficients, characteristic path lengths, and local efficiencies were significantly higher (p < 0.001) and global efficiencies were significantly lower (p < 0.001). The clustering coefficient and local efficiency were significantly higher (p < 0.001) and the feature path length and global efficiency were significantly lower in the Alpha1 band (p < 0.001).

4. Discussion

This study was carried out by setting up a sleep-deprivation model in which adolescents with a certain level of motor capacity were subjected to intense exercise under sleep deprivation. The results showed that HRmax gradually increased in the sleep-deprived subjects, as did dyspnea and systolic and diastolic blood pressure. Moreover, after sleep deprivation, adolescents’ exercise time gradually decreased and their exercise performance significantly decreased, suggesting that high-intensity exercise decreases exercise performance. However, overall sleep deprivation leads to a 10% impairment in the performance of endurance for athletes during exercise compared to the normal sleep group [15]. In a study conducted by Abedelmalek, they observed that the duration of sleep deprivation affected the peak and average power during the 30 s Wingate test in football players [16]. What is clear is that sleep deprivation can result in impaired performance and a significant reduction in athletic performance.
Results on the functional connectivity of brain regions after sleep deprivation showed that the central, parietal, occipital, right temporal, and left frontal regions of the brain were affected. These areas are mainly concentrated in the cerebral hemispheres, with the cerebral cortex playing a non-negligible role, primarily in neural processing, when sleep deprivation negatively affects information processing, working memory, mood, and mood in adolescents. Studies have reported reduced functional connectivity in the Alpha band after sleep deprivation, particularly in the parietal and limbic lobes, involving areas such as the precuneus, posterior cingulate cortex, paracentral lobule, parietal lobule, and parahippocampal gyrus [17]. These areas are linked to cognitive functions such as processing information, attention, and working memory [18,19]. It was also found that functional connectivity between the right thalamus and the right parahippocampal gyrus, right middle temporal gyrus, and right superior frontal gyrus was significantly reduced in the sleep-deprived group compared to the normal sleep group [20]. The thalamus is a translational station for sensory transduction and intra-formation integration and reduced functional connectivity in the thalamus leads to reduced intra-formation integration, which in turn affects cognitive function in the brain. The results of functional connectivity studies of brain regions after high-intensity exercise showed that the central, occipital, frontal, right and left temporal, and parietal regions were further reduced after heavy exercise in adolescents, resulting in reduced memory, difficulty concentrating, and delayed reactions. It was found that low-intensity physical exercise increased the strength of connections within the right frontoparietal network, while functional connectivity in sensorimotor areas decreased after heavy-intensity exercise [21], which may be related to sustained fatigue from heavy-intensity exercise, thus leaving sensorimotor areas in a state of sustained fatigue. Similarly, it has been found that subjects have increased blood lactate and decreased supplementary motor areas at the end of the acute forceful exercise, which in turn can lead to difficulty concentrating [22].
In brain function networks, feature path length and global efficiency reflect the ability to transfer information across the network as a whole. While clustering coefficients and local efficiency portray how quick information is transferred and processed from a local perspective of the network [23]. The results of this study show that subjects in the sleep-deprived condition have reduced clustering coefficient in the Delta band and reduced feature path length and global efficiency in the Theta band. Miraglia F et al. used EEG data recorded for 5 min after 40 h of normal and sleep deprivation, and their results showed that the small-world nature tends to decrease in the Delta and Theta bands after sleep deprivation, while the opposite is true in the Sigma band. The results also showed a decrease in normalized feature path length and normalization coefficients in the Beta band, making it clear that sleep deprivation affects different cognitive processes in brain regions [24]. Yang Liu selected 37 subjects for fMRI scans twice (40 h of sleep deprivation and normal sleep, self-controlled experiments) and found that the clustering coefficient and input length on the Delta band increased after sleep deprivation, while global efficiency showed the opposite shift. The clustering coefficient, local efficiency, and global efficiency decreased on the Alpha band, and both input length and small-world properties increased [25]. The differences and variations in the above studies may be related to the age of the subjects, the testing apparatus (EEG and fMRI), the time of acquisition, and the length of sleep deprivation. Results on the topological well-posedness of brain networks after intense exercise show that after sleep deprivation, clustering coefficients, characteristic path lengths, and local efficiencies are enhanced in the Delta and Theta bands and globally reduced. The clustering coefficient and local efficiency are elevated in the Alpha1 band, while the characteristic path length and local efficiency are reduced. It was also found that after subjects engaged in an endurance cycling task until exhaustion, a reduction in subjects’ global efficiency could be observed on the Alpha band only during cycling [26]. It is worth noting that athletes and the general population also bring changes to brain networks. It was found that compared to non-professional athletes, gymnasts had reduced functional connectivity, who had significantly lower clustering coefficients, local efficiency as well as global efficiency, and increased feature path length [27]. The above findings agree that both sleep deprivation and exercise have an impact on functional brain network metrics, with a decrease in clustering coefficient, shorter feature path length, and greater global efficiency with increasing sleep deprivation, when the brain’s ability to process intra-cellular information is reduced.

5. Conclusions

This study explored the characteristics of changes in brain functional networks following high-intensity exercise in both sleep-saturated and sleep-deprived states using brain functional networks and graph theory. Sleep deprivation reduces the speed of information transfer, and the combination of sleep deprivation and intense exercise results in lower motor performance, resulting in slower work efficiency and information transfer. The results of this study tell us that high-intensity exercise with sleep deprivation should be avoided in order to protect one’s health and maintain a strong motor and learning capacity. Due to the constraints of time and practical conditions available, the following areas need to be investigated otherwise. First, the sample size in this study is relatively small. Therefore, the sample size should be expanded for further validation in future studies. Second, this study collected resting-state EEG data, while future studies could consider task-state EEG data in relation to sleep deprivation.

Author Contributions

Data curation, P.C., J.S. and Y.P.; formal analysis, X.N. and Q.W.; funding acquisition, A.C.; resources, Y.L.; software, X.N.; supervision, A.C.; writing—original draft, X.N. All authors have read and agreed to the published version of the manuscript.

Funding

This research was supported by the National Natural Science Foundation of China (No. 31871209) and Signature Achievement Project of Sports School in Shaanxi Normal University (No. 2022AA002, 2022AA003).

Institutional Review Board Statement

The study was conducted according to the guidelines of the Declaration of Helsinki, and approved by the Review Committee of Shaanxi Normal University (protocol code 202016005 and date of approval 17 January 2020).

Informed Consent Statement

Informed consent was obtained from all subjects involved in the study.

Data Availability Statement

Not applicable.

Acknowledgments

We thank all the funders for their support and the valuable contributions of all investigators and participants.

Conflicts of Interest

The authors declare no conflict of interest.

References

  1. Cullen, T.; Thomas, G.; Wadley, A.J.; Myers, T. The effects of a single night of complete and partial sleep deprivation on physical and cognitive performance: A Bayesian analysis. J. Sport. Sci. 2019, 37, 2726–2734. [Google Scholar] [CrossRef] [PubMed]
  2. Roberts, S.S.H.; Teo, W.P.; Aisbett, B.; Warmington, S.A. Extended Sleep Maintains Endurance Performance Better than Normal or Restricted Sleep. Med. Sci. Sport. Exerc. 2019, 51, 2516–2523. [Google Scholar] [CrossRef] [PubMed]
  3. Koutsoukos, E.; Maillis, A.; Papageorgiou, C.; Gatzonis, S.; Stefanis, C.; Angelopoulos, E. The persistent and broadly distributed EEG synchronization might inhibit the normal processing capability of the human brain. Neurosci. Lett. 2015, 609, 137–141. [Google Scholar] [CrossRef] [PubMed]
  4. Peraza, L.R.; Asghar, A.U.; Green, G.; Halliday, D.M. Volume conduction effects in brain network inference from electroencephalographic recordings using phase lag index. J. Neurosci. Methods 2012, 207, 189–199. [Google Scholar] [CrossRef]
  5. Chua, B.L.; Dai, Z.; Thakor, N.; Bezerianos, A.; Sun, Y. Connectome pattern alterations with increment of mental fatigue in one-hour driving simulation. Int. Conf. IEEE Eng. Med. Biol. Soc. 2017, 2017, 4355–4358. [Google Scholar]
  6. Kar, S.; Routray, A. Effect of Sleep Deprivation on Functional Connectivity of EEG Channels. IEEE Trans. Syst. Man Cybern.-Syst. 2013, 43, 666–672. [Google Scholar] [CrossRef]
  7. Yang, L.; Lei, Y.; Wang, L.; Chen, P.; Cheng, S.; Chen, S.; Sun, J.; Li, Y.; Wang, Y.; Hu, W.; et al. Abnormal functional connectivity density in sleep-deprived subjects. Brain Imaging Behav. 2018, 12, 1650–1657. [Google Scholar] [CrossRef]
  8. Ghorbani, M.; Clark, C.C.T. Brain function during central fatigue induced by intermittent high-intensity cycling. Neurol. Sci. 2021, 42, 3655–3661. [Google Scholar] [CrossRef]
  9. Pi, Y.L.; Wu, X.H.; Wang, F.J.; Liu, K.; Wu, Y.; Zhu, H.; Zhang, J. Motor skill learning induces brain network plasticity: A diffusion-tensor imaging study. PLoS ONE 2019, 14, e0210015. [Google Scholar] [CrossRef] [Green Version]
  10. Hirshkowitz, M.; Whiton, K.; Albert, S.M.; Alessi, C.; Bruni, O.; DonCarlos, L.; Hazen, N.; Herman, J.; Adams Hillard, P.J.; Katz, E.S.; et al. National Sleep Foundation’s updated sleep duration recommendations: Final report. Sleep Health 2015, 1, 233–243. [Google Scholar] [CrossRef]
  11. Wu, C.H.; Karageorghis, C.I.; Wang, C.C.; Chu, C.-H.; Kao, S.-C.; Hung, T.-M.; Chang, Y.-K. Effects of acute aerobic and resistance exercise on executive function: An ERP study. J. Sci. Med. Sport 2019, 22, 1367–1372. [Google Scholar] [CrossRef]
  12. Tanaka, H.; Monahan, K.D.; Seals, D.R. Age-predicted maximal heart rate revisited. J. Am. Coll. Cardiol. 2001, 37, 153–156. [Google Scholar] [CrossRef] [PubMed] [Green Version]
  13. Delorme, A.; Makeig, S. EEGLAB: An open source toolbox for analysis of single-trial EEG dynamics including independent component analysis. J. Neurosci. Methods 2004, 134, 9–21. [Google Scholar] [CrossRef] [Green Version]
  14. Wang, J.; Wang, X.; Xia, M.; Liao, X.; Evans, A.; He, Y. GRETNA: A graph theoretical network analysis toolbox for imaging connectomics. Front. Hum. Neurosci. 2015, 9, 386–401. [Google Scholar] [PubMed] [Green Version]
  15. Roberts, S.S.H.; Teo, W.P.; Aisbett, B.; Warmington, S.A. Effects of total sleep deprivation on endurance cycling performance and heart rate indices used for monitoring athlete readiness. J. Sport. Sci. 2019, 37, 2691–2701. [Google Scholar] [CrossRef] [PubMed]
  16. Abedelmalek, S.; Chtourou, H.; Aloui, A.; Aouichaoui, C.; Souissi, N.; Tabka, Z. Effect of time of day and partial sleep deprivation on plasma concentrations of IL-6 during a short-term maximal performance. Eur. J. Appl. Physiol. 2013, 113, 241–248. [Google Scholar] [CrossRef]
  17. Wu, J.; Zhou, Q.; Li, J.; Chen, Y.; Shao, S.; Xiao, Y. Decreased resting-state alpha-band activation and functional connectivity after sleep deprivation. Sci. Rep. 2021, 11, 484–857. [Google Scholar] [CrossRef]
  18. Abutalebi, J.; Canini, M.; Della Rosa, P.A.; Green, D.W.; Weekes, B.S. The neuroprotective effects of bilingualism upon the inferior parietal lobule: A Structural Neuroimaging Study in Aging Chinese Bilinguals. J. Neurolinguist. 2015, 33, 3–13. [Google Scholar] [CrossRef] [Green Version]
  19. Pan, L.; Yong, Y.; Jovicich, J.; De Pisapia, N.; Wang, X.; Zuo, C.S.; Levitt, J.J. Static and dynamic posterior cingulate cortex nodal topology of default mode network predicts attention task performance. Brain Imaging Behav. 2015, 10, 212–225. [Google Scholar]
  20. Shao, Y.; Wang, L.; Ye, E.; Jin, X.; Ni, W.; Yang, Y.; Wen, B.; Hu, D.; Yang, Z. Decreased thalamocortical functional connectivity after 36 hours of total sleep deprivation: Evidence from resting state FMRI. PLoS ONE 2013, 8, e78830–e78835. [Google Scholar] [CrossRef]
  21. Schmitt, A.; Upadhyay, N.; Martin, J.A.; Rojas, S.; Strüder, H.K.; Boecker, H. Modulation of Distinct Intrinsic Resting State Brain Networks by Acute Exercise Bouts of Differing Intensity. Brain Plast. 2019, 5, 39–55. [Google Scholar] [CrossRef] [PubMed] [Green Version]
  22. Coco, M.; Perciavalle, V.; Cavallari, P.; Perciavalle, V. Effects of an Exhaustive Exercise on Motor Skill Learning and on the Excitability of Primary Motor Cortex and Supplementary Motor Area. Medicine 2016, 95, e2978–e2986. [Google Scholar] [CrossRef]
  23. Latora, V.; Marchiori, M. Efficient behavior of small-world networks. Phys. Rev. Lett. 2001, 87, 198701–198704. [Google Scholar] [CrossRef] [PubMed] [Green Version]
  24. Miraglia, F.; Tomino, C.; Vecchio, F.; Gorgoni, M.; De Gennaro, L.; Rossini, P.M. The brain network organization during sleep onset after deprivation. Clin. Neurophysiol. 2021, 132, 36–44. [Google Scholar] [CrossRef] [PubMed]
  25. Liu, Y. The Research of Brain Functional Network Characteristics under Mental Fatigue Based on EEG; Academy of Military Sciences: Beijing, China, 2018. [Google Scholar]
  26. Tamburro, G.; di Fronso, S.; Robazza, C.; Bertollo, M.; Comani, S. Modulation of Brain Functional Connectivity and Efficiency During an Endurance Cycling Task: A Source-Level EEG and Graph Theory Approach. Front. Hum. Neurosci. 2020, 14, 243–252. [Google Scholar] [CrossRef]
  27. Wang, J.; Lu, M.; Fan, Y.; Wen, X.; Zhang, R.; Wang, B.; Ma, Q.; Song, Z.; He, Y.; Wang, J.; et al. Exploring brain functional plasticity in world class gymnasts: A network analysis. Brain Struct. Funct. 2016, 221, 3503–3519. [Google Scholar] [CrossRef]
Figure 1. General experimental flow chart for Control and SD groups.
Sustainability 14 16175 g001
Figure 2. EEG data acquisition and pre-processing (A) EEG data acquisition; (B) Raw EEG data; (C) Processed EEG data.
Sustainability 14 16175 g002
Figure 3. Pre-exercise network distribution of two groups of adolescents (control group; SD: sleep-deprivation group; SD vs. control: difference between the two groups). Note: ↑ indicates increase, ↓ indicates decrease, ‒ indicates insignificant change, *: p < 0.05.
Sustainability 14 16175 g003
Figure 4. Post-exercise network distribution for two groups of adolescents (control group; SD: sleep-deprivation group; SD vs. control: difference between the two groups). Note:↑ indicates increase, ↓ indicates decrease, ‒ indicates insignificant change, *: p < 0.05, ***: p < 0.001.
Sustainability 14 16175 g004
Figure 5. Comparative results of brain function network indicators in two groups of adolescents at different sparsity thresholds before exercise. Note: Thresholds are 0.1 ≤ T ≤ 0.6; red represents the professional group and blue represents the amateur group; the line graphs represent comparisons at the sparsity threshold; the bar graphs represent comparisons after the presence of the significant difference threshold. *: p < 0.05, *** p < 0.001.
Sustainability 14 16175 g005
Figure 6. Comparative results of functional brain network indicators in two groups of adolescents after exercise at different sparsity thresholds. *: p < 0.05, **: p < 0.01, ***: p < 0.001.
Sustainability 14 16175 g006
Table 1. Subject demographic characteristics (n = 30).
VariableResults
Age (years)21.97 ± 2.14
Height (Cm)178 ± 5.33
Weight (Kg)70.21 ± 8.37
BMI (Kg/m2)22.02 ± 2.14
Skeletal Muscle (%)39.48 ± 3.72
Body Fat (%)13.92 ± 4.63
Basal metabolism/d (Kcal)1883 ± 187.2
Training time (years)3.52 ± 0.45
Table 2. Exercise loads at all levels of the Bruce Protocol.
ParametersLevel 1Level 2Level 3Level 4Level 5Level 6Level 7
Speed (km/h)2.74.05.46.78.08.89.6
Slope (%)10121416182022
Duration (min)3333333
Table 3. Evaluation results of the exercise model (n = 30).
Sleep Sleep
Time (h)
Condition of Exerciser Termination Exercise
Duration (min)
BehaviorSBP (mmHg)DBP (mmHg)HRmaxRPE > 18
Control≥7 hBreath difficulty156.47 ± 18.5677.56 ± 14.12189.47 ± 12.3519.24 ± 1.1519.20 ± 3.07
SD<4 hBreath difficulty159.71 ± 27.4587.77 ± 25.12196.85 ± 17.4819.93 ± 0.9016.95 ± 2.77 **
Note: Compared to control group, **: p < 0.01.
Publisher’s Note: MDPI stays neutral with regard to jurisdictional claims in published maps and institutional affiliations.