Abstract
Fluctuation in a fuel cell’s output power affects its service life. This paper aims to explore the relationship between power output fluctuation and energy consumption and the cost of the fuel cell system. Hence, based on the actual driving information of vehicles, a novel multi-objective energy management strategy (EMS) for fuel cell buses (FCBs) that quantifies fuel cell life as operating cost is proposed. The actual driving data of FCBs on bus line 727 in Zhengzhou, China, were collected. Based on this, considering the degradation factors of the fuel cell and power battery hybrid energy system, a multi-objective cost framework was established to quantify the life degradation as consumption cost. Furthermore, the influence of different power change limits on the performance of the EMS was analysed based on real-world driving data and the typical Chinese city bus driving cycle, respectively. The simulation results show that the degradation cost of the fuel cell can be effectively reduced when the power change limit is 1 kW, and the simulation results obtained using real-world driving data are very different from those obtained using typical city bus driving cycles. This study provides a reference for the application of a vehicle energy management strategy in real-world scenarios as well as highlights its significance.
1. Introduction
In recent years, social problems such as energy shortage and environmental pollution caused by fuel combustion have become increasingly severe, which has strongly promoted the development of new energy vehicles. Fuel cell vehicles have attracted extensive attention from all sectors of society due to the characteristics of high energy conversion efficiency and zero emission [1].
However, since fuel cells cannot recover energy and respond slowly when they are used as a single power source, additional energy sources such as batteries or supercapacitors are generally added as an auxiliary power to form fuel cell hybrid electric vehicles (FCHEVs). Moreover, the complex power system structure leads to the total cost of FCHEV being too high to meet the needs of the market, especially the operating cost of the onboard fuel cell and battery system [2]. On the other hand, due to the operational characteristics of the powertrain energy, the complicated and changeable vehicle driving conditions in the actual driving environment will bring a huge burden to the system, thereby reducing the service life and increasing the additional cost [3]. An appropriate energy management strategy (EMS) is currently a viable approach to manage the distribution of power between different energy sources so that the different energy sources can compensate for each other’s power deficits, use hybrid systems efficiently and healthily, and reduce FCB operating costs [4]. EMSs for hybrid drive systems have been developed into two main categories: rule-based EMSs and optimisation-based EMSs. Rule-based EMSs include those based on deterministic and fuzzy rules, formulated based on engineering experience by defining a series of rules for the operation of vehicle power systems to determine the working state of the power drive system. This method is technically inexpensive, the amount of online calculation is small, and the industrial application is widely used [5]. The EMSs based on optimisation use the optimisation algorithm to search for the optimal or suboptimal control strategy of the system control objective function, which is generally manifested as the problem of finding the minimum value of the objective function in the feasible domain, which can be divided into global optimal control strategy and real-time optimal control strategy [6].
In contrast, rule-based EMSs are the most common way to achieve energy management in FCHEV industrial applications [7]. Currently, the most common rule-based EMS for FCEVs mainly includes state machine control methods, power follower control methods, and fuzzy logic control strategies [8,9]. Banvait, H. et al. developed and established state machine models to achieve power distribution control by executing predefined control rules or logical thresholds [10]. Chen, Z. et al. used the rules extracted from the optimisation results of 12 typical driving cycles, from which a rule-based EMS was proposed, and the results showed that it can effectively reduce hydrogen consumption [11]. Trovao, JP. et al. proposed an EMS for assembling rules by combining long-term rules to dynamically limit the search state space with short-term rules for implementing decisions [12]. Thounthong et al. proposed an EMS based on fuel cell/supercapacitor flatness characteristics to improve system stability [13]. T. Wang et al. proposed an EMS for air-cooled fuel cell system based on a state machine, which was verified on the established hybrid test platform [14]. The above studies have conducted extensive and in-depth research on the rulemaking of energy management; however, they did not consider the operating characteristics of fuel cell systems and may be ineffective in practical applications.
Some existing EMSs seek to minimise hydrogen consumption and battery equivalent consumption in fuel cells [15,16]. However, these performance indicators are only partially representative of the operating costs of the vehicle, as energy degradation can also increase the operating expenses of the vehicle. Therefore, to comprehensively assess the economics of FCB, several studies have incorporated energy degradation factors into the decision-making framework, resulting in a multi-objective EMS [17]. Y. Zhou et al. mitigated the degradation of fuel cells by limiting their power transients, further reducing operating costs based on H2 minimisation strategies [18]. Y. Zhou et al. proposed an MPC-based EMS comprehensively considering fuel cell efficiency and degradation [19]. J. P. Ribau et al. applied single-objective and multi-objective genetic algorithms to optimise the powertrain design of fuel cell vehicles to improve system efficiency and extend service life [20]. Aiming at the fuel economy and system durability of fuel cell hybrid energy systems, Xu et al. established a dual-cycle energy management framework based on a dynamic programming algorithm to solve this multi-objective optimisation problem [21]. Although the above studies have conducted detailed and extensive research on EMSs, most researchers currently use data sets of typical standard driving cycles, which may influence the performance of EMSs in practical applications.
In order to comprehensively evaluate the economy of a fuel cell hybrid system, this paper combines the control strategy based on Charge-Depleting–Charge-Sustaining (CD-CS) rules with a multi-objective function framework to improve the practicability of the control strategy and uses real-world driving data for simulation validation. The structure of the full text is shown in Figure 1.
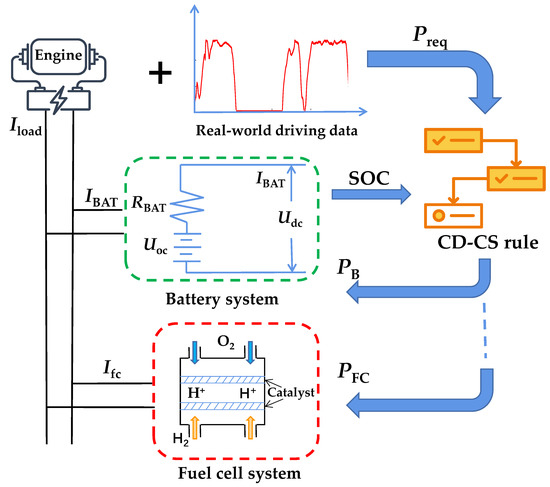
Figure 1.
The structure of the full text.
The contributions of this article are as follows:
- (1)
- This paper proposes a multi-objective cost function framework that can specifically quantify energy degradation as operating costs to represent the impact of energy degradation visually;
- (2)
- The effects of fuel cell power output fluctuation on the life and hydrogen consumption of a fuel cell/battery hybrid system were studied, and it was found that, the more stable the fuel cell power output, the smaller the life degradation of the fuel cell/battery hybrid system and the lower the operating cost;
- (3)
- Comparing real-world speed information with typical standard driving cycles, it is found that, in the real world, the working conditions change more drastically, the energy consumption is greater, and the smoother the fuel cell power output, the better the adaptability of the fuel cell system to complex working conditions.
2. System Model
This paper adapts an FCB powertrain for research, and the hybrid system studied consists of a proton exchange membrane fuel cell (PEMFC) system as the main energy source and a lithium-ion power battery system as a secondary energy source. The fuel cell system is connected in parallel with the battery system to the DC bus; moreover, the fuel cell is connected to the DC bus by an additional DC-DC converter to regulate the output current. This is shown in Figure 2. The main component parameters of the powertrain are listed in Table 1.
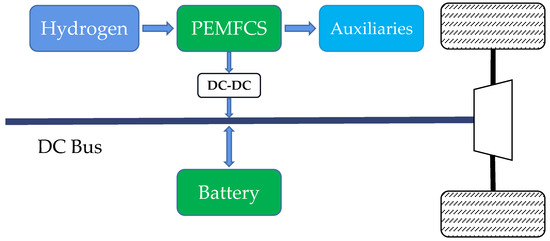
Figure 2.
Configuration of the FCB.

Table 1.
Main vehicle parameters.
2.1. Vehicle Dynamics Model
Based on the longitudinal dynamics of the vehicle, the vehicle demand power () can be calculated as:
where is the velocity, is the rolling resistance coefficient, is the vehicle weight, is the gravitational acceleration, is the air density, is the windward area, is the coefficient of aerodynamic drag, is the vehicle acceleration, is the road slope ().
The fuel cell system and battery system provide output power to the DC bus together, and the power balance relationship is represented by Equation (2):
where is the DC bus demand power, is the fuel cell output power, is the battery output power, ,, and are the efficiency of the driveline, electric machine, and DC-DC converter, respectively.
2.2. Fuel Cell Model
In this paper, a PEMFC system with a rated power of 50 kW is used for research. During the outgoing output of the PEMFC, the mass of hydrogen consumed () can be expressed as
where is the efficiency of the PEMFC system, is the power output by hydrogen combustion, and is the calorific value of hydrogen, and its smaller value (120,000 J/g) is chosen here.
The working principle of the PEMFC system durability is complex, involving multiple dimensions and levels, and there is currently no unified PEMFC degradation model. As reported in [22], the performance of fuel cell catalysts, the membrane electrode assembly (MEA), and the inherent state of the plates and the working state are the key factors affecting the output characteristics and durability of fuel cells [23]. However, an important reason for the degradation of fuel cell performance is the harsh operating conditions. Harsh operating conditions lead to changes in its active electrochemical area, hydrogen leakage current, and catalyst layer structure, which will cause the performance of fuel cells to decline. Therefore, the research on fuel cell performance degradation can be simplified to the study of the degradation mechanism of four harsh working conditions: shutdown and reactivation of the fuel cell system, variable loading, high loading, and low loading.
Thus, energy management should limit these operating conditions as much as possible. The shutdown and reactivation of fuel cells will have a significant negative impact on life [24]; moreover, because previous studies have been conducted, this article did not repeat it, and PEMFC is always kept on in this paper. As for other fuel cell degrading effects, when the output power reaches more than 80% of the rated power: , it is defined as high loading. Under this working condition, the degradation of the fuel cell is manifested as voltage degradation, and the voltage drop per hour is . Similarly, when the fuel cell output power is less than 20% of the rated power: , it is defined as a low loading, and the voltage drop per hour is , correspondingly. In the variable load working condition, the fuel cell is affected by the change of output power in a short period of time, and the voltage drop caused by every 1 kW of load change is . The specific parameters adopted are listed in Table 2.
Table 2.
PEMFCS degradation rate (cell level).
The effects of each loading on fuel cell degradation are independent of each other and do not affect each other, therefore they can be directly summed up as the total degradation of fuel cells [23].
2.3. Battery Model
In this paper, a lithium-ion battery with a rated power of 100 kW and the nominal energy capacity of 15.19 kWh is used for research. The equivalent internal resistance model is used to establish the power battery model, whose configuration is shown in Figure 3. The bus voltage can be expressed as:
where UOC is the open-circuit voltage, Udc is the DC bus voltage, IBAT is the battery current, RBAT is the internal resistance.
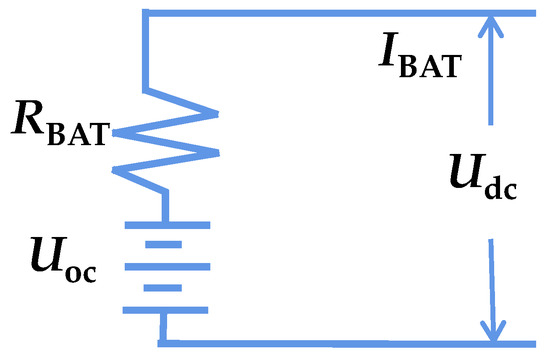
Figure 3.
Equivalent internal resistance model of power battery.
The battery state of charge (SoC) can be calculated by:
where QBAT is the nominal capacity of the battery pack (Ah), SoCini is the initial SoC, is the battery charge–discharge conversion efficiency (when the battery is discharged = 1, = 0.95 when charging).
With the usage of batteries, degradation is inevitable. The change in the internal stability of the battery is an important reason for its ageing, and the life decay of the lithium battery is manifested as an increase in internal resistance, decreasing in charge and discharge capabilities and causing a decrease in battery capacity [25]. In this paper, a semi-empirical model proposed by [26] is used to establish an accurate battery life decay model, which considers the battery life decay of accelerated power such as charge–discharge rate, SOC, and temperature factors, the expression of which is:
where is the percentage loss of battery cell capacity (%), is the battery current rate, B is the pre-exponential coefficient, as listed in Table 3, Ea is the activation energy, R is the molar gas constant, T is the temperature, Ah is the cumulative charge, and z = 0.55 is the power–law coefficient. The literature [26] identifies the parameters based on experimental data, and the expression of Ea is denoted by:
Table 3.
Pre-exponential factor as a function of the crate.
Usually, when the battery capacity reaches 80% of the total capacity, it is considered to be the end of life (EoL) of a power battery [27], and the degree of battery capacity attenuation during charging and discharging is characterised by the effective charge:
When the battery reaches the EoL, the number of battery charge and discharge cycles can be expressed as [28]:
Hence, the battery state of health (SoH) can be represented by the following equation [28]:
where the SoH initial setting to 100% and icell is the current from a single cell.
2.4. Multi-Objective Cost Framework
To quantify the life degradation as a consumption cost, a multi-objective cost function framework is proposed. The total cost of the hybrid energy system can be expressed as follows:
where is the operating cost due to hydrogen consumption during the driving of the vehicle, which can be calculated from the following equation:
where is the price of hydrogen in the international market, is the mass of hydrogen consumed.
The fuel cell degradation cost () is expressed as follows:
where Ccycle is the operating cost of fuel cell degradation caused by the vehicle start–stop cycle, which is not considered in this article and is set to 0.
In addition, the cost of fuel cell degradation due to heavy and light loading during vehicle operation can be expressed as:
where and are the cumulative time that the vehicle operates under high loads and low loads, respectively, and is the price of the fuel cell stack.
The degradation cost of fuel cell degradation due to variable loading can be calculated as:
where is the number of cells in the stack.
The operating costs due to battery degradation can be calculated by the following equation:
where , and is the price of the battery pack.
The relevant parameters used to calculate the cost of each degradation and the cost of hydrogen consumption are shown in Table 4.
Table 4.
Parameters for calculating the hybrid energy system’s degradation cost.
2.5. Constraints
In the operation of the fuel cell hybrid powertrain, the relevant parameters of the fuel cell/battery hybrid energy system need to be constrained to ensure the normal operation of the system. The constraints are shown in the following:
where , , , , , .
3. Rule-Based EMS
3.1. Energy Management Strategy Rule Description
A CD-CS strategy is adopted to solve the energy management problem of FCB. On the basis of meeting the power demand, according to whether the power battery power is sufficient, the operation process of the fuel cell/battery hybrid system is divided into two modes: CD and CS. Under CD mode (when SoC ≥ 0.6), the battery has sufficient power, and the proposed energy management strategy is biased towards battery operation. The battery is the main power source and undertakes most of the power output tasks. The fuel cell operates at a smaller output power (as shown in Figure 4), which, in most cases, is set at 15 kW. On the one hand, it not only ensures that the fuel cell can work at high work efficiency and alleviate its degradation, on the other hand, the energy consumption of the power battery is also conducive to energy recovery and to prevent its SoC from exceeding the limit (SoC ≥ 0.9), reducing the service life. When the battery SoC is depleted to a predetermined level (when SoC < 0.6), that is, CS mode, the roles of fuel cells and batteries in terms of power output are interchanged, and fuel cells become the main source of energy, while their output is kept as much as possible at 15 kW to work as efficiently as possible. The power battery recovers energy as much as possible to prevent its SoC from dropping to dangerous levels (SoC ≤ 0.3) and reducing its service life. The detailed control strategy is shown in Figure 4.
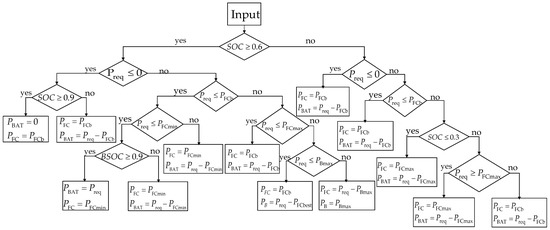
Figure 4.
The CD-CS rule-based EMS, where PFCb is the fuel cell output power at the efficient working range, PFCb = 15 kW, PFCmin is the fuel cell minimum output power, PFCmin = 3 kW, PFCmax is the fuel cell maximum output power, PFCmax = 50 kW, PBmax is the battery maximum output power, PBmax = 100 kW.
3.2. Verification of the Effectiveness of Energy Management Strategies
Setting different initial SoC values to simulate the situation of the battery’s sufficient and insufficient power output, the changes of power battery SoC and fuel cell’s output power are studied to verify the effectiveness and reasonableness of the proposed EMS.
The real-world data used in this article is derived from some operating conditions of bus route 727 in Zhengzhou, China, as shown in Figure 5, which is adopted as the test cycle, and the simulation results are shown in Figure 6.
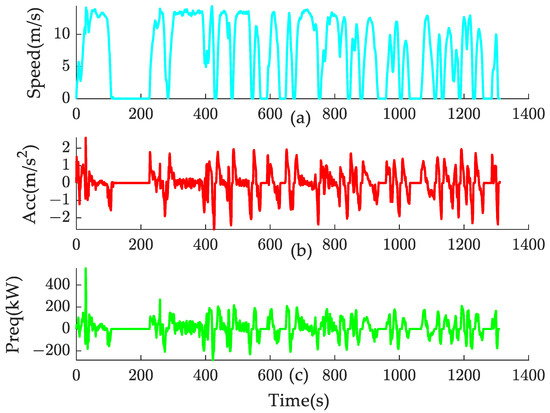
Figure 5.
(a) The FCB speed of bus route 727 in Zhengzhou, China; (b) the FCB acceleration of bus route 727 in Zhengzhou, China; (c) the FCB demand power of bus route 727 in Zhengzhou, China.
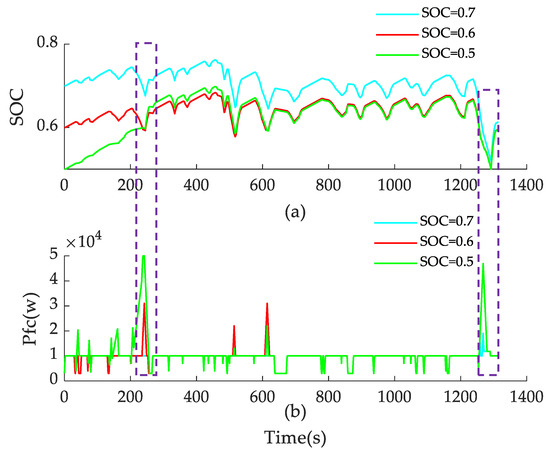
Figure 6.
(a) The battery power changes under different initial SOC; (b) the fuel cell output power changes under different initial SOC.
It can be seen from Figure 6 that, under different initial SOC values, the battery SOC change trend is similar, and they quickly enter the CD-CS mode to maintain the long-term stability of the SOC = 0.6; moreover, the fuel cell output power is maintained at about 15 kW (the highest efficiency working area of the fuel cell) most of the time, which verifies the effectiveness of the proposed strategy. When t = 225 s and t = 1273 s, the battery SOC drops sharply, while the rises rapidly, which prevents the battery from reducing its life due to low SOC while meeting the power output demand, which verifies the rationality of the proposed EMS.
4. Simulation and Results
In this section, the multi-objective cost function framework proposed in Section 2 and the EMS based on the CD-CS rule and real-world driving data proposed in Section 3 are used to study the impact of fuel cell energy output fluctuations on fuel cell/battery hybrid systems. Specifically, this is achieved by setting different fuel cell output power control step limits (), and six cases of , , , , , and are considered.
Considering the impact of load changes on fuel cell life, the influence of the fuel cell power control step limit on the total cost of the hybrid power system was investigated. The optimised cost outcome is shown in Figure 7.
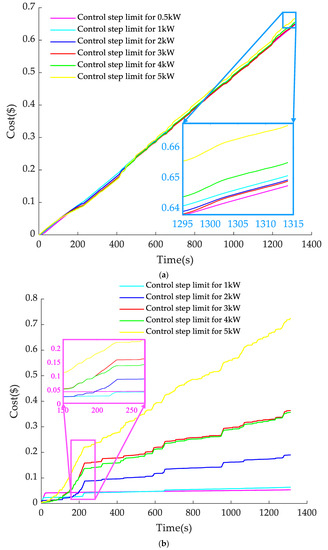
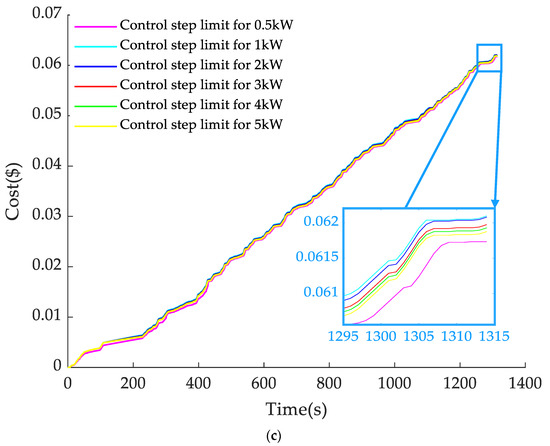
Figure 7.
(a) The cost of hydrogen; (b) the cost of fuel cell degradation; (c) the cost of battery degradation.
From Figure 7a, the simulation results show that the hydrogen cost under different control step limits increases steadily with the vehicle running; however, it is affected very little by the different power control limits. When , reaches the minimum value, 0.6476 USD. In the whole driving cycle, is always the lowest under , compared to other control step limits.
From Figure 7b, the simulation results show that, with the gradual increase in , presents an upward trend and is significantly affected by different power control limits. When , reaches the minimum value, 0.0535 USD; moreover, when , reaches the maximum value, 0.7241 USD, jumping from 8% to 49% of the total cost, greatly affecting the total cost. This may be due to the slow working characteristics of the fuel cell dynamic response. The smaller the control step limit size, the better the energy management effect, and the fuel cell works stably.
From Figure 7c, the simulation results show that with increasing gradually, increases steadily, and it is also affected very little by the different power control limits. The overall value is around 0.0620 USD. This shows that fuel cell power fluctuations have little impact on the battery system.
Specific numerical results are shown in Table 5. From Table 5, the hydrogen cost contributes the most, accounting for about 45–83% of the total costs; the fuel cell degradation cost constitutes the second largest expense, accounting for about 8–49% of the total costs; the battery degradation cost is the smallest, accounting for about 4–8% of the total costs. The reason for the large fluctuation is that the cost of fuel cell degradation is significantly affected by the change of different power control step limits. Moreover, fuel cell degradation has a significant impact on the total cost, far greater than the single-factor hydrogen consumption considered by the traditional EMS. Therefore, the study of fuel cell/battery lifetime is necessary, and it provides a feasible idea for future research.
Table 5.
Cost under different fuel cell power control step limits.
From the above results, it can be seen that the fuel cell power control limit significantly impacts fuel cell degradation, and a smaller fuel cell power control limit will help improve the service life of the fuel cell and reduce the cost of use.
This paper also conducts a comparative study based on the standard China city cycle to find the difference between real-world data and typical driving cycles. The standard China city cycle is shown in Figure 8.
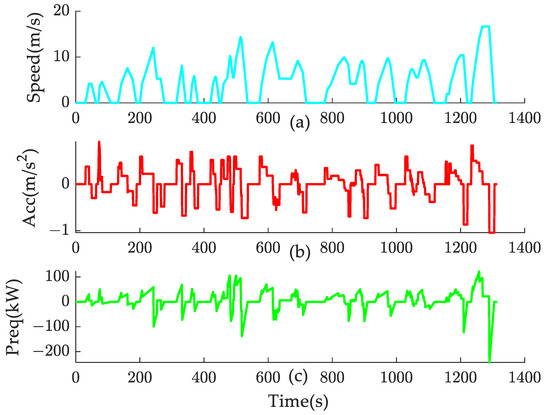
Figure 8.
(a) Standard China city driving cycle; (b) the FCB acceleration under Standard China city driving cycle; (c) the FCB demand power under Standard China city driving cycle.
The , , and under different power control limits are shown in Figure 9, and the specific values are shown in Table 6.
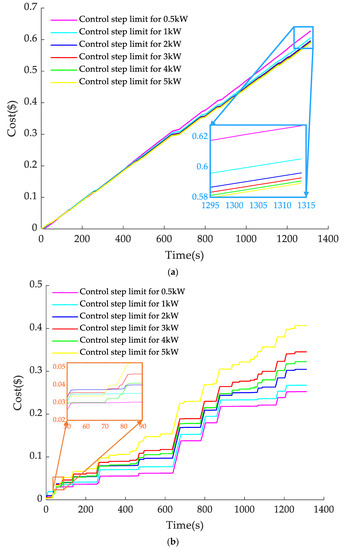
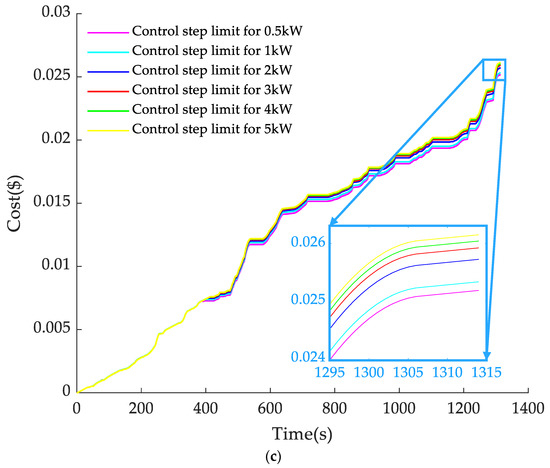
Figure 9.
(a) The cost of hydrogen; (b) the cost of fuel cell degradation; (c) the cost of battery degradation.
Table 6.
Cost under different fuel cell power control step limits.
From Figure 9a, the hydrogen cost under the different control step limits’ trends is roughly the same as shown in Figure 7a; however, the value is reduced by about 7%, and, when , reaches the minimum value, 0.5879 USD.
From Figure 7b and Figure 9b, the simulation results show that, with a gradual increase in , presents a similar trend; however, the final values vary wildly. The difference between the minimum and maximum values of in Table 6 is about 1.6 times, while, in Table 5, the gap widens to 11.33 times. The reason may be that real-world vehicle speeds change more frequently, and fuel cell hybrid systems are more burdensome, leading to greater energy degradation. More granular energy output can effectively alleviate this situation, as can be seen from the fact that the minimum value of in Table 5 is nearly 76% smaller than the minimum value of in Table 6. It also shows that, with an increase in , the adaptability of fuel cell hybrid systems to more complex traffic environments decreases significantly. This shows that more detailed control of fuel cell output power can not only reduce the degradation of fuel cells but can also improve the adaptability of fuel cells to complex working conditions.
From Figure 7c and Figure 9c, the overall trend of is similar; however, in Table 5 has increased by about three times compared to in Table 6, indicating that frequent load changes also have a significant impact on the life of the battery system.
From Table 6, the hydrogen cost contributes the most, accounting for about 57.6–67.4% of the total costs. The PEMFCS degradation cost constitutes the second most considerable expense, accounting for about 29.8–39.8% of the total costs, and the battery degradation cost is the smallest, accounting for about 2.57–2.8% of the total costs. Compared with Table 5, the cost of each part in Table 6 is more negligible, and the change in the proportion of the total cost is relatively more stable, especially in the cost of fuel cell degradation, showing a vast difference.
5. Conclusions
In this study, the influence of fuel cell system output power fluctuation on the fuel cell/battery hybrid system is analysed from the perspective of fuel cell/battery hybrid system life and hydrogen consumption, and a multi-objective cost function framework that can specifically quantify degradation life as a consumption cost is proposed. The findings of this study are summarised below.
5.1. Main Finding
- (1)
- By setting different fuel cell output power limits, the influence of the fuel cell system output power fluctuations on hybrid systems is studied. The results show that the smaller the power control limit of the fuel cell system, that is, the more stable the fluctuation of the output power of the fuel cell system, the stronger the adaptability of the fuel cell system to complex working conditions, the more conducive it is to reduce the degradation of the fuel cell and extend the service life, thereby reducing the total operating cost;
- (2)
- Using the driving vehicle data collected from the 727 fuel cell bus in Zhengzhou, China, this was compared with the standard China city cycle. The results show that the fuel cell/battery hybrid system exhibits more operating characteristics than a typical standard driving cycle in real-world driving data, which shows the practical significance of using real-world data.
5.2. Future Work
First, this paper ignores the energy consumption of auxiliary equipment in fuel cell systems, such as hydrogen circuits, air circuits, water circuits, and coolant circuits, which may affect the accuracy of the conclusions of this paper. Therefore, it will be further studied in the future. Second, the energy management strategy adopted in this paper has poor optimality, which will affect the accuracy of the conclusion. Thus, a more optimised energy management method will be adopted based on the multi-objective cost function framework proposed in this paper. Third, this paper considers the impact of the fuel cell output power fluctuations on hydrogen consumption and the life of hybrid systems. In the future, we will conduct more extensive research on factors such as battery thermal effects and the energy consumption of onboard equipment. Finally, if conditions permit, vehicle experiments will carry out strategy verification.
Author Contributions
Conceptualisation, M.L. and M.Y.; methodology, H.L.; software, H.H.; validation, H.X.; formal analysis, H.X.; investigation, H.L.; resources, M.L. and M.Y.; writing—original draft preparation, H.L.; writing—review and editing, H.L.; visualisation, H.L. All authors have read and agreed to the published version of the manuscript.
Funding
This research was funded by the National Natural Science Foundation of China (Grand No. 52202484), Hebei Natural Science Foundation (Grand No. F2021203118), Beijing Natural Science Foundation (Grand No. J210007) and the Science and Technology Project of Hebei Education Department (Grand No. QN2022093).
Institutional Review Board Statement
Not applicable.
Informed Consent Statement
Not applicable.
Data Availability Statement
Not applicable.
Conflicts of Interest
The authors declare no conflict of interest.
References
- Das, H.S.; Tan, C.W.; Yatim, A.H.M. Fuel cell hybrid electric vehicles: A review on power conditioning units and topologies. Renew. Sustain. Energy Rev. 2017, 76, 268–291. [Google Scholar] [CrossRef]
- Lü, X.; Wu, Y.; Lian, J.; Zhang, Y.; Chen, C.; Wang, P.; Meng, L. Energy management of hybrid electric vehicles: A review of energy optimisation of fuel cell hybrid power system based on genetic algorithm. Energy Convers. Manag. 2020, 205, 112474. [Google Scholar] [CrossRef]
- Li, H.; Ravey, A.; N’Diaye, A.; Djerdir, A. Online adaptive equivalent consumption minimisation strategy for fuel cell hybrid electric vehicle considering power sources degradation. Energy Convers. Manag. 2019, 192, 133–149. [Google Scholar] [CrossRef]
- Lü, X.; Wang, P.; Meng, L.; Chen, C. Energy optimisation of logistics transport vehicle driven by fuel cell hybrid power system. Energy Convers. Manag. 2019, 199, 111887. [Google Scholar] [CrossRef]
- Hofman, T.; Steinbuch, M.; Van Druten, R.; Serrarens, A. Rule-based energy management strategies for hybrid vehicles. Int. J. Electr. Hybrid Veh. 2007, 1, 71–94. [Google Scholar] [CrossRef]
- Ravey, A.; Blunier, B.; Miraoui, A. Control strategies for fuel-cell-based hybrid electric vehicles: From offline to online and experimental results. IEEE Trans. Veh. Technol. 2012, 61, 2452–2457. [Google Scholar] [CrossRef]
- Shi, J.; Xu, B.; Shen, Y. Energy management strategy for battery/supercapacitor hybrid electric city bus based on driving pattern recognition. Energy 2022, 243, 122752. [Google Scholar] [CrossRef]
- Saiteja, P.; Ashok, B. Critical review on structural architecture, energy control strategies and development process towards optimal energy management in hybrid vehicles. Renew. Sustain. Energy Rev. 2022, 157, 112038. [Google Scholar] [CrossRef]
- Sun, H.; Fu, Z.; Tao, F. Data-driven reinforcement-learning-based hierarchical energy management strategy for fuel cell/battery/ultracapacitor hybrid electric vehicles. Power Sources 2020, 455, 227964. [Google Scholar] [CrossRef]
- Banvait, H.; Anwar, S.; Chen, Y. A rule-based energy management strategy for plug-in hybrid electric vehicle (PHEV). In Proceedings of the 2009 American Control Conference, St. Louis, MO, USA, 10–12 June 2009; pp. 3938–3943. [Google Scholar]
- Chen, Z.; Guo, N.Y.; Zhang, Q.; Shen, J.W.; Xiao, R.X. An optimised rule based energy management strategy for a Fuel Cell/Battery vehicle. In Proceedings of the 2017 IEEE Vehicle Power and Propulsion Conference (VPPC), Belfort, France, 11–14 December 2017; pp. 11–14. [Google Scholar]
- Trovão, J.P.; Pereirinha, P.G.; Jorge, H.M.; Antunes, C.H. A multi-level energy management system for multi-source electric vehicles—An integrated rule-based meta-heuristic approach. Appl. Energy 2013, 105, 304–318. [Google Scholar] [CrossRef]
- Thounthong, P.; Pierfederici, S.; Martin, J.P.; Hinaje, M.; Davat, B. Modeling and control of fuel cell/supercapacitor hybrid source based on differential flatness-control. IEEE Trans. Veh. Technol. 2010, 59, 2700–2710. [Google Scholar] [CrossRef]
- Wang, T.; Li, Q.; Chen, W.; Liu, T. Application of energy management strategy based on state machine in fuel cell hybrid power system. In Proceedings of the 2017 IEEE Transportation Electrification Conference and Expo, Asia-Pacific (ITEC Asia-Pacific), Harbin, China, 7–10 August 2017; pp. 1–5. [Google Scholar]
- Geng, B.; Mills, J.K.; Sun, D. Two-stage energy management control of fuel cell plug-in hybrid electric vehicles considering fuel cell longevity. IEEE Trans. Veh. Technology. 2011, 61, 498–508. [Google Scholar] [CrossRef]
- Fletcher, T.; Thring, R.H.; Watkinson, M.; Staffell, I. Comparison of fuel consumption and fuel cell degradation using an optimised controller. ECS Trans. 2016, 71, 85. [Google Scholar] [CrossRef]
- Liu, Y.; Li, J.; Chen, Z.; Qin, D.; Zhang, Y. Research on a multi-objective hierarchical prediction energy management strategy for range extended fuel cell vehicles. J. Power Sources. 2019, 429, 55–66. [Google Scholar] [CrossRef]
- Zhou, Y.; Ravey, A.; Péra, M.C. Multi-mode predictive energy management for fuel cell hybrid electric vehicles using Markov driving pattern recognizer. Appl. Energy 2020, 258, 114057. [Google Scholar] [CrossRef]
- Zhou, Y.; Li, H.; Ravey, A.; Péra, M.C. An integrated predictive energy management for light-duty range-extended plug-in fuel cell electric vehicle. J. Power Sources 2020, 451, 227780. [Google Scholar] [CrossRef]
- Ribau, J.P.; Silva, C.M.; Sousa, J.M.C. Efficiency, cost and life cycle CO2 optimisation of fuel cell hybrid and plug-in hybrid urban buses. Appl. Energy 2014, 129, 320–335. [Google Scholar] [CrossRef]
- Xu, L.; Mueller, C.D.; Li, J.; Ouyang, M.; Hu, Z. Multi-objective component sizing based on optimal energy management strategy of fuel cell electric vehicles. Appl. Energy 2015, 157, 664–674. [Google Scholar] [CrossRef]
- Chen, H.; Pei, P.; Song, M. Lifetime prediction and the economic lifetime of proton exchange membrane fuel cells. Appl. Energy 2015, 142, 154–163. [Google Scholar] [CrossRef]
- Fletcher, T.; Thring, R.; Watkinson, M. An Energy Management Strategy to concurrently optimise fuel consumption & PEM fuel cell lifetime in a hybrid vehicle. Int. J. Hydrog. Energy 2016, 41, 21503–21515. [Google Scholar]
- Hu, X.; Jiang, J.; Egardt, B.; Cao, D. Advanced power-source integration in hybrid electric vehicles: Multicriteria optimisation approach. IEEE Trans. Ind. Electron. 2015, 62, 7847–7858. [Google Scholar] [CrossRef]
- Xiong, R.; Pan, Y.; Shen, W. Lithium-ion battery aging mechanisms and diagnosis method for automotive applications: Recent advances and perspectives. Renewable and Sustainable Energy Reviews. 2020, 131, 110048. [Google Scholar] [CrossRef]
- Wang, J.; Liu, P.; Hicks-Garner, J.; Sherman, E.; Soukiazian, S.; Verbrugge, M.; Tataria, H.; Musser, J.; Finamore, P. Cycle-life model for graphite-LiFePO4 cells. J. Power Sources 2011, 196, 3942–3948. [Google Scholar] [CrossRef]
- Tang, L.; Rizzoni, G.; Onori, S. Energy management strategy for HEVs including battery life optimisation. IEEE Trans. Transp. Electrif. 2015, 1, 211–222. [Google Scholar] [CrossRef]
- Ebbesen, S.; Elbert, P.; Guzzella, L. Battery state-of-health perceptive energy management for hybrid electric vehicles. IEEE Trans. Veh. Technol. 2012, 61, 2893–2900. [Google Scholar] [CrossRef]


Publisher’s Note: MDPI stays neutral with regard to jurisdictional claims in published maps and institutional affiliations. |
© 2022 by the authors. Licensee MDPI, Basel, Switzerland. This article is an open access article distributed under the terms and conditions of the Creative Commons Attribution (CC BY) license (https://creativecommons.org/licenses/by/4.0/).