


Spatial Analysis of Soil Properties and Site-Specific Management Zone Delineation for the South Hail Region, Saudi Arabia


Abstract
1. Introduction
2. Materials and Methods
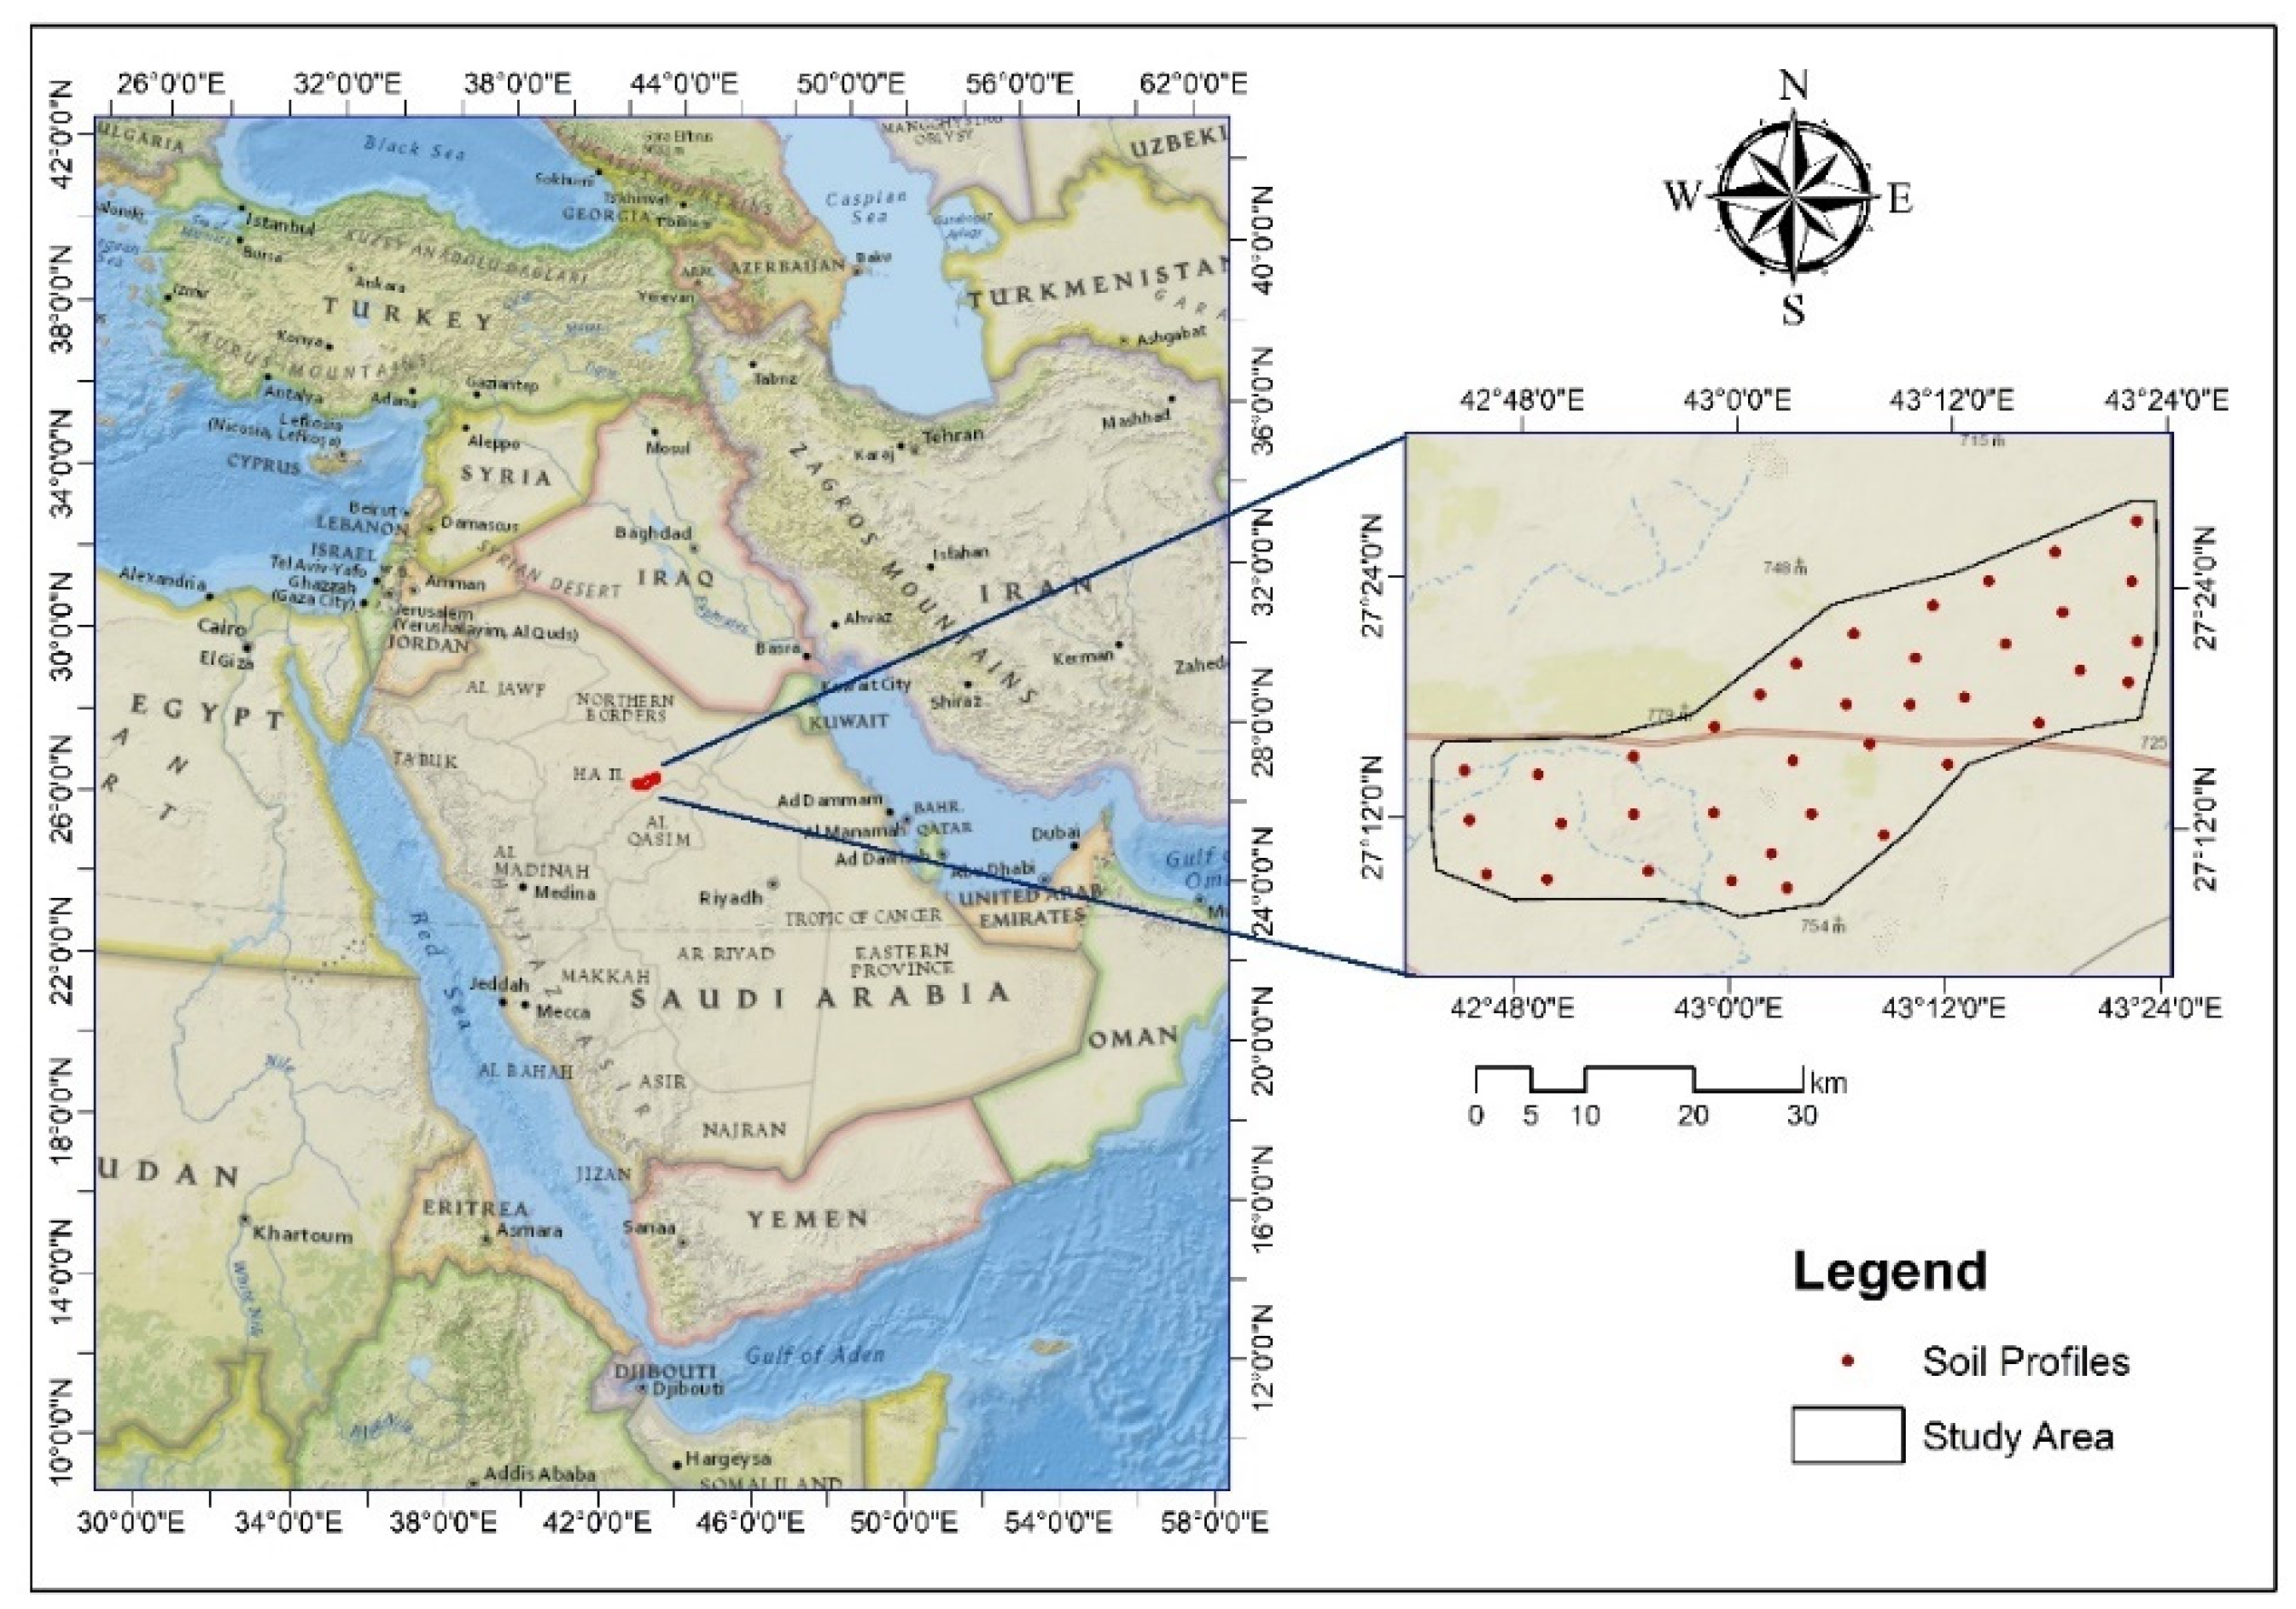
2.1. Study Area
2.2. Fieldwork and Laboratory Analyses
2.2.1. Physical Properties
2.2.2. Chemical Properties
2.2.3. Terrain Analysis
2.3. Statistical Analysis and Principal Component Analysis
2.4. Geostatistical Analysis
2.5. Site-Specific Management Zones
3. Results and Discussion
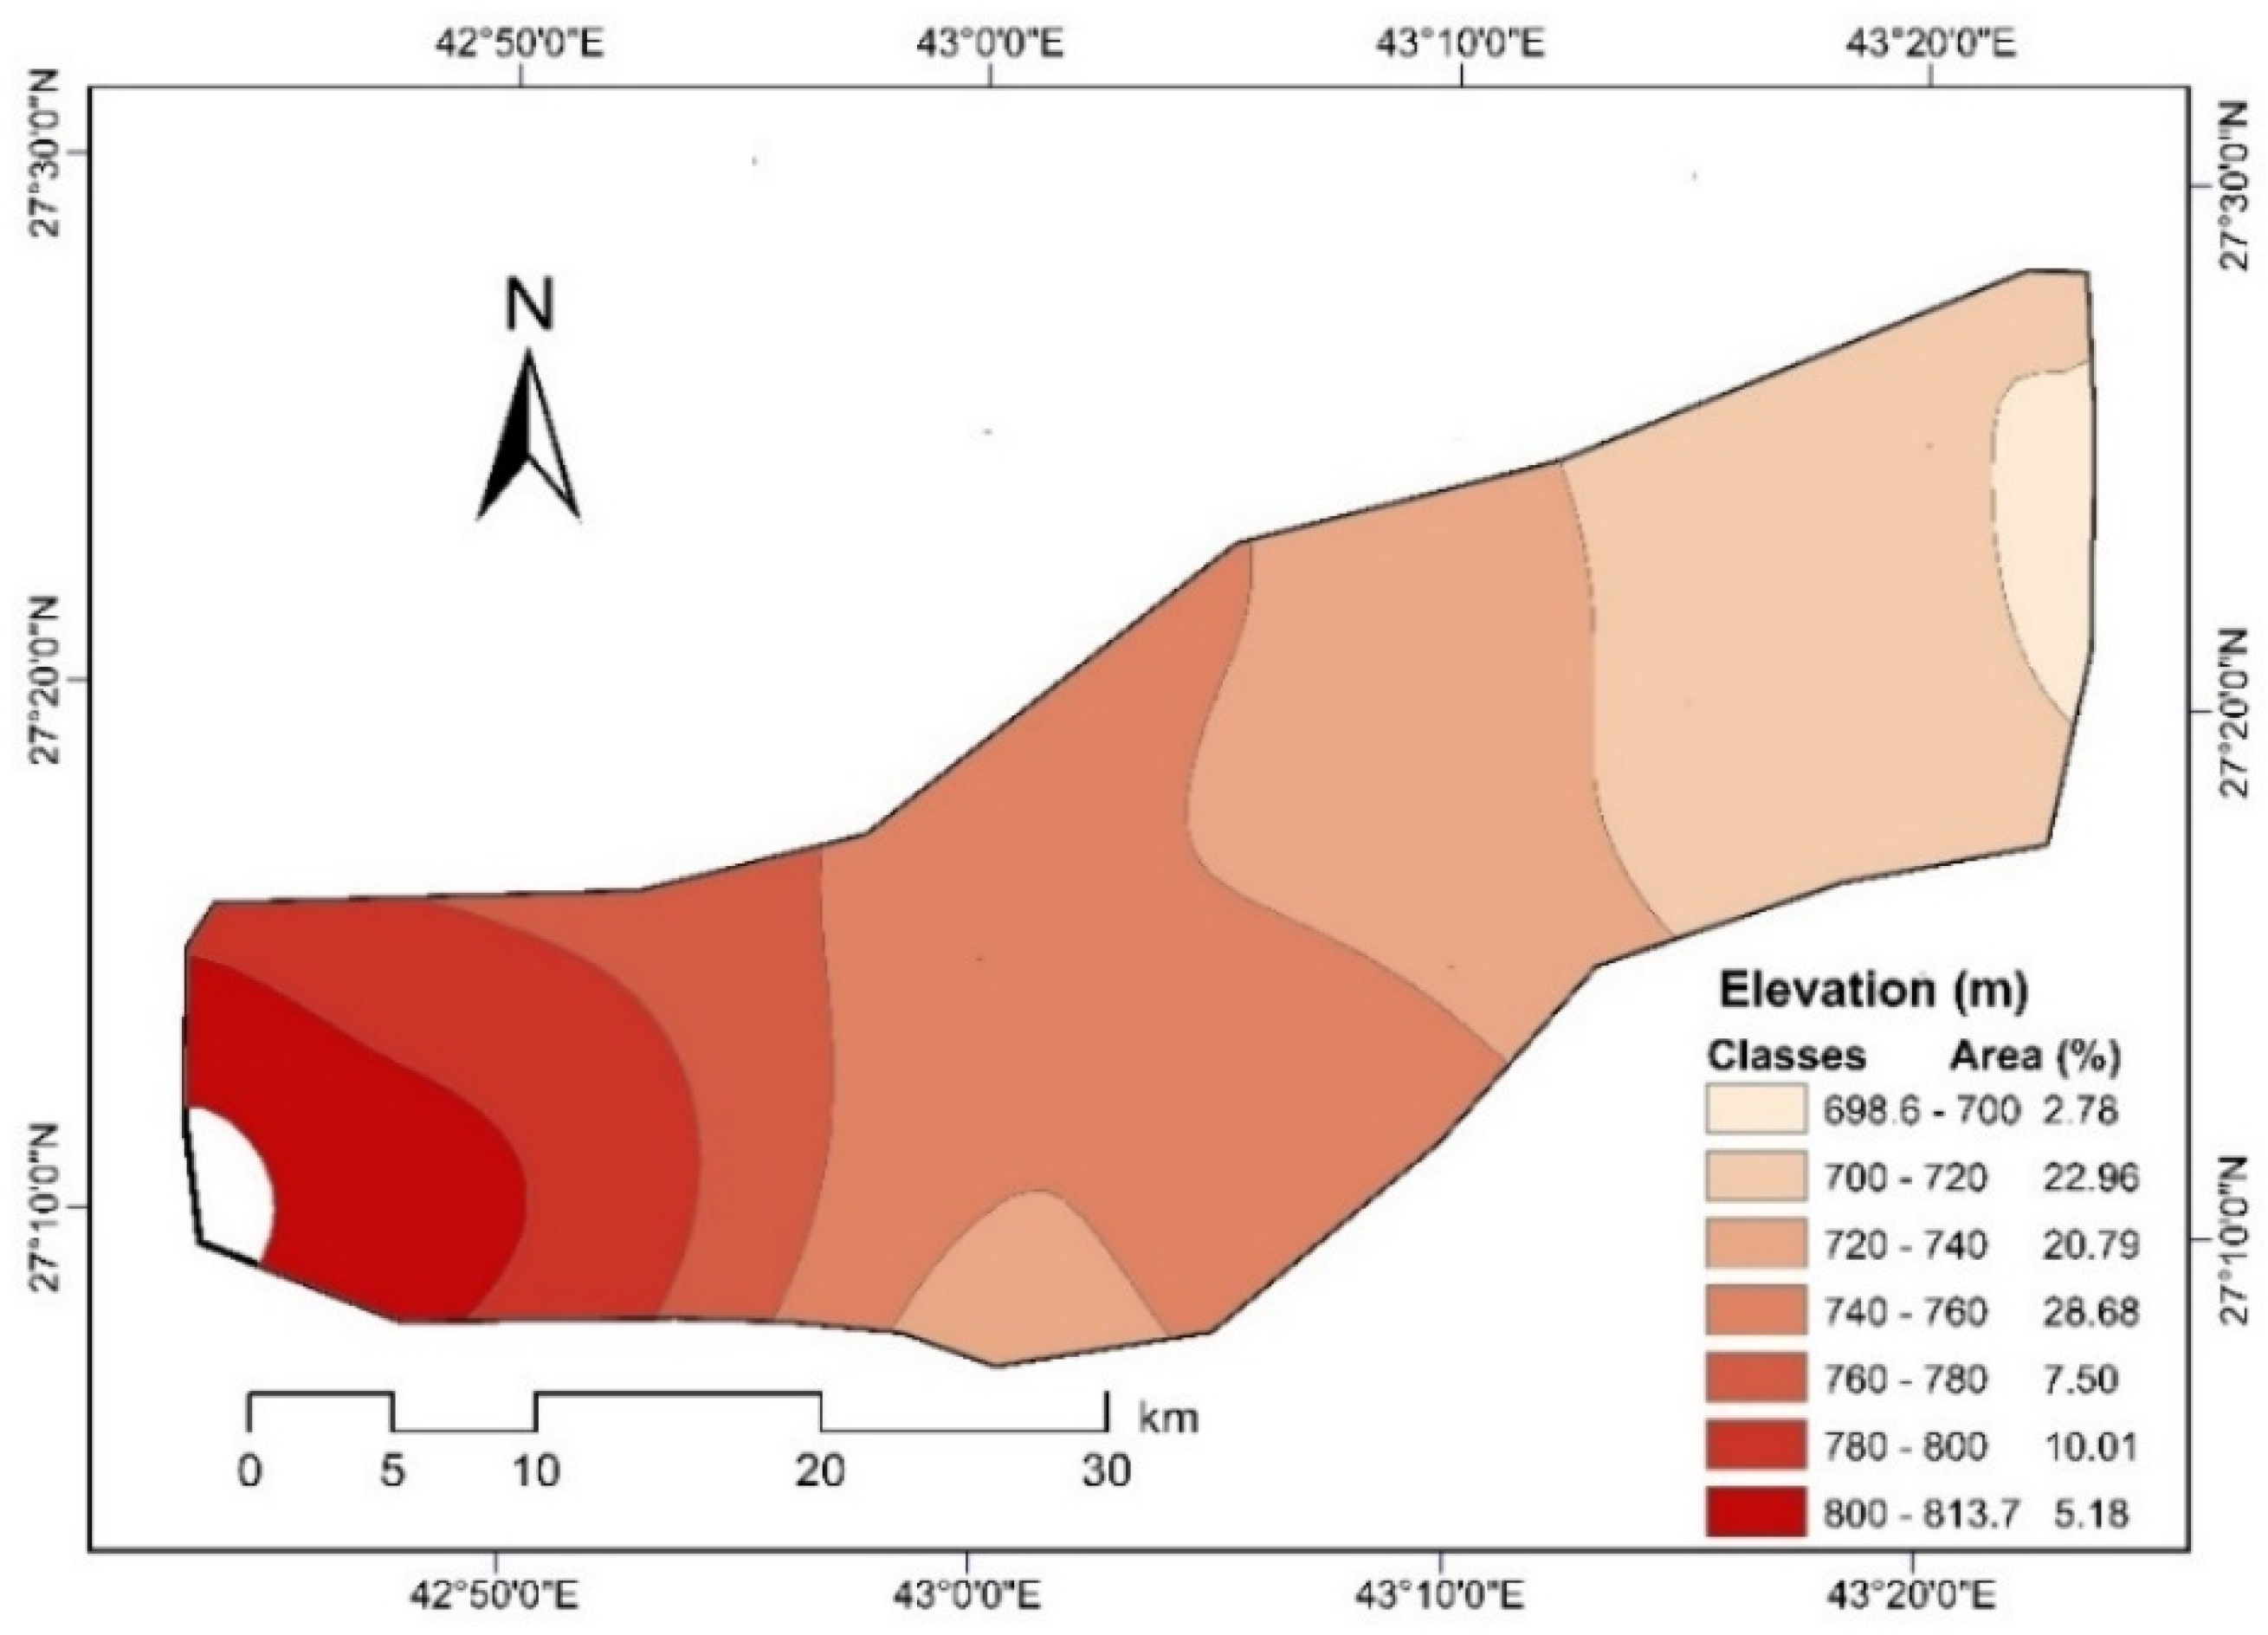
3.1. Terrain Analysis
3.2. Statistical Characterization of the Studied Soil
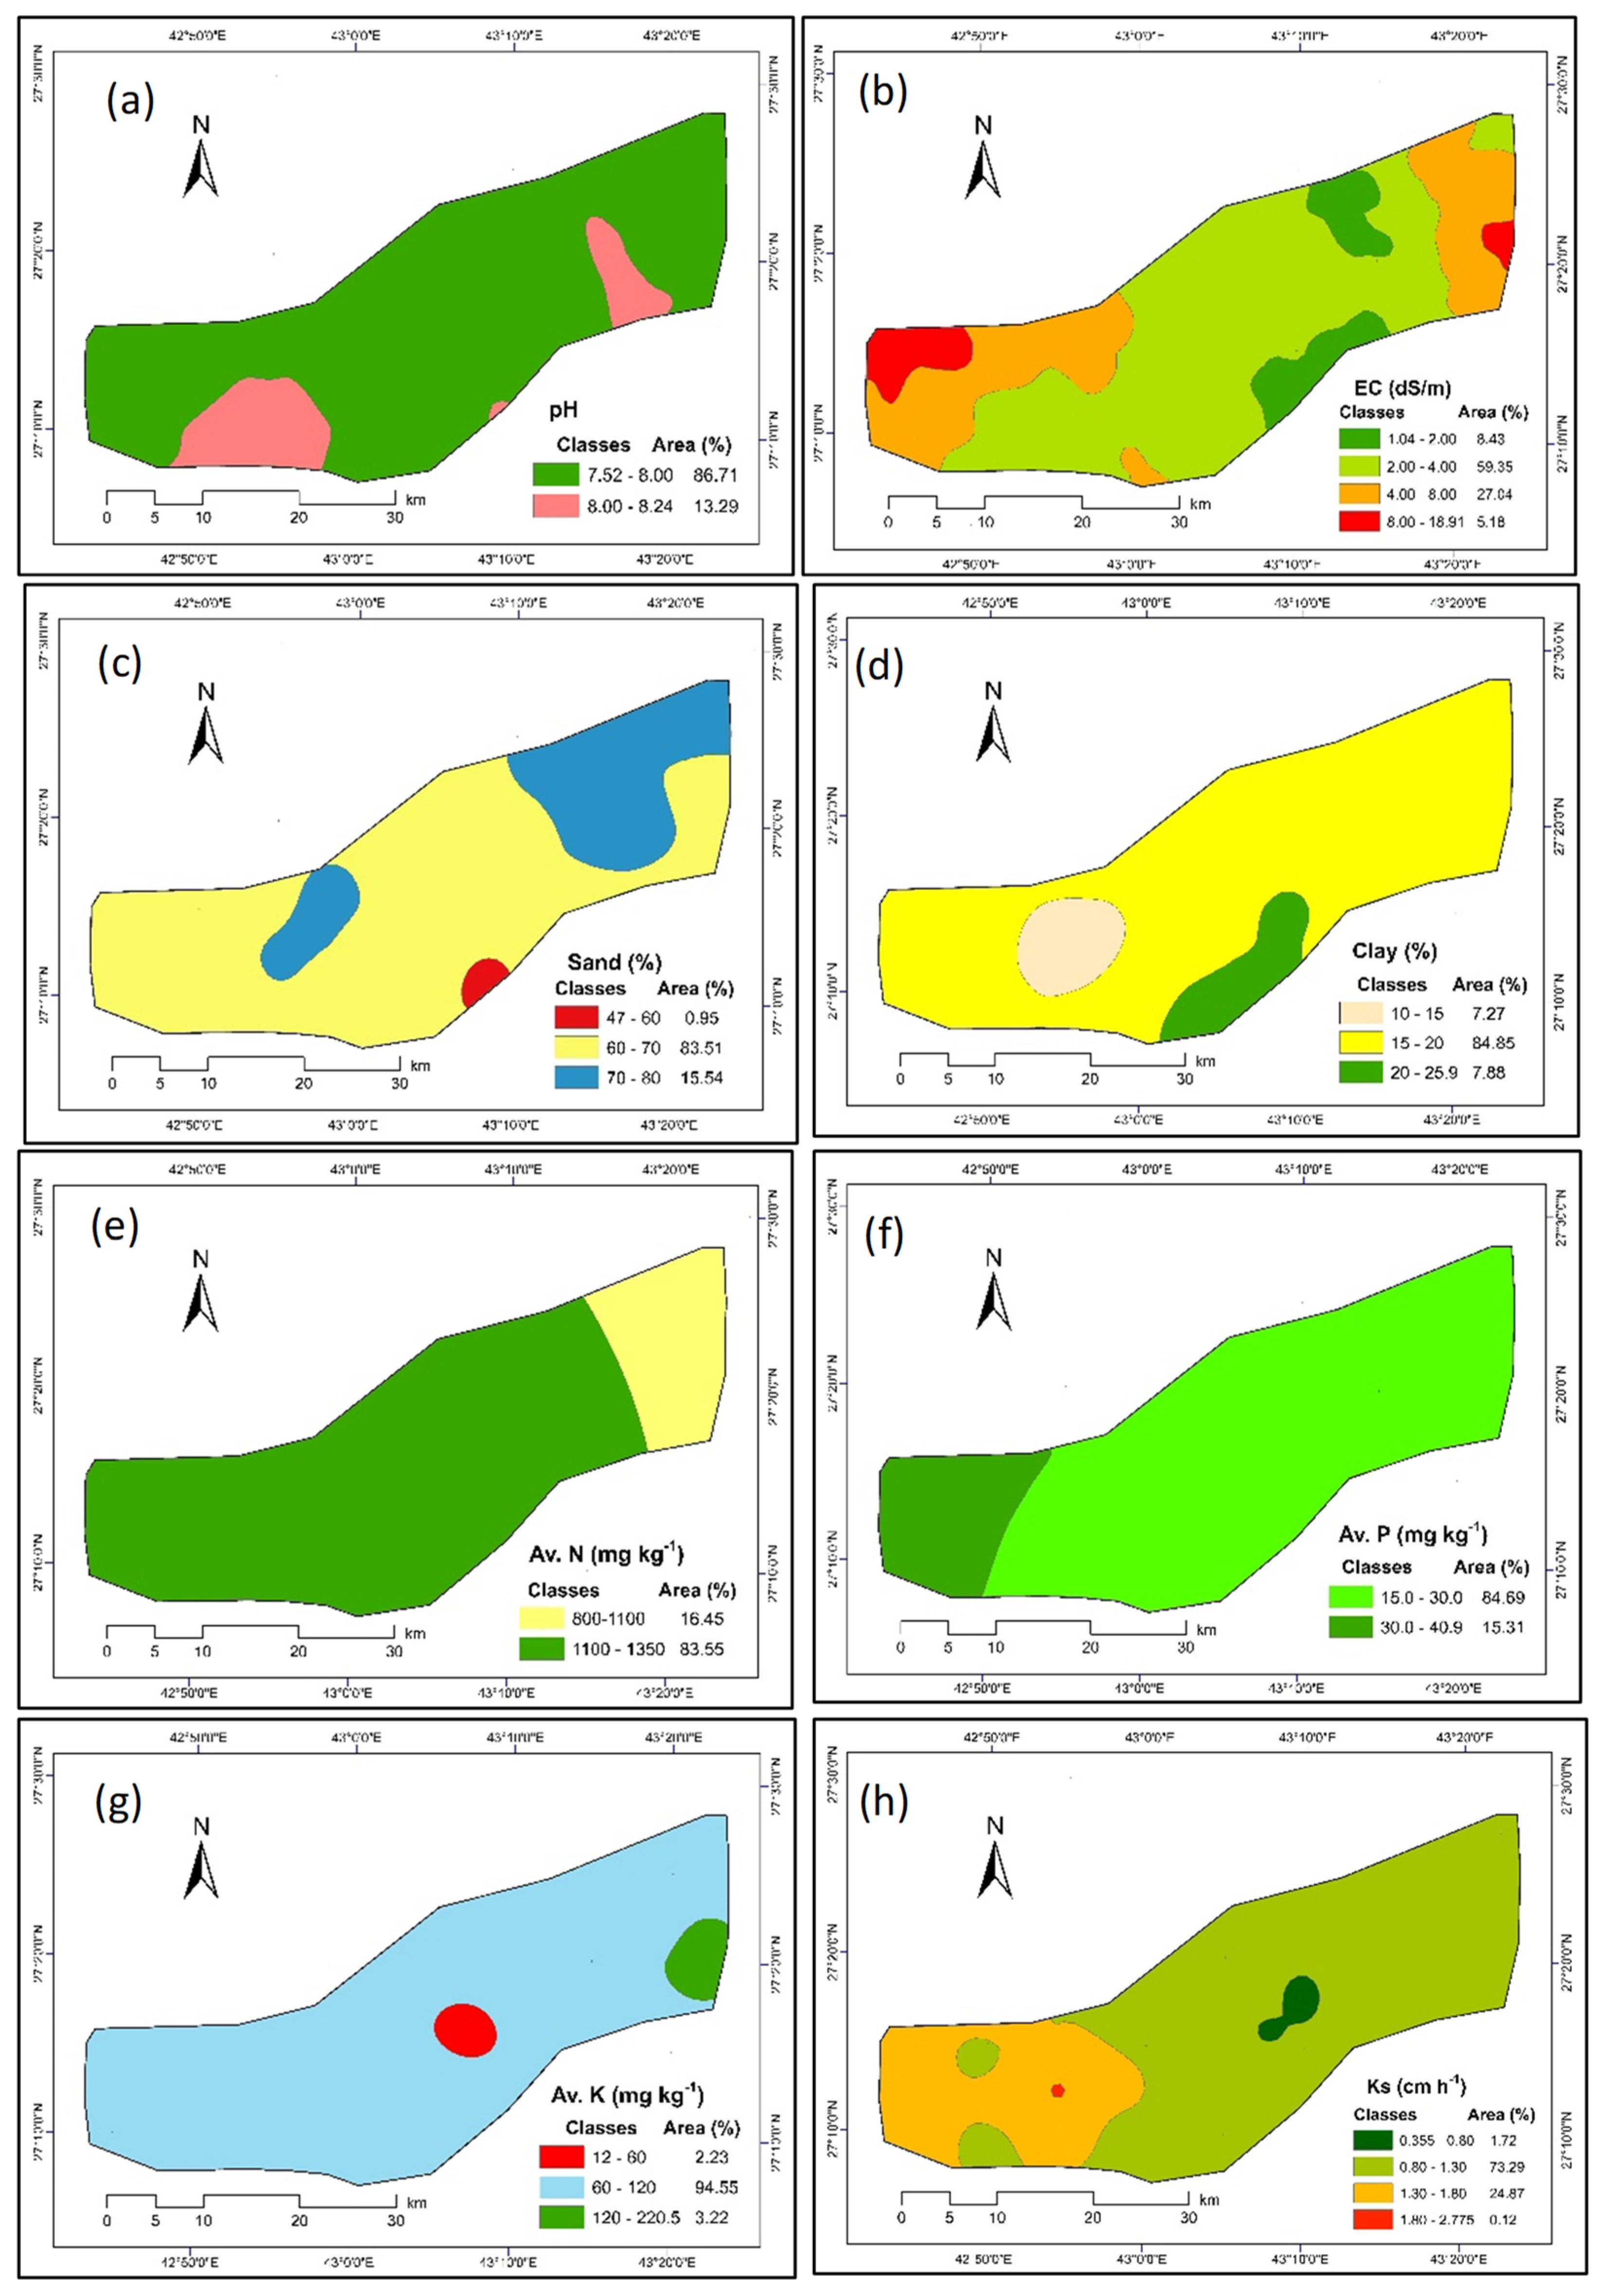
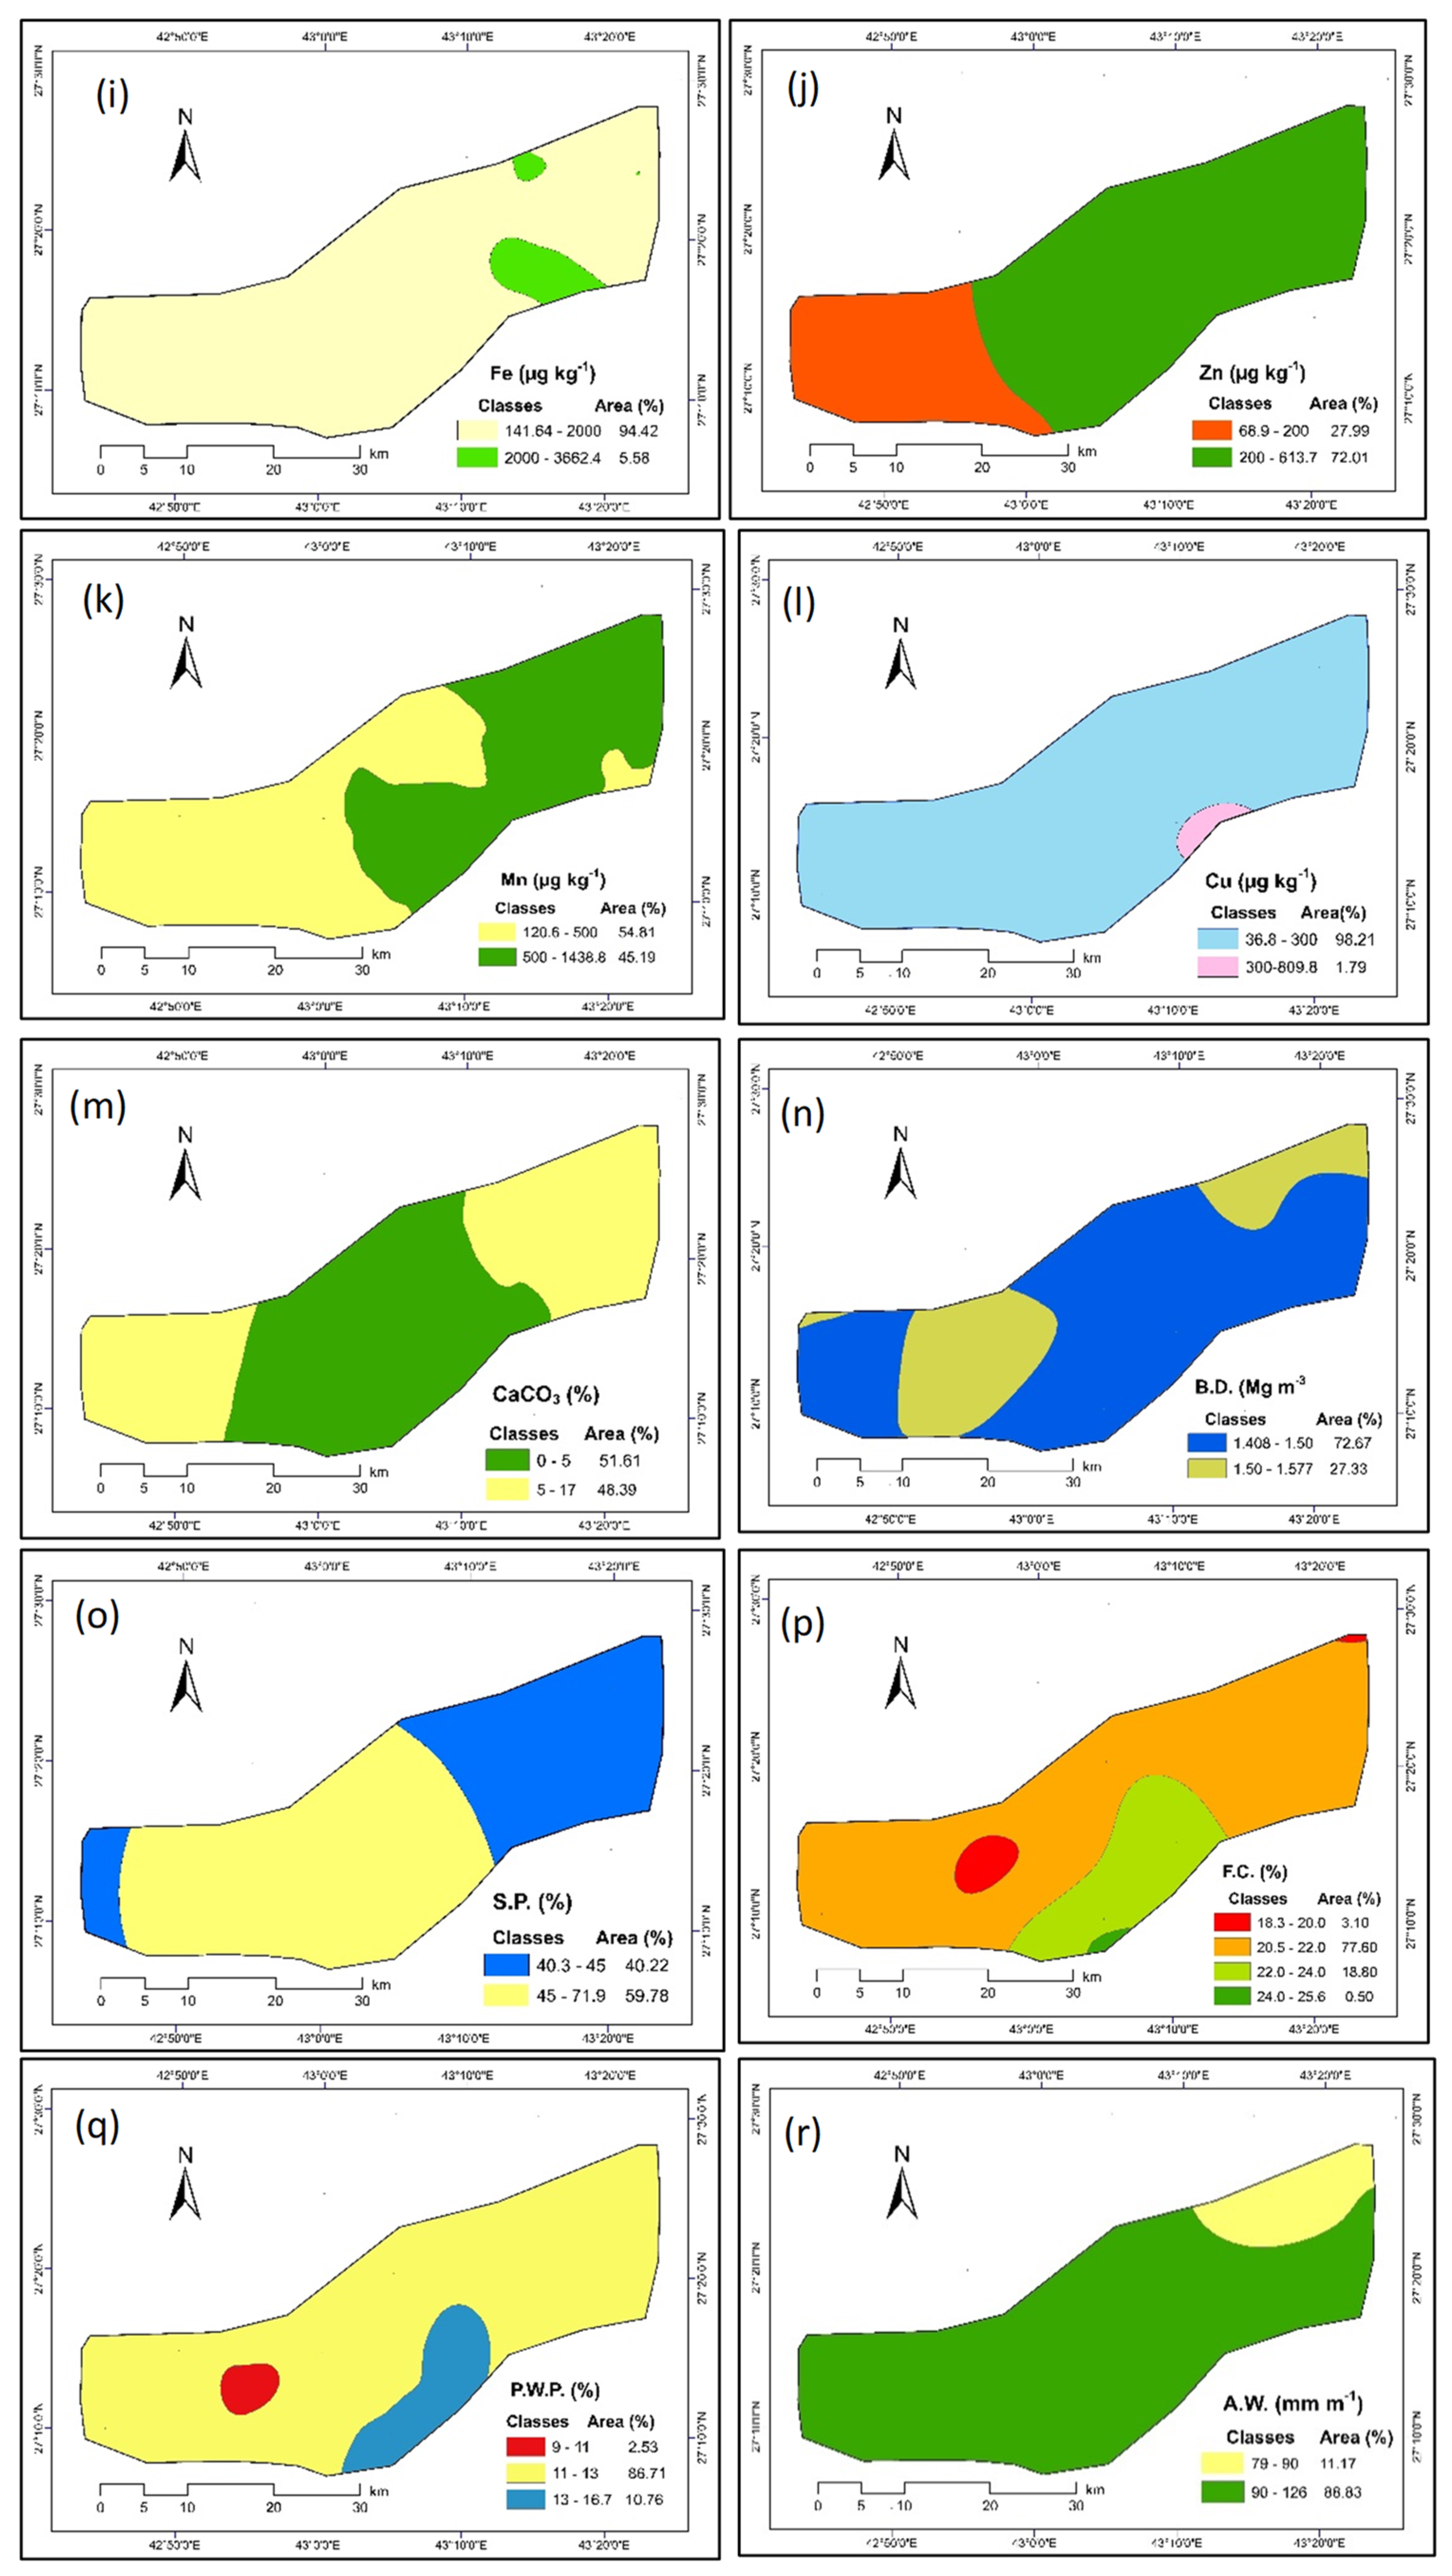
3.3. Distribution of Soil Properties
3.4. Relationships between Soil Properties
3.5. Geostatistical Analysis and Spatial Variability
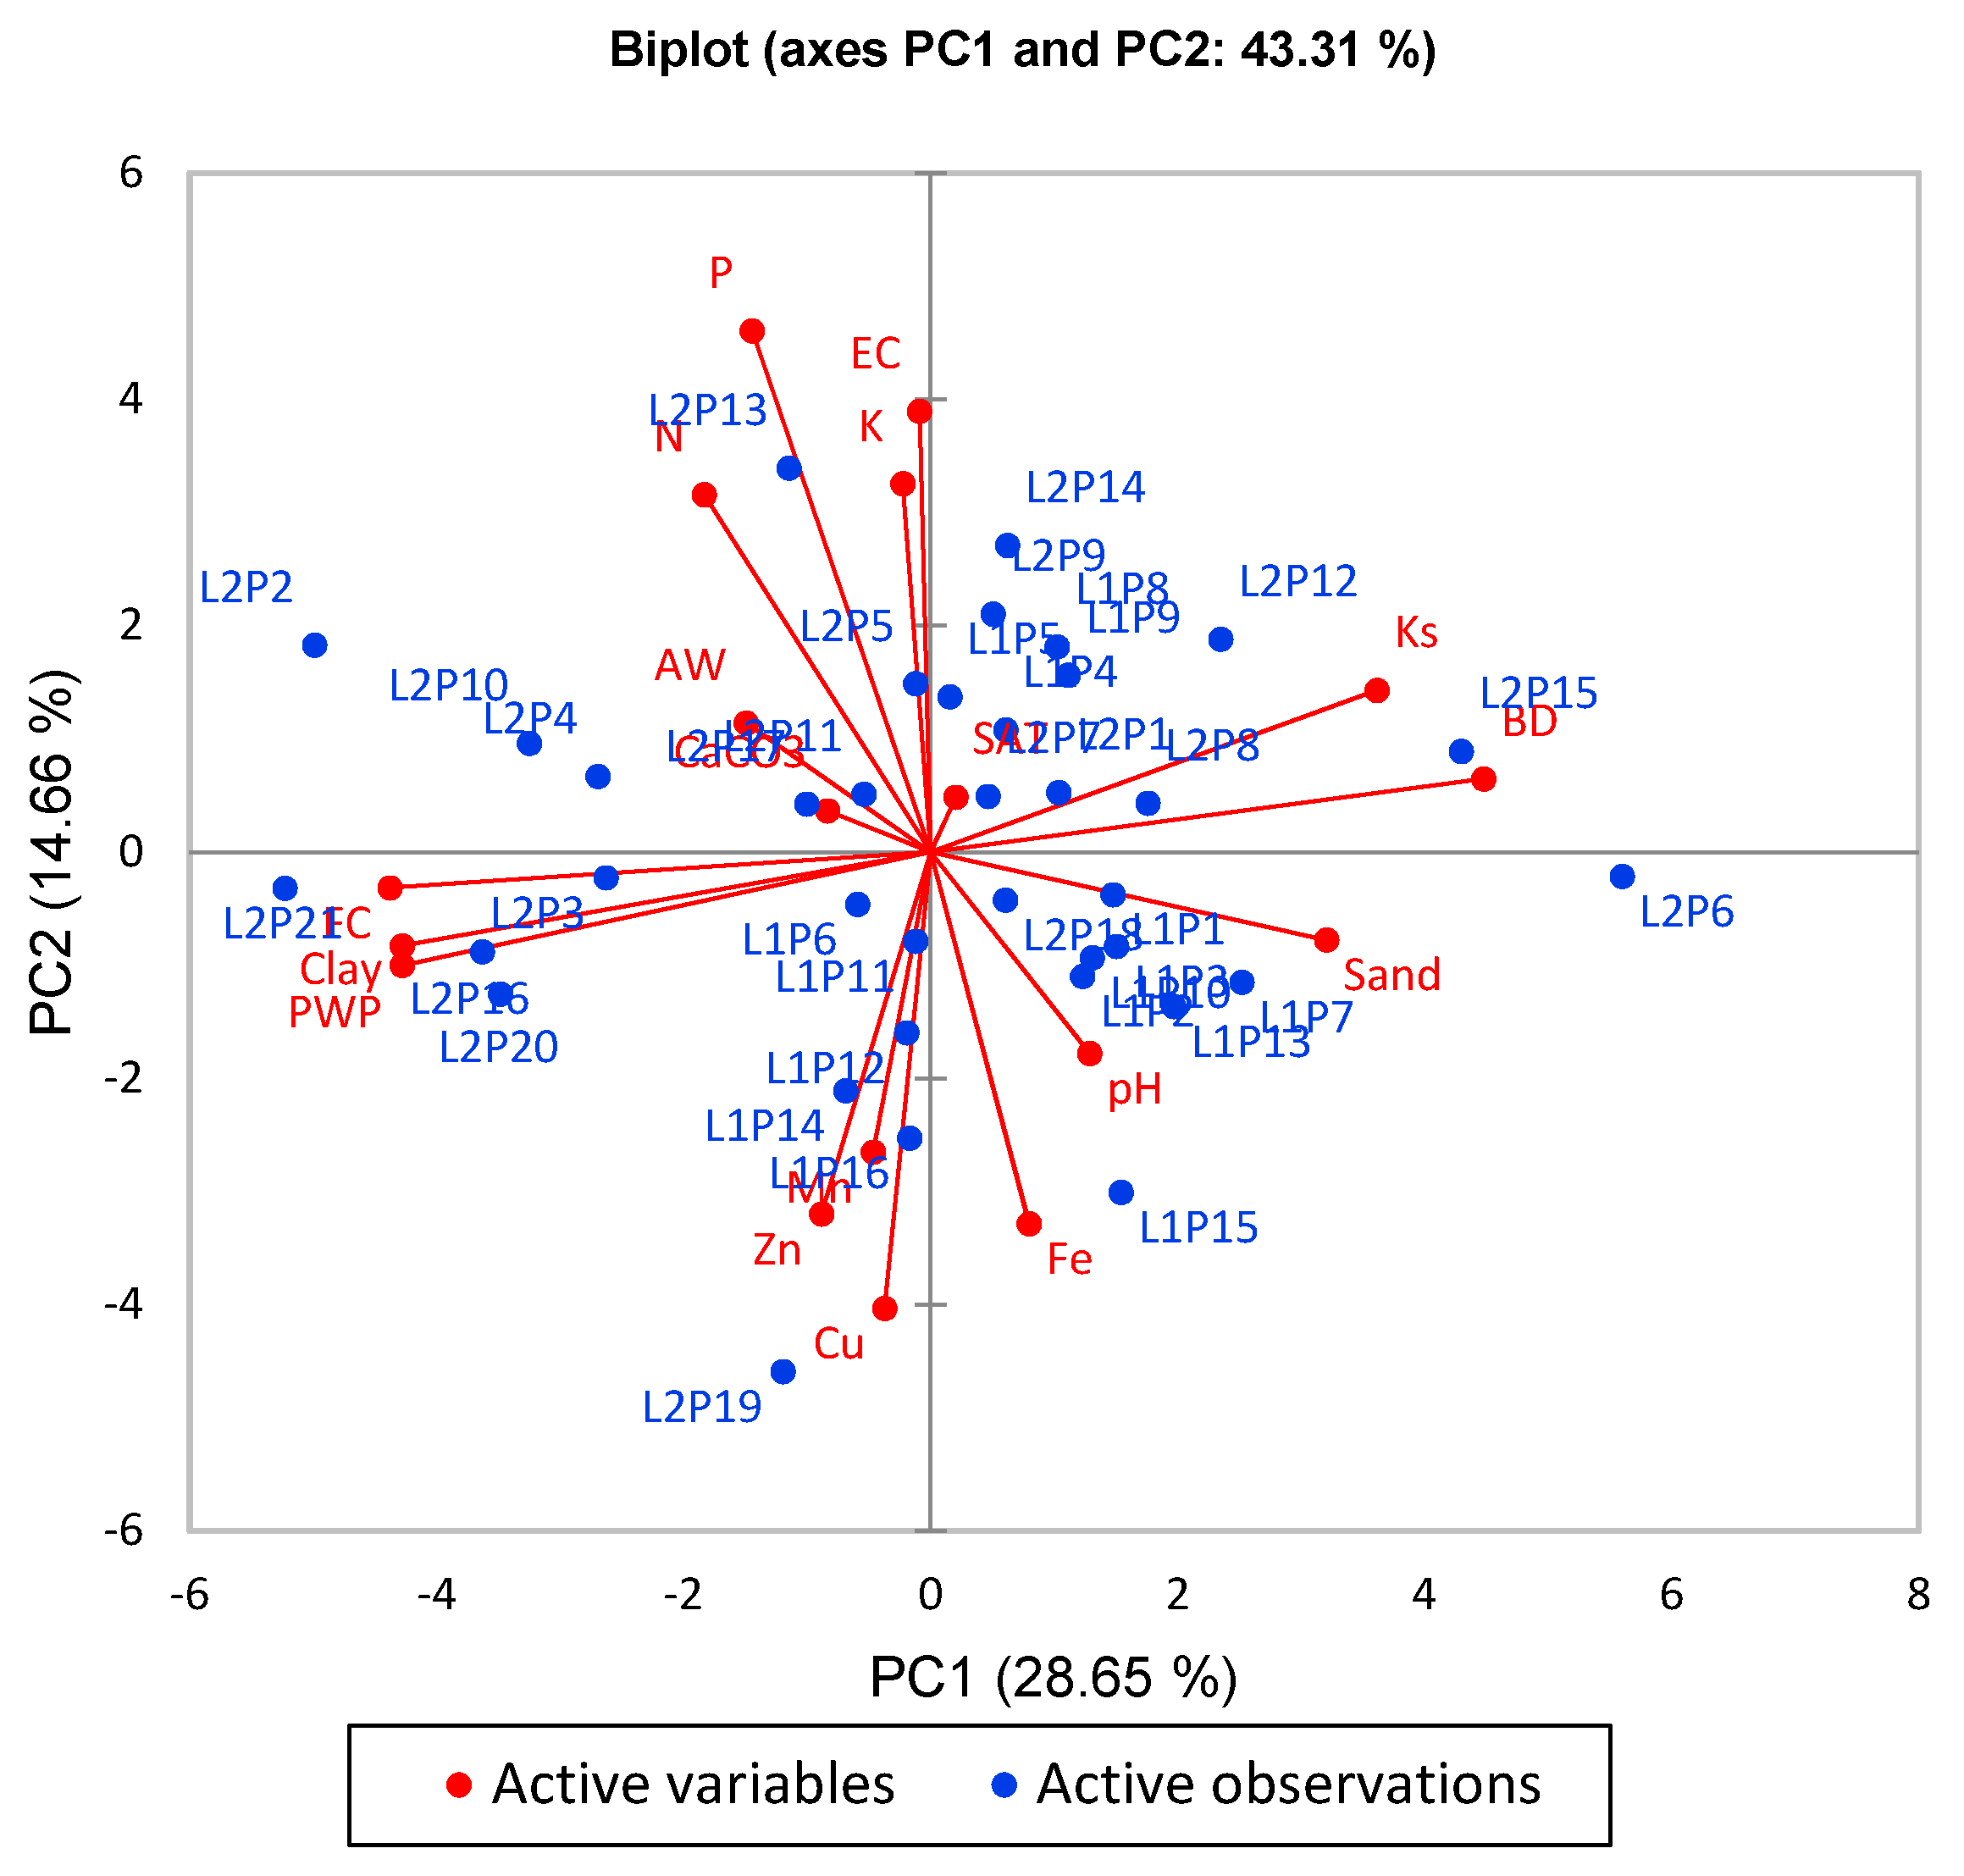
3.6. Principle Components Analysis (PCA)
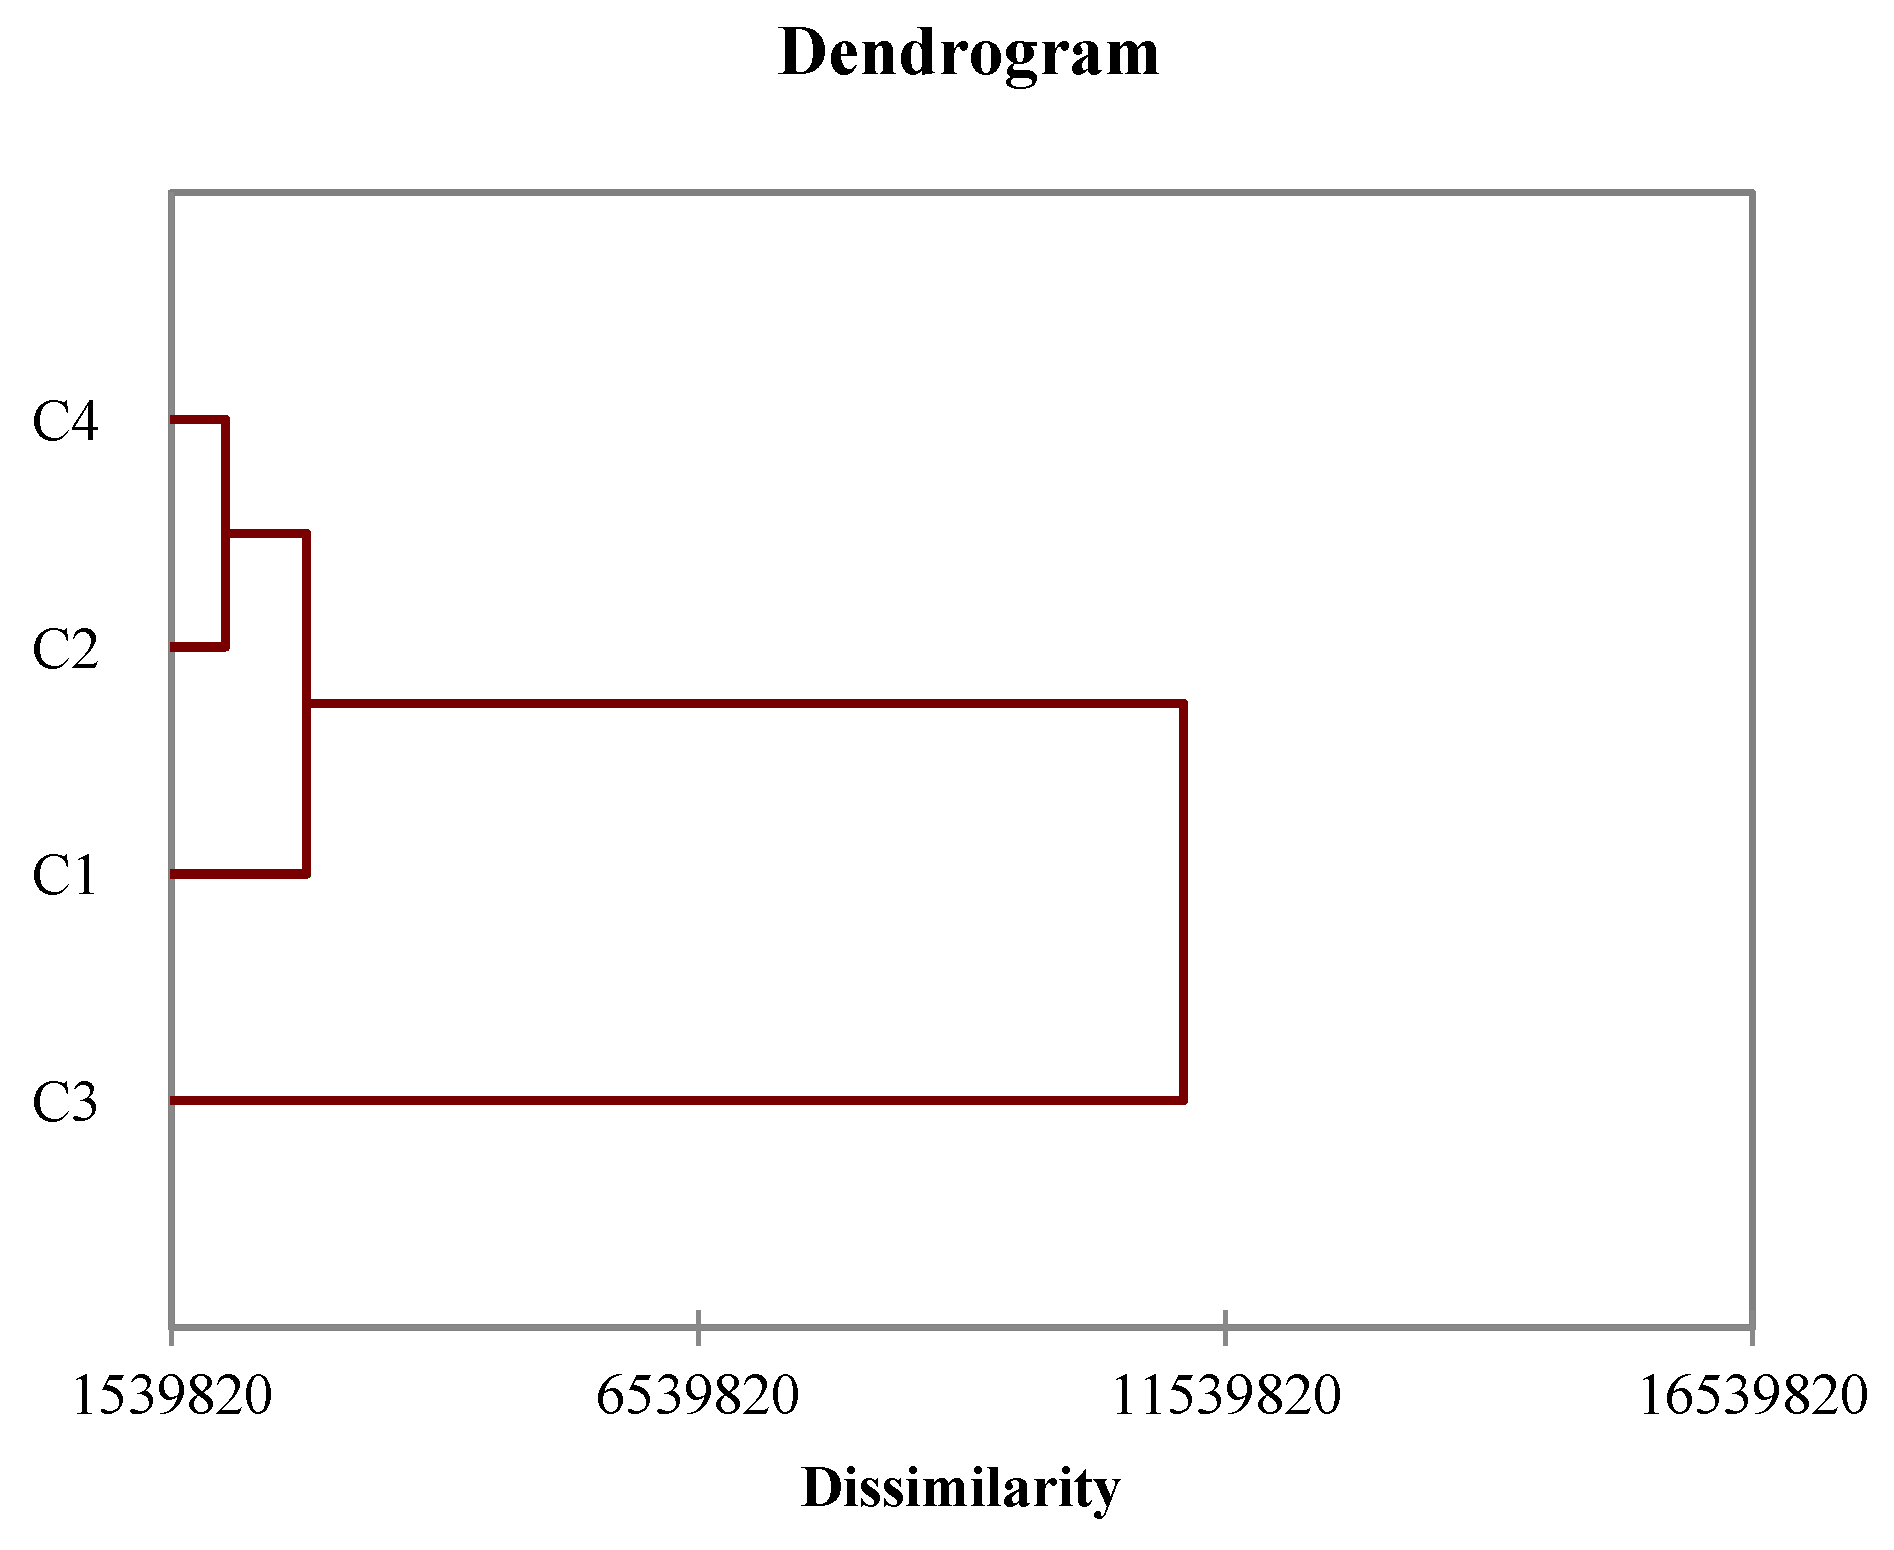
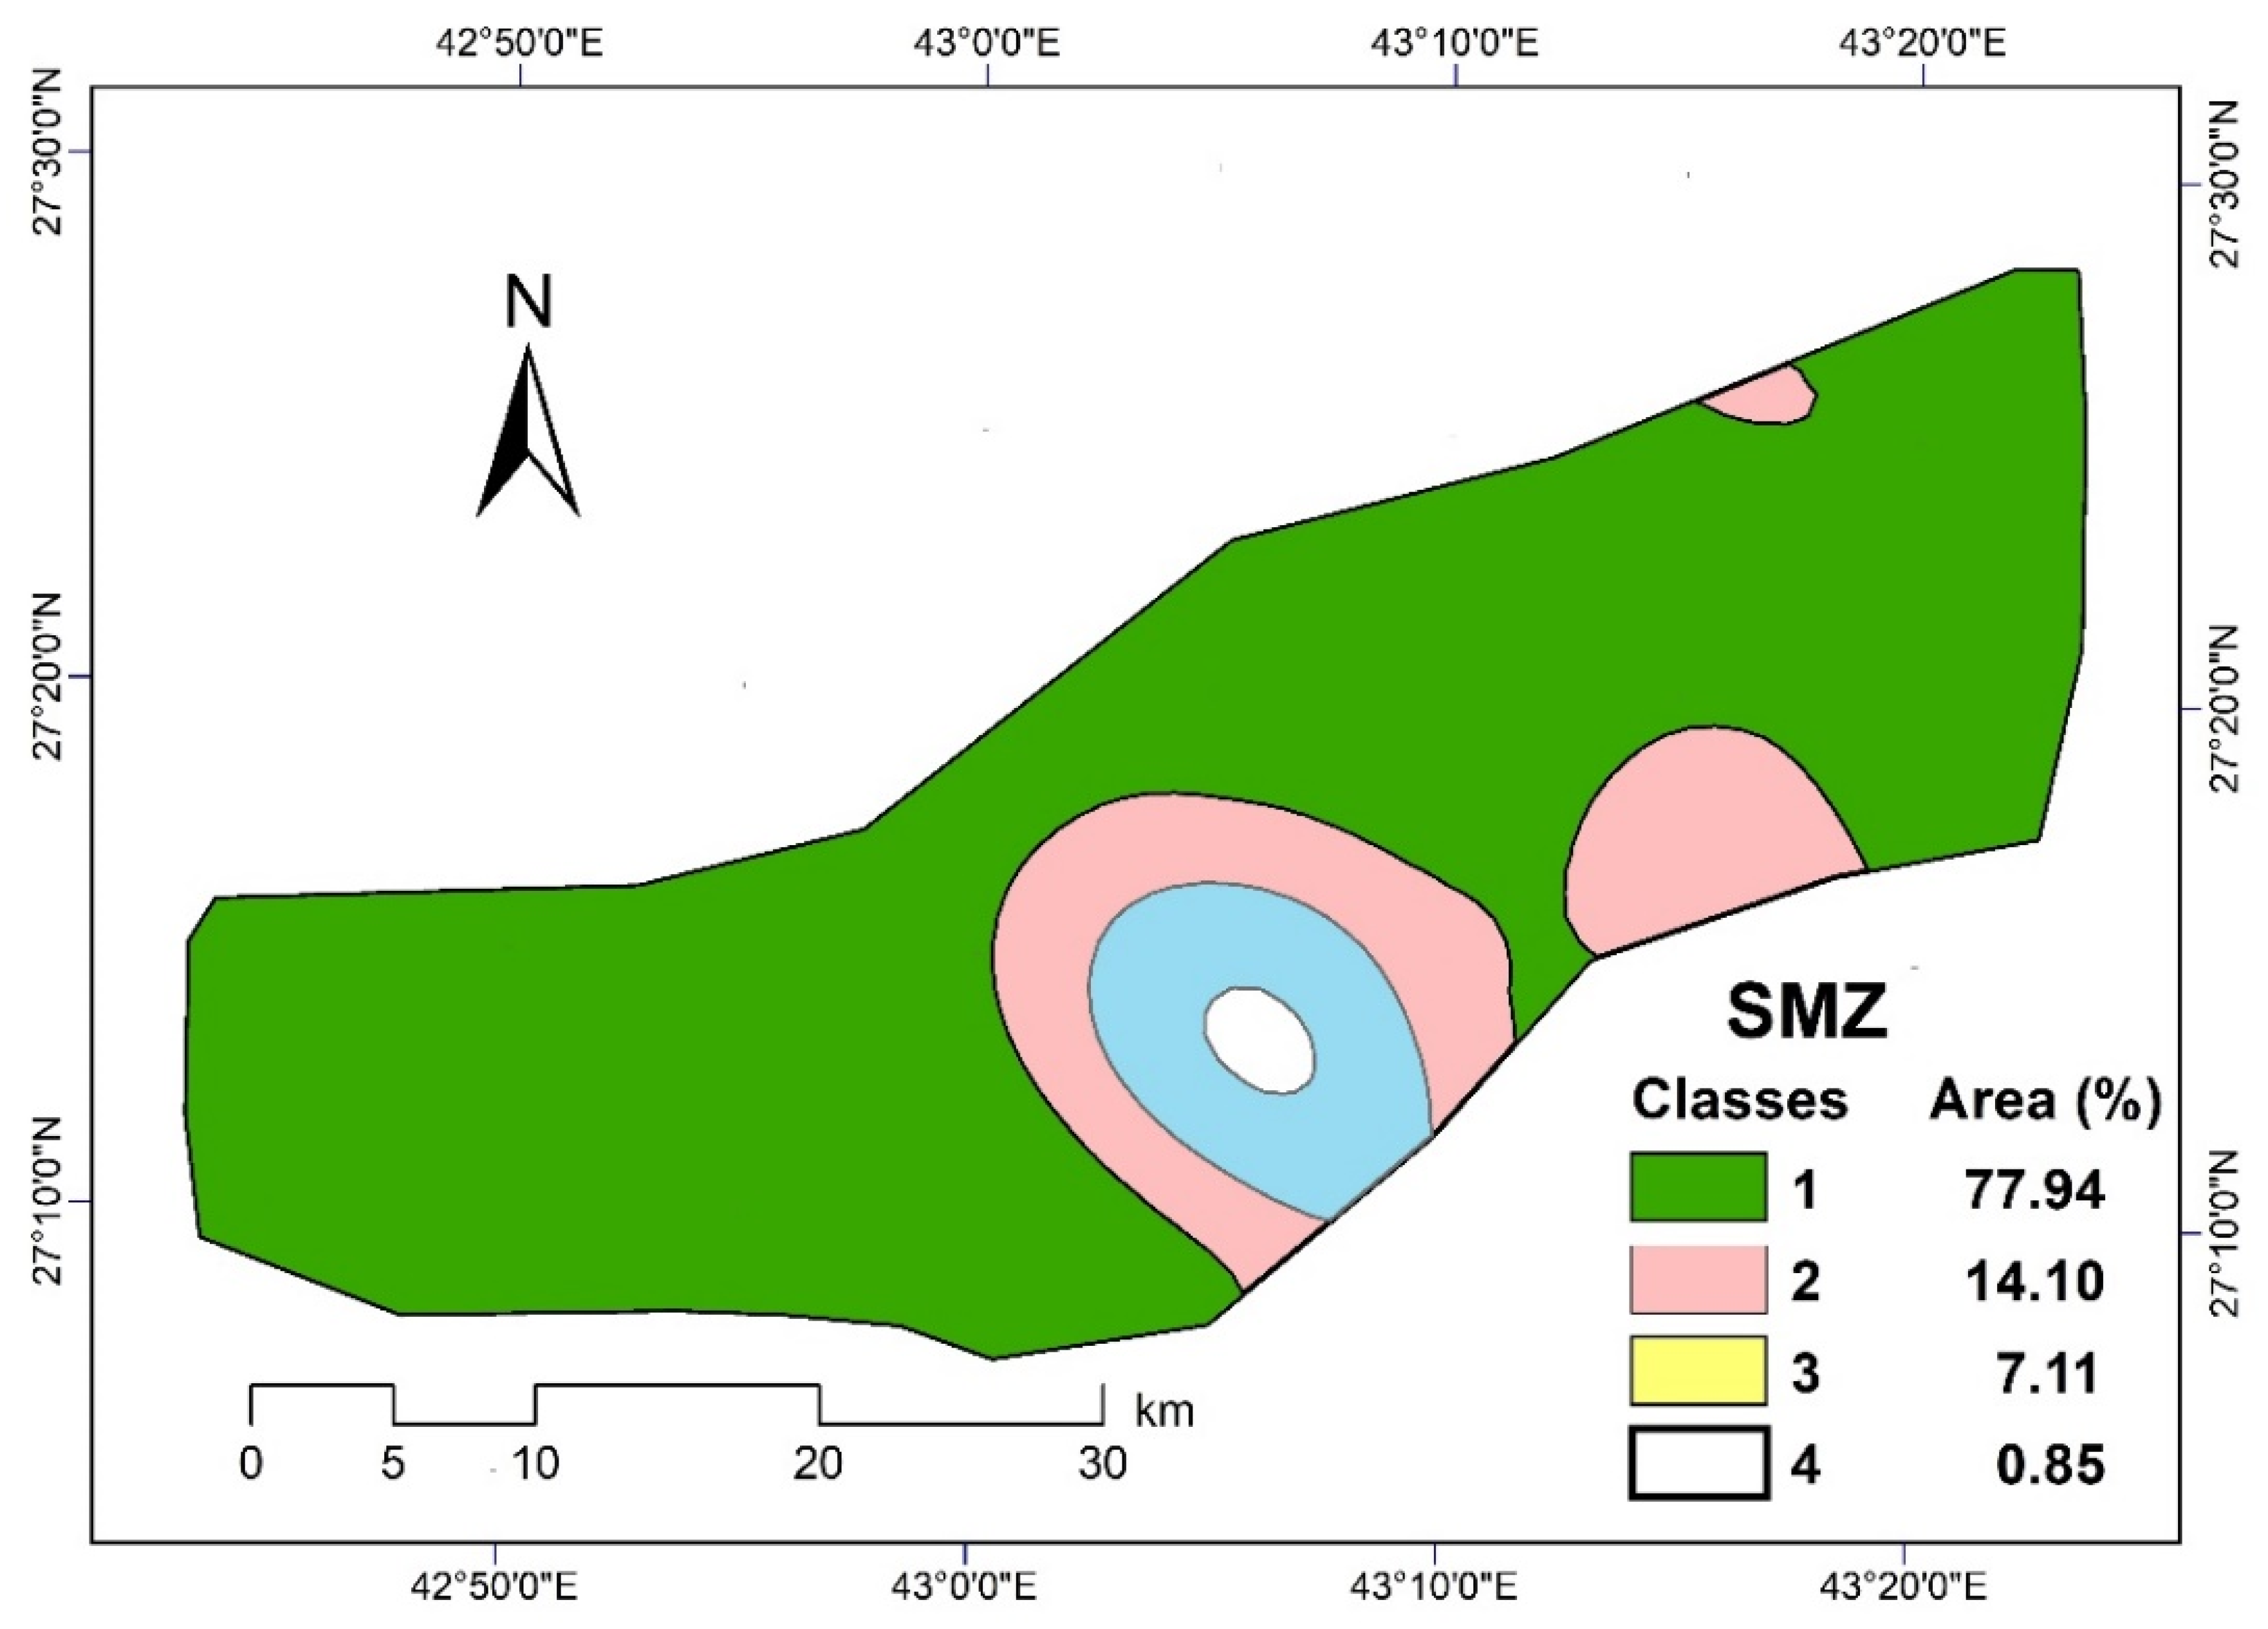
3.7. Initiating Management Zones Using Soil Properties
4. Conclusions
Author Contributions
Funding
Institutional Review Board Statement
Informed Consent Statement
Data Availability Statement
Acknowledgments
Conflicts of Interest
References
- Bremer, E.; Ellert, K. Soil Quality Indicators: A Review with Implications for Agricultural Ecosystems in Alberta; AESA: Lethbridge, AB, Canada, 2004. [Google Scholar]
- Statistics, H. Agricultural Production Survey Bulletin; General Authority for Statistics: Riyadh, Saudi Arabia, 2019. [Google Scholar]
- Modaihsh, A.S.; Sallam, A.S.; Ghoneim, A.M.; Mahjoub, M.O. Assessing salt-affected degraded soils using remote sensing. Case study: Al-Qassim region, Saudi Arabia. J. Food Agric. Environ. 2014, 12, 383–388. [Google Scholar]
- Abdel-Satar, A.M.; Al-Khabbas, M.H.; Alahmad, W.R.; Yousef, W.M.; Alsomadi, R.H.; Iqbal, T. Quality assessment of groundwater and agricultural soil in Hail region, Saudi Arabia. Egypt. J. Aquat. Res. 2017, 43, 55–64. [Google Scholar] [CrossRef]
- Alharbi, A.; Abd-Elmoniem, E.; Asiry, K.A. Correlation of Soil Salinity with the Physico-chemical Properties of Agricultural Soils from the Hail Region of Saudi Arabia. Cienc. Tec. 2017, 2, 2–24. [Google Scholar]
- Elaalem, M.M. Spatial Variability of Some Soil Chemical Proprieties in Jeffara Plain, Libya (Case Study: Tripoli, Wadi Almjainin and Bin Ghashir). Libyan J. Agric. 2017, 22, 19–34. [Google Scholar]
- Bekele, A.; Hudnall, W.H. Spatial variability of soil chemical properties of a prairie–forest transition in Louisiana. Plant Soil 2006, 280, 7–21. [Google Scholar] [CrossRef]
- Cruz, J.S.; de Assis Júnior, R.N.; Matias, S.; Tamayo, J.H.C. Spatial variability of an Alfisol cultivated with sugarcane. Cienc. Investig. Agrar. Rev. Latinoam. Cienc. Agric. 2011, 38, 155–164. [Google Scholar]
- Jabro, J.; Stevens, W.; Evans, R.; Iversen, W. Spatial variability and correlation of selected soil properties in the Ap horizon of a CRP grassland. Appl. Eng. Agric. 2010, 26, 419–428. [Google Scholar] [CrossRef]
- Fraisse, C.; Sudduth, K.; Kitchen, N.; Fridgen, J. Use of Unsupervised Clustering Algorithms for Delineating within-Field Management Zones; American Society of Agricultural Engineers: St. Joseph, MI, USA, 1999. [Google Scholar]
- Aggag, A.; Yehia, H. GIS mapping of land suitability and soil quality for some soils of El-Sharkeya Governorate, Egypt. J. Agric. Env. Sci. 2006, 5, 40–64. [Google Scholar]
- Bodaghabadi, M.B.; Martínez-Casasnovas, J.; Khakili, P.; Masihabadi, M.; Gandomkar, A. Assessment of the FAO traditional land evaluation methods, a case study: Iranian land classification method. Soil Use Manag. 2015, 3, 384–396. [Google Scholar] [CrossRef]
- Camacho-Tamayo, J.H.; Luengas, C.A.; Leiva, F.R. Effect of agricultural intervention on the spatial variability of some soils chemical properties in the eastern plains of Colombia. Chil. J. Agric. Res. 2008, 68, 42–55. [Google Scholar] [CrossRef]
- El Baroudy, A.A. Mapping and evaluating land suitability using a GIS-based model. Catena 2016, 140, 96–104. [Google Scholar] [CrossRef]
- Jimoh, A.I.; Yusuf, Y.O.; Yau, S.L. Soil suitability evaluation for rain-fed maize production at Gabari District Zaria Kaduna State, Nigeria. Ethiop. J. Environ. Stud. Manag. 2016, 9, 137–147. [Google Scholar] [CrossRef]
- Santra, P.; Chopra, U.; Chakraborty, D. Spatial variability of soil properties and its application in predicting surface map of hydraulic parameters in an agricultural farm. Curr. Sci. 2008, 95, 937–945. [Google Scholar]
- Malczewski, J. GIS-based multicriteria decision analysis: A survey of the literature. Int. J. Geogr. Inf. Sci. 2006, 20, 703–726. [Google Scholar] [CrossRef]
- Vasu, D.; Singh, S.; Sahu, N.; Tiwary, P.; Chandran, P.; Duraisami, V.; Ramamurthy, V.; Lalitha, M.; Kalaiselvi, B. Assessment of spatial variability of soil properties using geospatial techniques for farm level nutrient management. Soil Tillage Res. 2017, 169, 25–34. [Google Scholar] [CrossRef]
- Kazemi, H.; Sadeghi, S.; Akinci, H. Developing a land evaluation model for faba bean cultivation using geographic information system and multi-criteria analysis (A case study: Gonbad-Kavous region, Iran). Ecol. Indic. 2016, 63, 37–47. [Google Scholar] [CrossRef]
- Gupta, A.; Kamble, T.; Machiwal, D. Comparison of ordinary and Bayesian kriging techniques in depicting rainfall variability in arid and semi-arid regions of north-west India. Environ. Earth Sci. 2017, 76, 512. [Google Scholar] [CrossRef]
- Li, L.; Zhao, J.; Yuan, T. Study on Approaches of Land Suitability Evaluation for Crop Production Using GIS; Springer: Berlin/Heidelberg, Germany, 2011; pp. 587–596. [Google Scholar]
- Webster, R.; Oliver, M. Geostatistics for Experimental Scientists; John Wiley and Sons Ltd.: Chichester, UK, 2001. [Google Scholar]
- Al-Omran, A.M.; Aly, A.A.; Al-Wabel, M.I.; Al-Shayaa, M.S.; Sallam, A.S.; Nadeem, M.E. Geostatistical methods in evaluating spatial variability of groundwater quality in Al-Kharj Region, Saudi Arabia. Appl. Water Sci. 2017, 7, 4013–4023. [Google Scholar] [CrossRef]
- Behera, S.K.; Mathur, R.K.; Shukla, A.K.; Suresh, K.; Prakash, C. Spatial variability of soil properties and delineation of soil management zones of oil palm plantations grown in a hot and humid tropical region of southern India. Catena 2018, 165, 251–259. [Google Scholar] [CrossRef]
- Gozukara, G.; Akça, E.; Dengiz, O.; Kapur, S.; Adak, A. Soil particle size prediction using Vis-NIR and pXRF spectra in a semiarid agricultural ecosystem in Central Anatolia of Türkiye. Catena 2022, 217, 106514. [Google Scholar] [CrossRef]
- Gozukara, G. Rapid land use prediction via portable X-ray fluorescence (pXRF) data on the dried lakebed of Avlan Lake in Turkey. Geoderma Reg. 2022, 28, e00464. [Google Scholar] [CrossRef]
- Hastie, T.; Tibshirani, R.; Friedman, J. The Elements of Statistical Learning: Data Mining, Inference, and Prediction; Springer Series in Statistics; Springer: New York, NY, USA, 2009. [Google Scholar] [CrossRef]
- Yuan, Y.; Miao, Y.; Yuan, F.; Ata-UI-Karim, S.T.; Liu, X.; Tian, Y.; Zhu, Y.; Cao, W.; Cao, Q. Delineating soil nutrient management zones based on optimal sampling interval in medium-and small-scale intensive farming systems. Precis. Agric. 2022, 23, 538–558. [Google Scholar] [CrossRef]
- Boroushaki, S.; Malczewski, J. Implementing an extension of the analytical hierarchy process using ordered weighted averaging operators with fuzzy quantifiers in ArcGIS. Comput. Geosci. 2008, 34, 399–410. [Google Scholar] [CrossRef]
- Romano, G.; Dal Sasso, P.; Trisorio Liuzzi, G.; Gentile, F. Multi-criteria decision analysis for land suitability mapping in a rural area of Southern Italy. Land Use Policy 2015, 48, 131–143. [Google Scholar] [CrossRef]
- Chen, J. GIS-based multi-criteria analysis for land use suitability assessment in City of Regina. Environ. Syst. Res. 2014, 1, 13. [Google Scholar] [CrossRef]
- Gong, J.; Liu, Y.; Chen, W. Land suitability evaluation for development using a matter-element model: A case study in Zengcheng, Guangzhou, China. Land Use Policy 2012, 29, 464–472. [Google Scholar] [CrossRef]
- Seyedmohammadi, J.; Sarmadian, F.; Jafarzadeh, A.A.; McDowell, R.W. Development of a model using matter element, AHP and GIS techniques to assess the suitability of land for agriculture. Geoderma 2019, 352, 80–95. [Google Scholar] [CrossRef]
- Brevik, E.C.; Calzolari, C.; Miller, B.A.; Pereira, P.; Kabala, C.; Baumgarten, A.; Jordán, A. Soil mapping, classification, and pedologic modeling: History and future directions. Geoderma 2016, 264, 256–274. [Google Scholar] [CrossRef]
- Moharana, P.; Jena, R.; Pradhan, U.; Nogiya, M.; Tailor, B.; Singh, R.; Singh, S. Geostatistical and fuzzy clustering approach for delineation of site-specific management zones and yield-limiting factors in irrigated hot arid environment of India. Precis. Agric. 2020, 21, 426–448. [Google Scholar] [CrossRef]
- Saito, H.; McKenna, S.A.; Zimmerman, D.; Coburn, T.C. Geostatistical interpolation of object counts collected from multiple strip transects: Ordinary kriging versus finite domain kriging. Stoch. Environ. Res. Risk Assess. 2005, 19, 71–85. [Google Scholar] [CrossRef]
- Verma, R.R.; Manjunath, B.L.; Singh, N.P.; Kumar, A.; Asolkar, T.; Chavan, V.; Srivastava, T.K.; Singh, P. Soil mapping and delineation of management zones in the Western Ghats of coastal India. Land Degrad. Dev. 2018, 29, 4313–4322. [Google Scholar] [CrossRef]
- Abdel-Fattah, M.K. A GIS-based approach to identify the spatial variability of salt affected soil properties and delineation of site-specific management zones: A case study from Egypt. Soil Sci. Annu. 2020, 71, 76–85. [Google Scholar] [CrossRef]
- Weather Spark. Available online: https://weatherspark.com/y/101927/Average-Weather-in-Ha'il-Saudi-Arabia-Year-Round (accessed on 18 July 2022).
- Gee, G.W.; Bauder, J.W. Particle-size analysis. In Methods of Soil Analysis, Part 1-Physical Mineralogical Methods; Klute, A., Ed.; American Society of Agronomy: Madison, WI, USA, 1986; pp. 383–399. [Google Scholar]
- Blake, G.R.; Hartge, K.H. Bulk Density. In Methods of Soil Analysis, Part 1-Physical Mineralogical Methods; Klute, A., Ed.; American Society of Agronomy: Madison, WI, USA, 1986; pp. 363–375. [Google Scholar]
- Klute, A.; Dirksen, C. Hydraulic conductivity and diffusivity: Laboratory methods. In Methods of Soil Analysis: Part 1-Physical Mineralogical Methods; American Society of Agronomy: Madison, WI, USA, 1986; pp. 687–734. [Google Scholar]
- Cassel, D.; Nielsen, D. Field capacity and available water capacity. In Methods of Soil Analysis: Part 1-Physical Mineralogical Methods; American Society of Agronomy: Madison, WI, USA, 1986; pp. 901–926. [Google Scholar]
- Page, A.; Miller, R.; Keeney, D. Methods of Soil Analysis. Part 2. Chemical and Microbiological Properties; Agronomy, No. 9; American Society of Agronomy: Madison, WI, USA, 1982. [Google Scholar]
- Loeppert, R.; Suarez, D. Carbonate and gypsum. In Methods of Soil Analysis. Part 3. Chemical Methods; Sparks, D., Page, A.L., Helmke, P.A., Loeppert, R.H., Soltanpour, P.N., Tabatabai, M.A., Johnston, C.T., Sumner, M.E., Eds.; SSSA Book Series 5; SSSA: Madison, WI, USA, 1996; pp. 437–474. [Google Scholar]
- Soltanpour, P.; Schwab, A. A new soil test for simultaneous extraction of macro-and micro-nutrients in alkaline soils. Commun. Soil Sci. Plant Anal. 1977, 8, 195–207. [Google Scholar] [CrossRef]
- ESRI. ArcGIS, version 10.8; ESRI: Redlands, CA, USA, 2019.
- Addinsoft. XLSTAT; Statistical and data analysis solution; Addinsoft: Boston, MA, USA, 2019. [Google Scholar]
- Abdi, H.; Williams, L.J. Principal component analysis. Wiley Interdiscip. Rev. Comput. Stat. 2010, 2, 433–459. [Google Scholar] [CrossRef]
- Goovaerts, P. Geostatistical tools for characterizing the spatial variability of microbiological and physico-chemical soil properties. Biol. Fertil. Soils 1998, 27, 315–334. [Google Scholar] [CrossRef]
- Burgess, T.M.; Webster, R. Optimal interpolation and isarithmic mapping of soil properties. J. Soil Sci. 1980, 31, 315–331. [Google Scholar] [CrossRef]
- Gundogdu, K.S.; Guney, I. Spatial analyses of groundwater levels using universal kriging. J. Earth Syst. Sci. 2007, 116, 49–55. [Google Scholar] [CrossRef]
- Ennaji, W.; Barakat, A.; El Baghdadi, M.; Oumenskou, H.; Aadraoui, M.; Karroum, L.A.; Hilali, A. GIS-based multi-criteria land suitability analysis for sustainable agriculture in the northeast area of Tadla plain (Morocco). J. Earth Syst. Sci. 2018, 127, 79. [Google Scholar] [CrossRef]
- Alharbi, A.B.; Aggag, A. Land Evaluation for Alternative Crops of Alfalfa Using GIS in south Hail, Saudi Arabia. Alex. Sci. Exch. J. 2020, 41, 419–433. [Google Scholar] [CrossRef]
- Feng, C.; Hongyue, W.; Lu, N.; Chen, T.; He, H.; Lu, Y.; Tu, X. Log-transformation and its implications for data analysis. Shanghai Arch. Psychiatry 2014, 26, 105–109. [Google Scholar] [CrossRef]
- Amer, B.S.; Moussa, K.F.; Sheha, A.A.; Abdel-Fattah, M.K. Delineation of site-specific management zones using multivariate analysis and geographic information system technique. Plant Arch. 2021, 21, 1385–1390. [Google Scholar] [CrossRef]
- Gozukara, G.; Acar, M.; Ozlu, E.; Dengiz, O.; Hartemink, A.E.; Zhang, Y. A soil quality index using Vis-NIR and pXRF spectra of a soil profile. Catena 2022, 211, 105954. [Google Scholar] [CrossRef]
- Richards, L. Diagnosis and Improvement of Saline Alkali Soils; Handbook; Williams & Wilkins: Philadelphia, PA, USA, 1954; Volume 60. [Google Scholar] [CrossRef]
- Barthakur, H.; Baruah, T. Text Book of Soil Analysis; Vikas Publishing House (Pvt) Ltd.: New Delhi, India, 1997. [Google Scholar]
- Reddy, D.T.P. Critical levels of micro and secondary nutrients in soils and crops for optimum plant nutrition. Int. J. Sci. Res. 2021, 6, 594–595. [Google Scholar]
- Brady, N.C.; Weil, R.R.; Weil, R.R. The Nature and Properties of Soils; Prentice Hall: Upper Saddle River, NJ, USA, 2008; Volume 13. [Google Scholar]
- Patel, K.S.; Chikhlekar, S.; Ramteke, S.; Sahu, B.L.; Dahariya, N.S.; Sharma, R. Micronutrient status in soil of Central India. Am. J. Plant Sci. 2015, 6, 3025. [Google Scholar] [CrossRef]
- Sofroniou, N.; Hutcheson, G.D. The Multivariate Social Scientist; Sage Publications: Thousand Oaks, CA, USA, 1999; pp. 1–288. [Google Scholar]
- Huck, S.W.; Cormier, W.H.; Bounds, W.G. Reading Statistics and Research; Pearson: Boston, MA, USA, 1974. [Google Scholar]
- Tabachnick, B.G.; Fidell, L.S.; Ullman, J.B. Using Multivariate Statistics; Pearson: Boston, MA, USA, 2007; Volume 5. [Google Scholar]
- Behera, S.K.; Shukla, A.K. Spatial distribution of surface soil acidity, electrical conductivity, soil organic carbon content and exchangeable potassium, calcium and magnesium in some cropped acid soils of India. Land Degrad. Dev. 2015, 26, 71–79. [Google Scholar] [CrossRef]
- Mali, S.; Naik, S.; Bhatt, B. Spatial variability in soil properties of mango orchards in eastern plateau and hill region of India. Vegetos 2016, 29, 74–79. [Google Scholar] [CrossRef]
- Zhang, X.-Y.; Yue-Yu, S.; Zhang, X.-D.; Kai, M.; Herbert, S. Spatial variability of nutrient properties in black soil of northeast China. Pedosphere 2007, 17, 19–29. [Google Scholar] [CrossRef]
- Mulla, D. Modeling and mapping soil spatial and temporal variability. In Hydropedology; Elsevier: Amsterdam, The Netherlands, 2012; pp. 637–664. [Google Scholar]
- Cambardella, C.A.; Moorman, T.B.; Novak, J.; Parkin, T.; Karlen, D.; Turco, R.; Konopka, A. Field-scale variability of soil properties in central Iowa soils. Soil Sci. Soc. Am. J. 1994, 58, 1501–1511. [Google Scholar] [CrossRef]
- Kerry, R.; Oliver, M. Average variograms to guide soil sampling. Int. J. Appl. Earth Obs. Geoinf. 2004, 5, 307–325. [Google Scholar] [CrossRef]
- Ozlu, E.; Gozukara, G.; Acar, M.; Bilen, S.; Babur, E. Field-Scale Evaluation of the Soil Quality Index as Influenced by Dairy Manure and Inorganic Fertilizers. Sustainability 2022, 14, 7593. [Google Scholar] [CrossRef]
- Kaiser, H.F. The application of electronic computers to factor analysis. Educ. Psychol. Meas. 1960, 20, 141–151. [Google Scholar] [CrossRef]
- Oldoni, H.; Terra, V.S.S.; Timm, L.C.; Júnior, C.R.; Monteiro, A.B. Delineation of management zones in a peach orchard using multivariate and geostatistical analyses. Soil Tillage Res. 2019, 191, 1–10. [Google Scholar] [CrossRef]
- Warrence, N.J.; Bauder, J.W.; Pearson, K.E. Basics of Salinity and Sodicity Effects on Soil Physical Properties; Departement of Land Resources and Environmental Sciences, Montana State University: Bozeman, MT, USA, 2002; Volume 129, pp. 1–29. [Google Scholar]
- Abdel-Fattah, M.K.; Mohamed, E.S.; Wagdi, E.M.; Shahin, S.A.; Aldosari, A.A.; Lasaponara, R.; Alnaimy, M.A. Quantitative evaluation of soil quality using Principal Component Analysis: The case study of El-Fayoum depression Egypt. Sustainability 2021, 13, 1824. [Google Scholar] [CrossRef]
- Rahul, T.; Kumar, N.A.; Biswaranjan, D.; Mohammad, S.; Banwari, L.; Priyanka, G.; Sangita, M.; Bihari, P.B.; Narayan, S.R.; Kumar, S.A. Assessing soil spatial variability and delineating site-specific management zones for a coastal saline land in eastern India. Arch. Agron. Soil Sci. 2019, 65, 1775–1787. [Google Scholar] [CrossRef]
- Wang, X.-Z.; Liu, G.-S.; Hu, H.-C.; Wang, Z.-H.; Liu, Q.-H.; Liu, X.-F.; Hao, W.-H.; Li, Y.-T. Determination of management zones for a tobacco field based on soil fertility. Comput. Electron. Agric. 2009, 65, 168–175. [Google Scholar]


| Digital Elevation Model (DEM) | Slope Classes | Direction Classes | |||
|---|---|---|---|---|---|
| Elevation Range, m | Area, % | Slope Class, % | Area, % | Direction Class | Area, % |
| 698.6–700 | 2.78 | 0–3.78 | 25.26 | Flat | 1.55 |
| 700–720 | 22.96 | 3.79–6.55 | 28.96 | North | 11.16 |
| 720–740 | 20.79 | 6.56–9.57 | 22.97 | North East | 13.02 |
| 740–760 | 28.68 | 9.58–13.10 | 13.33 | East | 12.92 |
| 760–780 | 7.50 | 13.11–17.63 | 6.39 | South East | 12.48 |
| 780–800 | 10.02 | 17.64–24.94 | 2.58 | South | 12.62 |
| 800–813.7 | 7.27 | 24.95–64.23 | 0.51 | South West | 12.20 |
| West | 12.14 | ||||
| North West | 11.91 | ||||
| Parameter | Min. | Max. | Mean | Variance | Std. Dev. | CV | Skewness | Kurtosis | Normality Test | |||
|---|---|---|---|---|---|---|---|---|---|---|---|---|
| Shapiro-Walk Test | Kolmogorov-Smirnov Test | |||||||||||
| W | Sig. | D | sig. | |||||||||
| ECe (dSm−1) | 1.04 | 18.91 | 4.69 | 19.13 | 4.38 | 93.38 | 1.82 | 3.11 | 0.77 | <0.0001 | 0.24 | 0.024 |
| pH (1:2.5 soil: water) | 7.52 | 8.24 | 7.92 | 0.04 | 0.20 | 2.42 | −0.41 | −0.58 | 0.96 | 0.25 | 0.08 | 0.940 |
| CaCO3 (%) | 0.85 | 17.23 | 6.35 | 15.27 | 3.91 | 61.62 | 0.74 | 0.28 | 0.94 | 0.06 | 0.10 | 0.831 |
| Av. N (mg kg−1) | 800.0 | 1350.0 | 1135.1 | 14,564.6 | 120.7 | 10.63 | −0.47 | −0.03 | 0.94 | 0.05 | 0.16 | 0.245 |
| Av. P (mg kg−1) | 8.00 | 40.90 | 22.96 | 85.51 | 9.25 | 40.28 | 0.22 | −0.64 | 0.95 | 0.12 | 0.11 | 0.773 |
| Av. K (mg kg−1) | 12.00 | 220.5 | 100.7 | 3574.7 | 59.79 | 59.40 | 0.50 | −0.93 | 0.93 | 0.02 | 0.16 | 0.289 |
| DTPA Fe (µg kg−1) | 141.64 | 3662.4 | 674.6 | 425,894.4 | 652.61 | 96.74 | 3.20 | 12.41 | 0.65 | <0.0001 | 0.26 | 0.010 |
| DTPA Zn (µg kg−1) | 68.85 | 613.7 | 235.2 | 12,422.5 | 111.46 | 47.40 | 1.32 | 2.90 | 0.91 | 0.01 | 0.14 | 0.386 |
| DTPA Mn (µg kg−1) | 120.60 | 1438.8 | 536.7 | 83,336.9 | 288.69 | 53.79 | 1.33 | 2.17 | 0.90 | 0.00 | 0.16 | 0.248 |
| DTPA Cu (µg kg−1) | 36.84 | 809.8 | 145.3 | 16,048.8 | 126.69 | 87.20 | 4.21 | 21.72 | 0.57 | <0.0001 | 0.20 | 0.101 |
| Sand (%) | 47.00 | 80.00 | 68.08 | 47.01 | 6.86 | 10.07 | −1.16 | 2.01 | 0.92 | 0.01 | 0.14 | 0.433 |
| Clay (%) | 10.00 | 25.90 | 17.11 | 13.68 | 3.70 | 21.62 | 0.78 | 0.72 | 0.96 | 0.02 | 0.16 | 0.269 |
| B.D. (Mg m−3) | 1.41 | 1.58 | 1.49 | 0.00 | 0.04 | 2.39 | −0.14 | 0.68 | 0.40 | 0.20 | 0.14 | 0.407 |
| S.P. (%) | 40.30 | 71.90 | 44.75 | 22.89 | 4.79 | 10.69 | 5.33 | 30.81 | 0.92 | <0.0001 | 0.31 | 0.001 |
| F.C. (%) | 18.30 | 25.60 | 21.38 | 3.33 | 1.83 | 8.53 | 0.86 | 0.26 | 0.94 | 0.01 | 0.14 | 0.441 |
| P.W.P. (%) | 9.00 | 16.70 | 12.04 | 2.40 | 1.55 | 12.87 | 0.89 | 1.60 | 0.93 | 0.04 | 0.15 | 0.312 |
| A.W. (mm m−1) | 80.00 | 126.00 | 93.30 | 99.44 | 9.98 | 10.69 | 1.53 | 2.81 | 0.85 | 0.00 | 0.24 | 0.022 |
| Ks (cm h−1) | 0.36 | 2.78 | 1.12 | 0.24 | 0.49 | 43.88 | 1.41 | 3.05 | 0.90 | 0.00 | 0.20 | 0.097 |
| Variables | EC | pH | N | P | K | Fe | Zn | Mn | Cu | CaCO3 | Sand | Clay | BD | SP | FC | PWP | AW | Ks |
|---|---|---|---|---|---|---|---|---|---|---|---|---|---|---|---|---|---|---|
| ECe (dSm−1) | 1 | |||||||||||||||||
| pH (1:2.5 soil: water) | −0.536 * | 1 | ||||||||||||||||
| Av. N (mg kg−1) | 0.033 | −0.229 | 1 | |||||||||||||||
| Av. P (mg kg−1) | 0.273 | −0.156 | 0.528 * | 1 | ||||||||||||||
| Av. K (mg kg−1) | 0.716 * | −0.310 | 0.033 | 0.217 | 1 | |||||||||||||
| DTPA Fe (µg kg−1) | 0.007 | 0.094 | −0.434 * | −0.556 * | 0.174 | 1 | ||||||||||||
| DTPA Zn (µg kg−1) | −0.084 | −0.243 | −0.131 | −0.175 | −0.002 | 0.187 | 1 | |||||||||||
| DTPA Mn (µg kg−1) | −0.154 | 0.095 | 0.016 | −0.228 | −0.170 | 0.296 | 0.103 | 1 | ||||||||||
| DTPA Cu (µg kg−1) | −0.140 | 0.015 | −0.267 | −0.236 | −0.218 | 0.184 | 0.596 * | 0.149 | 1 | |||||||||
| CaCO3 (%) | 0.178 | −0.137 | −0.023 | 0.026 | 0.220 | 0.223 | −0.052 | 0.059 | −0.090 | 1 | ||||||||
| Sand (%) | −0.090 | −0.098 | −0.205 | −0.273 | −0.038 | 0.094 | −0.013 | −0.144 | −0.004 | −0.058 | 1 | |||||||
| Clay (%) | −0.131 | −0.269 | 0.368 | 0.189 | −0.043 | −0.128 | 0.172 | 0.066 | 0.116 | 0.113 | −0.441 * | 1 | ||||||
| B.D. (Mg m−3) | 0.029 | 0.193 | −0.261 | −0.181 | −0.054 | 0.078 | −0.164 | −0.074 | −0.098 | −0.161 | 0.657 * | −0.895 * | 1 | |||||
| S.P. (%) | −0.071 | 0.071 | −0.120 | 0.074 | −0.030 | −0.123 | −0.006 | −0.081 | −0.030 | −0.080 | −0.107 | −0.032 | 0.054 | 1 | ||||
| F.C. (%) | −0.023 | −0.096 | 0.274 | 0.215 | −0.012 | −0.092 | 0.135 | 0.120 | 0.072 | 0.101 | −0.832 * | 0.837 * | −0.915 * | 0.016 | 1 | |||
| P.W.P. (%) | −0.112 | −0.300 | 0.265 | 0.136 | −0.055 | −0.129 | 0.188 | 0.053 | 0.068 | 0.175 | −0.448 * | 0.948 * | −0.914 * | −0.037 | 0.833 * | 1 | ||
| A.W. (mm m−1) | 0.119 | 0.232 | 0.126 | 0.213 | 0.052 | −0.022 | 0.008 | 0.126 | 0.009 | 0.001 | −0.836 * | 0.082 | −0.263 | 0.139 | 0.544 * | 0.010 | 1 | |
| Ks (cm h−1) | 0.025 | 0.321 | −0.135 | −0.092 | −0.066 | 0.008 | −0.239 | −0.115 | −0.144 | −0.241 | 0.232 | −0.779 * | 0.815 * | 0.192 | −0.606 * | −0.836 * | 0.207 | 1 |
| KMO Measure of Sampling Adequacy | 0.586 |
| Bartlett’s Sphericity Test | |
| Chi-square (Observed value) | 568.457 |
| Chi-square (Critical value) | 196.609 |
| DF | 153 |
| p-Value | <0.0001 |
| alpha | 0.01 |
| Variables | Model | Nugget | Partial Sill | Sill | Nugget/Sill | Range (m) | MSE |
|---|---|---|---|---|---|---|---|
| ECe (dSm−1) | K-Bessel | 0.00 | 0.681 | 0.68 | 0.00 | 21,238.42 | 4.399 |
| pH | J-Bessel | 0.03 | 0.012 | 0.04 | 0.68 | 17,359.25 | 0.196 |
| CaCO3 (%) | Stable | 15.07 | 0.0 | 15.07 | 1.00 | 17,472.56 | 4.036 |
| Av. N (mg kg−1) | K-Bessel | 14,515.83 | 83.000 | 14,598.83 | 0.99 | 46,971.71 | 122.565 |
| Av. P (mg kg−1) | Stable | 50.72 | 27.934 | 78.65 | 0.64 | 17,359.25 | 8.231 |
| Av. K (mg kg−1) | Stable | 0.40 | 0.143 | 0.54 | 0.74 | 33,708.12 | 84.609 |
| DTPA Fe (µg kg−1) | Stable | 0.19 | 0.264 | 0.45 | 0.41 | 15,044.21 | 541.570 |
| DTPA Zn (µg kg−1) | Stable | 0.20 | 0.033 | 0.23 | 0.86 | 26,154.06 | 126.429 |
| DTPA Mn (µg kg−1) | Spherical | 0.22 | 0.085 | 0.30 | 0.72 | 11,080.77 | 367.920 |
| DTPA Cu (µg kg−1) | Spherical | 0.08 | 0.355 | 0.43 | 0.18 | 15,340.73 | 87.910 |
| Sand (%) | Stable | 0.01 | 0.007 | 0.01 | 0.48 | 37,650.31 | 6.847 |
| Clay (%) | J-Bessel | 0.03 | 0.02 | 0.05 | 0.67 | 20,425.33 | 3.748 |
| B.D. (Mg m−3) | J-Bessel | 0.00 | 0.00 | 0.00 | 0.57 | 21,798.39 | 0.034 |
| S.P. (%) | Gaussian | 0.01 | 0.00 | 0.02 | 0.44 | 23,877.11 | 4.131 |
| F.C. (%) | Stable | 0.00 | 0.00 | 0.01 | 0.53 | 16,586.41 | 1.650 |
| P.W.P. (%) | Exponential | 0.01 | 0.01 | 0.02 | 0.59 | 20,963.86 | 1.559 |
| A.W. (mm m−1) | J-Bessel | 0.01 | 0.01 | 0.01 | 0.79 | 39,149.09 | 9.221 |
| Ks (cm h−1) | Stable | 0.00 | 0.21 | 0.21 | 0.00 | 20,827.91 | 0.532 |
| PC1 | PC2 | PC3 | PC4 | PC5 | PC6 | |
| Eigenvalue | 5.157 | 2.639 | 2.248 | 1.876 | 1.367 | 1.069 |
| Variability (%) | 28.648 | 14.661 | 12.488 | 10.423 | 7.595 | 5.936 |
| Cumulative (%) | 28.648 | 43.309 | 55.797 | 66.220 | 73.815 | 79.751 |
| PC loading for each variable | ||||||
| PC1 | PC2 | PC3 | PC4 | PC5 | PC6 | |
| ECe (dSm−1) | −0.019 | 0.601 | −0.478 | 0.492 | 0.162 | −0.065 |
| pH | 0.277 | −0.275 | 0.685 | 0.047 | −0.281 | 0.110 |
| CaCO3 (%) | −0.395 | 0.487 | 0.118 | −0.349 | −0.026 | −0.465 |
| Av. N (mg kg−1) | −0.312 | 0.711 | 0.135 | −0.165 | 0.194 | −0.115 |
| Av. P (mg kg−1) | −0.049 | 0.502 | −0.498 | 0.503 | 0.020 | 0.080 |
| Av. K (mg kg−1) | 0.172 | −0.506 | −0.277 | 0.564 | −0.296 | 0.018 |
| DTPA Fe (µg kg−1) | −0.191 | −0.493 | −0.273 | 0.138 | 0.622 | −0.148 |
| DTPA Zn (µg kg−1) | −0.100 | −0.409 | 0.114 | 0.233 | −0.274 | −0.510 |
| DTPA Mn (µg kg−1) | −0.081 | −0.622 | −0.088 | 0.117 | 0.553 | −0.145 |
| DTPA Cu (µg kg−1) | −0.180 | 0.056 | −0.343 | 0.290 | −0.469 | 0.154 |
| Sand (%) | 0.690 | −0.120 | −0.498 | −0.453 | −0.036 | 0.019 |
| Clay (%) | −0.922 | −0.128 | −0.086 | −0.209 | −0.037 | 0.070 |
| B.D. (Mg m−3) | 0.965 | 0.100 | 0.021 | −0.019 | 0.065 | −0.100 |
| S.P. (%) | 0.044 | 0.075 | 0.306 | 0.061 | 0.316 | 0.656 |
| F.C. (%) | −0.943 | −0.049 | 0.224 | 0.168 | −0.013 | 0.047 |
| P.W.P. (%) | −0.922 | −0.155 | −0.147 | −0.206 | −0.081 | 0.149 |
| A.W. (mm m−1) | −0.322 | 0.176 | 0.631 | 0.616 | 0.130 | −0.123 |
| Ks (cm h−1) | 0.779 | 0.221 | 0.403 | 0.190 | 0.133 | −0.068 |
| MZ | No. | EC | pH | N | P | K | Fe | Zn | Mn | Cu | CaCO3 | Sand | Clay | BD | S.P. | F.C. | P.W.P | A.W. | Ks |
|---|---|---|---|---|---|---|---|---|---|---|---|---|---|---|---|---|---|---|---|
| 1 | 24 | 4.52 ab | 7.91 b | 1147.9 a | 25.5 a | 98.7 ab | 432.4 b | 233.5 bc | 367.5 c | 135.1 b | 5.9 b | 68.8 ab | 16.9 b | 1.49 a | 45.1 a | 21.2 b | 12.0 b | 92.6 bc | 1.17 a |
| 2 | 7 | 7.23 a | 7.89 c | 1078.6 ab | 15.9 bc | 120.1 a | 1069.1 ab | 244.1 ab | 707.8 b | 157.7 ab | 7.9 a | 67.2 b | 15.9 b | 1.49 a | 43.7 b | 21.1 b | 11.6 b | 94.4 ab | 1.11 ab |
| 3 | 2 | 3.03 b | 8.02 a | 1000.0 bc | 8.1 c | 140.3 a | 2953.0 a | 257.0 a | 764.7 ab | 216.2 a | 8.7 a | 71.1 a | 17.5 b | 1.49 a | 44.0 b | 21.3 b | 12.0 b | 89.5 c | 0.98 bc |
| 4 | 4 | 2.03 c | 7.95 ab | 1225.0 c | 27.3 a | 58.6 b | 297.8 b | 218.4 c | 1138.1 a | 149.1 b | 4.9 b | 63.7 c | 20.2 a | 1.47 b | 45.0 a | 22.8 a | 13.1 a | 97.3 a | 0.85 c |
Publisher’s Note: MDPI stays neutral with regard to jurisdictional claims in published maps and institutional affiliations. |
© 2022 by the authors. Licensee MDPI, Basel, Switzerland. This article is an open access article distributed under the terms and conditions of the Creative Commons Attribution (CC BY) license (https://creativecommons.org/licenses/by/4.0/).
Share and Cite
Aggag, A.M.; Alharbi, A. Spatial Analysis of Soil Properties and Site-Specific Management Zone Delineation for the South Hail Region, Saudi Arabia. Sustainability 2022, 14, 16209. https://doi.org/10.3390/su142316209
Aggag AM, Alharbi A. Spatial Analysis of Soil Properties and Site-Specific Management Zone Delineation for the South Hail Region, Saudi Arabia. Sustainability. 2022; 14(23):16209. https://doi.org/10.3390/su142316209
Chicago/Turabian StyleAggag, Ahmed M., and Abdulaziz Alharbi. 2022. "Spatial Analysis of Soil Properties and Site-Specific Management Zone Delineation for the South Hail Region, Saudi Arabia" Sustainability 14, no. 23: 16209. https://doi.org/10.3390/su142316209
APA StyleAggag, A. M., & Alharbi, A. (2022). Spatial Analysis of Soil Properties and Site-Specific Management Zone Delineation for the South Hail Region, Saudi Arabia. Sustainability, 14(23), 16209. https://doi.org/10.3390/su142316209