1. Introduction
In recent years, the civil engineering construction industry has proposed higher requirements for design and construction efficiency. Building information modeling (BIM) promotes informatization, visualization, and efficient collaborative work, which improves the efficiency of infrastructure construction. Three-dimensional models and relative parameters are created using BIM to guide infrastructure construction. In addition, all project participants can work together and share information through BIM.
However, the integration of BIM and tunnel engineering is still at a developmental stage. In the literature, BIM and IoT technology were applied to the design, in the pre-construction and construction phases of a utility tunnel, to evaluate the benefits of BIM and IoT technology [
1]. Additionally, tunnel engineering was conducted by combining the principles of BIM, collaboration, full life cycle, and 3D digital data with geotechnical engineering [
2]. Furthermore, BIM was used to predict the sensitivity of building settlements caused by tunnel excavation [
3]. In terms of engineering management, tunnel engineering was used as an experimental platform to develop a BIM-based facility management system [
4] and to optimize a design scheme [
5]. These studies provide an overview of the scope and direction of the application of BIM in tunneling engineering, and suggest that external data, other software, and program development are common methods to achieve the further integration of BIM into tunneling engineering.
Most countries in the world have already taken aggressive action to reduce carbon emissions, with China aiming to peak its carbon dioxide emissions by 2030 and achieve carbon neutrality by 2060 [
6]. At present, China’s highway tunnel construction is rapidly developing, and this tunnel construction consumes a considerable amount of materials and energy, while releasing large amounts of greenhouse gases into the atmosphere. Tunnels are considered to be the most materially dense and energy intensive part of transportation infrastructure [
7]; therefore, a reduction in tunnel emissions is crucial.
2. Literature Review
One reason why BIM technology cannot be efficiently combined with tunnel engineering is that Revit software does not include tunnel components. Furthermore, Revit cannot create the three-dimensional curves that are required in tunnel engineering design. Fabozzi et al. [
8] used Bentley software to model a tunnel’s structure and foundation, and they verified the feasibility of BIM–to–FEM–to–BIM by using Plaxis 3D. Getuli et al. [
9] developed a system of four coupled algorithms to generate an as-built model of a mechanized tunnel engineering, using real-time data collected by the TBM. Sharafat et al. [
10] adopted a multi-model tunnel information modeling (TIM) framework to improve the management, construction, and delivery of tunnel engineering. A tunnel excavation profile and a tunnel axis can be designed using Civil 3D software during the parametric modeling of tunnels with curved alignments [
11]. Yang et al. [
12] designed a highway tunnel based on CATIA, but its route skeleton needed to import the two-dimensional CAD design drawing of a tunnel route into the mountain model first and then generate the spatial skeleton of the tunnel path through the function for mixing curves. Other studies have attempted to design shield tunnel curves in BIM using different methods [
13,
14]. The abovementioned studies applied BIM to design tunnel models, but all of them processed the tunnel models in the early stages using multiple pieces of software or self-written algorithms that better served each specific project; however, they did not have strong applicability to other types of tunnels. Therefore, if design could be directly performed in Autodesk Revit, the modeling efficiency and accuracy would be improved.
The Revit application in BIM software is not adequate for various types of engineering design; however, the existence of Dynamo has led to a qualitative leap in the range of Revit applications. Dynamo was developed based on the basic concepts of visual programming, and it has become a major application platform for construction engineering [
15]. A set of step-by-step program flows can be established by connecting nodes with predefined functions in a work interface, and solving a problem through the basic logic of input, processing, and output [
16]. Wu et al. [
17] used Dynamo to integrate and package repetitive operations, but the realization of the 3D lofting of a tunnel design axis needed the Powercivil software. Tang et al. [
18] defined X, Y, and Z coordinates for each control point through the native code in Dynamo to determine the 3D axis, and then they added a cross section according to each point. Wang et al. [
19] input the coordinates of multiple control points to fit the three-dimensional axis of a tunnel and used Dynamo to write a tunnel section program to create a model. When Hegemann et al. [
20] established a tunnel model using Dynamo, they copied the tunnel ring model, rotated the rotation matrix around X, Y, and Z so it was aligned with the target direction, and then attached individual attributes to the newly built ring. Zhu et al. [
21] used Dynamo programming technology to control the deviation between the tunnel segment ring and the design axis, and then they created and operated three planes (front, back and ring center plane) to achieve the accurate control of each tunnel ring’s assembly point. In these studies, Dynamo visual programming technology was used to create a 3D tunnel model to break down the barrier of combining BIM with tunnels. However, the creation of a 3D axis requires the input of the Z coordinate’s value of the control point, and the Z coordinate’s value obtained in the design stage often has errors. In this study, the three-dimensional axis of a tunnel was obtained by combining the data of flat and vertical curves with a Dynamo script. Furthermore, the control points on the 3D axis were captured to create vectors in the X, Y and Z directions to reduce modeling deviation.
In order to reduce the carbon emissions of a tunnel, it is particularly important to evaluate the carbon emissions of the tunnel construction process. However, there is a lack of uniform standards for evaluating carbon emissions in tunnel engineering [
22]. Song and Xia [
23] proposed a carbon emission model equipped with a self-organizing mapping optimization algorithm to quantify the carbon emissions of a drill-and-blast mechanized tunnel construction system. Miliutenko et al. [
7] found that the tunnel operation stage accounted for the highest proportion of energy consumption and greenhouse gas emissions in the tunnel life cycle. Guo et al. [
24] calculated a large number of tunnel construction carbon emission calculation results, used statistical analysis to explore the key influencing factors of tunnel construction carbon emissions, and established a carbon emissions prediction equation using the linear regression method. The data sources of the abovementioned studies were mostly actual construction data and prospect data. If carbon emissions are assessed at the design stage, the prospect data obtained based on design data will lack accuracy. Therefore, prospect data can be obtained from the schedule of quantities generated by BIM. The amount of building materials obtained in this way is consistent with that in real-life situations. Furthermore, carrying the carbon emissions of components into the Revit component family can not only improve the accuracy of tunnel carbon emission evaluation, but also realize the further combination of tunnel engineering and BIM. Several studies [
25,
26,
27] have combined BIM with carbon emission evaluation in engineering, but few have addressed carbon emissions in the context of the combination of tunnelling engineering and BIM. Although Sun and Park [
28] proposed a calculation method for combining CO
2 emissions with BIM during tunnel construction, their analysis’ object was a 10 m tunnel section, not a complete tunnel project.
Based on the visual programming of Dynamo, this study realized the three-dimensional modeling of a double-cave mountain tunnel project. Firstly, a generic lining component was created in Revit, and then a script was created based on Dynamo visual programming to realize the batch parameterization of tunnel-lining components, the automatic assembly of lining components along a three-dimensional axis, and the connection between a cross-passage model and a tunnel mainline model. Finally, the carbon emissions of the components and the list data of tunnel construction materials were obtained according to the BIM, the fuel and electric energy consumed by the machinery were calculated according to the quantities, and then the carbon emissions in the construction stage of the tunnel project were calculated based on the emission coefficient method. This study improves the efficiency of tunnel modeling and elaborates a new direction for the combination of BIM technology and tunnel engineering. Furthermore, it increases the accuracy of tunnel carbon emission assessment, realizes the further optimization of tunnel engineering design, and highlights the advantages of BIM.
3. Research Objective and Method
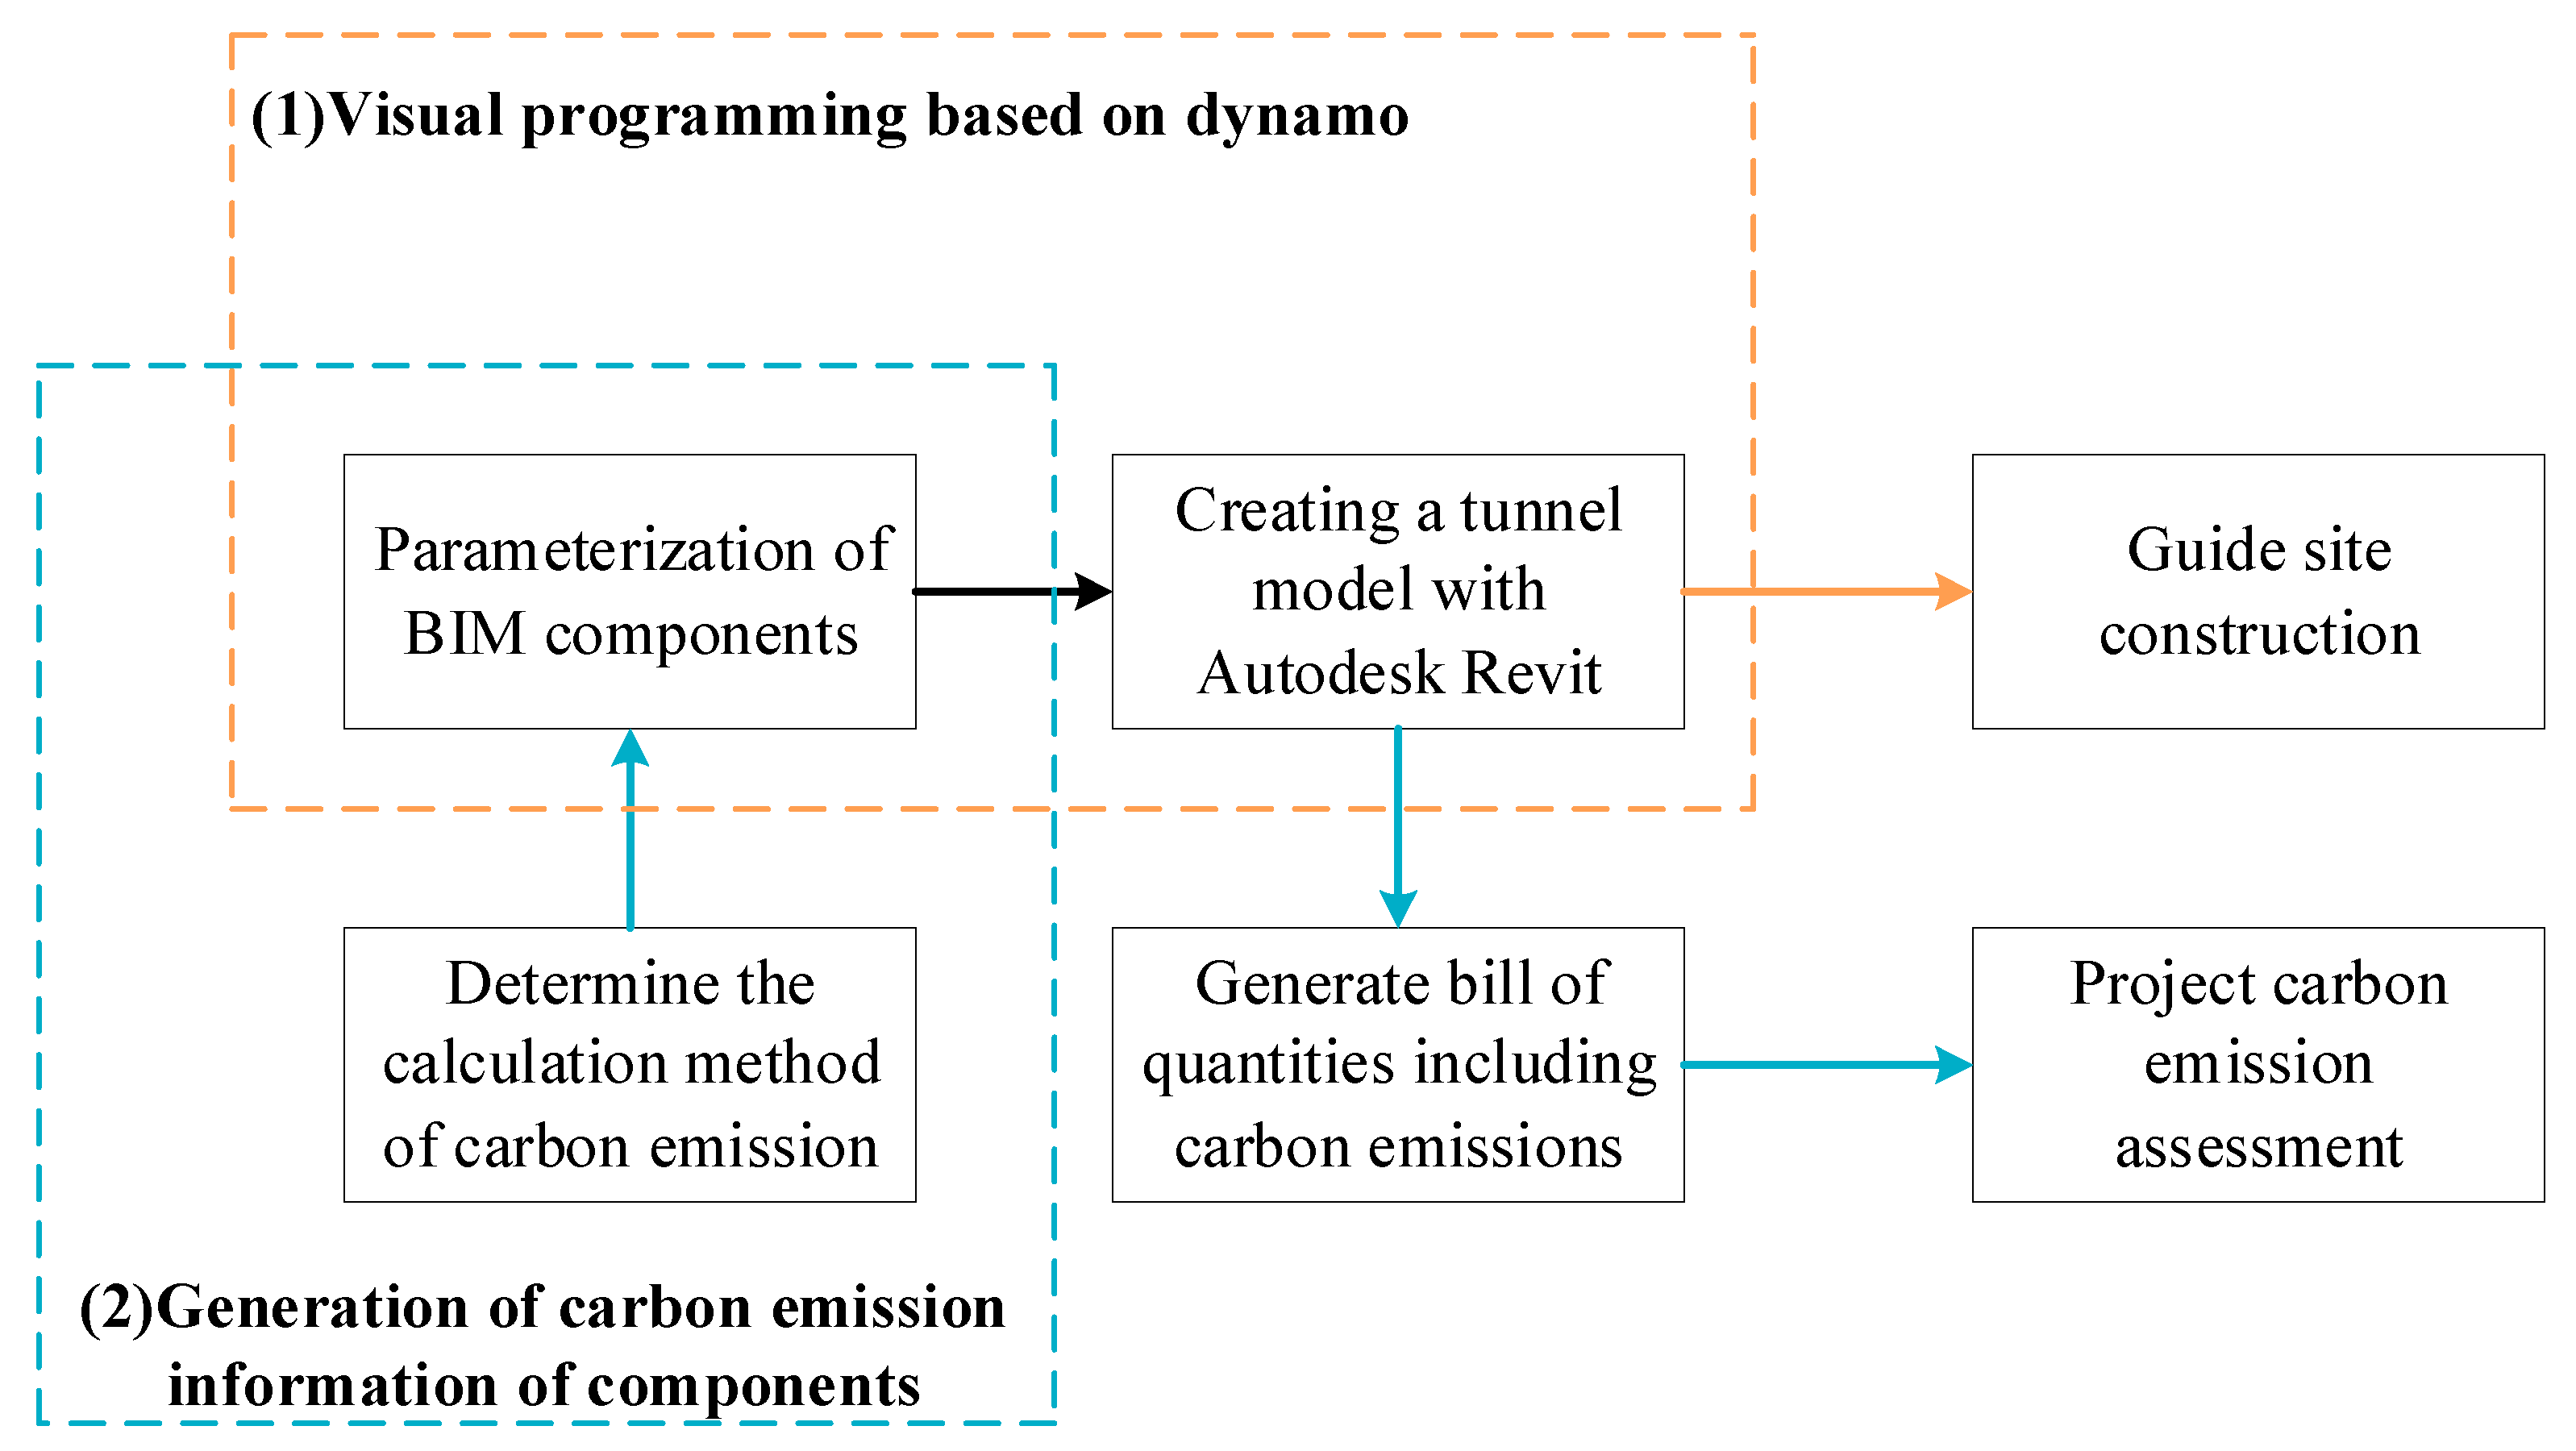
The research process is shown in
Figure 1. Specifically, this research mainly included two parts: (1) We created a three-dimensional building information model in Autodesk Revit 2016 with Dynamo visual programming based on a case of a tunnel in northwest China (the dynamo version is 1.3.); the Dynamo programming script was based on existing studies [
29,
30], and the tunnel design was developed according to the “Specifications for Design of Highway Tunnels” [
31], “Guidelines for Design of Highway Tunnel” [
32], and “Specifications for Seismic Design for Highway Tunnels” [
33]. The modeling process was divided into component parameterization and tunnel model assembly, and the specific process of parametric modeling is described in
Section 2. (2) On the basis of existing theoretical research [
22,
24], we determined the calculation method of carbon emission assessment based on BIM. In the first part of the component parameterization process, the carbon emissions generated by the consumption of building materials were assigned to the component information. Additionally, the carbon emissions during tunnel construction were calculated according to a bill of quantities that was generated by the tunnel model. The carbon emissions of the project were evaluated to guide on-site construction. The methods and applications of this study are described in the following sections.
4. Parametric Modeling Based on Dynamo Visual Programming
Due to the lack of a tunnel component model in Autodesk Revit, a standardized family library of tunnel component models needed to be created. The creation of a three-dimensional (3D) tunnel model was divided into two steps. Firstly, the tunnel component family was created through Revit’s external family function, and the component family was parameterized in batches so that different kinds of component models could be obtained. Then, the family library could be created. Secondly, we assembled tunnel component entities along the 3D axis, which needed to be implemented in Dynamo. We wrote a script in Dynamo to create a 3D axis and picked the station through the node command to complete the assembly of lining components.
Parameterization is an important step to realize the informatization of a tunnel model. The specific parametric modeling process is shown in
Figure 2. First, we drew an outline of each component through the “Metric Profile Family” of Revit and then created the solid model of the lining component. Second, we imported the curve data of the tunnel into Dynamo to create the 3D axis. Third, the components were parameterized in batches, and the carbon emissions were loaded onto the components via parameter assignment. Fourth, we completed the assembly of the tunnel mainline model through the script. Finally, the cross-passage was created, and the establishment of each cross-passage model was realized through an independent script.
5. Carbon Assessment Methods
The calculation boundary of carbon emissions had to be determined before the assessment. The construction process of a tunnel includes surrounding rock excavation, advance support, initial support, lining, the backfilling of the inverted arch, pavement laying, the construction of auxiliary facilities, tunnel ventilation, foundation treatment for tunnel exit, and other processes, such as the use of building materials and energy, which naturally produces greenhouse gases. The rock at the location of the tunnel chamber to be excavated is not suitable for use as a raw material for the production of concrete. Thus, the recycling of the rubble generated by the excavation of the surrounding rock was not considered in the calculations. In calculating the carbon emissions generated during transportation and construction, the transportation distance of the tunnel only considers the transportation distance in the tunnel, as the material storage of the tunnel is located at its entrance and exit. The transportation machinery used during construction includes dump trucks, loaders, concrete mixers, bucket trucks, and concrete pumps. Construction machinery includes air compressors, concrete mixing stations, AC arc welders, tunnel ventilators, excavators, concrete sprayers, and pile drivers. Greenhouse gas emissions from machinery used for manufacturing are not considered. During tunnel construction, greenhouse gas emissions are generated by mechanical transport, mechanical operation, and material production, so the carbon emissions of these three parts had to be calculated [
24,
28].
Data sources were divided into foreground data and background data. Foreground data were sourced from project design data, a BIM-based list of quantities, and relevant norms and quotas (“Budgetary Norm of Highway Project” and “The Fixed Cost of Highway Engineering Machinery Shift” [
34,
35]). Carbon emissions were calculated using the emission coefficient method.
Different study areas affect the carbon emissions of energy and materials in the production process, so the carbon emission factors used in this study mainly originated from domestic articles and the literature. The recommended values of diesel and gasoline emission factors given in “Standard for Building Carbon Emission Calculation” [
36] are 72.59 g CO
2eq/MJ and 69.91 g CO
2eq/MJ, respectively. In this paper, the carbon emission factors of diesel and gasoline were set to 2.171 t CO
2eq/t and 1.921 t CO
2eq/t [
37]. The emission factors of electricity were determined on the basis of the grid carbon emission factors released by the Ministry of Ecology and Environment of China [
22]. The carbon emission amount of sand is between 0.0015 and 0.024 t CO
2eq/t [
38], and the carbon emission coefficient of sand was determined to be 0.004 t CO
2eq/t in this paper [
37]. Shen L et al. [
39] obtained data on the activity level of 359 cement production lines in China, and they found that the comprehensive emission factor of cement products was 0.702 t CO
2eq/t. Based on the “GHG Emission Accounting Method and Reporting Guide for Chinese Steel Production Enterprises” [
40], Liu et al. [
41] calculated that the carbon emission factor of steel production was 2.309 t CO
2eq/t. In “Standard for Building Carbon Emission Calculation” [
36], the average carbon emission of carbon steel was calculated as 2.05 t CO
2eq/t. In this paper, the carbon emission coefficient of steel was set as 2.309 t CO
2eq/t. The carbon emission coefficient of mineral powder and asphalt was determined according to the study of Guo et al. and Wang et al. [
24,
42]. The carbon emission factor of lime was calculated using the data given by Hammond et al. [
43].
The calculation formula of carbon emission
[
22] of materials consumed is as follows:
where:
is the material category;
is the emission factor of material
; and
is the consumption of material
.
The calculation formula of carbon emission
[
22] generated by construction machinery is as follows:
where:
is the category of machinery;
is the emission factor of fuel or electric energy used by machinery
;
is the energy consumption per unit time of machine
; and
is the working time of machine
.
The calculation formula of carbon emission
[
22] generated by transportation machinery is as follows:
where:
is the vehicle category;
is the emission factor of the fuel used in vehicle
;
is the fuel consumption per unit time of vehicle
; and
is the working time of vehicle
.
6. Engineering Application
6.1. Engineering Background
This tunnel is located in northwest China, and it is a double-hole tunnel with separated left and right lines. The length of the right line is 1235 m, and the length of the left line is 1229 m. The right geological section of the tunnel is shown in
Figure 3. The tunnel passes through three geomorphic units: the tectonic denudation of low and middle mountains, an alluvial terrace, and the erosion accumulation of loess ridges and hills. The gradient of the road at the entrance and exit of the tunnel is relatively large, from about 45° to 60°. However, the gradient at the middle of the tunnel is relatively gentle. The soils in the tunnel site area are mainly Quaternary Holocene slope accumulation powder with gravel (Q
4dl), Quaternary Upper Pleistocene wind accumulation loess (Q
3eol), and Quaternary Upper Pleistocene alluvial powder clay with gravel (Q
3pl); the underlying bedrock is Lower Paleozoic black mica gneiss with black mica quartz gneiss and granite veins (Pz
1n
), and the rock shear strength is high.
According to the geology and surrounding rock conditions, the tunnel structure is divided into integral open-cut tunnel lining, the composite lining of the portal section, the composite lining of the shallow embedded preloading section, the composite lining of the shallow buried section, and the composite lining of the deep buried section. The composite lining was designed and constructed based on the principle of the NATM (New Austrian Tunnelling Method).
Figure 4 illustrates the key steps of the NATM, where the tunnel is supported by anchors, sprayed concrete, reinforcing mesh, and steel arches as the initial support. In addition, molded concrete or reinforced concrete is treated as the secondary lining, which forms a permanent load-bearing structure. The entrance and exit of the tunnel are laid out according to the principle of “Entering the tunnel early and leaving the tunnel late”. To reduce excavation, a semi-bright and semi-dark arch scheme is adopted to enter the tunnel at the places with biased terrain and a steep slope. Reinforced section lining is set at the intersection of the vehicle crossing tunnel and the main tunnel. All grades of the surrounding rock of the vehicle crossings are equipped with reinforced sections, fire door sections, and general sections of composite lining. All grades of the surrounding rock of the pedestrian crossings are equipped with reinforced sections and general sections of composite lining. Collapsible loess is distributed in the construction section outside the tunnel exit, so lime–soil compaction piles were laid for foundation treatment in this project.
6.2. Tunnel Model Design
The surrounding rock grades and geological conditions determine that the mountain tunnel is composed of different types of lining. Based on the idea of Dynamo parametric modeling, each type of lining section needed to be separately created, and each lining section needed to create a linear meter entity. Firstly, we built a new “Metric Profile Family” to draw the contour of each whole lining. Revit cannot create solids for more than one closed drawing at a time with the sweep function, so the contour family of lining had to be divided into contour families of individual components. The split-up of the lining profile is shown in
Figure 5.
Figure 5 shows the creation process of the entity. The creation of component entities also needed to be realized through an external family’s building. Although the “Metric Structural Framing Family” can also generate entity, it is mostly used for the creation of structural analysis models and beam components. Therefore, the “Metric Generic Model Family” was used to create component entity. Entity creation was completed by defining the sweep path and direction and by importing the profile family.
Different lining types were designed depending on the grade of the surrounding rock in which the tunnel is located. The main line in the left and right directions of the tunnel consists of 16 types of lining sections, and 12 component models needed to be created for each type of lining section. A total of 192 family members were established for the mainline of the tunnel.
Figure 5 shows the model library of various members of lining obtained through the modeling.
We decided to directly create a 3D model in Autodesk Revit. At the same time, in order to avoid the axis error caused by the input of the Z coordinate values, the authors of this paper integrated flat curve and vertical curve data through Dynamo visual programming to obtain the 3D axis of the tunnel, where some of the nodes were derived from the Oppendesigner node package [
30].
Figure 6 shows the creation of the 3D axis.
Before creating the mainline model of the tunnel, the component entity needed to be parameterized; that is, we needed to define the name, material, section code, location code, surrounding rock grade and carbon emissions. After the parameter name was assigned to the component of lining, the model was assembled along the three-dimensional axis in Dynamo and the component parameters were assigned. After reading the component parameter information table, the component family could be imported into the script for the creation of the tunnel mainline model. Parameter assignment was conducted after calculating the carbon emissions of the lining family members, which allowed us to establish the carbon emissions of the building information model.
Figure 7 shows the batch parameterization script for the components built in Dynamo. The script was derived from the study of Zhang [
30], and it was used to efficiently conduct the parameter assignment of the carbon emissions in each mileage section.
The parameterization results are shown in
Figure 8. It can be seen that the constructed carbon emissions were loaded onto the building information model in addition to other component information. This way, the carbon emissions from the materials consumed in the tunnel could be directly summed from the schedule after the overall model was completed. Moreover, nodes were added to assemble the tunnel mainline model along the axis based on the parametric script.
After the mainline model of the tunnel was created, the cross-passage model was created. Since the cross-passage are not on the tunnel axis, it was necessary to establish the coordinate system of the cross-passage to obtain the cross-passage model, so as to realize the accurate control of the angle and position of the cross-passage model.
Figure 9 shows the script for creating the cross-passage model. On the basis of previous studies [
30], the script adjusted the length and rotation angle of the cross-passage as needed. For the intersection point between the cross-passage and the mainline of the tunnel, we input the mileage of the cross-passage and captured the corresponding position of the three-dimensional curve. The cross-passage model could not be precisely defined in three dimensions by the mileage data, and three vectors could be created at the origin of the coordinate system according to the right-hand criterion. The first two vectors were the tangential and normal vectors of the three-dimensional axis at the origin of the coordinate system, and the third vector was the cross product of the first two vectors.
This tunnel is located in the Loess Plateau area, and collapsible loess is distributed under the roadbed at the exit of the tunnel. If the collapsible loess is soaked by water, its structure will be rapidly destroyed under pressure, which will affect the stability of the subgrade. In this project, a lime–soil compaction pile could be used to treat the loess’ foundation, as shown in
Figure 10. The pile could be positioned based on the shaft network and arranged according to the equilateral triangle. The upper part of the pile could be filled with soil for the embankment.
6.3. Application of 3D Building Information Model Visualization
Adopting Autodesk Navirsworks for collision detection could not only reveal errors in the modeling process, but also review errors in the 2D drawings. Moreover, we generated model inspection reports in time to report to the design unit for errata, so as to avoid having construction units reworking due to drawing errors.
As shown in
Figure 11, collision detection was carried out on the model in Navirsworks. It can be seen that the No. 1 cross-passage collided with the mainline model of the tunnel and the collision type was hard collision. Therefore, it was necessary to calibrate the angle of the cross-passage model. After comparing the two-dimensional drawings, it was found that the angle of the model was consistent with the drawing, and it could be concluded that there was an error in the drawing design. We returned to Revit to adjust the angle of the cross passage, and then conducted collision detection. We repeated this operation to correct the angle of the cross passage, generated a report, and sent it to the construction and design parties.
In addition, BIM could be used to simulate the construction process. We rehearsed the complex construction process to reasonably arrange personnel, machinery and materials. At the same time, the construction process was simulated for other construction personnel and other participating units who are not familiar with the construction, in order to facilitate the collaborative work of all participants.
Figure 12 shows the demonstration of the NATM construction process involved in the tunnel. The tunnel was excavated to simulate different soil layers illustrated in different colors. The advanced support measures adopted in this case mainly included the advanced long pipe shed, the advanced small conduit, and the advanced anchor rod. The advanced long pipe shed was set at the tunnel entrance, and the depth of its immersion depended on the terrain and geological conditions. After the anchor bolt construction was completed, the initial support was looped as soon as possible to meet the stability requirements of the surrounding rock. The construction of the secondary lining was carried out with the assistance of the secondary lining trolley. The trolley operated on the working plane formed by the backfilling after the completion of the inverted arch. The secondary lining was not used as the main load-bearing structure and could meet the aesthetic requirements.
6.4. Project Carbon Emission Assessment
The carbon emissions released from construction consumables were calculated as a total of the carbon emissions in a detailed list generated by the tunnel BIM process. Moreover, this section was calibrated against the quantity table given by the design data.
Due to the various processes of tunnel construction, the machinery and building materials required for each stage of the construction procedure were as follows: When grouting, we input cement, steel, sand, electric energy, and diesel oil. For the Grade V surrounding rock, we adopted Φ42 mm and Φ60 mm small conduit grouting. The slurry material was M30 cement mortar. We Adopted Φ22 advanced bolt support, input electric energy and steel into the surrounding rock excavation, and used an air-leg rock drill to cooperate with the air compressor to drill. The surrounding rock support needed steel, cement, sand, electric energy, diesel oil, a cement powder bolt of Φ42 mm, and a hollow grouting bolt of D25 × 5 mm. C25 shotcrete was used for initial support. Steel, cement, sand, gravel, electric energy, and diesel were used for the secondary lining. C30/C35 (steel bar) concrete was used for the arch wall and inverted arch, and pumped concrete was used for the whole casting. Concrete was produced by mixing stations at both ends of the tunnel inlet and outlet, and the transportation distance was included in the quota. Asphalt, mineral powder, concrete, and electric energy were invested in the roadbed and pavement engineering. The cement concrete base was of C20 grade, and the surface layer adopted cast-in-place concrete. The road surface comprised polymer-modified asphalt concrete. The cable trough needed cement, sand, electric energy, and diesel oil. The trough wall comprised cast-in-place C30 concrete, and the cover plate comprised C30 precast concrete. According to the “Budgetary Norm of Highway Project” [
34] calculation, the tunnel ventilation input electric energy using an axial flow fan within 75 KW. The lime–soil compaction pile was obtained by mixing lime and soil at a volume ratio of 3:7.
The number of machine shifts was selected according to the “Budgetary Norm of Highway Project” [
34], and the amount of fuel or electricity consumed by each mechanical shift was determined according to the “The Fixed Cost of Highway Engineering Machinery Shift” [
35]. The energy consumption is shown in
Table 1.
According to the emission coefficient method, the carbon emissions of various building materials and energy were finally obtained, as shown in
Table 2. The proportions of carbon emissions generated by various building materials and energy sources of the tunnel in the construction stage are shown in
Figure 13. Of these, electric energy accounted for 43.75%, which was the largest proportion. Cement accounted for 34.57%, steel accounted for 19.12% and diesel accounted for 2.09%. The others demonstrated a weak impact on tunnel carbon emission, with sand accounting for 0.26%, lime accounting for 0.07%, asphalt accounting for 0.06%, mineral powder accounting for 0.05%, and gasoline accounting for 0.04%. The operation of construction machinery consumed a significant amount of electric energy. According to
Table 1, the air compressor consumed the most power, because it needed to be used in grouting, tunnel excavation, surrounding rock support and other links. The tunnel ventilator was next, and other types of machinery were found to consume less energy.
The construction of the tunnel involved three kinds of excavation methods. The carbon emissions of one meter of tunnel excavation process were calculated by selecting tunnel sections constructed by different excavation methods. As shown in
Figure 14, the CD method produced the highest carbon emissions, followed by the partial excavation method and the bench cut method.
7. Discussion
In this paper, a tunnel model was built by assembling lining components in Autodesk Revit through the batch parameterization of Dynamo visual programming, which realized the automatic assembly of tunnel components. The visualization function of BIM was used for model collision detection and key process simulation, and the efficient processing and reasonable planning of the tunnel project were realized.
Furthermore, on the basis of previous research, this paper combined the study of tunnel carbon emissions with BIM, completed calculations of carbon emissions in the stage of project construction with a table of engineering details generated by BIM, and significantly improved the calculation accuracy. In terms of the proportion of carbon emissions generated by various building materials and energy sources, the carbon emissions generated by electricity were the largest in energy, while those from cement and steel were the largest in materials. Reducing emissions not only requires choosing low-energy products, but also reducing waste in the construction process. The production technology gap between large-scale production lines and small-scale production lines is small, but the energy consumption of large-scale production lines is lower. Therefore, large-scale production lines are preferred. Electricity is required for the production, processing, consumption, and operation of most materials, which explains the high carbon emissions from electrical energy. An air compressor is the most energy-consuming of all construction machinery. In order to reduce electric energy consumption in surrounding rock excavation, a construction scheme should be planned based on the principle of giving full play to the bearing capacity of the surrounding rock itself. Construction machinery and equipment with matching power and loads can be chosen to run high-power equipment at low loads for a long time. The excavation method affects the carbon emissions generated by tunnel construction, so an excavation method with low carbon emissions can be selected while considering the types of surrounding rock and mechanical properties.
In this study, tunnel components were assembled along the control points of the axis by a Dynamo script, and the spatial positions of lining components were accurately controlled. However, due to the complexity of the tunnel structure itself, different assembly strategies were proposed for different components, and a large number of scripts were created. Therefore, it is necessary to further develop scripts, encapsulate multiple programs, and simplify visual Dynamo programming programs. The authors of this paper conducted carbon emissions calculations for a practical project, and the conclusions drawn are limited to this project. The general rule of carbon emissions in tunnel construction should be based on a large number of samples, but the research method proposed in this paper can be referenced. In the analysis method of this paper, we can continue to develop a BIM-based tunnel construction carbon emissions assessment system to explore the influence of various factors on the carbon emissions of tunnel construction at a certain level of significance.
8. Conclusions
In this study, based on Dynamo visual programming, the components of lining were parameterized in batches and a component model was assembled along a three-dimensional axis, realizing the informatization and high efficiency of model design. On this basis, the construction process was reasonably arranged through the visualization function of the model. Following the establishment of the carbon emissions boundary, the project’s carbon emissions from material manufacturing, transportation, and on-site construction were assessed using the emission coefficient approach, resulting in a combination of deep-seated and multidimensional BIM and tunnel engineering.
The results of this paper verify that batch parameterization has a high efficiency in assigning component parameters. For projects with long tunnel mileage and many component types, the application of batch parameterization eliminates the tedious operations in previously established processes of modeling, and significantly shortens the modeling cycle. In the design phase, parameter information and carbon emissions are integrated into the building information model. If the deviation between the actual construction and the design exceeds the allowable value, it can be quickly identified and adjusted according to the component information.
Previous studies used another software to process models in the early stage, which is prone to model information loss and is less applicable to other projects. Some studies directly used Dynamo for tunnel design in Autodesk Revit, but the Z coordinate’s value of the control point is input when the three-dimensional axis of the tunnel is created in this process, which can easily cause a large deviation between the building information model and the tunnel axis of the actual project. In this paper, the tunnel axis was obtained by combining the data of flat and vertical curves. Based on the vector in the spatial coordinate system, the plane and space positions of the component model were adjusted by adjusting the vector on the axis to improve the modeling accuracy. Dynamo provides a graphical programming function for users to interact with the Revit family. Dynamo visual programming technology was used in this study not only to consider the key design parameters, but also to meet the assembly constraints.
A tunnel project requires many procedures and a large amount of engineering, which means that the calculation of tunnel carbon emissions was not accurate enough in the past. Sun et al. [
28] calculated the carbon emissions of tunnel construction using BIM software, but they mainly studied the methodology and could not accurately reflect a real-life situation of complete project construction. The method for carbon emissions calculation of tunnel construction based on BIM proposed in this study can realize the quantitative carbon emissions calculation of a complete tunnel through Dynamo batch parameterization script. Based on the analysis of carbon emissions in the tunnel construction process, the proposed method has reference significance for the selection of low-carbon materials, equipment, and construction methods before construction.


