Article

Multi-Oligopoly Sequential Pricing Mechanisms and Their Game Analysis in Raw Material Supply Chains

1
School of Business, Hunan University of Science and Technology, Xiangtan 411201, China
2
School of Electrical and Information Engineering, Changsha University of Science and Technology, Changsha 410114, China
*
Author to whom correspondence should be addressed.
These authors contributed equally to this work.
Sustainability 2022, 14(23), 16231; https://doi.org/10.3390/su142316231
Submission received: 10 September 2022 / Revised: 26 November 2022 / Accepted: 1 December 2022 / Published: 5 December 2022
(This article belongs to the Section Sustainable Engineering and Science)

Abstract

:
The sequential pricing game model is an approach that can be effectively used to solve the problem with multi-oligopoly pricing mechanisms in raw material supply chains. However, the existing sequential pricing mechanism does not fully consider constraints such as the purchase volume of downstream firms and the change information of each parameter, which leads to the pricing mechanism being detached from the real market. According to the concept of the sequential pricing game model being used among multi-oligopolies under constraints, we constructed the constrained sequential pricing game model by incorporating the parameters related to the product demand function, marginal production cost, dominant coefficient, following coefficient, and agreed minimum purchase volume as constraints, and the model was converted into a nonlinear bilevel programming model to facilitate model solving. Furthermore, we provided the analytical solution formulas for six special cases, thus making the model more similar to the real market. In addition, the effects of the agreed minimum purchase volume and the dominant and following coefficients on the equilibrium quoted prices and profits of the firms were analyzed. The results of the numerical simulation show that the constrained sequential pricing game model is more effective than the unconstrained sequential pricing game model in solving the problem with the multi-oligopoly pricing mechanism, which means that it can be used to establish a better pricing mechanism and provide a more reasonable and scientific basis for market operation and policymakers in solving practical problems.

1. Introduction

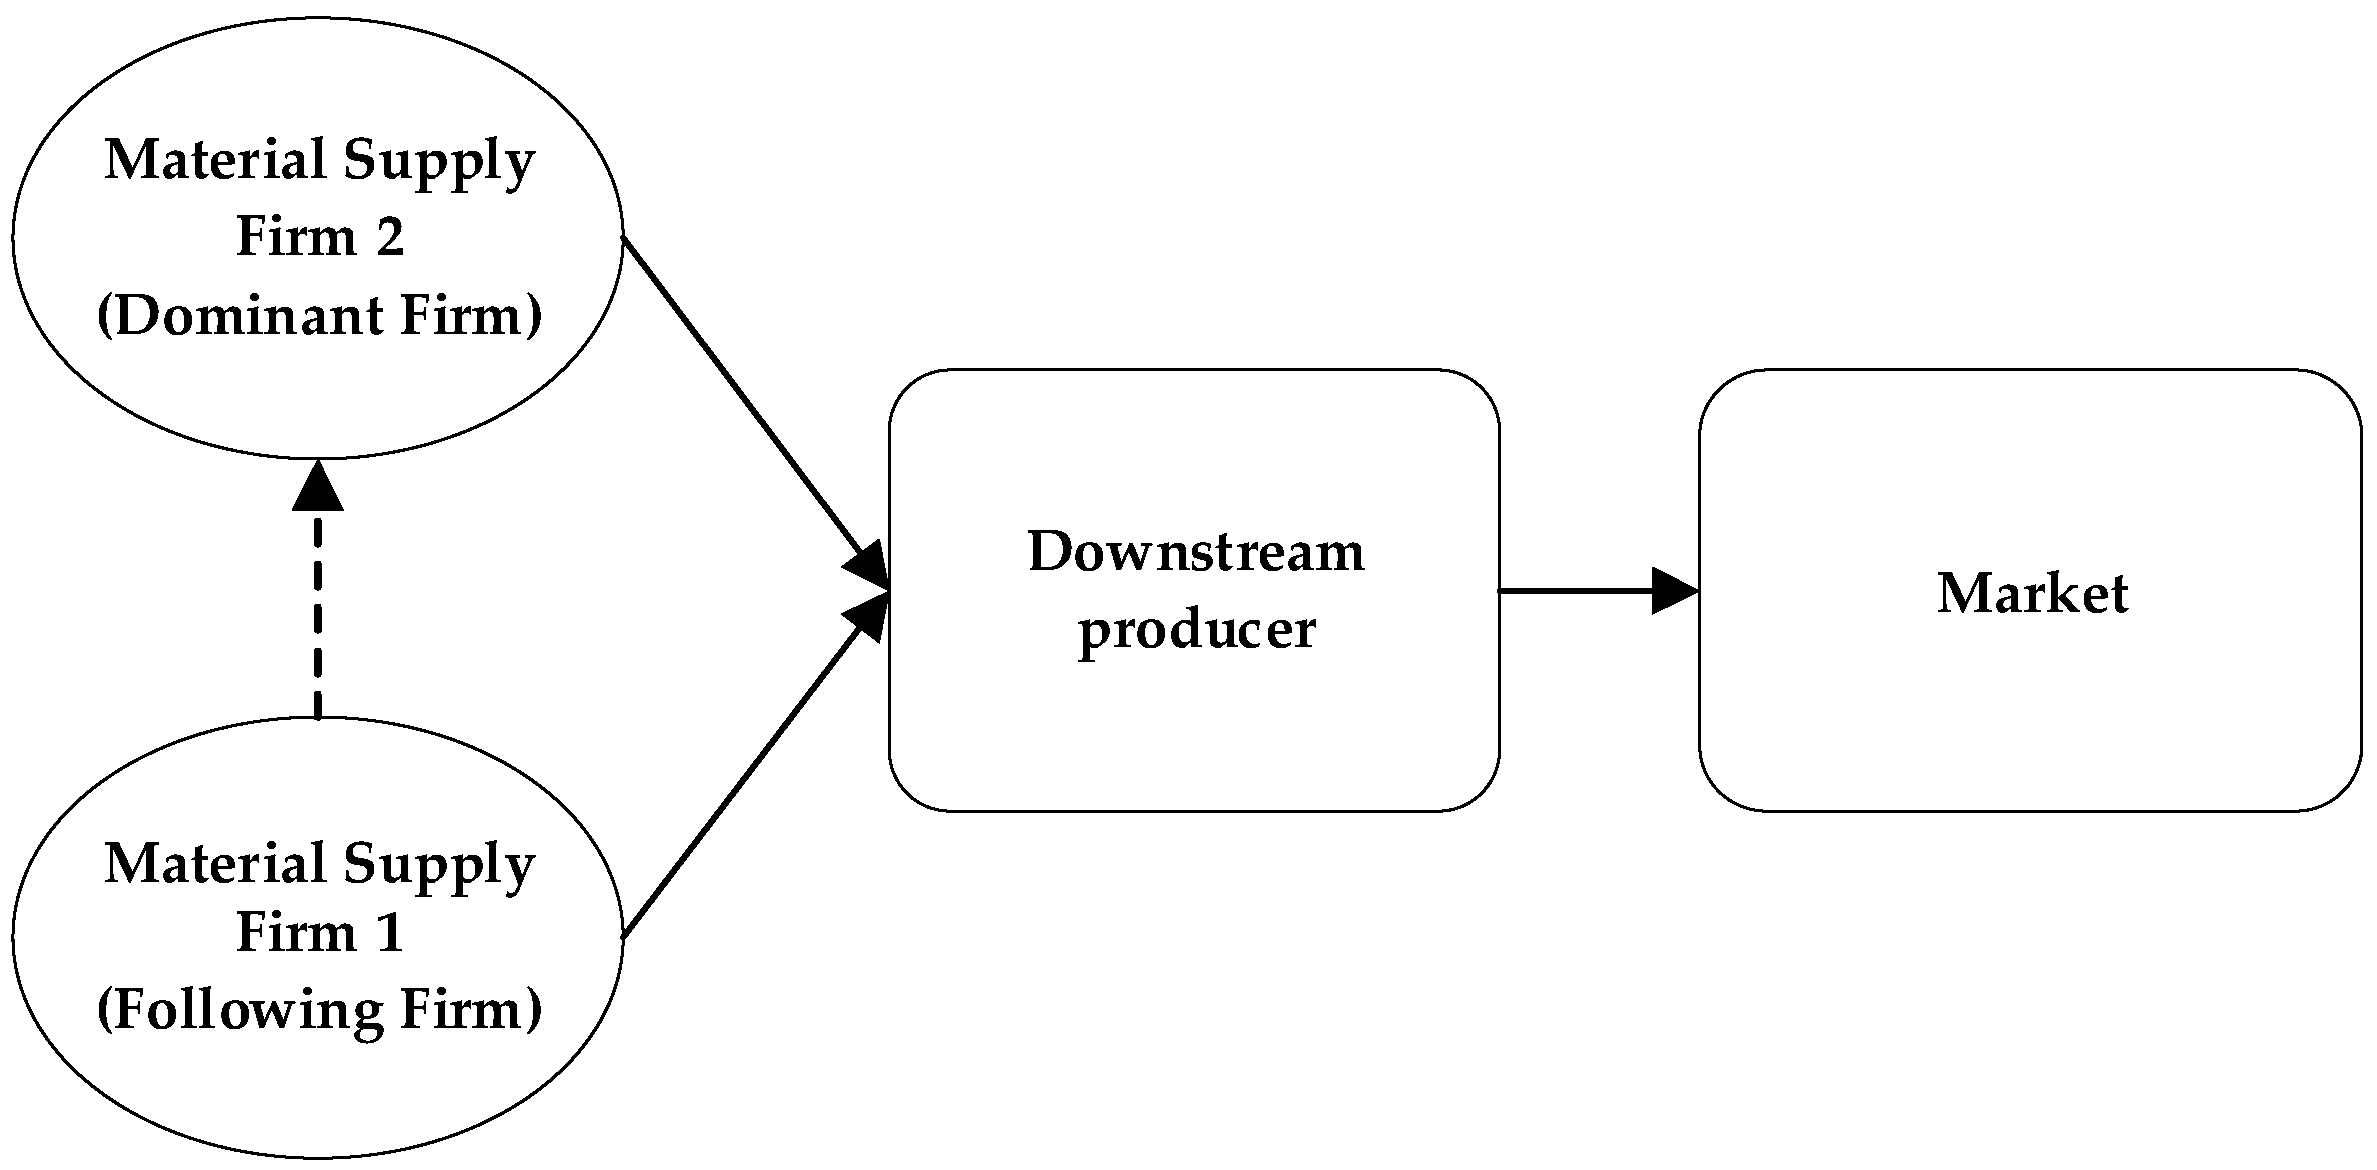
As the social economy has been extensively reformed and opened up alongside its rapid development, the competition among firms is becoming increasingly intense. In a multi-oligopolistic supply chain market, there is market competition among suppliers, who not only have to calculate their own costs and profits, but also must consider multiple games with competitors and downstream firms. Some raw material supply markets are multi-oligopolistic supply chain markets, in which there are usually multiple suppliers, with one supplier in the leading position and others in following positions. The dominant supplier not only has the largest market share, but also has a dominant role in raw material pricing, while the following suppliers have no dominant capacity in the process of raw material pricing, despite having some pricing power, and they often have to adopt the “follow the market” strategy. However, in a context of changing market demand and societal aspirations, firms should adopt a dynamic layout decision-making process to achieve sustainability goals [1]. Uncertainty in suppliers’ product supply is a common phenomenon in supply chain management, and, to a certain extent, it can cause losses to firms [2]. A well-configured supply chain (SC) can reduce costs and increase the competitiveness of a firm [3]. Therefore, to reduce the risk of raw material supply chain breakage, downstream manufacturers often avoid adopting the raw material procurement strategy of “putting eggs in one basket” but sign long-term minimum supply purchase agreements with leading suppliers and also purchase raw materials through various channels. At this point, in the face of demand uncertainty, it is worth determining what pricing mechanism should be adopted by multi-oligopolistic suppliers in order to consolidate their market position and enhance their competitiveness.
Over a long period of time, academics have conducted a great deal of research regarding the pricing problem in supply chains, and many scholars have adopted different game approaches for use in different supply chain structures. Ji et al. [4] developed a dynamic game model regarding “upstream” wholesale price and retail price to study “upstream” decisions and product pricing in a retail supply chain, considering the differences in the brand image of two suppliers. Wang et al. [5] developed a bi-objective mixed-integer nonlinear programming model to optimize the supply chain network consisting of raw material suppliers, final product manufacturers, and distribution centers. Bai et al. [6] used the mixed-integer linear programming (MILP) model to optimize the raw material supply chain of forest biomass power generation enterprises. Razmi et al. [7] developed a dynamic mixed-integer linear programming (DMILP) model to optimize a seasonal raw material supply chain network by considering a multilevel supply chain with multiple products and multiple time periods. Das et al. [8] used centralized and decentralized models to study interconnected, three-stage forward and reverse supply chains with green conscious markets providing green products. Taleizadeh et al. [9] studied a problem related to decentralized, three-level supply chain total cost optimization using the Stackelberg–Nash model. Zarouri et al. [10] used the Stackelberg model to study a problem related to dynamic pricing in a perishable supply chain with one manufacturer, one retailer, and two production and distribution periods. Gan et al. [11] utilized the retailer Stackelberg game model to inconsistent pricing strategies for the online channel and offline channel of the O2O supply chain. Guo et al. [12] used the Stackelberg game to study a problem related to the pricing game regarding two service providers with homogeneous consumers. Keskin and Taskin [13] constructed a two-stage pricing decision model for a two-oligopolistic game in the presence of asymmetric market shares based on consumer preferences. Jiang and Yang [14] constructed a dynamic game model to study the pricing mechanism and quality decisions of vendors in a community learning context. Gong and Yang [15] used a sequential pricing game model to study the pricing mechanisms of suppliers in a raw material supply chain. Ma and Xie [16] studied the pricing process of boundedly rational retailers for bundled products with limited information access and found that sequential games can be used to obtain a more stable system than simultaneous games. A sequential game is a form of game in which participants choose their strategies in a temporal sequence, and the choice of the first actor affects the choices available to the second actor. Unlike the traditional Bertrand model, it is a more typical dynamic game and provides an analytical tool to represent dynamic games of related firms. It is also different from the general delayed finite rationality model, in which the strategies of firms in the current period are influenced by the strategies of other firms in the previous period. For example, in the raw material supply market mentioned in our paper, Gong and Yang pointed out that the pricing mechanism of this type of market is a sequential game, in which the dominant supplier holds the “boss” position and has dominant power in each period, and its pricing can adopt a “delayed” strategy to make quotations at the end of the period, while the supplier in the following position provides quotations at the beginning of the period. This allows for better characterization of the dynamic evolution of the firm’s game.
Supply chains are complex systems which consist of multiple member firms. In the study of supply-and-demand relationships, the existing literature focuses on the relationship between two suppliers and one retailer [17,18,19,20,21,22,23,24,25,26] and multilevel supply chain relationships [7,9,27,28,29]. Shen et al. [30] studied a supply chain consisting of used product contributors, used consignment platforms, and new product suppliers, and they analyzed the platforms under the consignment contracts pricing strategy and the product selection strategy under a consignment contract. Huang and Li [31] investigated how a closed-loop supply chain consisting of a recycler and two competing manufacturers can simultaneously optimize the membership strategy and alleviate problems regarding profit allocation. Sadjadi et al. [32] developed a game model for a two-level supply chain consisting of a manufacturer and two retailers to study the effects of pricing structure and cooperative advertising decisions on supply chain coordination performance. Dey et al. [33] used the Stackelberg model to determine the best decision for a closed-loop supply chain consisting of a manufacturer, two suppliers, and two competing retailers. Rajabi et al. [34] studied joint pricing and inventory in a competitive supply chain consisting of a dominant manufacturer and two follower retailers facing nonlinear, price-dependent demand operating under Gounod model decisions. Hubert et al. [35] analyzed the role of blockchain adoption decisions and differentiated the pricing strategies of genuine manufacturers in combating counterfeit and counterfeit products based on a single-tier manufacturer framework. Huang [36] studied the stochastic used-product return problem in a closed-loop supply chain consisting of one manufacturer and one retailer concerned with fairness. Peng et al. [37] employed the evolutionary game method to develop a tripartite evolutionary game model that reflects the interaction of interests among food raw material suppliers, food manufacturers, and consumers. In this paper, we modeled the game between multi-oligopolistic suppliers and downstream producers, focusing on the purchase of raw materials. In this regard, the goal of our paper was most similar to that of the study by Gong and Yang in [15]. However, Gong and Yang only considered the sequential pricing game model of two upstream producers, which assumes that the maximum demand and price sensitivity coefficients of downstream firms to two upstream producers are the same and do not fully reflect the characteristics of dominant firms; the model only considers the influence of two upstream firms’ own factors on prices, and other influencing factors such as downstream firms are set as ideal. This approach has some significance in the study of pricing mechanisms, but its results are not in line with the actual market scenario. In fact, upstream firms have certain bargaining power in the process of pricing, and the sales price of downstream firms affects the market demand for the product, which in turn affects the price and profit of upstream producers. Therefore, the purchase volume of downstream firms and the size of the dominant and following coefficients have an impact on the profitability and pricing of firms, and the pricing mechanism studied by Gong and Yang lacks certain degrees of scientificalness and rationality, as such actual influencing factors are not considered.
Considering these problems and ideas, in this paper, we further investigated the problem of the multi-oligopoly pricing mechanism in a raw material supply chain based on the research of Gong and Yang. We constructed a constrained sequential pricing game model by taking relevant parameters such as product demand function, marginal production cost, dominant coefficient, following coefficient, and minimum purchase volume as constraints and transforming the model into a nonlinear bilevel programming model to facilitate model solving. In addition to the Nash equilibrium point, the boundary solution is a stable equilibrium point and enables a following firm to obtain a higher sales price than the Nash equilibrium price. In this paper, we explored this concept. Lastly, we carried out numerical simulations using MATLAB software, which revealed that the constrained sequential pricing game model is more effective than the unconstrained sequential pricing game model in solving multi-oligopoly pricing mechanism problems.
Compared with the existing literature, the marginal contributions of this paper are mainly reflected in three aspects. Firstly, from the perspective of demand uncertainty, the influence of downstream firms on upstream producers’ pricing was incorporated into the game time series, constraints that are more in line with the market reality were added, and a class of sequential pricing game models that are more similar to the real market were constructed, making the pricing mechanism under study more scientific. Secondly, a nonlinear bilevel programming model was established to solve the constrained sequential pricing game model, and analytical solution formulas were derived for six special cases. Thirdly, the validity of the constrained sequential pricing game model proposed in this paper was verified through numerical simulation experiments, and we found that the agreed minimum purchase volume and the dominant and following coefficients affect the stability of the market.

2. Constrained Sequential Pricing Game Model

2.1. Description of the Problem

In this paper, a raw material supply chain consisting of two material supply firms and one downstream producer (Figure 1) was studied to determine the optimal strategy for the raw material supply chain with multiple constraints by constructing a sequential pricing game model. Firm 2 is the dominant firm in the supply market, and firm 1 is the following firm. The downstream producer buys raw materials from the two raw material supply firms for production and transports the product to the market for sale, with a given revenue per unit of product sold. In a multi-oligopolistic raw material supply market, the selling price of the downstream producer affects the market demand for the product, which in turn affects the price and profit of the upstream raw material supply firm. According to the sequential pricing game model, in this paper, we focused on examining how upstream material supply firms can develop a reasonable pricing mechanism, considering the price sensitivity of consumers.

2.2. Model Assumptions

(1)
Consider a homogeneous market with two raw material producers, denoted by i = 1 and 2. The marginal production costs of the raw material firms are denoted by c1 and c2, respectively, and it is assumed that c 1 c 2 ; the raw material firms compete through price, using competition rules that are consistent with a sequential pricing game model.
(2)
It is assumed that material supply firm 2 (firm 2) is the dominant firm in the raw material market and has a dominant role in the market, while material supply firm 1 (firm 1) is smaller and adopts a strategy of following the dominant firm in pricing in the market. The pricing model is described below.
Firm 1 accounts for the selling price of the firm by taking a weighted average of the current strategic offer of firm 1 and the previous strategic offer of firm 2, the pricing rules of which can be expressed by the following formula:
p ˜ 1 ( t ) = δ p 2 ( t 1 ) + ( 1 δ ) p 1 ( t ) ,   t   =   1 ,   2 ,   3 ,   ,
where p ˜ 1 ( t ) denotes firm 1’s selling price in period t, p 1 ( t ) denotes firm 1’s strategic offer based on the current market situation, and p 2 ( t 1 ) denotes firm 2’s strategic offer based on the market situation in period t − 1. δ [ 0 ,   1 ] denotes the extent to which firm 1 follows firm 2; the larger δ is, the more likely firm 1’s selling price is to be influenced by firm 2’s price in the previous period.
Firm 2, which also uses the weighted average method of accounting for sales prices, settles the sales price of the current period’s products at the end of the period in order to maintain the ecological stability of the market and to take full account of firm 1’s prices and profits, with the following specific pricing rules:
p ˜ 2 ( t ) = η p 2 ( t ) + ( 1 η ) p 1 ( t ) ,
where p ˜ 2 ( t ) denotes the sales price of firm 2 in period t, and p 2 ( t ) is the strategic offer given by firm 2 in period t based on sales, typically with an appropriate percentage mark-up on the current market price. For computational convenience and to ensure the evolution of the dynamic system, the boundary condition is set at p 2 ( 0 ) = 0 . η [ 0 ,   1 ] , which reflects firm 2’s ability to dominate prices; the larger η is, the greater firm 2’s ability to price independently is.
The number of raw materials purchased by downstream firms and the selling price of their own products vary according to market demand. To ensure stable production operations, it is assumed that the downstream firm purchases raw materials from both upstream firm 1 and firm 2, with the specific purchase volumes being influenced by the sales prices of the two upstream firms. At the same time, the downstream firm enters into a long-term cooperation agreement with firm 2, under which it is agreed that, regardless of market conditions, the purchase volumes of firm 2 (i.e., the demand for raw materials from firm 2) q 2 ( t ) must satisfy the following condition:
q 2 ( t ) Q 20 ,
where Q 20 is the agreed minimum purchase volume entered into in the contract. In addition, to ensure the dominance of firm 2 in terms of sales volume, it is assumed that the demand for raw materials by the downstream firm from the two upstream firms also satisfies the following conditions:
q 2 ( t ) q 1 ( t ) 0 ,
where q 1 ( t ) represents the downstream firm’s demand for raw materials from firm 1. The exact amount that the downstream firm purchases from firm 2 depends on the expectation of the settlement price of firm 2. If the expected settlement price is lower, the remaining demand is higher from firm 2; conversely, it is lower.

2.3. Model Construction

Suppose that the market product demand functions for raw material firm 1 (Equation (5)) and firm 2 (Equation (6)) are known to be
q 1 ( t ) = a 1 b 1 p ˜ 1 ( t ) = a 1 b 1 [ δ p 2 ( t 1 ) + ( 1 δ ) p 1 ( t ) ] ,
q 2 ( t ) = a 2 b 2 p ˜ 2 ( t ) = a 2 b 2 [ η p 2 ( t ) + ( 1 η ) p 1 ( t ) ] ,
where a i , i = 1 , 2 indicates the maximum demanded for each firm in the market, and bi is the price sensitivity coefficient. Typically, the dominant firm has the highest strength and position; thus, a 1 a 2 can be assumed. The firm’s minimum purchase cannot exceed its maximum demand; hence, Q 20 a 2 . The dominant firm is less price-sensitive than the following firms; thus, b 1 b 2 can also be assumed. Accordingly, the profits from production for firm 1 (Equation (7)) and firm 2 (Equation (8)) are
π 1 ( t ) = q 1 ( t ) [ p ˜ 1 ( t ) c 1 ] ,
π 2 ( t ) = q 2 ( t ) [ p ˜ 2 ( t ) c 2 ] .
Obviously, the firm’s production profit cannot be negative; therefore, it should be ensured that p ˜ 1 ( t ) c 1 , p ˜ 2 ( t ) c 2 , and thus, a 1 b 1 c 1 0 from q 1 ( t ) 0 , and then a 2 b 2 c 2 Q 20 from Equation (3).
On the basis of this analysis and the assumptions outlined in Section 2.2, the conditions that must be met in designing the relevant parameters of the product demand function, the marginal cost of production and the agreed minimum purchase volume can be summarized as follows:
{ a 1 a 2 b 1 b 2 c 1 c 2 a 1 b 1 c 1 0 a 2 b 2 c 2 Q 20 .
In addition, on the basis of these assumptions and conditions, the parameters related to the demand function of product, the marginal production cost, the following coefficient, the dominant coefficient, and the agreed minimum purchase volume can be incorporated into the constraints, and profit maximization is taken as the objective function to construct the corresponding sequential pricing game model, the expression of which in period t is
max p 2 ( t )   π 2 ( t ) = b 2 [ η p 2 ( t ) + ( 1 η ) p 1 ( t ) a 2 + b 2 c 2 2 b 2 ] 2 + ( a 2 + b 2 c 2 ) 2 4 b 2 a 2 c 2 s .   t .   { max p 1 ( t ) π 1 ( t ) = b 1 [ δ p 2 ( t 1 ) + ( 1 δ ) p 1 ( t ) a 1 + b 1 c 1 2 b 1 ] 2 + ( a 1 + b 1 c 1 ) 2 4 b 1 a 1 c 1 s .   t .   { c 2 ( 1 η ) p 1 ( t ) + η p 2 ( t ) a 2 Q 20 b 2 [ b 2 ( 1 η ) b 1 ( 1 δ ) ] p 1 ( t ) + b 2 η p 2 ( t ) a 2 a 1 + b 1 δ p 2 ( t 1 ) c 1 ( 1 δ ) p 1 ( t ) + δ p 2 ( t 1 ) a 1 b 1 .
This provides the optimal solution in period t, which is ( p 1 * ( t ) ,   p 2 * ( t ) ) , t = 1, 2, … To describe the length of time it takes for the model to reach equilibrium, the definition is given if there exists some T satisfying the following conditions:
{ p 1 * ( T ) = p 1 * ( T + 1 ) = p 1 * p 2 * ( T ) = p 2 * ( T + 1 ) = p 2 * .
Then, the game reaches equilibrium and the corresponding equilibrium solution is ( p 1 * ,   p 2 * ) , at which point, T is called the equilibrium time.

3. Model Solving

According to the sequential pricing rule, the selling price of firm 1 is determined by firm 2’s previous offer and firm 1’s current strategic offer, while firm 2 determines its final selling price on the basis of its own current offer, considering firm 1’s current offer. Therefore, the model was solved by first accounting for the optimal solution of firm 1 under the profit maximization condition using the nonlinear programming algorithm, then substituting the value of this optimal solution into the constraints, and finally continuing to calculate the optimal solution of firm 2 under the profit maximization condition using the nonlinear programming algorithm. The sequential pricing game model with constraints shown in Equation (10) can, thus, be transformed into a nonlinear bilevel programming solution model. For computational convenience and to ensure the evolution of the dynamic system, assuming the boundary conditions p 2 ( 0 ) = 0 , this nonlinear bilevel programming solution model can be expressed as follows:
min p 2 ( t ) | η p 2 ( t ) ( a 2 + b 2 c 2 2 b 2 ( 1 η ) p 1 * ( t ) ) | s .   t .   { min p 1 ( t ) | ( 1 δ ) p 1 ( t ) ( a 1 + b 1 c 1 2 b 1 δ p 2 * ( t 1 ) ) | s .   t .   { c 2 ( 1 η ) p 1 ( t ) η p 2 ( t ) a 2 Q 20 b 2 ( 1 η ) p 1 ( t ) [ b 2 ( 1 η ) b 1 ( 1 δ ) ] p 1 ( t ) + b 2 η p 2 ( t ) a 2 a 1 + b 1 δ p 2 * ( t 1 ) c 1 δ p 2 * ( t 1 ) ( 1 δ ) p 1 ( t ) a 1 b 1 δ p 2 * ( t 1 ) p 2 * ( 0 ) = 0 ,
where p 2 * ( t 1 ) denotes the optimal offer of firm 2 in period t − 1 according to Equation (11), and p 1 * ( t ) denotes the optimal offer of firm 1 in period t, t = 1, 2, 3, …, according to Equation (11). From Equation (11), the constraints of the model determine the feasible domain (i.e., the range of values taken) of p 1 ( t ) and p 2 ( t ) , and this feasible domain varies with t. A diagram of the feasible domain of the model in period t if a right-angle coordinate system is constructed with p 1 ( t ) as the horizontal axis and p 2 ( t ) as the vertical axis is shown in Figure 2.
The specific process for solving the game equilibrium solution of this nonlinear bilevel programming model according to Equation (12) is given below and is shown in Figure 3. The equilibrium solution of the game for the sequential pricing game model with constraints can be seen in this flowchart. However, in some special cases, it is possible to directly find the equilibrium solution of the model without the tedious numerical calculation process shown in Figure 3. Assuming that p 1 L ( t ) denotes the axis of symmetry corresponding to the first objective function in Equation (12) in period t, p 2 L ( t ) denotes the axis of symmetry corresponding to the second objective function in Equation (12) at period t, p 1 L denotes the axis of symmetry corresponding to the first objective function in Equation (12) at equilibrium, and p 2 L denotes the axis of symmetry corresponding to the second objective function in Equation (12) at equilibrium; these special cases can be found according to the relationship between the axis of symmetry and the feasible domain.
The specific expression for the above axis of symmetry can be derived from the expressions for the two objective functions in Equation (11) as
{ p 1 L ( t ) = a 1 + b 1 c 1 2 b 1 ( 1 δ ) δ 1 δ p 2 * ( t 1 ) p 2 L ( t ) = a 2 + b 2 c 2 2 b 2 η ( 1 η ) η p 1 * ( t ) p 1 L = a 1 + b 1 c 1 2 b 1 ( 1 δ ) δ 1 δ p 2 * p 2 L = a 2 + b 2 c 2 2 b 2 η ( 1 η ) η p 1 * .
Equation (13) shows that p 1 L ( t ) monotonically decreases and p 2 L ( t ) monotonically increases, while p 1 * ( t ) decreases monotonically with p 1 L ( t ) , and p 2 * ( t ) increases monotonically with p 2 L ( t ) until it enters an equilibrium, provided that the parameters of the model remain unchanged. Thus, one can first determine the feasible domain corresponding to the model in each period by using Figure 2, and then analyze whether the axis of symmetry appears in the interior or on the boundary of the feasible domain according to Figure 2 and Equation (13), in order to find those special cases in which the analytical solution formula can be found for the equilibrium solution of the game. The analytical solution formulas for the equilibrium solution of this model in the six special cases in which the symmetry axis is satisfied are given below.

3.1. Situation 1

If the optimal solution corresponding to each period of the sequential pricing game model without constraints automatically satisfies the constraints in Equation (12), i.e., the symmetry axes of the two objective functions are in the feasible domain of Equation (12) in each period, then it is easy to obtain the Nash equilibrium solution of the model by simply taking partial derivatives of the objective function, i.e., by making
{ π 1 ( t ) p 1 ( t ) = 0 π 2 ( t ) p 2 ( t ) = 0 .
The corresponding Nash equilibrium solution can be obtained as
{ p 1 * = δ 2 ( δ η ) ( a 2 b 2 + c 2 ) η 2 ( δ η ) ( a 1 b 1 + c 1 ) p 2 * = ( 1 η ) 2 ( δ η ) ( a 1 b 1 + c 1 ) ( 1 δ ) 2 ( δ η ) ( a 2 b 2 + c 2 ) .
Let π ( t ) = π 1 ( t ) + π 2 ( t ) , which gives
{ π ( t ) p 1 ( t ) | ( p 1 * ,   p 2 * ) = π 1 ( t ) p 1 ( t ) | ( p 1 * ,   p 2 * ) + π 2 ( t ) p 1 ( t ) | ( p 1 * ,   p 2 * ) = 0 π ( t ) p 2 ( t ) | ( p 1 * ,   p 2 * ) = π 1 ( t ) p 2 ( t ) | ( p 1 * ,   p 2 * ) + π 2 ( t ) p 2 ( t ) | ( p 1 * ,   p 2 * ) = 0 .
This shows that the Nash equilibrium solution satisfies the condition of maximizing the sum of the profits of the two firms, which means that the Nash equilibrium solution of the sequential pricing game model without constraints is also the Pareto-optimal solution. At this point, the market sales prices of firm 1 and firm 2 in equilibrium can be found by substituting Equation (15) into Equations (1) and (2), which makes
{ p ˜ 1 = δ p 2 + ( 1 δ ) p 1 = a 1 + b 1 c 1 2 b 1 p ˜ 2 = η p 2 + ( 1 η ) p 1 = a 2 + b 2 c 2 2 b 2 .
This result suggests that the equilibrium market selling price of a firm without constraints depends on the relevant parameters of the product demand function and its own production costs, independent of the following coefficient, the dominance coefficient, and the agreed minimum purchase volume, which are obviously intuitively questionable. Therefore, the sequential pricing game model with constraints should be more in line with the reality of the market.
Obviously, in order to ensure the equilibrium solution of the game corresponds to the sequential pricing game model with constraints, which is also the Pareto-optimal solution, it is adequate to make the optimal solution of the sequential pricing game model without constraints automatically satisfy the constraints contained in Equation (12) in each period by substituting the equilibrium offer represented by Equation (15) into the constraints of Equation (12). The model parameters should satisfy the following conditions:
{ Q 20 a 2 b 2 c 2 2 δ η ( a 1 b 1 + c 1 ) / ( a 2 b 2 + c 2 ) 1 δ 1 η .
It follows that the equilibrium solution of the sequential pricing game model with constraints proposed in this paper is the Pareto-optimal solution, in which the model parameters also satisfy Equation (18) under the preconditions of the model assumptions in this paper, which can be directly calculated from the analytical formula shown in Equation (15).

3.2. Situation 2

When the right boundary point of the feasible domain of Equation (12) is always ( p 1 ( t ) ,   p 2 ( t ) ) = ( ( a 2 Q 20 ) / b 2 / ( 1 η ) ,   0 ) , and the symmetry axis of the first objective function in period 1 lies on the right of the feasible domain, the optimal solution in each period can only fall on the right boundary point of the feasible domain, meaning that this boundary point is the corresponding game equilibrium solution of the model, which is equivalent to entering the equilibrium state in period 1. At this point, the constraints in Equations (13) and (12) indicate that it is only necessary to ensure the model parameters satisfy the following conditions:
b 2 b 1 ( a 1 Q 20 ) ( a 2 Q 20 ) 1 δ 1 η b 2 b 1 ( a 1 + b 1 c 1 ) 2 ( a 2 Q 20 ) ,
and the corresponding equilibrium solution of the game is
{ p 1 * = a 2 Q 20 b 2 ( 1 η ) p 2 * = 0 .
At this point, the substitution of Equation (20) into Equations (1) and (2) yields the market selling prices of firm 1 and firm 2, respectively, in equilibrium:
{ p ˜ 1 = δ p 2 + ( 1 δ ) p 1 = a 2 Q 20 b 2 1 δ 1 η p ˜ 2 = η p 2 + ( 1 η ) p 1 = a 2 Q 20 b 2 .
The results show that the market selling price of a following firm under current conditions is influenced by the following coefficient, the dominant coefficient, the relevant parameters of the product demand function, and the agreed minimum purchase volume, while the market selling price of a dominant firm is influenced only by the firm’s own product demand function and the agreed minimum purchase volume.
It follows that the equilibrium solution of the sequential pricing game model with constraints proposed in this paper can be calculated directly from the analytical formula shown in Equation (20) when the model parameters also satisfy Equation (19), provided that the assumptions of the model are satisfied.

3.3. Situation 3

When the right boundary point of the feasible domain of Equation (12) is always ( p 1 ( t ) ,   p 2 ( t ) ) = ( ( a 2 a 1 ) / [ b 2 ( 1 η ) b 1 ( 1 δ ) ] ,   0 ) and the symmetry axis of the first objective function in period 1 also lies to the right side of the feasible domain of the model, the optimal solution of each period can only fall on the right boundary point of the feasible domain; thus, this boundary point is also the corresponding equilibrium solution of the model, which is equivalent to entering the equilibrium state in period 1. At this point, the constraints in Equations (13) and (12) indicate that the model parameters should satisfy the following conditions:
1 δ 1 η min { ( a 1 + b 1 c 1 ) b 2 ( 2 a 2 a 1 + b 1 c 1 ) b 1 ,   a 1 b 2 a 2 b 1 ,   ( a 1 Q 20 ) b 2 ( a 2 Q 20 ) b 1 } ,
and the corresponding equilibrium solution of the game is
{ p 1 * = a 2 a 1 b 2 ( 1 η ) b 1 ( 1 δ ) p 2 * = 0 .
At this point, the substitution of Equation (23) into Equations (1) and (2) yields the market selling prices of firm 1 and firm 2, respectively, in equilibrium:
{ p ˜ 1 = δ p 2 + ( 1 δ ) p 1 = a 2 a 1 b 2 ( 1 η ) / ( 1 δ ) b 1 p ˜ 2 = η p 2 + ( 1 η ) p 1 = a 2 a 1 b 2 b 1 ( 1 δ ) / ( 1 η ) .
These results show that the market selling prices of both following and dominant firms under current conditions are influenced by the following coefficient, the dominant coefficient, and the relevant parameters of the product demand function.
It follows that the equilibrium solution of the sequential pricing game model with constraints proposed in this paper can be calculated directly from the analytical formula shown in Equation (23) when the model parameters also satisfy Equation (22), provided that the assumptions of the model are satisfied.

3.4. Situation 4

When the symmetry axis of the first objective function of the Equation (12) in period 1 lies inside the feasible domain, but the symmetry axis of the second objective function in period 1 lies on the negative half-axis of the p 2 ( t ) axis, the optimal solution in each period can only fall on the lower boundary of the feasible domain at p 2 ( t ) = 0 ; thus, the equilibrium solution of the game corresponding to this model can only appear at p 2 ( t ) = 0 , which is equivalent to entering the equilibrium state in period 1. At this point, the constraints in Equations (12) and (13) indicate that the model parameters should satisfy the following conditions:
max { b 2 2 ( a 2 Q 20 ) ( a 1 b 1 + c 1 ) ,   b 2 2 a 2 a 1 + b 1 c 1 ( a 1 b 1 + c 1 ) } 1 δ 1 η ( a 1 b 1 + c 1 ) / ( a 2 b 2 + c 2 ) ,
and the corresponding equilibrium solution of the game is
{ p 1 * = 1 2 ( 1 δ ) ( a 1 b 1 + c 1 ) p 2 * = 0 .
At this point, the substitution of Equation (26) into Equations (1) and (2) yields the market selling prices of firm 1 and firm 2, respectively, in equilibrium:
{ p ˜ 1 = δ p 2 + ( 1 δ ) p 1 = 1 2 ( a 1 b 1 + c 1 ) p ˜ 2 = η p 2 + ( 1 η ) p 1 = 1 η 2 ( 1 δ ) ( a 1 b 1 + c 1 ) .
These results show that the market selling price of a following firm under current conditions is only influenced by the parameters related to that firm’s own product demand function, while the market selling price of a dominant firm is influenced by the following coefficient, the dominant coefficient, and the parameters related to the product demand function of the following firm.
It follows that the equilibrium solution of the sequential pricing game model with constraints proposed in this paper can be calculated directly from the analytical formula shown in Equation (26) when the model parameters also satisfy Equation (25), subject to the assumptions of the model in this paper.

3.5. Situation 5

When the axis of symmetry of the first objective function of Equation (12) lies inside the feasible domain until equilibrium is reached and on the negative half-axis of the p 1 ( t ) axis after equilibrium is reached, and the axis of symmetry of the second objective function in each period always lies inside the feasible domain, the equilibrium solution of the game corresponding to this model can only appear on the left boundary of the feasible domain at p 1 ( t ) = 0 . At this point, the constraints in Equations (13) and (12) indicate that the model parameters should satisfy the following conditions:
{ Q 20 a 2 b 2 c 2 2 1 δ 1 η ( a 1 b 1 + c 1 ) / ( a 2 b 2 + c 2 ) ( a 1 b 1 + c 1 ) / ( a 2 b 2 + c 2 ) δ η ( 2 a 1 b 1 ) / ( a 2 b 2 + c 2 ) ,
and the corresponding equilibrium solution of the game is
{ p 1 * = 0 p 2 * = 1 2 η ( a 2 b 2 + c 2 ) .
At this point, the substitution of Equation (28) into Equations (1) and (2) yields the market selling prices of firm 1 and firm 2, respectively, in equilibrium:
{ p ˜ 1 = δ p 2 + ( 1 δ ) p 1 = δ 2 η ( a 2 b 2 + c 2 ) p ˜ 2 = η p 2 + ( 1 η ) p 1 = 1 2 ( a 2 b 2 + c 2 ) .
This result shows that the market selling price of a following firm under current conditions is influenced by the following coefficient, the dominant coefficient, and the parameters related to the product demand function of the dominant firm, while the market selling price of the dominant firm is only influenced by the parameters related to the demand function of that firm’s own product.
It follows that the equilibrium solution of the sequential pricing game model with constraints proposed in this paper can be calculated directly from the analytical formula shown in Equation (29) when the model parameters also satisfy Equation (28), provided that the assumptions of the model are met.

3.6. Situation 6

When the symmetry axis of the first objective function of Equation (12) lies inside the feasible domain until equilibrium is reached and the negative half-axis of the p 1 ( t ) axis after equilibrium is reached, while the second objective function lies inside the feasible domain until equilibrium is reached and the upper boundary of the feasible domain after equilibrium is reached p 2 ( t ) = a 1 / ( b 1 δ ) , the equilibrium solution of the game corresponding to this model can only appear on the upper left boundary of the feasible domain ( p 1 ( t ) ,   p 2 ( t ) ) = ( 0 ,   a 1 / ( b 1 δ ) ) . At this point, the constraints in Equations (13) and (12) indicate that the model parameters should satisfy the following conditions:
{ ( a 1 b 1 + c 1 ) / ( a 2 b 2 + c 2 ) 1 δ 1 η b 2 2 a 1 a 2 + b 2 c 2 ( a 1 b 1 + c 1 ) δ η max { ( a 1 b 1 ) / [ 1 2 ( a 2 b 2 + c 2 ) ] ,   ( a 1 b 1 ) / ( a 2 Q 20 b 2 ) } ,
and the corresponding equilibrium solution of the game is
{ p 1 * = 0 p 2 * = a 1 b 1 δ .
At this point, the substitution of Equation (32) into Equations (1) and (2) yields the market selling prices of firm 1 and firm 2 in equilibrium, respectively.
{ p ˜ 1 = δ p 2 + ( 1 δ ) p 1 = a 1 b 1 p ˜ 2 = η p 2 + ( 1 η ) p 1 = a 1 η b 1 δ .
These results show that the market selling price of a following firm under current conditions is only influenced by the parameters related to that firm’s own product demand function, while the market selling price of a dominant firm is influenced by the following coefficient, the dominant coefficient, and the parameters related to the product demand function of the following firm.
It follows that the equilibrium solution of the sequential pricing game model with constraints proposed in this paper can be calculated directly from the analytical formula shown in Equation (32) when the model parameters also satisfy Equation (31), provided that the assumptions of the model are met.
The analytical formulas for the equilibrium solutions of the game in other cases are not analyzed; they can all be solved numerically according to the process shown in Figure 3.

4. Numerical Simulation and Analysis of Results

In what follows, the equilibrium solution of the constrained sequential pricing game model (Equation (10)) is solved by means of numerical simulations for a specific numerical example, and it is verified whether the equilibrium solution based on the nonlinear bilevel programming model (Equation (12)) is consistent with the equilibrium solution calculated directly from the analytical formula in the six cases described previously. Additionally, the effects of the agreed minimum purchase volume, the following coefficient and the dominant coefficient on the equilibrium offer and profit are analyzed according to different numerical simulation results. To facilitate the numerical simulation using MATLAB software in the subsequent sections of the paper, the parameters are assigned reasonable values according to Equation (9) described in Section 2, and the values of the following and dominant coefficients are in the range of (0, 1).

4.1. Validation of the Solution Model

First, to visualize the process by which the model enters equilibrium, we provide the game process in the two cases where the equilibrium solution is Pareto-optimal and non-Pareto-optimal, respectively. The first example is a numerical simulation in which the equilibrium solution is a Pareto-optimal solution. Let a 1 = 1800 , a 2 = 2000 , b 1 = 7.8 , b 2 = 7.5 , c 1 = 60 , c 2 = 40 , δ = 0.6 , η = 0.7 , and Q 20 = 800 , where the model parameters satisfy the constraints shown in Equation (18), and the results of the comparison between the equilibrium solution according to Equation (12) and the Pareto-optimal solution according to Equation (15) are shown in Figure 4. If the absolute value of the difference between the two adjacent quotations of a firm does not exceed CNY 0.005 as the criterion for the model to enter equilibrium, the time taken by firm 1 to enter equilibrium is 24 periods and the equilibrium quotation is CNY 97.70, while the time taken by firm 2 to enter equilibrium is 22 periods and the equilibrium quotation is CNY 177.17. In contrast, the Pareto-optimal solutions for firm 1 and firm 2, which are derived directly from Equation (15), are CNY 97.69 and CNY 177.18, respectively. According to this result, the equilibrium solution according to Equation (12) and the Pareto-optimal solution directly according to Equation (15) are the same, which shows that the equilibrium solution of the pricing model with constraints is the Pareto-optimal solution at this point.
The second example is an example of numerical simulation calculations in which the equilibrium solution is not a Pareto-optimal solution. Let a 1 = 1800 , a 2 = 2000 , b 1 = 7.8 , b 2 = 7.5 , c 1 = 60 , c 2 = 40 , δ = 0.6 , η = 0.7 , and Q 20 = 900 . As ( a 2 b 2 c 2 ) / 2 = 850 ; it follows that the first inequality in Equation (18) does not hold and the equilibrium solution cannot be found directly using Equation (15). The comparison between the equilibrium solution based on Equation (12) and the Pareto-optimal solution based on Equation (15) at this point is shown in Figure 5. If the absolute value of the difference between the two adjacent quotations of a firm does not exceed CNY 0.005 as the criterion for entering equilibrium, the numerical equilibrium solution of firm 1 is CNY 137.70 and the time taken to enter equilibrium is 24 periods, while the numerical equilibrium solution of firm 2 is CNY 150.51 and the time taken to enter equilibrium is 23 periods. It is worth noting that the Pareto-optimal solutions calculated according to Equation (15) are still p 1 = 97.69 and p 2 = 177.18 . It is clear from this result that the equilibrium solution derived from Equation (12) is not the same as the Pareto-optimal solution derived directly from the analytical Equation (15), which suggests that the equilibrium solution of the pricing model with constraints is not Pareto-optimal at this point.
Secondly, to more effectively verify the validity of the nonlinear bilevel programming model proposed in this paper, Table 1 lists the equilibrium solutions based on the nonlinear bilevel programming model (Equation (12)) for different following coefficients, dominant coefficients, and agreed minimum purchase volume conditions, and it is verified whether they are consistent with the equilibrium solutions calculated directly from the analytical formula. From the numerical simulation results in Table 1, the nonlinear bilevel programming solution model proposed in this paper is fully valid. The sequential pricing game dynamic model with constraints constructed in this paper is more reasonable, and its solution method is also more generalized.

4.2. Effect of Model Parameters on Firms’ Equilibrium Quoted Prices and Profits

To explore the influence of the relevant parameters and coefficients of the system model on the equilibrium offer and profit of a firm, in this paper, we conducted relevant numerical simulations and analyses regarding the influencing coefficients such as the agreed minimum purchase volume, the following coefficient, and the dominant coefficient.

4.2.1. Impact of Agreed Minimum Purchase Volumes on Firms’ Equilibrium Quoted Prices and Profits

To better sustain their business, downstream firms generally sign long-term subscription agreements with dominant firms. In the previous section, the agreed minimum purchase volume was set as Q 20 , and, according to the constraints, the agreed minimum purchase volume would have an impact on the quotation and profit of firms; the following simulation experiment was used to analyze how the agreed minimum purchase volume affects the equilibrium quotation and profit of firm 1 and firm 2.
According to the analysis in Section 3, when the agreed minimum purchase volume, the following coefficient, and the dominant coefficient satisfy the conditions of the inequality shown in Equation (17), the equilibrium solution of the model is the Pareto-optimal solution, at which time, the corresponding equilibrium quoted prices of the two firms can be derived directly according to Equation (12), and it can be seen that, in this case, the agreed minimum purchase volume would not have any effect on the equilibrium quoted prices and profits of the two firms. Therefore, if the equilibrium solution is Pareto-optimal, the dominant firm can generally determine the agreed minimum purchase volume within the range of Q 20 ( a 2 b 2 c 2 ) / 2 when signing an agreement with a downstream firm. However, given that the dominant firm should supply as much raw material as possible to demonstrate its dominant position, the agreed minimum purchase volume should not be too low. At Q 20 > ( a 2 b 2 c 2 ) / 2 , the equilibrium solution is no longer Pareto-optimal, and the agreed minimum purchase volume would then affect the firm’s offer and profit.
In order to further study and analyze the influence of the agreed minimum purchase volume on the equilibrium offer and profit of the firms, the other parameters were kept constant, and the dynamic changes in the equilibrium quotation offer and profit of the firms were simulated by taking δ = 0.1 / η = 0.9 , δ = 0.4 / η = 0.8 , and δ = 0.6 / η = 0.65 . The numerical simulation results of the changes in the equilibrium quotations and profits of the two firms for these three values of the following and dominant coefficients are shown in Figure 6, Figure 7, and Figure 8, respectively.
With different combinations of the following and dominant coefficients, the impact of the agreed minimum purchase volumes signed by downstream firms and dominant firms on the equilibrium quoted prices and profits of firms varies, and a comparative analysis of Figure 6, Figure 7 and Figure 8 leads to the following conclusions:
(1)
Before Q 20 reaches 850, the equilibrium solution is Pareto-optimal, and the equilibrium quotations of the two firms are not affected by the agreed minimum purchase volume; after Q 20 reaches 850, as the agreed minimum purchase volume increases, the equilibrium quotation p 2 * of the dominant firm becomes increasingly lower, and, as the pricing of the following firm is influenced by the offer of the dominant firm in the previous period, the gap between it and the equilibrium offer of the dominant firm becomes increasingly larger. The gap between the equilibrium quoted prices of the two firms reaches its maximum when the agreed minimum purchase volume reaches the maximum demand in the market, i.e., when the equilibrium offer p 2 * of the dominant firm is zero; thereafter, the equilibrium offer p 1 * of the following firm decreases with the increase in the agreed minimum purchase volume.
(2)
Before Q 20 reaches 850, the equilibrium solution is Pareto-optimal, and the profits of both firms are unaffected by the agreed minimum purchase volume; after Q 20 reaches 850, the profits of the dominant firm display a downward trend as the agreed minimum purchase volume increases, while the profits of the following firm are related to the values of the following and dominant coefficients. When the difference between the two is large, the profits are not affected; however, when the difference is medium, they start to decline after a longer period of time. In other words, the higher the agreed minimum purchase volume, the lower the equilibrium price and the lower the profit of the dominant firm, which adopts a sales strategy of selling more at lower margins, while the equilibrium offer of the following firm is higher and can maintain a stable profit level. However, as the price of the dominant firm affects the equilibrium offer of the following firm, the profit of the following firm would gradually decrease. The simulation results show that a larger number of agreed minimum purchases would lead to a decrease in the profits of oligopolistic firms, which would have a greater negative impact on the overall development of the market. Therefore, the dominant firm and the agreed minimum purchase volume should be controlled as much as possible within a reasonable range to ensure price stability and profit maximization for both firms.

4.2.2. The Impact of the following and Dominant Coefficients on Firms’ Equilibrium Quoted Prices

In this section, the influence of the following coefficient and the dominant coefficient on the equilibrium quoted prices of the two firms is analyzed. The following coefficient and the dominant coefficient are set as variable parameters, i.e., Q 20 = 800 / η = 0.5 and Q 20 = 800 / δ = 0.5 , and the remaining parameters are kept constant. The following coefficient and the dominant coefficient are changed from 0 to 1, and the change in the equilibrium quoted prices of the two firms is analyzed. Figure 9a shows the effect of the following coefficient δ on the equilibrium solution when the dominant coefficient η = 0.5 is used, and the difference between δ and η increases. Figure 9b shows the effect of the dominant coefficient η on the equilibrium solution when the following coefficient δ = 0.5 is used, and the difference between the equilibrium quoted prices of the two firms becomes increasingly smaller as the difference between η and δ increases. Figure 9c shows the combined effect of the following and dominant coefficients δ and the dominant coefficient η on the equilibrium solution. As the difference between δ and η becomes larger, the difference between the equilibrium quoted prices of the two firms becomes smaller.
The following inferences can be drawn: (1) there is a nonlinear proportional relationship between the following and dominant coefficients and the equilibrium offer, provided that the other parameters remain constant; (2) the greater the difference is between the following and dominant coefficients, the smaller the difference is between the equilibrium quoted prices of the two firms, and vice versa.
Therefore, in any case, the closer the dominant coefficient is to the following coefficient, the more unstable the prices between the oligopolies are, and the more likely it is that the market will enter a state of disorder or vicious competition when pricing is applied. The greater the distance is between the dominant coefficient and the following coefficient, the more stable the market will be.
This analysis describes the impact of the relevant parameters on the dynamic game of market players. From the results shown, it can be seen that the chaotic state of prices on both sides of the oligarchy is extremely detrimental to the development of firms. Drastic price fluctuations cannot provide firms with a reasonable production plan, and they also affect the control of their sales volume and profits. Therefore, the gap between the dominant and following coefficients should be regulated as reasonably as possible, and a reasonable pricing mechanism should be formulated to maintain a stable situation in the market.

5. Conclusions

On the basis of the raw material supply chain market, in this paper, we investigated the sequential pricing game of multi-oligopolistic firms under constraints. By analyzing the mutual constraints between oligopolistic firms and downstream producers in the raw material supply chain and setting constraints such as parameters related to the product demand function, dominant coefficient, following coefficient, and agreed minimum purchase volume, a constrained sequential pricing game model was constructed. A numerical simulation of the game model was also conducted using MATLAB software, which showed that changes in each parameter had impacts on the equilibrium quoted prices and profits of both firm 1 and firm 2. The closer the dominant coefficient is to the following coefficient, the more chaotic the market is, i.e., the longer it takes for firms to reach equilibrium, and vice versa, due to the increased stability of the market. The agreed minimum purchase volume between the dominant and downstream firms also affects the quoted prices and profits of the oligopolistic firms, and a larger agreed minimum purchase volume would lead to a decrease in the profits of the oligopolistic firms, which is not conducive to their sustainable development. Therefore, regulators and industry organizations should try to reasonably regulate the gap between the dominant and following coefficients, control a reasonable range of agreed minimum procurement volumes, and determine a reasonable pricing mechanism to maintain a stable market situation and guide the market in an orderly manner.
Compared with the existing unconstrained sequential pricing mechanism, the proposed constrained sequential pricing game model considers constraints such as the parameters related to the product demand function, marginal production cost, dominant coefficient, following coefficient, and agreed minimum purchase volume. The subsequently constructed nonlinear bilevel programming solving model is an extension and effective supplement to the model analysis, thus making the model more similar to the real market. The results of this study can help firm managers reasonably regulate their own dominant degree or following degree. When encountering market fluctuations, they can quickly adjust their pricing strategies to achieve a win/win situation. At the same time, in order to maximize the overall benefits of the supply chain, ensure the price stability and profit optimization of firms, and achieve sustainable development, this paper provides a reference for firm managers to control the reasonable range of the agreed minimum purchase volume and develop the optimal pricing scheme. In addition, it provides theoretical support and methodological reference for regulators and industry organizers to control the internal management of the market and deepen the market-oriented reform of raw material supply chain pricing, which helps maintain the stable development of the market.
Future research could explore the following aspects: (1) this model only considers the case of two firms, whereas, when multiple dominant or following firms are involved, the model becomes more complex, and further research is worthwhile; (2) this paper did not consider the impact of the dynamic demand of downstream firms on the pricing of upstream firms, and further research can be conducted regarding the impact of the product demand of downstream firms on the pricing of upstream firms.

Author Contributions

Conceptualization, H.Y., R.G. and Z.Y.; methodology, H.Y. and Z.Y.; data curation, H.Y.; writing—original draft preparation, H.Y., R.G. and Z.Y.; writing—review and editing, H.Y. and Z.Y.; visualization, R.G. and Z.Y.; supervision, R.G.; funding acquisition, H.Y. and Z.Y. All authors have read and agreed to the published version of the manuscript.

Funding

This work was supported by the National Natural Science Foundation of China (61701047) and the Scientific Research Fund of Hunan Provincial Education Department (20B038). The work described in this paper was also funded by the National Natural Science Foundation of China (71973041) and the Humanities and Social Sciences Foundation of Ministry of Education of China (19YJA790026).

Institutional Review Board Statement

Not applicable.

Informed Consent Statement

Not applicable.

Conflicts of Interest

The authors declare no conflict of interest.

References

  1. Peron, M.; Fragapane, G.; Sgarbossa, F.; Kay, M. Digital facility layout planning. Sustainability 2020, 12, 3349. [Google Scholar] [CrossRef] [Green Version]
  2. Gurnani, H.; Gerchak, Y. Coordination in decentralized assembly systems with uncertain component yields. Eur. J. Oper. Res. 2007, 176, 1559–1576. [Google Scholar] [CrossRef]
  3. Cantini, A.; Peron, M.; De Carlo, F.; Sgarbossa, F. A decision support system for configuring spare parts supply chains considering different manufacturing technologies. Int. J. Prod. Res. 2022, 1–21. [Google Scholar] [CrossRef]
  4. Ji, Q.; Zhang, F.; Fang, G.; Hu, X. Game model of blockchain adoption and product pricing in retail supply chain. Chin. J. Manag. Sci. 2022. [Google Scholar] [CrossRef]
  5. Wang, C.; Li, Y.; Wang, Z. Supply chain network optimization with consideration of raw material and final product substitutions driven by price and carbon emissions. Kybernetes Int. J. Syst. Cybern. 2018, 47, 1585–1603. [Google Scholar] [CrossRef]
  6. Bai, Y.; Yang, H.; Zhao, Y.; Zhang, M.; Qin, J.; Mi, F. Optimizing the Raw Material Supply Chain of the Wood Biomass Power Generation Industry for Different Stakeholders’ Benefits: An Analysis of Inner Mongolia, China. Sustainability 2020, 12, 1887. [Google Scholar] [CrossRef] [Green Version]
  7. Razmi, J.; Kazerooni, M.P.; Sangari, M.S. Designing an integrated multi-echelon, multi-product and multi-period supply chain network with seasonal raw materials. Econ. Comput. Econ. Cybern. Stud. Res. 2016, 50, 273–290. [Google Scholar]
  8. Das, M.; Jana, D.K.; Alam, S. Game theoretic analysis of a three-stage interconnected forward and reverse supply chain. Environ. Dev. Sustain. 2022, 24, 7976–8007. [Google Scholar] [CrossRef]
  9. Taleizadeh, A.A.; Noori-Daryan, M. Pricing, manufacturing and inventory policies for raw material in a three-level supply chain. Int. J. Syst. Sci. 2016, 47, 919–931. [Google Scholar] [CrossRef]
  10. Zarouri, F.; Khamseh, A.A.; Pasandideh SH, R. Dynamic pricing in a two-echelon stochastic supply chain for perishable products. RAIRO-Oper. Res. 2022, 56, 2425–2442. [Google Scholar] [CrossRef]
  11. Wan, G.; Kou, G.; Li, T.; Xiao, F.; Chen, Y. Pricing Policies in a Retailer Stackelberg O2O Green Supply Chain. Sustainability 2020, 12, 3236. [Google Scholar] [CrossRef]
  12. Guo, P.; Hassin, R. On the advantage of leadership in service pricing competition. Oper. Res. Lett. 2013, 41, 397–402. [Google Scholar] [CrossRef]
  13. Keskin, T.; Taskin, N. Strategic Pricing of Horizontally Differentiated Services with Switching Costs: A Pricing Model for Cloud Computing. Int. J. Electron. Commer. 2015, 19, 34–53. [Google Scholar] [CrossRef]
  14. Jiang, B.; Yang, B. Quality and pricing decisions in a market with consumer information sharing. Manag. Sci. 2019, 65, 272–285. [Google Scholar] [CrossRef]
  15. Gong, Q.; Yang, J. Dynamic of sequential pricing game with bounded rationality. Chin. J. Manag. Sci. 2020, 4, 186–194. [Google Scholar]
  16. Ma, J.; Xie, L. The stability analysis of the dynamic pricing strategy for bundling goods: A comparison between simultaneous and sequential pricing mechanism. Nonlinear Dyn. 2019, 95, 1147–1164. [Google Scholar] [CrossRef]
  17. Chen, J. Supply Chain Profit Game and Equilibrium Pricing. Chin. J. Manag. Sci. 2022, 30, 128–139. [Google Scholar]
  18. Xu, M.; Li, X. Unified pricing and service effort strategy in a dual-channel supply chain with bidirectional free-riding. J. Shandong Univ. Nat. Sci. 2022, 57, 55–70. [Google Scholar]
  19. Niu, B.; Mu, Z.; Cao, B.; Gao, J. Should multinational firms implement blockchain to provide quality verification? Transp. Res. Part E Logist. Transp. Rev. 2021, 145, 102121. [Google Scholar] [CrossRef]
  20. Niu, B.; Shen, Z.; Xie, F. The value of blockchain and agricultural supply chain parties’ participation confronting random bacteria pollution. J. Clean. Prod. 2021, 319, 128579. [Google Scholar] [CrossRef]
  21. Niu, B.; Dong, J.; Liu, Y. Incentive alignment for blockchain adoption in medicine supply chains. Transp. Res. Part E: Logist. Transp. Rev. 2021, 152, 102276. [Google Scholar] [CrossRef]
  22. Li, X.; Liu, R.; Zhang, Q. Research on cost information sharing and coordination contract of a supply chain with two suppliers and a single retailer. Ind. Eng. Manag. 2021, 26, 1–10. [Google Scholar]
  23. Li, W.; Chen, J. Pricing and quality competition in a brand-differentiated supply chain. Int. J. Prod. Econ. 2018, 202, 97–108. [Google Scholar] [CrossRef]
  24. Wen, H.; Xu, M.; Tao, J. Sales model selection and pricing strategy for green degree concerned fresh agricultural products supply Chain. J. Wuhan Univ. Sci. Ed. 2020, 66, 495–504. [Google Scholar]
  25. Zhan, B.; Zhang, H.; Wang, X. Procurement and pricing decision in dual-sourcing supply chain with buyers’s investment. Chin. J. Manag. Sci. 2021, 29, 104–114. [Google Scholar]
  26. Lan, T. The impact of different supply chain power structure for optimal pricing and brand differentiation strategy. Soft Sci. 2018, 32, 139–144. [Google Scholar]
  27. Che, C.; Geng, X.; Zheng, H.; Chen, Y.; Zhang, X. The Pricing Mechanism Analysis of China’s Natural Gas Supply Chain under the “Dual Carbon” Target Based on the Perspective of Game Theory. Sustainability 2022, 14, 9510. [Google Scholar] [CrossRef]
  28. Eghbali-Zarch, M.; Taleizadeh, A.A.; Tavakkoli-Moghaddam, R. Pricing decisions in a multiechelon supply chain under a bundling strategy. Int. Trans. Oper. Res. 2019, 26, 2096–2128. [Google Scholar] [CrossRef]
  29. Giri, B.C.; Bardhan, S.; Maiti, T. Coordinating a three-layer supply chain with uncertain demand and random yield. Int. J. Prod. Res. 2016, 54, 2499–2518. [Google Scholar] [CrossRef]
  30. Shen, B.; Xu, X.; Yuan, Q. Selling secondhand products through an online platform with blockchain. Transp. Res. Part E Logist. Transp. Rev. 2020, 142, 102066. [Google Scholar] [CrossRef]
  31. Huang, C.; Li, D. Research on closed-loop supply chain pricing and profit distribution based on noncooperative-cooperative biform game and deposit return to recyclers. Chin. J. Manag. Sci. 2022. [Google Scholar] [CrossRef]
  32. Sadjadi, S.J.; Alirezaee, A. Impact of pricing structure on supply chain coordination with cooperative advertising. RAIRO-Oper. Res. 2020, 54, 1613–1629. [Google Scholar] [CrossRef]
  33. Dey, S.K.; Giri, B.C. Analyzing a closed-loop sustainable supply chain with duopolistic retailers under different game structures. CIRP J. Manuf. Sci. Technol. 2021, 33, 222–233. [Google Scholar] [CrossRef]
  34. Rajabi, N.; Mozafari, M.; Naimi-Sadigh, A. Bi-level pricing and inventory strategies for perishable products in a competitive supply chain. RAIRO-Oper. Res. 2021, 55, 2395–2412. [Google Scholar] [CrossRef]
  35. Hubert, P.; Jayashankar, M.S.; Hou, P. Blockchain adoption for combating deceptive counterfeits. Prod. Oper. Manag. 2021, 30, 864–882. [Google Scholar] [CrossRef]
  36. Huang, Z. Stochastic differential game in the closed-loop supply chain with fairness concern retailer. Sustainability 2020, 12, 3289. [Google Scholar] [CrossRef] [Green Version]
  37. Peng, X.; Wang, F.; Wang, J.; Qian, C. Research on Food Safety Control Based on Evolutionary Game Method from the Perspective of the Food Supply Chain. Sustainability 2022, 14, 8122. [Google Scholar] [CrossRef]
Figure 1. Supply chain system.
Sustainability 14 16231 g001
Figure 2. Schematic representation of the feasible domain corresponding to period t.
Sustainability 14 16231 g002
Figure 3. Flow chart of the equilibrium solution of the game.
Sustainability 14 16231 g003
Figure 4. Scenario in which the equilibrium solution under the constraint is Pareto-optimal.
Sustainability 14 16231 g004
Figure 5. Scenarios in which the equilibrium solution under the constraint is not Pareto-optimal.
Sustainability 14 16231 g005
Figure 6. Impact of agreed minimum purchase volume on firm’s equilibrium offer and profits at δ = 0.1 and η = 0.9 : (a) firm’s equilibrium quoted prices; (b) firm’s profits.
Sustainability 14 16231 g006
Figure 7. Impact of agreed minimum purchase volume on the firm’s equilibrium offer and profits at δ = 0.4 and η = 0.6 : (a) firm’s equilibrium quoted prices; (b) firm’s profits.
Sustainability 14 16231 g007
Figure 8. Impact of agreed minimum purchase volume on firm’s equilibrium quoted prices and profits at δ = 0.6 and η = 0.65 : (a) firm’s equilibrium quoted prices; (b) firm’s profits.
Sustainability 14 16231 g008
Figure 9. Effect of the following and dominant coefficients on equilibrium quoted prices, listed as (a) the effect of the following coefficient on the equilibrium quoted prices when η = 0.5 , (b) the effect of the dominant coefficient on the equilibrium quoted prices when δ = 0.5 , and (c) the effect of the following coefficient and dominant coefficient on equilibrium quoted prices.
Sustainability 14 16231 g009
Table 1. Numerical simulation results.
a1 = 1800, b1 = 7.8, c1 = 60
a2 = 2000, b2 = 7.5, c2 = 40
p 1 * (CNY) p 2 * (CNY)T (Periods)
δ = 0.6, η = 0.7, Q20 = 80097.70177.1722Situation 1
δ = 0.6, η = 0.7, Q20 = 900137.71150.5122
δ = 0.6, η = 0.7, Q20 = 1200355.5601Situation 2
δ = 0.6, η = 0.7, Q20 = 1700355.5601Situation 2
δ = 0.1, η = 0.7, Q20 = 800144.06157.314Situation 1
δ = 0.1, η = 0.7, Q20 = 900145.17147.314
δ = 0.1, η = 0.7, Q20 = 1200151.8487.314
δ = 0.1, η = 0.7, Q20 = 1600160.7301Situation 2
δ = 0.9, η = 0.87, Q20 = 8001025.6401Situation 3
δ = 0.9, η = 0.87, Q20 = 9001025.6401Situation 3
δ = 0.9, η = 0.87, Q20 = 10001025.6401Situation 3
δ = 0.9, η = 0.87, Q20 = 1100923.0801Situation 2
δ = 0.9, η = 0.87, Q20 = 1200820.5101Situation 2
δ = 0.9, η = 0.87, Q20 = 1300717.9501Situation 2
δ = 0.5, η = 0.30, Q20 = 800148.1501Situation 3
δ = 0.5, η = 0.40, Q20 = 800266.6701Situation 2
δ = 0.5, η = 0.46, Q20 = 800290.7701Situation 4
δ = 0.5, η = 0.49, Q20 = 8000312.9321Situation 6
δ = 0.5, η = 0.60, Q20 = 800105.64185.1221Situation 1
δ = 0.5, η = 0.80, Q20 = 800132.14158.638Situation 1
δ = 0.05, η = 0.02, Q20 = 80007666.665Situation 5
δ = 0.05, η = 0.04, Q20 = 80003833.39Situation 5
δ = 0.05, η = 0.06, Q20 = 800105.64900.5151Situation 1
δ = 0.05, η = 0.20, Q20 = 800142.73195.727Situation 1
δ = 0.95, η = 0.93, Q20 = 8001481.4801Situation 3
δ = 0.95, η = 0.94, Q20 = 8002666.6701Situation 2
δ = 0.95, η = 0.95, Q20 = 8000161.4020Situation 6
δ = 0.95, η = 0.96, Q20 = 8000159.729Situation 6
δ = 0.95, η = 0.97, Q20 = 8000158.076Situation 6
Publisher’s Note: MDPI stays neutral with regard to jurisdictional claims in published maps and institutional affiliations.

