Abstract
The purpose of this study is to identify the most significant issues to handle brain drains to provide sustainability in emerging economies. In this framework, a new model has been created that consists of two different stages for this situation. Firstly, necessary criteria are identified based on the key items of the balanced scorecard approach. These factors are weighted by using a bipolar q-rung orthopair fuzzy multi stepwise weight assessment ratio analysis (BOFQ M-SWARA) approach with golden ratio. Next, seven emerging economies are ranked with respect to their performance in decreasing brain drains by BOFQ, the elimination and choice of translating reality (ELECTRE) with the golden ratio. An evaluation is also carried out with intuitionistic fuzzy sets (IFSs) and Pythagorean fuzzy sets (PFSs) to test the validity of the findings. The results are similar for all different fuzzy sets, which indicates that the findings are quite coherent and reliable. The most important factor in reducing brain drain has been identified as technical competency. It would be appropriate for countries to provide tax exemptions for research and development studies. This situation can easily attract the attention of companies, as it will contribute to the reduction of costs. Thus, it will be easier to provide technological innovations in the country in the future. Thanks to technological development, it is possible to increase the productivity of enterprises in the country. In this way, the brain drain problem can be minimized as qualified personnel stay in the country. With the high number of qualified people in the country, it will be possible to produce eco-innovative products and develop clean energy technology. Due to this issue, sustainability can be provided in the economic development of emerging economies.
1. Introduction
Sustainability means that a natural balance should be taken into consideration while meeting needs. In other words, it advocates that the environment should not be harmed in the relevant process. This concept has also become very popular in the economic field [1]. Each country aims to develop its economy, but it has been observed that some steps taken regarding economic growth can harm the environment. A significant amount of energy is needed in the industrial production process, which positively affects economic growth. However, with the supply of this energy from fossil fuels, significant carbon emissions occur. In summary, while the economy is growing, it starts to harm the environment [2]. It is not possible for this situation to be permanent in the long run. There are some actions that countries should take to achieve this goal [3]. First, energy must be used efficiently. By using less electricity in the production process, the negative impact on the environment will be reduced [4]. Secondly, the use of clean energy has a very important role in reducing air pollution. This contributes to the sustainability of economic growth.
To achieve sustainable economic development goals, it is essential for countries to invest in certain aspects. In this context, technological developments are necessary to achieve these goals. Thanks to the developing technology, the efficiency of the companies can be increased. This both positively affects the profitability of companies and reduces the amount of energy used [5]. Thus, the economic growth of countries will become more sustainable. On the other hand, the country needs qualified personnel to achieve this goal. Issues such as clean energy use and energy efficiency are projects that involve complex engineering processes. Therefore, it is necessary to have qualified personnel to carry out these processes effectively [6].
Companies also play an important role in ensuring sustainability. Complying with the sustainability criteria of companies in a country is important for the country to achieve its sustainable economic development goals. This situation also provides some advantages to companies. First, companies that pay attention to environmental issues in their activities will have a positive image in the market [7]. In this way, related companies will be more preferred by both consumers and investors. The fact that consumers prefer a company’s products more will contribute to the competitiveness of this company. Thus, it will be possible to increase the profitability of the company in the long run. Moreover, as investors prefer a company more, it will be much easier for the company to reach the financial resources it needs. This will contribute to the effective management of costs and the cash balance. In this context, companies need to take some actions in order to achieve their sustainability goals. First, companies should prioritize the use of clean energy [8]. Due to the absence of carbon emissions from energy consumption, businesses will not harm the environment with their activities. Furthermore, energy efficiency is another important issue in this process. Less energy consumption also helps minimize the damage to the environment. These mentioned issues significantly support the sustainability of companies.
On the other hand, companies need qualified personnel to be sustainable. In order for clean energy projects to be used for a long time, enterprises must employ qualified personnel. These projects involve complex engineering processes, and the negative experiences to be had in the process reduce the performance of these investments. Therefore, it is important to solve these problems quickly [9]. In this process, taking quick action to solve problems is only possible with qualified personnel. Additionally, innovative investment ideas are needed in order to achieve energy efficiency targets in a business. In this context, companies with qualified personnel also have a very important competitive advantage compared to their competitors. In summary, companies need to be able to employ qualified personnel in order to be sustainable. On the other hand, having a sufficient amount of qualified labor in the country is also of vital importance in this process [10]. Migration of qualified personnel to other countries for a number of reasons is an important obstacle for businesses and countries to achieve their sustainability goals.
Brain drains also pose an obstacle for countries to achieve their sustainable economic development goals. In its most basic form, “brain drain” refers to the movement of skilled labor from one country to another. It is possible to talk about some negative effects of this situation on the country. Countries that suffer brain drain are more backward than others in every sense [11]. In addition, it is very difficult for countries experiencing brain drain to innovate in technology. Contrary to this situation, these countries must buy technological innovations from other countries by paying money. This situation causes the economies of countries to become fragile. In summary, for economic development to be sustainable, countries should be able to minimize the brain drain problem.
There are some measures that countries can take to combat the brain drain problem. First, it is necessary to improve the economic conditions in the countries. The low unemployment rate in a country increases the likelihood of people finding a job in that country. This helps to reduce the brain drain. High inflation reduces the country’s purchasing power while also increasing market uncertainty [12]. This situation creates the problem that qualified personnel prefer to live abroad. The lack of development in technology is another issue that increases the brain drain. Therefore, to attract the attention of qualified personnel, they need to give importance to the research and development work of the country.
Political issues are also important for the solution of the brain drain problem. Ensuring local political conditions for skilled workers is a necessary aspect of solving this problem. Necessary measures should also be taken against problems such as weak legal order and job insecurity. Moreover, it is essential for the country to be successful in the field of social policies to minimize the brain drain [13]. In this framework, it is necessary to provide effective social conditions for talented employees. On the other hand, factors related to the security of the country also have an impact on the brain drain. People may prefer to live in other countries if they do not feel safe.
Brain drain is a problem that must be prevented for economic development to be sustainable. Otherwise, countries will have a lower level of development compared to others. However, there are many different factors that affect the brain drain problem. In this context, it is not very reasonable for countries to take action on all issues [14]. Given that all of the proposed measures will incur new costs, many improvements for all factors may have a negative impact on the countries’ budget balance. Therefore, it is vital to determine the priority of these measures to ensure efficiency in this process [15].
The goal of this study is to identify the most important factors for dealing with brain drains and ensuring sustainability in emerging economies. A novel model has been constructed that includes two different stages. First, necessary criteria are identified based on the main perspectives of the balanced scorecard approach. These factors are evaluated by using BOFQ M-SWARA with the golden ratio. Next, seven emerging economies are ranked with respect to the performance of decreasing brain drains by BOFQ ELECTRE with the golden ratio. To test the validity of the findings, IFSs and PFSs are also evaluated.
The main contributions of the paper are as follows:
- (i)
- Priority strategies can be generated for the countries to minimize brain drain problems so that governments can take action without having too much of a budget deficit. Qualified manpower is a crucial element for sustainable economic development. Therefore, this situation helps both businesses and the country achieve their sustainability goals. In the literature, there are several studies that focus on the importance of the brain drain problems. However, there are limited studies that identify the most significant factors to manage this problem. Hence, this study can have a positive contribution to satisfy this missing point.
- (ii)
- A causal relationship between the key determinants of brain drains can be identified. Many studies in the literature have emphasized the importance of qualified manpower in achieving the sustainability goals of a country or company. On the other hand, there are a limited number of studies that establish a causal relationship between the criteria for keeping qualified manpower in the country. There may be a causal relationship between the factors affecting this process, such as economic development, security in the country and low bureaucracy. Analyzing this relationship also helps to develop more accurate strategies. In this context, it is thought that the causality analysis increased the originality of this study compared to the others.
- (iii)
- Appropriate policies can be defined that contribute to sustainability in economic development. In a significant part of the studies in the literature, it is seen that the factors affecting the sustainability issue are examined in general. However, analyses of specific issues will help develop clearer recommendations in this process. In this study, the focus is on qualified manpower, which is very effective for sustainability. Thanks to the policies that will be developed based on the results of the analysis, clearer strategies will be offered for both businesses and governments to achieve their sustainability goals.
- (iv)
- A new model has been created by integrating BOFQ, SWARA, ELECTRE and the golden ratio. In summary, it is believed that this study has both theoretical and methodological contributions to the literature. The proposed decision-making model also has some superiorities in comparison with the previously generated ones. In this study, the classical SWARA technique is improved, and a new methodology (M-SWARA) is created. This new technique provides an opportunity to understand the causal relationship between the items. However, the studies that considered classical SWARA or analytical hierarchy process techniques could not identify the causal relationship between the factors. The reasons for brain drains can have an impact on each other. For example, the economic problems in the country can also prevent the development of technology. Similarly, because of political problems in the country, expectations in the market may change negatively. Therefore, a technique that can measure the causal relationship between the variables should be preferred in the priority analysis to be made. In this context, the M-SWARA method is an appropriate method for this issue.
In addition to this situation, calculating the degrees in the analysis process appropriately is another key issue. This condition plays a key role in handling uncertainty in this process. By using the golden cut, it is aimed to both increase the originality of the model and minimize uncertainty in the evaluation. Additionally, due to the use of bipolar fuzzy sets, both positive and negative membership functions are used. This situation provides an opportunity to work with a more detailed information set. Because of this issue, we have integrated BOFQ, M-SWARA, ELECTRE and the golden ratio to create a novel model so that appropriate and effective strategies can be generated to overcome the brain drain problems with the aim of achieving sustainability. Finally, the comparative analysis, while also considering IFSs and PFSs, helps to check the coherency, reliability and validity of the findings.
The literature examination is detailed in the following section. The techniques considered in the analysis are explained in the next section. The fourth part includes the results. The final sections give information about the discussions, policy recommendations and conclusions.
2. Literature Review
The literature is reviewed first in this section to understand the main ways to increase sustainability in businesses. Secondly, studies that have focused on brain drain problems are examined. Finally, significant points of the literature review are underlined.
2.1. Literature Review for Sustainability
Sustainability is a very important concept for businesses. Reducing the damage they cause to the environment in their activities will provide a very serious advantage to these institutions. For example, if a business continues to operate without harming the environment, it will increase its reputation in the eyes of investors [16,17]. This will contribute to the fact that businesses are preferred by both consumers and investors. As a result of consumers preferring the products of this company more, the sales revenues of the company will increase significantly. This will help increase the profitability of the business. Similarly, as a business is preferred more by investors, it will be possible for the business to reach the financial resources it needs more easily [18]. Therefore, many different studies have been carried out in the literature on how to increase sustainability in businesses.
One of the most important ways to increase sustainability in businesses is to increase the use of clean energy. Energy is one of the most important raw materials in the industrial production of enterprises [19]. Therefore, if fossil fuels are preferred in this process, businesses cause significant damage to the environment through their activities [20]. In this case, due to the preference for renewable energy sources, no carbon gas will be released into the atmosphere [21]. By minimizing air pollution, it will be much more possible for businesses to ensure sustainability in their activities [22]. Mukoro et al. [23] aimed to identify ways to increase sustainability for African companies. They underlined that companies should mainly focus on clean energy investments to reach this objective. Similarly, Madaleno et al. [24] also identified that companies should make significant investments in clean energy technologies so that they can become more sustainable.
Energy efficiency is another critical factor for businesses to be sustainable. Businesses use a significant amount of energy in their operations [25]. Today, a very important part of this energy need is produced from fossil fuels [26]. Therefore, industrial production leads to more energy consumption which leads to an increase in the carbon emission problem [27]. In this process, the decrease in the amount of energy consumed also contributes to the minimization of the damage the enterprises cause to the environment through their activities [28]. Thus, businesses can reach their sustainability goals more easily. Soleimani et al. [29] examined the main determinants of sustainability for companies. They defined energy efficiency as playing a crucial role in achieving this purpose. Additionally, Moerkerken et al. [30] evaluated the indicators of sustainability for the Dutch dairy sector. They reached a conclusion that companies should provide energy efficiency so that environmental damage in the production process can be decreased. This situation has a powerful impact on the sustainability of these companies.
Qualified personnel also play a very important role in ensuring the sustainability of businesses. Most of the actions to be taken for businesses to reach their sustainability goals include comprehensive processes [31]. For example, employees with high engineering knowledge are needed for the implementation of clean energy projects [32]. On the other hand, innovative ideas are needed to ensure energy efficiency in a business [33]. This situation can only be made possible with the employment of qualified personnel in enterprises. Thanks to the investment ideas developed by these personnel, the same amount of work can be carried out by consuming less energy [34]. Thus, businesses will be able to reach their sustainability goals much more easily. Kayack et al. [35] generated a new decision-making model to identify important points for the companies to be included in the sustainability index. They concluded that having qualified personnel is a critical factor in this situation. Furthermore, Kafka et al. [36] also aimed to define the critical issues to increase sustainability for the companies. They stated that the companies should give priority to employing qualified employees so that they can achieve their sustainability goals more effectively.
2.2. Literature Review for Brain Drains
There is a wide range of literature regarding brain drains. Some scholars focus on the main indicators of this problem. Based on different studies, economic problems play a key role in this framework. Unemployment problems can have an impact on brain drains. In the absence of job opportunities in the country, people may prefer to work in other countries. Thissen et al. [37], Stukalina et al. [38] and Yousuf et al. [39] also discussed that the unemployment problem should be solved to manage the brain drain problem. High salary opportunities are also one of the factors to be considered in preventing people from going to other countries in many studies [40,41,42]. Nghia [43], Foo [44] and Asenikova et al. [45] carried out an evaluation regarding the brain drain problem. They concluded that high salaries should be provided for qualified employees to overcome this problem. Labrianidis and Sykas [46], Méndez [47] and Aytaç and Aydın [48] identified that in case of economic recession in countries, there is a risk that the brain drain problem will increase in a significant manner.
Political negativity is also a factor in the rise of the brain drain problem. As a result of the political problems in the country, the anxiety of the citizens increases. In this case, people will prefer to migrate to other countries. Roudgar and Richards [49], Torbat [50] and Nghiêm-Phú and Nguyễn [51] also identified that political instability in countries is one of the main causes of the brain drain problem. Moreover, Raggl [52], Ghulam et al. [53] and Olga Orosová and Kulanová [54] focused on the brain drain problem. It is found that due to the high level of bureaucracy in government institutions, there are disruptions in the processes. This will reduce people’s happiness, and those who have the opportunity will prefer to live abroad. Problems in the health sector also lead to an increase in the problem of brain drain. In countries where there are not enough hospitals or doctors, people cannot receive effective health services [55,56,57]. This issue also plays an important role in the rise of the brain drain problem [58,59,60].
Social problems in the country also cause the problem of brain drain. In this process, cultural factors are also very important. If there are differences between people’s lifestyles and the cultural structure of the country, people’s dissatisfaction increases [61,62]. These people also prefer to immigrate to other countries [63,64]. Labrianidis and Sykas [46] and Ma et al. [65] focused on the brain drain problems in different countries. It is determined that one of the most important causes of the brain drain problem is culture clash. The existence of racism in a country is another problem that makes people nervous. As a result of racism, some people in the country cannot find a job comfortably [66,67]. On the other hand, these people have significant problems in their relations with other segments of society [68,69]. This situation forces people to leave the country, thus causing brain drain. Gérard and Sanna [70] and Li and Sun [71] also carried out an evaluation to overcome the brain drain problem. It has been underlined that to combat this problem, the problem of racism must be solved first.
2.3. Literature Review Results
The literature examination indicates that it is a very crucial issue to understand the ways to increase sustainability in businesses. This situation has a positive influence on the image of the company, making it more appealing to customers and investors. Hence, the company can both find financial resources much more easily and increase the sales volume. It is also seen that the brain drain problem is quite significant. Because of this issue, most countries aim to take actions to overcome this situation for the purpose of sustainable economic development. Most of the scholars have focused on the main reasons for the brain drain problem. However, the main problem is that it is not very reasonable for countries to take action on all issues. Each action to handle this problem leads to an increase in costs. Many improvements for all factors may have a negative impact on the countries’ budget balance. Due to this situation, it is a crucial issue that the priority of these measures be identified to ensure efficiency in this process. As a result, the goal of this study is to define the most important issues in dealing with brain drains in order to provide sustainability in emerging economies using an original model. Thus, it is believed that this study has both theoretical and methodological contributions to the literature.
3. Methodology
Sustainability is a very important phenomenon for companies. This situation contributes to a positive increase in the image of the companies. Companies that take action on sustainability are preferred by both investors and consumers. Thus, it will be possible for companies to find financing sources more easily. Moreover, as consumers prefer more, it will be easier for companies to increase their sales volumes. Thus, the profitability of the companies will be increased more effectively. For companies to achieve their sustainability goals, they need to take some actions. The use of clean energy and ensuring energy efficiency in the production process are suitable examples for this situation. Companies need qualified personnel to achieve these goals. Actions to be taken for sustainability involve very complex processes. Therefore, businesses need to employ qualified personnel to achieve this goal. As a result of a brain drain in a country, there is a risk that the competent workforce will migrate abroad. In summary, the brain drain problem is an important obstacle for both companies and the country to achieve their sustainability goals. Thus, it is significant to understand the most efficient solution for the countries that minimize brain drain. In the literature, there is a substantial amount written about the ways to increase sustainability in companies and the significance of the brain drain problem. However, there have been few studies that have focused on ways to reduce brain drains in order to increase sustainability. Accordingly, this study aims to identify key strategies to overcome brain drain problems so that sustainability can be provided. In this circumstance, a new model has been created by considering different methods. In this section of the study, the details of these methods are explained.
3.1. BOFQ with Golden Cut
The problems have become quite complex with the emergence of so many influencing criteria. Therefore, it has become difficult to solve these problems with decision-making techniques. In this process, new applications are needed to reach an effective solution. New fuzzy numbers have been developed within the scope of these applications. Intuitionistic fuzzy set (I) was introduced by Atanassov [72]. The main difference between these sets by comparing with classical fuzzy sets is that the degree of non-membership is identified in addition to the degree of membership. The details are demonstrated in Equations (1) and (2) where ( refer to the membership and non-membership degrees.
Another improvement in this process in the Pythagorean fuzzy sets (P) introduced by Yager [73]. In this framework, a wider area can be covered in the analysis process. Equations (3) and (4) explain the details of these sets.
Furthermore, q-ROFSs were also created by Yager [74] while integrating I and P. There are two different q levels in these sets. In the first level, “I” is taken into consideration whereas “P” is demonstrated in the second level. In these sets, it is aimed to consider larger space so that a better evaluation can be conducted. Equations (5) and (6) indicate the details of these sets.
Additionally, to manage uncertainty in this process, bipolar fuzzy sets (BOF) were also introduced by Zhang [75]. In these sets, there are both positive and negative poles that represent desirable and undesirable conditions. These sets are explained in Equation (7) where shows satisfaction degree and demonstrates the satisfaction of the same element to some implicit counter property. Additionally, B represents bipolar fuzzy sets.
The integration of BOF with I, P and q-ROFSs is indicated in Equations (8)–(13).
In this context, and define the positive member and non-membership degrees. Also, are the negative member and non-membership degrees.
Operations of these sets are identified in Equations (14)–(17).
and
Defuzzified values are given in Equations (18)–(20). Within this context, , , are the score functions of the bipolar IF, PF and q-ROF sets, respectively.
Computing degrees effectively is a critical issue in this process. In this study, it is calculated by golden ratio (G) to increase both appropriateness and originality. Equations (21)–(23) give information about this ratio in which a and b show the large and small quantities [76,77]. Additionally, and refer to the degrees.
Equations (24)–(26) are used to generate bipolar q-ROFSs (BOFQ).
3.2. M-SWARA Method with BOFQ
SWARA represents step wise weight assessment ratio analysis and Kersuliene et al. [78] introduced this methodology to compute the significance weights of different items. Few pairwise comparisons can be made in this technique that is accepted as a key advantage. With the help of this issue, it can be possible to increase efficiency in this process. Moreover, the expert team can also consider their priorities in the evaluation process. This situation has a positive impact on the effectiveness of the analysis. In this study, some improvements are made to this model and a new technique is created by the name of multi SWARA (M-SWARA). Owing to these improvements, the causal relationship among the criteria can be found. Opinions are collected from decision makers. Secondly, relation matrix (Q) is created as in Equation (27).
Next, BOF sets are generated. Fourthly, , , and values are calculated by Equations (28)–(30). In this context, identifies the coefficient value, shows the recalculated weight, demonstrates the comparative importance rate and explains the weights of the factors.
Stable values are identified while transposing and limiting the matrix with the power of 2t + 1. Finally, both causal relationship and weights are identified.
3.3. ELECTRE with BOFQ
ELECTRE is created by Benayoun et al. [79] with the aim of alternative ranking. Binary superiority comparisons between alternative decision points are taken into consideration in the analysis process so that concordance and discordance intervals can be computed. In this study, ELECTRE is integrated with BOFQ. First, the opinions of the experts are obtained. Secondly, a decision matrix is generated as in Equation (31).
BOFQ sets are generated and score values are calculated. Equation (32) is used for the creation of the normalized matrix () in the next step.
Next, the weights () of the values are calculated in Equation (33).
The concordance C and discordance D interval matrixes are created with Equations (34)–(39). Also, and are the concordance and discordance interval sets.
Moreover, Equations (40)–(47) are taken into consideration to construct the concordance E, discordance F and aggregated G index matrixes.
Finally, the net superior , inferior , and overall values are identified as in Equations (48)–(50) so that the alternatives can be ranked.
3.4. Research Methodology
This study aims to evaluate the ways to minimize brain drain with the aim of providing sustainability in emerging economies. An original model is generated that consists of two different stages. Firstly, necessary criteria are identified based on the key items of balanced scorecard approach. Additionally, these factors are evaluated by using BOFQ M-SWARA approach with the golden ratio. Secondly, seven emerging economies are ranked with respect to the performance of decreasing brain drains by BOFQ ELECTRE with the golden ratio. The steps of this model are explained in Figure 1.

Figure 1.
The details of the proposed model.
Figure 1 gives information that this proposed model has two different stages. In the first stage, the weights of the determinants are computed. In this framework, firstly, the factors that can prevent brain drain problems are identified. Secondly, expert opinions are provided. Thirdly, average values are computed. The score values are defined in the fourth step. Step 5 includes the computation of sj, kj, qj and wj values. Sixthly, the relation matrix is created. The stable matrix is constructed in Step 7. In the eighth step, the weights of the determinants are calculated.
On the other side, the second stage of the proposed model is related to evaluating emerging economies regarding brain drain prevention policies. Within this context, the ninth step gives information about the collection of the expert opinions of the alternatives. The tenth step focuses on the calculation of the average values. Step 11 includes the calculation of the score values. Normalization procedures are implemented in the following step. Step 13 is related to the construction of the weighted matrix. The next step explains the generation of the interval matrixes. In Step 15, index matrixes are constructed. Step 16 includes ranking the economies.
4. Analysis
4.1. Computing the Weights of the Determinants (Stage 1)
In Step 1, the factors that can prevent brain drain problems are identified. In this scope, balanced scorecard technique is taken into consideration. This methodology focuses on both financial and nonfinancial issues that are accepted as the key superiority. Balanced scorecard approach considers mainly four different issues that are finance, customer, internal process and learning and growth. Balanced scorecard-based determinants are given in Table 1.

Table 1.
Determinants.
Financial issues help to minimize the brain drain problem. In this framework, financial incentives, economic growth and unemployment ratios are taken into consideration. Secondly, market expectations play a key role in this circumstance. Positive expectations in the market can attract the attention of a qualified workforce. As well, with respect to self-development, opportunities on the job and off the job trainings are significant. Finally, technical competency includes the use of updated systems and upgraded equipment for the efficient outcomes of global markets.
In Step 2, opinions are taken into account. In this context, the scales are no (n), some (s), normal (n), high (h) and very high (vh) for the criteria and poorest (w), bad (p), normal (f), important (g) and perfect (b) for the economies. On the other side, positive membership/non-membership (0.4, 0.45, 0.5, 0.55, 0.6/0.25, 0.28, 0.31, 0.34, 0.37) and negative membership/non-membership (−0.6, −0.55, −0.5, −0.45, −0.4/−0.37, −0.34, −0.31, −0.28, −0.25) are considered for these scales.
The expert team consists of three decision makers. These people have more than 26-year work experience. Two of them are professors that make significant research in the area of social policies. The third expert works as a top manager in a department of the government that aims to create effective social policies. Expert opinions for criteria are provided in Table A1 (Appendix A).
Average values are computed regarding Step 3 and are detailed in Table A2. Additionally, Step 4 includes the definition of the score values as in Table A3. Step 5 considers the computation of sj, kj, qj and wj values. The results are indicated in Table A4. The relation matrix is created in Step 6 and shown in Table A5. A stable matrix is constructed in Step 7 and the values are presented in Table A6. The causal degrees are demonstrated in Figure 2.
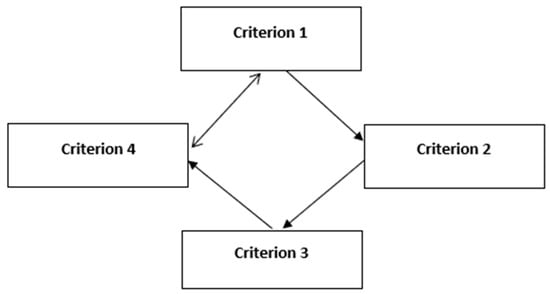
Figure 2.
Impact relation map.
It is found that there is a mutual relationship between financial needs and technical competency. Similarly, financial needs also have influence on the market expectations. Additionally, technical competency is also affected by self-development. In Step 8, the weights of the determinants are computed. In this framework, a comparative evaluation is conducted by using bipolar I, P and q-ROFSs. The details are stated in Table 2.
Table 2.
Weights.
Technical competency is found as the most critical factor for the purpose of minimizing the brain drain problem. Market expectations also play a significant role in this respect. Countries should give priority to technological competence to solve the brain drain problem. Developing technology offers benefits to countries in many areas. Thanks to technological developments, it will be possible to increase the efficiency of companies. This will help companies to increase their profitability, as this will reduce costs. Technological developments also enable the emergence of qualified job opportunities. This situation will attract the attention of talented people and thus it may be possible to reduce the brain drain problem.
4.2. Evaluating Emerging Economies Regarding Brain Drain Prevention Policies (Stage 2)
In the first stage, the most important items to minimize brain drain problems are identified. In the second part of this proposed model, an application has been made for emerging economies by considering these weighted criteria. For this purpose, seven emerging countries are examined: Russia (RSI), Brazil (BRI), India (INI), China (CIN), Turkey (TKE), Indonesia (ION) and Mexico (MIO). As for Step 9, the opinions are demonstrated in Table A7. Average values are computed in Step 10 and presented in Table A8. Step 11 includes the calculation of the score values that are presented in Table A9. Normalization has been implemented in Step 12 and the calculated matrix is given in Table A10. Step 13 is related to the construction of the weighted matrix as in Table A11. Interval matrixes are generated in Step 14 and detailed in Table A12. In Step 15, index matrixes are constructed. The results are given in Table A13. Step 16 includes ranking the economies with BOFQ. The results are presented in Table A14. The comparative results are demonstrated in Table 3.
Table 3.
Ranking results for the economies.
The ranking results are similar for all the different fuzzy sets. This situation indicates that the findings are quite coherent and reliable. China and India are found as the most successful countries to handle the brain drain problem. On the other hand, Russia and Brazil rank last.
5. Discussions
Countries need to pay great attention to sustainability while developing their economies. This situation has become more important, especially with problems such as global warming. As a result of carbon emissions, the environment is seriously damaged. If necessary measures are not taken to address this problem, the world will become unlivable. In this context, both countries and businesses must implement sustainability measures. Countries should try to prevent practices that harm the environment with legal regulations. On the other hand, as a result of providing incentives for the use of clean energy, it will be possible to minimize carbon emissions in the industrial production process.
To achieve this goal, it is important for companies to take some precautions. The most basic reason for this is that it is not possible to reach the sustainability goals with the actions taken by the states alone. This will also increase the image of the companies in the eyes of both customers and investors. Thus, companies will be able to increase their sales revenues and access the financial resources they need more quickly. Thus, companies will be able to gain a significant competitive advantage compared to their competitors. This will allow businesses to increase their profitability in the long term.
It is possible to discuss different actions that companies can take regarding sustainability. First, it would be appropriate for companies to prefer clean energy sources instead of fossil fuels in their energy consumption. This will help to significantly reduce the carbon emission problem. Moreover, it will be possible to reduce the amount of energy used in the production process by ensuring energy efficiency within the company. This will significantly reduce the damage caused by companies to the environment during their activities. Companies need qualified personnel to achieve these goals. To adapt clean energy technologies for the company, engineers who have knowledge of comprehensive processes should be employed. Similarly, there is a need for well-equipped personnel who will develop investment projects for innovative technologies in order for companies to increase their energy efficiency.
Brain drain has become very important for countries. Every country wants its economy to develop. In addition, it takes some actions to ensure that this economic progress is sustainable. On the other hand, brain drains create an obstacle to achieve sustainability goals. Due to the brain drain, countries are losing their qualified people. This situation also leads to a decrease in the skilled manpower required for the development of countries. In a country where the number of qualified people is decreasing, it will be very difficult to take innovative steps. Therefore, it is difficult to ensure sustainability in the development of the economy.
In this context, it is necessary to reduce the brain drain problem to ensure sustainability in the economic progress of countries. In this process, it is important for states to take some actions and contribute to the solution of this problem. There are many different factors that affect brain drain. On the other hand, it is not very reasonable financially to make improvements in every area. A new model has been developed in this study to present effective strategies for the solution of this problem. According to the results of the analysis obtained, it is seen that technological developments play a very important role in the fight against the brain drain problem. Therefore, it is very important for the countries to develop their technologies first in terms of the efficiency of the actions to be taken.
Technological development is effective on many factors that are of key importance for the country’s economy. Thanks to technological development, it is possible to increase the productivity of enterprises in the country. In this way, companies operating in the country will be able to compete with other international companies. This will contribute to the selection of talented personnel from these companies. In this way, it will be easier to minimize the brain drain problem as qualified personnel stay in the country. Segal [80] evaluated the main reasons for the brain drain in Africa. They determined that inadequate technological infrastructure is one of the most important indicators of brain drain. Shahebrahimi et al. [81] focused on this problem in Iran. They reached a conclusion that research and development works should be increased so that it can be much easier to overcome the brain drain problem.
As a result of technological developments, the need for qualified personnel in companies will increase significantly. In other words, companies will need more qualified personnel to increase their competitiveness. As a result, companies will prioritize the recruitment of talented personnel. In this case, companies will offer high salaries to attract the attention of these personnel. Thus, skilled personnel in the country may be prevented from going abroad. Ajeeb [82], Enkhtaivan et al. [83] and Asso [13] carried out an examination about the drivers of brain drains for different countries. They underlined that high salaries should be provided to attract the attention of qualified personnel.
This situation is in parallel with the sustainable development goals. Providing quality education is a very important consideration in achieving these goals. In this context, regardless of gender, all individuals living in the country should have equal access to education. Minimizing the problems that cause brain drain in the country also contributes to achieving this goal. In a country where equal educational opportunities are offered to citizens, skilled labor will not migrate. In this way, it will be easier for the country to achieve its sustainability goals. Accessible and clean energy is one of the most important sustainable development goals. This purpose basically emphasizes the access of citizens living in the country to sustainable and modern energy. On the other hand, clean energy projects both involve complex processes and require the use of up-to-date technology. A qualified workforce is needed to address these issues successfully. In other words, it is important for countries to take actions that can minimize the brain drain problem to reach sustainable development goals.
In the literature, a new technique was also generated with the name of triple bottom line for the concept of sustainability. This concept considers people, planet and profitability to provide sustainability. Issues such as the income that the sector adds to the gross national product and the growth of business areas are considered under the name of profit. Environmental considerations include elements such as fossil fuel use and energy consumption. The educated workforce is considered among the social variables in this method. This situation is quite similar with respect to the analysis results of this study. In this context, the qualified workforce is quite significant to reach sustainable development goals more easily. This situation plays a crucial role for each of the three elements of the triple bottom line. With the help of qualified people, sustainable profitability can be obtained. Moreover, these people are also helpful for taking necessary actions regarding environmental considerations. Hazardous waste management resulting from energy consumption can be carried out much more successfully thanks to the qualified workforce. In summary, the prevention of brain drain is important for each element of the triple bottom line model, which is important for sustainability.
6. Policy Recommendations
It has been concluded that to prevent the brain drain problem in countries, it is necessary to focus on technological development first. In this framework, it would be appropriate for countries to provide tax exemptions for research and development studies first. This will easily attract the attention of companies as it will contribute to the reduction of costs. As a result, it will be possible to have companies that carry out more research and development activities in the country. Thus, it will be easier to provide technological innovations in the country in the future. Another measure that can be implemented by the state to increase technological developments is to provide financial resources to companies engaged in research and development activities. Thanks to the low-interest loans, the costs of the companies will be reduced. As a result, it will be easier for companies to be financially sustainable. These issues will contribute to the technological development in the country, and this will contribute to the fight against the brain drain problem more easily.
7. Conclusions
A novel model has been constructed in this study with the aim of examining the ways to minimize brain drains with the aim of providing sustainability in emerging economies. Firstly, necessary criteria are identified based on the key items of the balanced scorecard approach. By using the BOFQ M-SWARA approach with the golden ratio, these factors are evaluated. Secondly, emerging seven economies are analyzed regarding the performance of decreasing brain drains by BOFQ ELECTRE with the golden ratio. An evaluation is also made with IFSs and PFSs to test the validity of the findings. The results are similar for all different fuzzy sets. This situation indicates that the findings are quite coherent and reliable. Technical competency is found as the most critical factor for the purpose of minimizing the brain drain problem.
The fact that companies have advanced technology allows countries to reach their sustainable development goals more easily. In this context, it would be appropriate for countries to provide incentives for technological investments. In a country where there are companies with high-tech equipment, qualified personnel will not have to migrate abroad. As the qualified workforce in the country grows, it will be possible to expand renewable energy projects even further. On the other hand, these qualified personnel will also be able to develop effective ideas for energy efficiency. Thanks to these situations, it will be possible to achieve sustainability goals more easily.
In this study, priority strategies are generated for the countries to minimize brain drain problems by a new model. The analysis results pave the way for the countries to handle this situation in an efficient manner. The most important limitation of this study is that only seven emerging countries are taken into consideration in the analysis process. On the other hand, the problem of brain drain is an important issue for other countries as well. If necessary measures are not taken for this problem, it is likely that developed economies will have problems in the future. Therefore, it would be appropriate to examine developed countries in new analyses. In addition, new decision-making models can be established in future studies. In this context, the results obtained in the models to be created by considering the newly-found numbers can also be a guide to reach effective solution suggestions.
Author Contributions
S.M., H.D., H.B. and S.Y. contributed equally to all aspects of the research reported in this paper. All authors have read and agreed to the published version of the manuscript.
Funding
This research received no external funding. The APC was funded by authors.
Institutional Review Board Statement
Not applicable.
Informed Consent Statement
Not applicable.
Data Availability Statement
Not applicable.
Conflicts of Interest
The authors declare no conflict of interest.
Appendix A
Table A1.
Linguistic evaluations of criteria.
Table A1.
Linguistic evaluations of criteria.
| Decision Maker 1 | ||||||||
|---|---|---|---|---|---|---|---|---|
| FLD | MKX | SPM | TPC | |||||
| Positive Degrees | Negative Degrees | Positive Degrees | Negative Degrees | Positive Degrees | Negative Degrees | Positive Degrees | Negative Degrees | |
| FLD | VH | H | M | H | M | S | ||
| MKX | H | N | VH | VH | M | H | ||
| SPM | S | N | H | S | H | M | ||
| TPC | N | N | VH | M | N | N | ||
| Decision Maker 2 | ||||||||
| FLD | MKX | SPM | TPC | |||||
| Positive Degrees | Negative Degrees | Positive Degrees | Negative Degrees | Positive Degrees | Negative Degrees | Positive Degrees | Negative Degrees | |
| FLD | VH | N | H | H | M | N | ||
| MKX | H | S | VH | S | H | N | ||
| SPM | S | N | H | S | H | S | ||
| TPC | H | S | H | M | N | N | ||
| Decision Maker 3 | ||||||||
| FLD | MKX | SPM | TPC | |||||
| Positive Degrees | Negative Degrees | Positive Degrees | Negative Degrees | Positive Degrees | Negative Degrees | Positive Degrees | Negative Degrees | |
| FLD | M | H | M | H | M | S | ||
| MKX | M | VH | VH | VH | M | H | ||
| SPM | M | H | M | VH | H | H | ||
| TPC | M | N | VH | VH | N | H | ||
Table A2.
Average values.
Table A2.
Average values.
| FLD | MKX | SPM | TPC | |||||||||||||
|---|---|---|---|---|---|---|---|---|---|---|---|---|---|---|---|---|
| Positive Degrees | Negative Degrees | Positive Degrees | Negative Degrees | Positive Degrees | Negative Degrees | Positive Degrees | Negative Degrees | |||||||||
| μ | n | μ | n | μ | n | μ | n | μ | n | μ | n | μ | n | μ | n | |
| FLD | 0.57 | 0.35 | −0.50 | −0.31 | 0.52 | 0.32 | −0.45 | −0.28 | 0.50 | 0.31 | −0.57 | −0.35 | ||||
| MKX | 0.53 | 0.33 | −0.52 | −0.32 | 0.60 | 0.37 | −0.45 | −0.28 | 0.52 | 0.32 | −0.50 | −0.31 | ||||
| SPM | 0.47 | 0.29 | −0.55 | −0.34 | 0.53 | 0.33 | −0.50 | −0.31 | 0.55 | 0.34 | −0.50 | −0.31 | ||||
| TPC | 0.48 | 0.30 | −0.58 | −0.36 | 0.58 | 0.36 | −0.47 | −0.29 | 0.40 | 0.25 | −0.55 | −0.34 | ||||
Table A3.
Score values.
Table A3.
Score values.
| FLD | MKX | SPM | TPC | |
|---|---|---|---|---|
| FLD | 0.000 | 0.234 | 0.175 | 0.234 |
| MKX | 0.221 | 0.000 | 0.235 | 0.201 |
| SPM | 0.205 | 0.211 | 0.000 | 0.223 |
| TPC | 0.238 | 0.229 | 0.176 | 0.000 |
Table A4.
Sj, kj, qj, and wj values.
Table A4.
Sj, kj, qj, and wj values.
| FLD | Sj | kj | Qj | Wj | MKX | Sj | kj | qj | Wj |
|---|---|---|---|---|---|---|---|---|---|
| TPC | 0.234 | 1.000 | 1.000 | 0.351 | SPM | 0.235 | 1.000 | 1.000 | 0.400 |
| MKX | 0.234 | 1.234 | 1.000 | 0.351 | FLD | 0.221 | 1.221 | 0.819 | 0.327 |
| SPM | 0.175 | 1.175 | 0.851 | 0.299 | TPC | 0.201 | 1.201 | 0.682 | 0.273 |
| SPM | Sj | kj | Qj | Wj | TPC | Sj | kj | qj | Wj |
| TPC | 0.223 | 1.000 | 1.000 | 0.398 | FLD | 0.238 | 1.000 | 1.000 | 0.399 |
| MKX | 0.211 | 1.211 | 0.826 | 0.329 | MKX | 0.229 | 1.229 | 0.813 | 0.325 |
| FLD | 0.205 | 1.205 | 0.685 | 0.273 | SPM | 0.176 | 1.176 | 0.692 | 0.276 |
Table A5.
Relation matrix.
Table A5.
Relation matrix.
| FLD | MKX | SPM | TPC | |
|---|---|---|---|---|
| FLD | 0.351 | 0.299 | 0.351 | |
| MKX | 0.327 | 0.400 | 0.273 | |
| SPM | 0.273 | 0.329 | 0.398 | |
| TPC | 0.399 | 0.325 | 0.276 |
Table A6.
Stable Matrix.
Table A6.
Stable Matrix.
| FLD | MKX | SPM | TPC | |
|---|---|---|---|---|
| FLD | 0.250 | 0.250 | 0.250 | 0.250 |
| MKX | 0.251 | 0.251 | 0.251 | 0.251 |
| SPM | 0.245 | 0.245 | 0.245 | 0.245 |
| TPC | 0.254 | 0.254 | 0.254 | 0.254 |
Table A7.
Linguistic evaluations of economies.
Table A7.
Linguistic evaluations of economies.
| Decision Maker 1 | ||||||||
|---|---|---|---|---|---|---|---|---|
| FLD | MKX | SPM | TPC | |||||
| Positive Degrees | Negative Degrees | Positive Degrees | Negative Degrees | Positive Degrees | Negative Degrees | Positive Degrees | Negative Degrees | |
| RSI | B | P | P | F | G | W | B | G |
| BRI | G | F | F | W | B | G | P | F |
| INI | B | W | B | G | P | F | G | W |
| CIN | B | F | P | W | G | G | B | W |
| TKE | B | W | G | W | B | G | P | G |
| ION | G | W | B | G | P | W | G | G |
| MIO | B | P | B | F | P | W | B | W |
| Decision Maker 2 | ||||||||
| FLD | MKX | SPM | TPC | |||||
| Positive Degrees | Negative Degrees | Positive Degrees | Negative Degrees | Positive Degrees | Negative Degrees | Positive Degrees | Negative Degrees | |
| RSI | F | P | P | F | G | W | F | B |
| BRI | G | B | F | W | B | G | P | F |
| INI | F | W | B | B | P | B | G | W |
| CIN | G | F | B | W | G | G | B | W |
| TKE | B | B | G | W | B | G | P | B |
| ION | G | W | B | B | P | W | G | G |
| MIO | F | B | B | F | P | B | F | W |
| Decision Maker 3 | ||||||||
| FLD | MKX | SPM | TPC | |||||
| Positive Degrees | Negative Degrees | Positive Degrees | Negative Degrees | Positive Degrees | Negative Degrees | Positive Degrees | Negative Degrees | |
| RSI | G | P | P | F | G | W | G | P |
| BRI | G | P | B | W | B | G | G | F |
| INI | B | W | B | G | P | P | G | W |
| CIN | B | P | P | P | G | G | B | W |
| TKE | B | W | B | W | B | P | P | G |
| ION | B | W | B | P | P | W | G | G |
| MIO | B | P | B | F | B | P | B | P |
Table A8.
Average values.
Table A8.
Average values.
| FLD | MKX | SPM | TPC | |||||||||||||
|---|---|---|---|---|---|---|---|---|---|---|---|---|---|---|---|---|
| Positive Degrees | Negative Degrees | Positive Degrees | Negative Degrees | Positive Degrees | Negative Degrees | Positive Degrees | Negative Degrees | |||||||||
| μ | n | μ | n | μ | n | μ | n | μ | n | μ | n | μ | n | μ | n | |
| RSI | 0.55 | 0.34 | −0.55 | −0.34 | 0.45 | 0.28 | −0.50 | −0.31 | 0.55 | 0.34 | −0.60 | −0.37 | 0.55 | 0.34 | −0.47 | −0.29 |
| BRI | 0.55 | 0.34 | −0.48 | −0.30 | 0.53 | 0.33 | −0.60 | −0.37 | 0.60 | 0.37 | −0.45 | −0.28 | 0.48 | 0.30 | −0.50 | −0.31 |
| INI | 0.57 | 0.35 | −0.60 | −0.37 | 0.60 | 0.37 | −0.43 | −0.27 | 0.45 | 0.28 | −0.48 | −0.30 | 0.55 | 0.34 | −0.60 | −0.37 |
| CIN | 0.58 | 0.36 | −0.52 | −0.32 | 0.50 | 0.31 | −0.58 | −0.36 | 0.55 | 0.34 | −0.45 | −0.28 | 0.60 | 0.37 | −0.60 | −0.37 |
| TKE | 0.60 | 0.37 | −0.53 | −0.33 | 0.57 | 0.35 | −0.60 | −0.37 | 0.60 | 0.37 | −0.48 | −0.30 | 0.45 | 0.28 | −0.43 | −0.27 |
| ION | 0.57 | 0.35 | −0.60 | −0.37 | 0.60 | 0.37 | −0.47 | −0.29 | 0.45 | 0.28 | −0.60 | −0.37 | 0.55 | 0.34 | −0.45 | −0.28 |
| MIO | 0.57 | 0.35 | −0.50 | −0.31 | 0.60 | 0.37 | −0.50 | −0.31 | 0.50 | 0.31 | −0.52 | −0.32 | 0.57 | 0.35 | −0.58 | −0.36 |
Table A9.
Score values.
Table A9.
Score values.
| FLD | MKX | SPM | TPC | |
|---|---|---|---|---|
| RSI | 0.254 | 0.165 | 0.292 | 0.205 |
| BRI | 0.213 | 0.281 | 0.235 | 0.182 |
| INI | 0.304 | 0.227 | 0.156 | 0.292 |
| CIN | 0.257 | 0.247 | 0.197 | 0.330 |
| TKE | 0.281 | 0.304 | 0.251 | 0.132 |
| ION | 0.304 | 0.243 | 0.235 | 0.197 |
| MIO | 0.234 | 0.260 | 0.201 | 0.291 |
Table A10.
Normalized matrix.
Table A10.
Normalized matrix.
| FLD | MKX | SPM | TPC | |
|---|---|---|---|---|
| RSI | 0.361 | 0.249 | 0.486 | 0.320 |
| BRI | 0.303 | 0.424 | 0.390 | 0.284 |
| INI | 0.432 | 0.343 | 0.259 | 0.456 |
| CIN | 0.365 | 0.373 | 0.327 | 0.516 |
| TKE | 0.399 | 0.459 | 0.418 | 0.206 |
| ION | 0.432 | 0.367 | 0.390 | 0.307 |
| MIO | 0.333 | 0.394 | 0.334 | 0.454 |
Table A11.
Weighted matrix.
Table A11.
Weighted matrix.
| FLD | MKX | SPM | TPC | |
|---|---|---|---|---|
| RSI | 0.090 | 0.063 | 0.119 | 0.081 |
| BRI | 0.076 | 0.106 | 0.096 | 0.072 |
| INI | 0.108 | 0.086 | 0.064 | 0.116 |
| CIN | 0.091 | 0.094 | 0.080 | 0.131 |
| TKE | 0.100 | 0.115 | 0.102 | 0.052 |
| ION | 0.108 | 0.092 | 0.096 | 0.078 |
| MIO | 0.083 | 0.099 | 0.082 | 0.115 |
Table A12.
Concordance and discordance interval matrixes.
Table A12.
Concordance and discordance interval matrixes.
| Concordance Matrix | Discordance Matrix | |||||||||||||
|---|---|---|---|---|---|---|---|---|---|---|---|---|---|---|
| RSI | BRI | INI | CIN | TKE | ION | MIO | RSI | BRI | INI | CIN | TKE | ION | MIO | |
| RSI | 0.000 | 0.749 | 0.245 | 0.245 | 0.499 | 0.499 | 0.495 | 0.000 | 1.000 | 0.624 | 1.000 | 1.000 | 1.000 | 1.000 |
| BRI | 0.250 | 0.000 | 0.496 | 0.496 | 0.254 | 0.496 | 0.496 | 0.534 | 0.000 | 1.000 | 1.000 | 1.000 | 1.000 | 1.000 |
| INI | 0.755 | 0.504 | 0.000 | 0.250 | 0.504 | 0.504 | 0.504 | 1.000 | 0.733 | 0.000 | 0.994 | 0.611 | 0.848 | 0.741 |
| CIN | 0.755 | 0.504 | 0.750 | 0.000 | 0.254 | 0.505 | 0.504 | 0.783 | 0.263 | 1.000 | 0.000 | 0.283 | 0.317 | 0.325 |
| TKE | 0.501 | 0.746 | 0.496 | 0.746 | 0.000 | 0.496 | 0.746 | 0.550 | 0.824 | 1.000 | 1.000 | 0.000 | 1.000 | 1.000 |
| ION | 0.501 | 0.749 | 0.746 | 0.495 | 0.504 | 0.000 | 0.495 | 0.797 | 0.449 | 1.000 | 1.000 | 0.903 | 0.000 | 1.000 |
| MIO | 0.505 | 0.504 | 0.496 | 0.496 | 0.254 | 0.505 | 0.000 | 1.000 | 0.319 | 1.000 | 1.000 | 0.326 | 0.664 | 0.000 |
Table A13.
Concordance, discordance and aggregated index matrixes.
Table A13.
Concordance, discordance and aggregated index matrixes.
| Concordance Matrix | Discordance Matrix | Aggregated Matrix | |||||||||||||||||||
|---|---|---|---|---|---|---|---|---|---|---|---|---|---|---|---|---|---|---|---|---|---|
| RSI | BRI | INI | CIN | TKE | ION | MIO | RSI | BRI | INI | CIN | TKE | ION | MIO | RSI | BRI | INI | CIN | TKE | ION | MIO | |
| RSI | 0 | 1 | 0 | 0 | 0 | 0 | 0 | 1 | 0 | 1 | 0 | 0 | 0 | 0 | 0 | 0 | 0 | 0 | 0 | 0 | 0 |
| BRI | 0 | 0 | 0 | 0 | 0 | 0 | 0 | 1 | 1 | 0 | 0 | 0 | 0 | 0 | 0 | 0 | 0 | 0 | 0 | 0 | 0 |
| INI | 1 | 0 | 0 | 0 | 0 | 0 | 0 | 0 | 1 | 1 | 0 | 1 | 0 | 1 | 0 | 0 | 0 | 0 | 0 | 0 | 0 |
| CIN | 1 | 0 | 1 | 0 | 0 | 0 | 0 | 1 | 1 | 0 | 1 | 1 | 1 | 1 | 1 | 0 | 0 | 0 | 0 | 0 | 0 |
| TKE | 0 | 1 | 0 | 1 | 0 | 0 | 1 | 1 | 0 | 0 | 0 | 1 | 0 | 0 | 0 | 0 | 0 | 0 | 0 | 0 | 0 |
| ION | 0 | 1 | 1 | 0 | 0 | 0 | 0 | 1 | 1 | 0 | 0 | 0 | 1 | 0 | 0 | 1 | 0 | 0 | 0 | 0 | 0 |
| MIO | 0 | 0 | 0 | 0 | 0 | 0 | 0 | 0 | 1 | 0 | 0 | 1 | 1 | 1 | 0 | 0 | 0 | 0 | 0 | 0 | 0 |
Table A14.
Net superior, inferior and overall values of the economies.
Table A14.
Net superior, inferior and overall values of the economies.
| Economies | Net Superior Values | Net Inferior Values | Overall Values |
|---|---|---|---|
| RSI | −0.535 | 0.961 | −1.496 |
| BRI | −1.270 | 1.946 | −3.215 |
| INI | −0.207 | −0.696 | 0.489 |
| CIN | 0.542 | −3.025 | 3.567 |
| TKE | 1.463 | 1.250 | 0.213 |
| ION | 0.488 | 0.320 | 0.168 |
| MIO | −0.483 | −0.756 | 0.273 |
References
- Caniglia, G.; Luederitz, C.; von Wirth, T.; Fazey, I.; Martin-López, B.; Hondrila, K.; König, A.; von Wehrden, H.; Schäpke, N.A.; Laubichler, M.D.; et al. A pluralistic and integrated approach to action-oriented knowledge for sustainability. Nat. Sustain. 2021, 4, 93–100. [Google Scholar] [CrossRef]
- Wintzheimer, S.; Reichstein, J.; Groppe, P.; Wolf, A.; Fett, B.; Zhou, H.; Pujales-Paradela, R.; Miller, F.; Müssig, S.; Wenderoth, S.; et al. Supraparticles for sustainability. Adv. Funct. Mater. 2021, 31, 2011089. [Google Scholar] [CrossRef]
- Müller, M.; Wolfe, S.D.; Gaffney, C.; Gogishvili, D.; Hug, M.; Leick, A. An evaluation of the sustainability of the Olympic Games. Nat. Sustain. 2021, 4, 340–348. [Google Scholar] [CrossRef]
- Ekins, P.; Zenghelis, D. The costs and benefits of environmental sustainability. Sustain. Sci. 2021, 16, 949–965. [Google Scholar] [CrossRef] [PubMed]
- Chambers, J.M.; Wyborn, C.; Ryan, M.E.; Reid, R.S.; Riechers, M.; Serban, A.; Pickering, T. Six modes of co-production for sustainability. Nat. Sustain. 2021, 4, 983–996. [Google Scholar] [CrossRef]
- Hallin, A.; Karrbom-Gustavsson, T.; Dobers, P. Transition towards and of sustainability—Understanding sustainability as performative. Bus. Strategy Environ. 2021, 30, 1948–1957. [Google Scholar] [CrossRef]
- Wolff, S.; Brönner, M.; Held, M.; Lienkamp, M. Transforming automotive companies into sustainability leaders: A concept for managing current challenges. J. Clean. Prod. 2020, 276, 124179. [Google Scholar] [CrossRef]
- Izzo, M.F.; Ciaburri, M.; Tiscini, R. The challenge of sustainable development goal reporting: The first evidence from italian listed companies. Sustainability 2020, 12, 3494. [Google Scholar] [CrossRef]
- Badia, F.; Bracci, E.; Tallaki, M. Quality and diffusion of social and sustainability reporting in Italian public utility companies. Sustainability 2020, 12, 4525. [Google Scholar] [CrossRef]
- Aureli, S.; Gigli, S.; Medei, R.; Supino, E. The value relevance of environmental, social, and governance disclosure: Evidence from Dow Jones Sustainability World Index listed companies. Corp. Soc. Responsib. Environ. Manag. 2020, 27, 43–52. [Google Scholar] [CrossRef]
- Papapicco, C.; D’Errico, F.; Mininni, G. Affective detection of ‘brain drain’through video-narrative interview. World Futur. 2021, 77, 266–284. [Google Scholar] [CrossRef]
- Nadeem, M.A.; Liu, Z.; Younis, A.; Asghar, F.; Ghani, U.; Xu, Y. How governance structure, terrorism, and internationalisation affect innovation? Evidence from Pakistan. Technol. Anal. Strateg. Manag. 2021, 33, 670–684. [Google Scholar] [CrossRef]
- Asso, P.F. New perspectives on old inequalities: Italy’s north–south divide. Territ. Politics Gov. 2021, 9, 346–364. [Google Scholar] [CrossRef]
- Defraigne, J.C. The Eurasian Economic Union and the challenge of the BRI: A comparison of their respective impacts on economic development and Russia’s regional leadership. Eurasian Geogr. Econ. 2021, 62, 659–698. [Google Scholar] [CrossRef]
- Mihai, A.; Trandafir, S.M.; Duica, L.; Mihai, A.; Lungu, C.; Pirlog, M.C. Romanian psychiatric residents’ opinions on factors that influence their decision to emigrate: A 5-year follow-up study. Asia-Pac. Psychiatry 2021, 13, e12507. [Google Scholar] [CrossRef]
- Rathi, R.; Kaswan, M.S.; Antony, J.; Cross, J.; Garza-Reyes, J.A.; Furterer, S.L. Success factors for the adoption of green lean six sigma in healthcare facility: An ISM-MICMAC study. Int. J. Lean Six Sigma 2022. ahead-of-print. [Google Scholar] [CrossRef]
- Rathi, R.; Kaswan, M.S.; Garza-Reyes, J.A.; Antony, J.; Cross, J. Green Lean Six Sigma for improving manufacturing sustainability: Framework development and validation. J. Clean. Prod. 2022, 345, 131130. [Google Scholar] [CrossRef]
- Kaswan, M.S.; Rathi, R.; Garza-Reyes, J.A.; Antony, J. Green lean six sigma sustainability–oriented project selection and implementation framework for manufacturing industry. Int. J. Lean Six Sigma 2022. ahead-of-print. [Google Scholar] [CrossRef]
- Kaswan, M.S.; Rathi, R.; Reyes, J.A.G.; Antony, J. Exploration and investigation of green lean six sigma adoption barriers for manufacturing sustainability. IEEE Trans. Eng. Manag. 2021, 99, 1–15. [Google Scholar] [CrossRef]
- Mohan, J.; Rathi, R.; Kaswan, M.S.; Nain, S.S. Green lean six sigma journey: Conceptualization and realization. Mater. Today Proc. 2022, 50, 1991–1998. [Google Scholar] [CrossRef]
- Yang, Q.; Du, Q.; Razzaq, A.; Shang, Y. How volatility in green financing, clean energy, and green economic practices derive sustainable performance through ESG indicators? A sectoral study of G7 countries. Resour. Policy 2022, 75, 102526. [Google Scholar] [CrossRef]
- Zhang, K.Q.; Tang, L.Z.; Chen, H.H. The impacts of environmental performance and development of financing decisions on economic sustainable performance: From the view of renewable and clean energy industry. Clean Technol. Environ. Policy 2021, 23, 1807–1819. [Google Scholar] [CrossRef]
- Mukoro, V.; Sharmina, M.; Gallego-Schmid, A. A review of business models for access to affordable and clean energy in Africa: Do they deliver social, economic, and environmental value? Energy Res. Soc. Sci. 2022, 88, 102530. [Google Scholar] [CrossRef]
- Madaleno, M.; Dogan, E.; Taskin, D. A step forward on sustainability: The nexus of environmental responsibility, green technology, clean energy and green finance. Energy Econ. 2022, 109, 105945. [Google Scholar] [CrossRef]
- Javid, I.; Chauhan, A.; Thappa, S.; Verma, S.K.; Anand, Y.; Sawhney, A.; Anand, S. Futuristic decentralized clean energy networks in view of inclusive-economic growth and sustainable society. J. Clean. Prod. 2021, 309, 127304. [Google Scholar] [CrossRef]
- Malhotra, A.; Mathur, A.; Diddi, S.; Sagar, A.D. Building institutional capacity for addressing climate and sustainable development goals: Achieving energy efficiency in India. Clim. Policy 2021, 22, 652–670. [Google Scholar] [CrossRef]
- Karakosta, C.; Mylona, Z.; Karásek, J.; Papapostolou, A.; Geiseler, E. Tackling COVID-19 crisis through energy efficiency investments: Decision support tools for economic recovery. Energy Strategy Rev. 2021, 38, 100764. [Google Scholar] [CrossRef]
- Rubio, F.; Llopis-Albert, C.; Valero, F. Multi-objective optimization of costs and energy efficiency associated with autonomous industrial processes for sustainable growth. Technol. Forecast. Soc. Change 2021, 173, 121115. [Google Scholar] [CrossRef]
- Soleimani, H.; Chhetri, P.; Fathollahi-Fard, A.M.; Mirzapour Al-e-Hashem, S.M.J.; Shahparvari, S. Sustainable closed-loop supply chain with energy efficiency: Lagrangian relaxation, reformulations and heuristics. Ann. Oper. Res. 2022, 318, 531–556. [Google Scholar] [CrossRef]
- Moerkerken, A.; Duijndam, S.; Blasch, J.; van Beukering, P.; Smit, A. Determinants of energy efficiency in the Dutch dairy sector: Dilemmas for sustainability. J. Clean. Prod. 2021, 293, 126095. [Google Scholar] [CrossRef]
- Ermakova, M.N. Social Factors of Sustainable Development of the Company: Key Indicators. In Complex Systems: Innovation and Sustainability in the Digital Age; Springer: Cham, Switzerland, 2021; pp. 161–168. [Google Scholar]
- Yüksel, S.; Dinçer, H.; Çağlayan, Ç.; Uluer, G.S. Strategy development to improve the business performance of nuclear energy companies. In Management Strategies to Survive in a Competitive Environment; Springer: Cham, Switzerland, 2021; pp. 33–46. [Google Scholar]
- Kuzior, A.; Kwilinski, A.; Hroznyi, I. The Factorial-Reflexive Approach to Diagnosing the Executors’ and Contractors’ Attitude to Achieving the Objectives by Energy Supplying Companies. Energies 2021, 14, 2572. [Google Scholar] [CrossRef]
- Vaisman, E.D.; Podshivalova, M.V.; Alola, A.A. Examining the interaction of sustainable innovation activity and the life cycle of small high-tech enterprises. Bus. Strategy Environ. 2022, 31, 1018–1029. [Google Scholar] [CrossRef]
- Kayacık, M.; Dinçer, H.; Yüksel, S. Using quantum spherical fuzzy decision support system as a novel sustainability index approach for analyzing industries listed in the stock exchange. Borsa Istanb. Rev. 2022, 1–13. [Google Scholar] [CrossRef]
- Kafka, K.I.; Dinçer, H.; Yüksel, S. Impact-Relation Map of Innovative Service Development Regarding the Sustainable Growth for Emerging Markets. J. Knowl. Econ. 2022, 1–24. [Google Scholar] [CrossRef]
- Thissen, F.; Fortuijn, J.D.; Strijker, D.; Haartsen, T. Migration intentions of rural youth in the Westhoek, Flanders, Belgium and the Veenkoloniën, The Netherlands. J. Rural. Stud. 2010, 26, 428–436. [Google Scholar] [CrossRef]
- Stukalina, Y.; Roskosa, A.; Pavlyuk, D. Investigating students’ migration decisions in the frame of career management in higher education institutions of Latvia. Int. J. Educ. Manag. 2018, 32, 416–430. [Google Scholar] [CrossRef]
- Yousuf, W.; Kazmi, S.M.R.; Quraeshi, S.; Khan, M. Motivation and Future Intentions of Dental Students in Karachi, Pakistan. Pak. J. Med. Res. 2019, 58, 26. [Google Scholar]
- Fong, T.; Hasan, Z. Factors Contributing Brain Drain In Malaysia. Int. J. Educ. Learn. Train. 2017, 2, 14–31. [Google Scholar]
- Chandar, H.; Jauhar, J.; Ghani, A.B.A. Postgraduates’ perception about the causes of brain drain among Malaysian professionals. Probl. Perspect. Manag. 2015, 13, 365–370. [Google Scholar]
- Wahab, M.A. The occurrence of brain drain in Malaysia: Perceptions on to work or not to work overseas in the future. J. Emerg. Trends Econ. Manag. Sci. 2014, 5, 480–489. [Google Scholar]
- Nghia, T.L.H. Motivations for Studying Abroad and Immigration Intentions. J. Int. Stud. 2019, 9, 758–776. [Google Scholar] [CrossRef]
- Foo, G. Quantifying the Malaysian brain drain and an investigation of its key determinants. Malays. J. Econ. Stud. 2017, 48, 93–116. [Google Scholar]
- Asenikova, V.; Ignatova, E.; Sarkizova, P.; Westerdorf, D.D.; Eger, S.A.; Breidung, A.N.; Radeva, N. Intentions for mobility of the next health workforce generation (comparative study among Bulgarian and German students in the Medical university of Varna). Scr. Sci. Salut. Publicae 2017, 3, 19–22. [Google Scholar] [CrossRef][Green Version]
- Labrianidis, L.; Sykas, T. Why high school students aspire to emigrate: Evidence from Greece. J. Int. Migr. Integr. 2017, 18, 107–130. [Google Scholar] [CrossRef]
- Méndez, L. So Dissatisfied to Leave? The Role of Perceptions, Expectations and Beliefs on Youths’ Intention to Migrate: Evidence from a Developing Country. J. Happiness Stud. 2020, 21, 2981–3006. [Google Scholar] [CrossRef]
- Aytac, S.; Aydin, G.C. Analysis of the Effects of Pull and Push Factors on Brain Drain: An Example of Turkey. J. Soc. Econ. Res. 2019, 6, 74–84. [Google Scholar] [CrossRef]
- Roudgar, I.; Richards, C. The policy challenge of the global brain drain: Addressing the dilemmas of contributing push-pull factors. Int. J. Public Policy 2015, 11, 73–85. [Google Scholar] [CrossRef]
- Torbat, A.E. The brain drain from Iran to the United States. Middle East J. 2002, 56, 272–295. [Google Scholar]
- Nghiêm-Phú, B.; Nguyễn, T.H. Impacts of perceived country image, institution image and self-image on students’ intention to study abroad: A study in Hanoi, Vietnam. J. Mark. High. Educ. 2019, 30, 1–19. [Google Scholar] [CrossRef]
- Raggl, A.K. Migration intentions in CESEE: Sociodemographic profiles of prospective emigrants and their motives for moving1. Focus Eur. Econ. Integr. 2019, Q1/19, 49–67. [Google Scholar]
- Ghulam, W.A.; Ali, W.; Ali, S.; Khan, M.M.; Khan, R.N.A.; Farooq, M. Investigating Factors Influencing Brain Drain of Citizens of Azad Kashmir Pakistan. J. Soc. Sci. Res. 2019, 5, 782–788. [Google Scholar] [CrossRef]
- Olga Orosová, O.; Kulanová, M. Push and pull factors of emigration plans among Slovak university students. In Emigration Intentions and Risk Behaviour among University Students; Pavol Jozef Šafárik University: Košice, Slovakia, 2017; p. 105. [Google Scholar]
- Lazari, S.; Gribincea, A. The experience of countries in diminuing the experience of brain drain. In World Economy and International Economic Relations; Russian Academy of Sciences: Moscow, Russia, 2020; Volume 3, pp. 51–60. [Google Scholar]
- Gouda, P.; Kitt, K.; Evans, D.S.; Goggin, D.; McGrath, D.; Last, J.; O’Donovan, D. Ireland’s medical brain drain: Migration intentions of Irish medical students. Hum. Resour. Health 2015, 13, 11. [Google Scholar] [CrossRef] [PubMed]
- Adovor, E.; Czaika, M.; Docquier, F.; Moullan, Y. Medical brain drain: How many, where and why? J. Health Econ. 2021, 76, 102409. [Google Scholar] [CrossRef] [PubMed]
- Munikar, S.; Thapa, K. Determinants and Aspirants of Nurse Migration from Nepal: A Cross Sectional Study from Kathmandu. Med. J. Shree Birendra Hosp. 2019, 18, 22–28. [Google Scholar] [CrossRef]
- Rizwan, M.; Rosson, N.J.; Tackett, S.; Hassoun, H.T. Globalization of Medical Education: Current Trends and Opportunities for Medical Students. J. Med. Educ. Train. 2018, 2, 1–7. [Google Scholar]
- Suciu, Ş.M.; Popescu, C.A.; Ciumageanu, M.D.; Buzoianu, A.D. Physician migration at its roots: A study on the emigration preferences and plans among medical students in Romania. Hum. Resour. Health 2017, 15, 6. [Google Scholar] [CrossRef]
- Baruch, Y.; Budhwar, P.S.; Khatri, N. Brain drain: Inclination to stay abroad after studies. J. World Bus. 2007, 42, 99–112. [Google Scholar] [CrossRef]
- Al Azmeh, Z.; Dillabough, J.; Fimyar, O.; McLaughlin, C.; Abdullateef, S.; Aloklah, W.A.; Al Mohamad Al Ibrahim, A. Cultural trauma and the politics of access to higher education in Syria. Discourse Stud. Cult. Politics Educ. 2020, 42, 528–543. [Google Scholar] [CrossRef]
- Fouarge, D.; Özer, M.N.; Seegers, P. Personality traits, migration intentions, and cultural distance. Pap. Reg. Sci. 2019, 98, 2425–2454. [Google Scholar] [CrossRef]
- Tosi, F.; Impicciatore, R.; Rettaroli, R. Individual skills and student mobility in Italy: A regional perspective. Reg. Stud. 2019, 53, 1099–1111. [Google Scholar] [CrossRef]
- Ma, K.R.; Kang, E.T.; Kwon, O.K. Migration behavior of students and graduates under prevailing regional dualism: The case of South Korea. Ann. Reg. Sci. 2017, 58, 209–233. [Google Scholar] [CrossRef]
- Siekierski, P.; Lima, M.C.; Borini, F.M. International mobility of academics: Brain drain and brain gain. Eur. Manag. Rev. 2018, 15, 329–339. [Google Scholar] [CrossRef]
- Tsui, A.P.Y.; Ngo, H.Y. Students’ perceptions of English-medium instruction in a Hong Kong university. Asian Engl. 2017, 19, 57–78. [Google Scholar] [CrossRef]
- Plopeanu, A.P.; Homocianu, D.; Florea, N.; Ghiuță, O.A.; Airinei, D. Comparative Patterns of Migration Intentions: Evidence from Eastern European Students in Economics from Romania and Republic of Moldova. Sustainability 2019, 11, 4935. [Google Scholar] [CrossRef]
- Garcia Zea, D. Brain drain in Venezuela: The scope of the human capital crisis. Hum. Resour. Dev. Int. 2020, 23, 188–195. [Google Scholar] [CrossRef]
- Gérard, M.; Sanna, A. Students’ mobility at a glance: Efficiency and fairness when brain drain and brain gain are at stake. J. Int. Mobil. 2017, 1, 43–74. [Google Scholar] [CrossRef]
- Li, W.; Sun, H. Migration intentions of Asian and African medical students educated in China: A cross-sectional study. Hum. Resour. Health 2019, 17, 88. [Google Scholar] [CrossRef]
- Atanassov, K.T. Intuitionistic fuzzy sets. In Intuitionistic Fuzzy Sets; Physica: Heidelberg, Germany, 1999; pp. 1–137. [Google Scholar]
- Yager, R.R. Pythagorean fuzzy subsets. In 2013 Joint IFSA World Congress and NAFIPS Annual Meeting (IFSA/NAFIPS); IEEE: Piscataway, NJ, USA, 2013; pp. 57–61. [Google Scholar]
- Yager, R.R. Generalized orthopair fuzzy sets. IEEE Trans. Fuzzy Syst. 2016, 25, 1222–1230. [Google Scholar] [CrossRef]
- Zhang, W.R. Bipolar fuzzy sets and relations: A computational framework for cognitive modeling and multiagent decision analysis. In NAFIPS/IFIS/NASA’94. Proceedings of the First International Joint Conference of The North American Fuzzy Information Processing Society Biannual Conference. The Industrial Fuzzy Control and Intelligent Systems Conference, and the NASA Joint Technology Workshop on Neural Networks and Fuzzy Logic; IEEE: Piscataway, NJ, USA, 1994; pp. 305–309. [Google Scholar]
- Sun, L.; Peng, J.; Dinçer, H.; Yüksel, S. Coalition-oriented strategic selection of renewable energy system alternatives using q-ROF DEMATEL with golden cut. Energy 2022, 256, 124606. [Google Scholar] [CrossRef]
- Xu, X.; Yüksel, S.; Dinçer, H. An Integrated Decision-Making Approach with Golden Cut and Bipolar q-ROFSs to Renewable Energy Storage Investments. Int. J. Fuzzy Syst. 2022, 1–14. [Google Scholar] [CrossRef]
- Keršuliene, V.; Zavadskas, E.K.; Turskis, Z. Selection of rational dispute resolution method by applying new step-wise weight assessment ratio analysis (SWARA). J. Bus. Econ. Manag. 2010, 11, 243–258. [Google Scholar] [CrossRef]
- Benayoun, R.; Roy, B.; Sussman, B. ELECTRE: Une méthode pour guider le choix en présence de points de vue multiples. Note De Trav. 1966, 49, 2–120. [Google Scholar]
- Segal, A. Africa: Frustration and Failure. In Learning by Doing; Routledge: London, UK, 2021; pp. 107–127. [Google Scholar]
- Shahebrahimi, S.; Mahdad, M.; Aliha, M.R.M.; Naeini, A.B. Transfer of Space Technologies in Iran: Drivers and Constraints of Success. Space Policy 2022, 101518. [Google Scholar] [CrossRef]
- Ajeeb, H.A. The power of push factors on academic’s brain drain in higher education system in Sudan. Tech. Soc. Sci. J. 2021, 21, 281. [Google Scholar] [CrossRef]
- Enkhtaivan, B.; Brusa, J.; Davaadorj, Z. A Gap in Brain Gain for Emerging Countries: Evidence of International Immigration on Non-Resident Patents. J. Risk Financ. Manag. 2020, 14, 7. [Google Scholar] [CrossRef]


Publisher’s Note: MDPI stays neutral with regard to jurisdictional claims in published maps and institutional affiliations. |
© 2022 by the authors. Licensee MDPI, Basel, Switzerland. This article is an open access article distributed under the terms and conditions of the Creative Commons Attribution (CC BY) license (https://creativecommons.org/licenses/by/4.0/).