Article

Intellectual Structure in Supply Chain Risk Management from 2000 to 2022: A Review Based on Text Mining Approach

1
School of Marxism, Nanjing University of Science & Technology, Nanjing 210094, China
2
Library Department, Nanjing Medical University, Nanjing 210029, China
3
China Information Technology Security Evaluation Center, Beijing 100085, China
*
Author to whom correspondence should be addressed.
Sustainability 2022, 14(23), 16245; https://doi.org/10.3390/su142316245
Submission received: 9 October 2022 / Revised: 17 November 2022 / Accepted: 28 November 2022 / Published: 5 December 2022
(This article belongs to the Section Sustainable Management)

Abstract

:
This study illustrates the intellectual structure of research in the domain of supply chain risk management (SCRM) from the year 2000 to the year 2022. This paper employs a bibliometric analysis to investigate the foundations of the discipline and a quantitative approach to uncover the evolution of research in SCRM. Firstly, CiteSpace is used to evaluate and show the intellectual structure of this sector. With its help, we establish cooperation networks of institutions and countries, networks of different terms and keywords, and cooperation relations among writers. The process involves the extraction of certain useful information, such as core terms, leading authors, and major institutions. Secondly, with the help of the latent Dirichlet allocation technology, we look at the progression of the subject matter about the management of risks associated with supply chains. The outcome of this review provides a foundation for understanding developing patterns and new changes in the industry, and it is significant for future research on supply chain risk management. Our study not only updates the review of SCRM but also illustrates the possibility to objectively review literature with the support of text mining technology, using our newly developed framework. This framework can also be easily applied to other research fields.

1. Introduction

The study focus on supply chains and operations management has changed dramatically in the past decades. The extension and globalization of supply chains reduce the visibility and complicate the control over the process. Natural disasters, social events, man-made mistakes, and IT system shutdowns also bring the chances of disrupting material flows, information flows, and cash flows of a supply chain [1]. Instead of solely focusing on increasing productivity, lowering costs, and fulfilling demand, firms nowadays are paying more attention to supply chain risk management (SCRM) in order to enhance the robustness of a supply chain and consequently sustain its development [2,3].
In addition to creating risk mitigation procedures, businesses must identify possible hazards and analyze their effect in order to manage risk in supply chains [4]. Therefore, supply chain risk management is the adoption of methods to manage both everyday and extraordinary risks along the supply chain. These strategies must be based upon constant risk assessment to minimize vulnerability and assure continuity.
Marked by a surging amount of studies in the area, the research of SCRM has emerged as a prosperous academic field over the past years. Accompanied by this booming development, some new research topics have inevitably emerged and replaced the out-of-date topics in literature. The new direction of SCRM has been significantly driven by external factors, such as research collaboration networks, information, and interdisciplinary studies, among many others [4,5].
To achieve a comprehensive analysis of SCRM research, some studies have aimed at the general discussion of SCRM and reviews of SCRM literature, such as Pournader et al. (2020), Colicchia and Strozzi (2012), and Tang and Musa (2011) [2,6,7]. These studies are mainly based on industrial observations, content analysis of literature, and, more importantly, the knowledge and subjective judgment of the authors [8,9]. However, the investigation of the intellectual structure, and, more importantly, an objective analysis of literature is particularly missing. Bibliometric analysis is considered an effective method to illustrate the state of one field of research in the past and indicate its development direction in the future [10,11,12]. For bibliometric analysis, there are studies that include primarily document similarity measurement [13], community structure detection [14], and topic extraction [15]. Moreover, important research contents are co-citation analysis [16,17], author contributions [18], and topic evolution [19,20,21].
However, there is relatively less research on bibliometric analysis in the field of SCRM; some recent studies still focus on narrow specified problems but lack a comprehensive understanding of SCRM research from a wide perspective [22,23,24]. Since bibliometric analysis has the aim of research trends, this study mainly targets the intellectual structure and topic evolution of SCRM. Researchers need to exhibit the whole structure of this field by analyzing core terms, key authors, and key and co-citation references based on selected journals. In addition, we will study emerging trends and new developments by using latent Dirichlet allocation (LDA) technology. With massive literature data, text mining approach has been implemented to answer two questions: (i) What is the intellectual structure in the literature of SCRM? (ii) What topics have been mainly studied in the past, and how have these topics dynamically changed over time? Concentrating on the two important questions, this research seeks to provide a comprehensive and systematic bibliometric analysis on SCRM and position the discussion with an operations management perspective. Specifically, the objectives of this paper are as follows:
1. Describing the nature of SCRM-related articles in terms of distribution by journals, year of publication, methodologies, and research contexts.
2. Identifying the key research domain of SCRM based on a text mining approach.
3. Concluding the research trends and suggesting future research opportunities for each research domain from an operations management perspective.
4. Observing the development of topics in different periods and the merging or dividing of different topics in SCRM research.

2. Research Design

Concentrating on the research objectives, this paper proposes the following research framework (Figure 1). Firstly, descriptive statistics are used to provide an overview of literature structure of SCRM, including the terms, keywords, authors, institutions, and countries. Valuable information is acquired based on the CiteSpace, such as core terms, key authors, important institutions, and so on. Secondly, all cited references are extracted, and we obtain the clustering of references, cooperation relations of authors, and journals with high centrality. Finally, LDA technology is used to extract topics from literature records to obtain a guideline of emerging trends and new developments. We find some interesting variations of different topics. From the above research, it is easy to learn the whole structure of supply chain risk management.

2.1. Tools and Technology

The abundant literature contains plentiful information about the organization of SCRM. Our objective is to glean valuable information behind the complex structure of a multitude of nodes and linkages. Fully grasping the organization of networks requires powerful tools that can both simplify and highlight the most important structures in these networks. In this paper, a tool named CiteSpace will be adopted to analyze the author, keywords, terms, and references, and LDA technology will be used to process the topic distribution and evolution. Generally, the term is a noun or compound word used in a specific field, the keyword is a term given by authors, and, in addition, multiple terms can form a topic in the study field [25].

2.1.1. CiteSpace

CiteSpace is used to detect and analyze the emerging terms and keywords in research, and the relationship between authors, institutions, and countries. The main features of this useful tool include performing many useful visual analyses; for example, it can provide co-cited articles analysis, co-occurring terms analysis, institution cooperation analysis, author co-citation analysis, authors cooperation analysis, and many more [25]. In addition, it can detect a burst term that relies on the frequency and trend of the words, to acquire the research frontier and changing tendency of the field. This paper will analyze the SCRM-related references in some selected journals by using CiteSpace to obtain some visual maps. With the help of maps, researchers could understand the distribution of research institutions, high-impact authors, and core literature in the field of supply chain risk.
CiteSpace creates a visual representation of the published works in the form of a co-citation network, which is based on the citations of individual articles and reveals the structure of a certain discipline. In this network, a link is created between two article nodes when a third article cites them together. The importance degree of each article is computed by the network analysis method. With this tool, conceptual clusters are formed as certain groups are repeatedly referenced in conjunction with one another. In addition, this tool uses color-coded nodes and edges to discriminate different networks, with every year in a dataset assigned to a different color. Moreover, this tool illustrates the betweenness and importance of phrases, authors, and keywords. A conceptual cluster from one time can be linked to a cluster from a different time via a node that has high betweenness centrality.

2.1.2. Latent Dirichlet Allocation

Latent Dirichlet allocation is a probabilistic Bayesian model for text content [26] that assumes each document has K topics. Each topic defines a multinomial distribution over the vocabulary, and it is assumed to have been drawn from β k ~ D i r i c h l e t ( φ ) . When the topics are given, the following generative process of each document d is conducted by LDA. Firstly, distribution of over topics θ d ~ D i r i c h l e t ( α ) will be drawn. Secondly, for each word i in d, draw a topic index z d i ϵ { 1 , 2 , , K } from the topic weights z d i ~ θ d , and observed word w d i from selected topic, w d i ~ β z d i . In addition, α and β are Dirichlet distribution parameters. The overview of LDA is shown in Figure 2.

2.2. Data Source

The data source is retrieved with the keyword “supply chain risk management” in twenty journals with a list given below in Table 1. These journals are selected to represent the field of SCRM due to their high relevance and quality. The timespan of literature is decided to range from January 2000 to September 2022. Finally, we acquire 1815 papers (literature records), which contain but are not limited to each paper’s title, authors, keywords, abstract, and references. All of them are collected via the database Web of Science. The distribution of data is as follows.

3. Bibliometric Analysis Based on CiteSpace

To illustrate the static view of topics within SCRM research, several networks are established to detect different intellectual bases via CiteSpace. Co-occurring terms analysis, institution cooperation analysis, and authors cooperation analysis will be studied, respectively.

3.1. Co-Occurring Terms and Co-Occurring Keywords Analysis

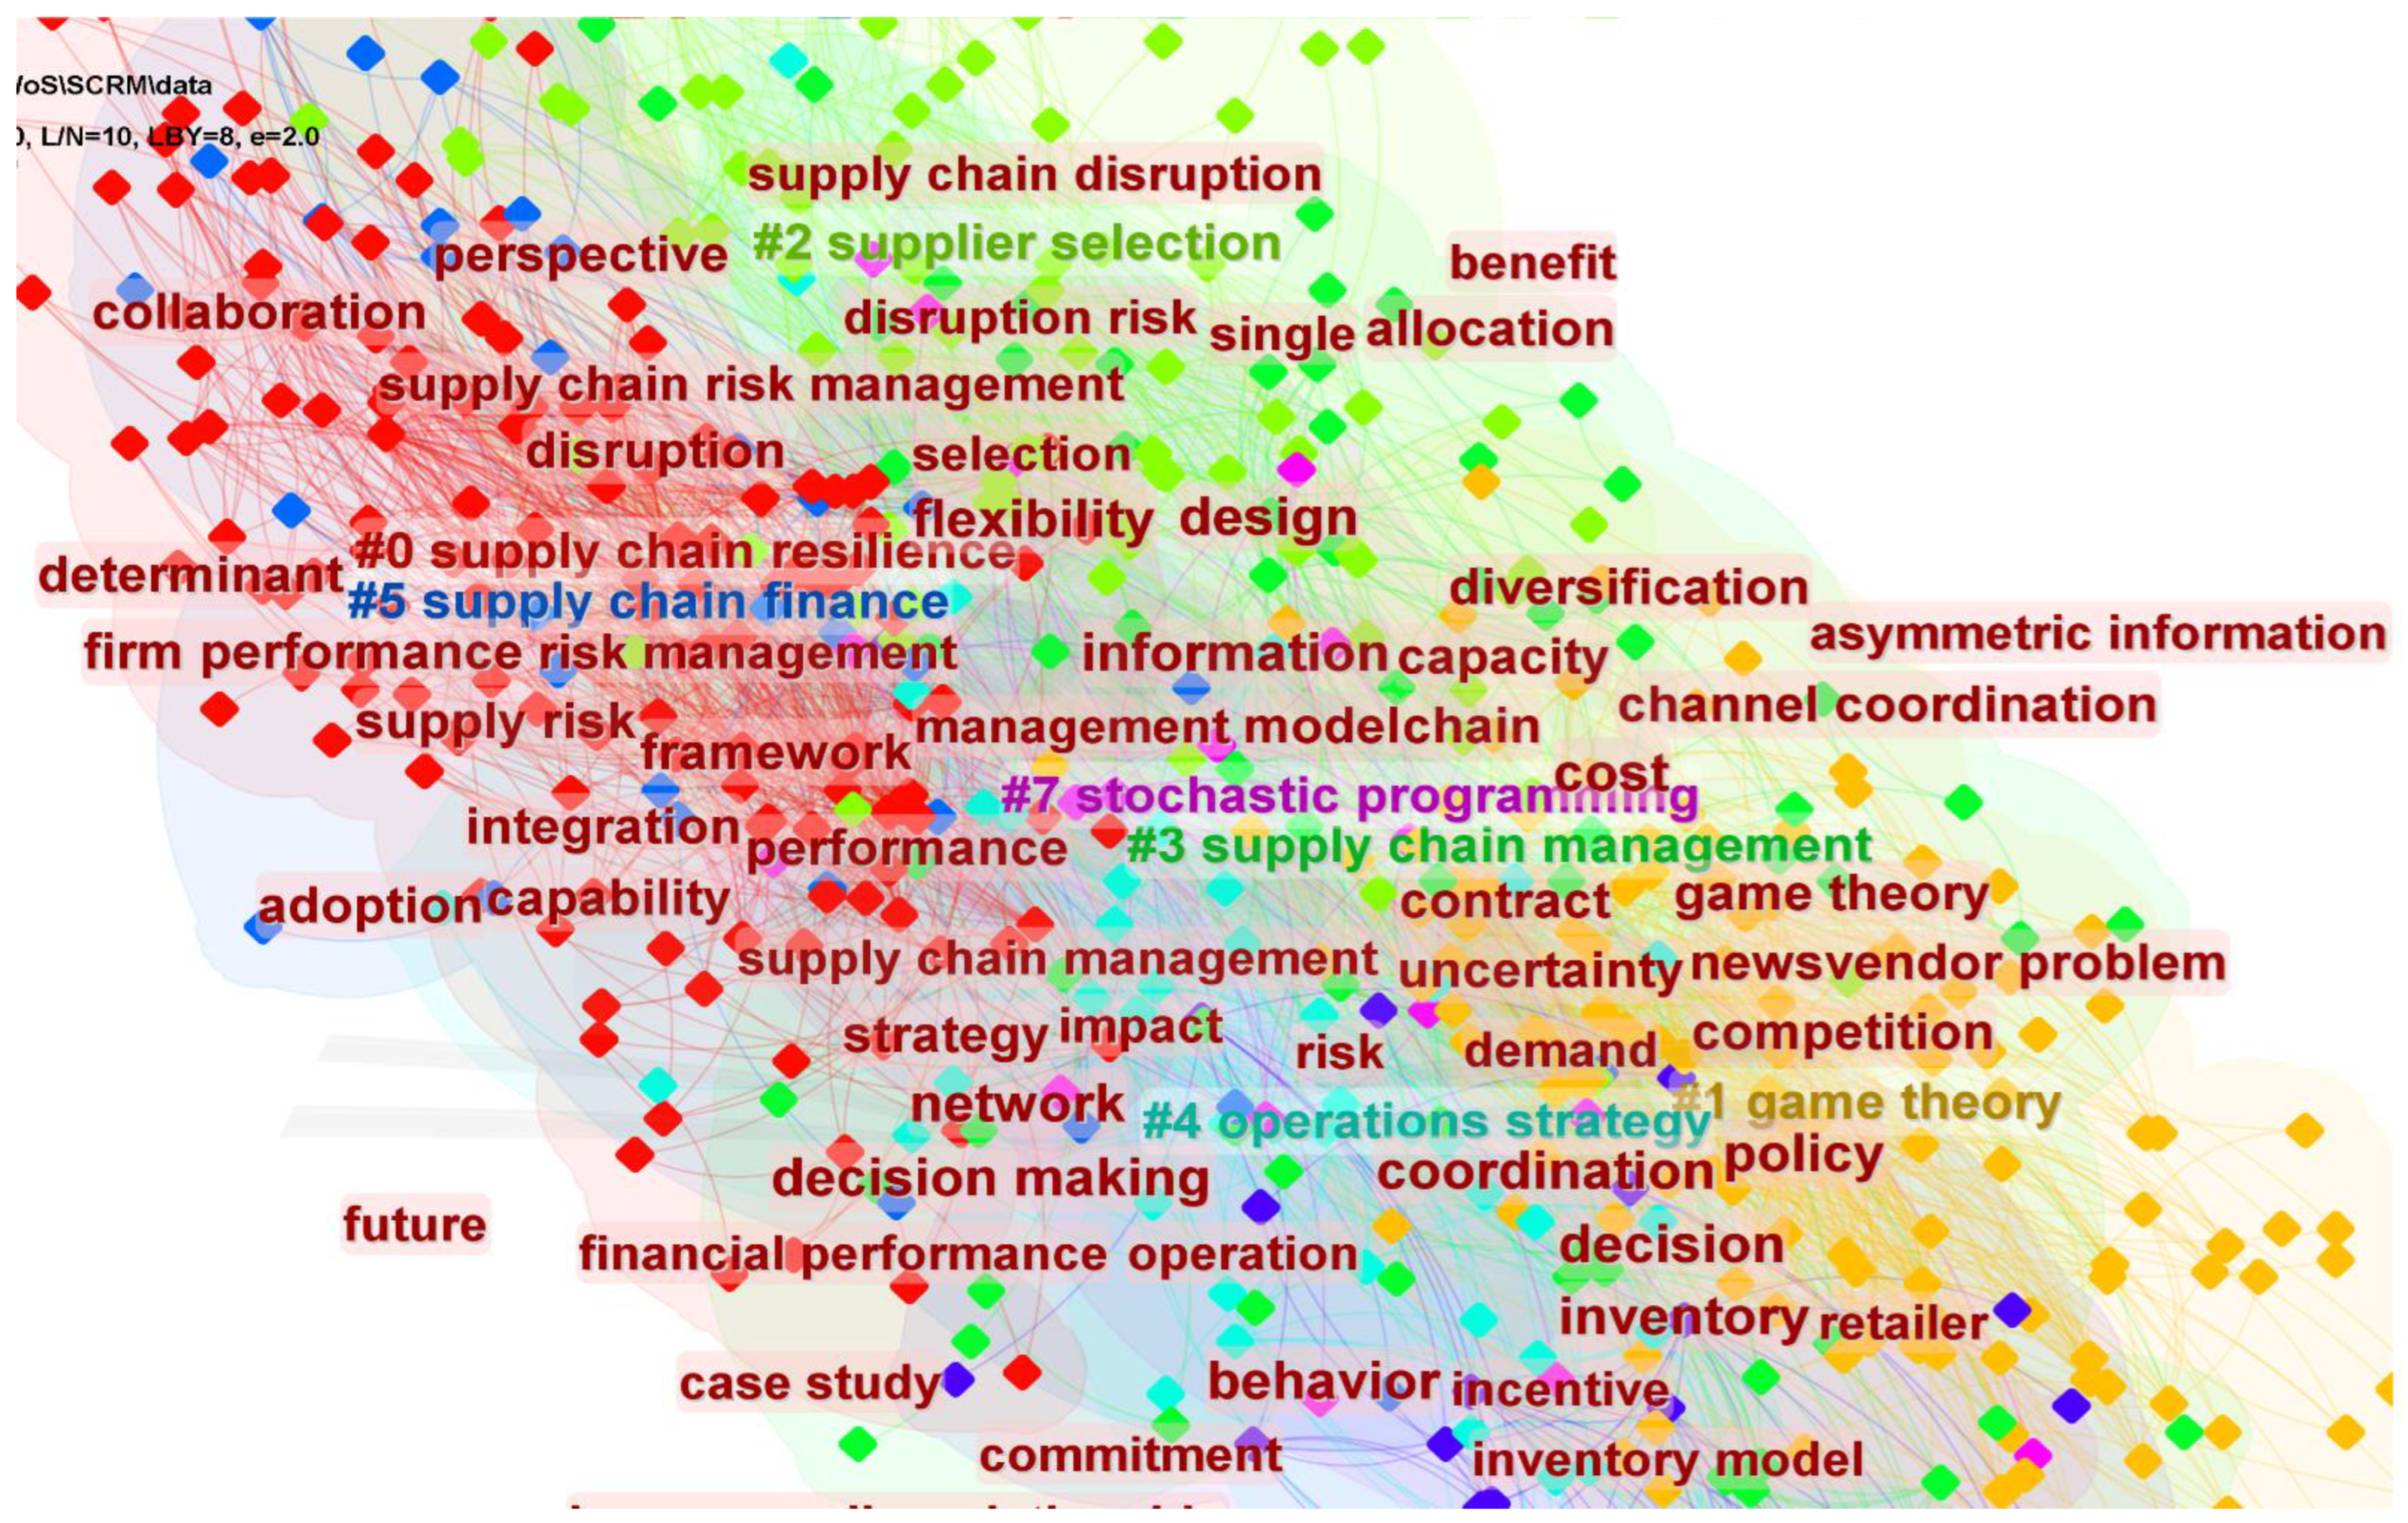
SCRM is one of the most significant operations management research fields. This study will highlight transformations in the intensity of publications in terms of changes in their terms and keywords, as well as citations, etc. Co-occurring phrases or co-occurring keywords reveal the most active areas in a discipline’s publications. Terms are extracted from all titles and abstracts and keywords. The co-occurring terms network is built and analyzed by CiteSpace. Then these terms are processed by spectral clustering, as shown in Figure 3.
In Table 2, all terms from 1815 literature records are mainly divided into 10 clusters. Cluster 0 has 61 papers and a silhouette value of 0.973. The silhouette value quantifies how identical an object is to its cluster (cohesion) relative to other clusters (separation). Cluster 0 is labeled as supply chain by the log-likelihood ratio (LLR), which is an algorithm to find the most representative words to explain a cluster according to the probability density function. Automotive, supply chain, inventory risk, advance-purchase discount contracts, allocation, and lead time variability are the selected words by the latent semantic indexing (LSI) algorithm, which is developed to use the character strings in a document to establish their relevance to the search term used. Research shows that LLR usually provides a better result in terms of uniqueness and coverage. The largest cluster is Cluster 0, with 61 members and a silhouette value of 0.973. It is labeled as supply chain and empirical investigation by LLR. Others clusters are shown in Table 2.
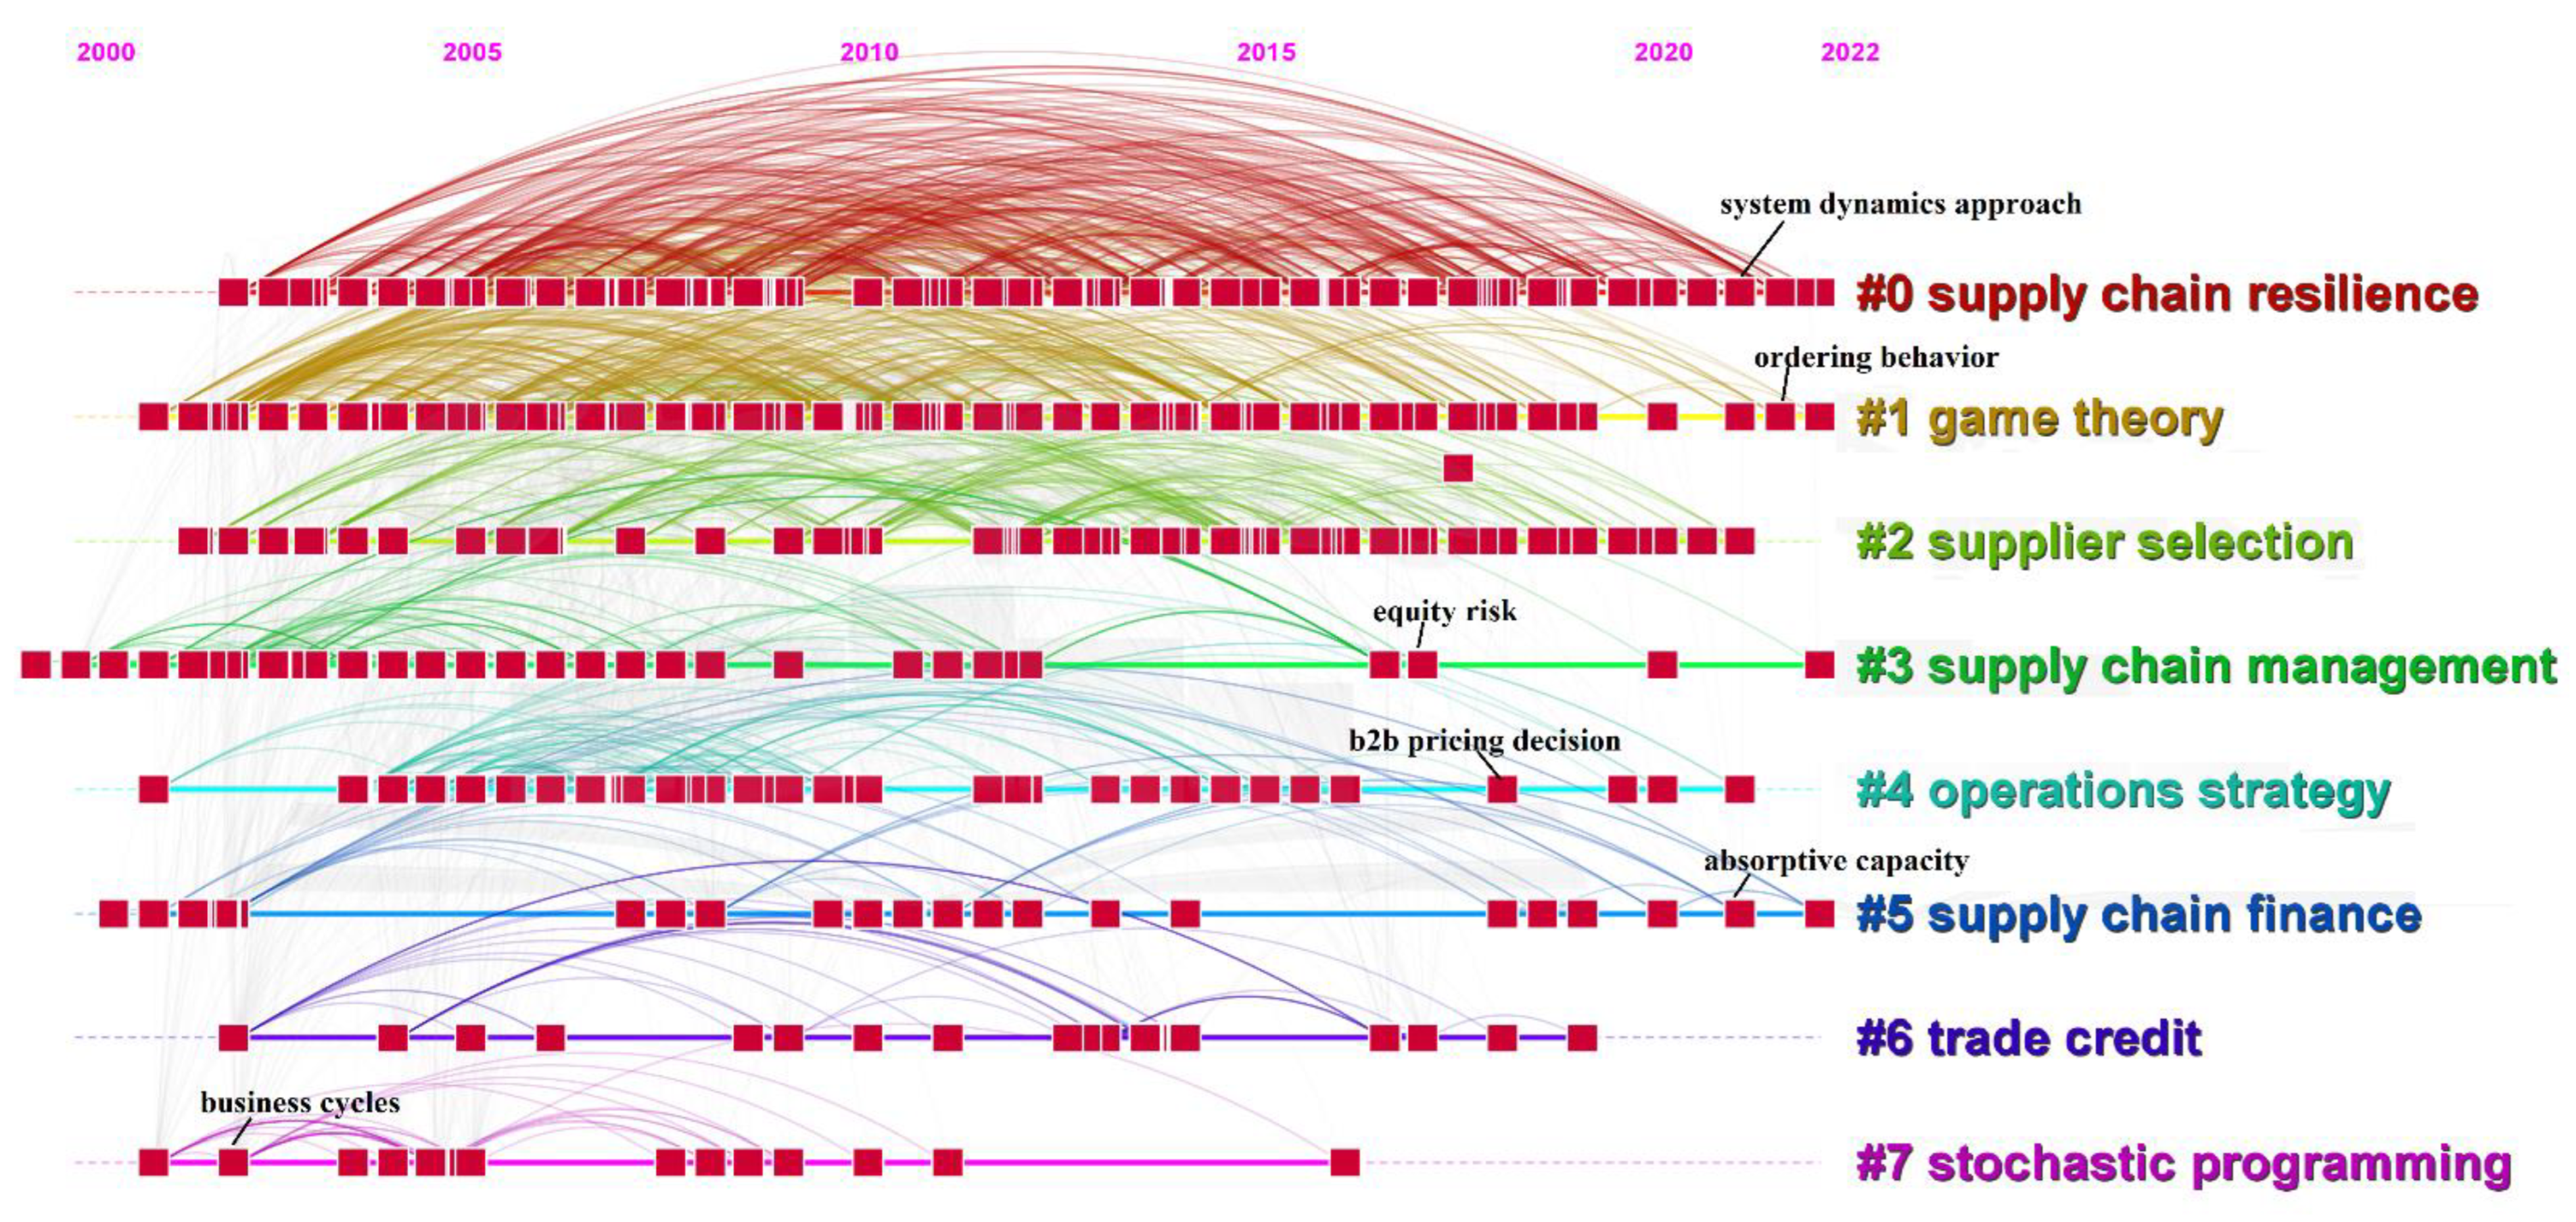
From the term list, the high-frequency terms are selected to study their development; the result is shown in Figure 4. Some terms, such as “equity risk”, “b2b pricing decision”, and “business cycles”, were widely concerned in the past but now are almost neglected. On the other hand, such terms as “ordering behavior”, “absorptive capacity”, and “system dynamics approach” are appearing more often in many papers recently. This result shows that scholars have lost interest in some traditional research topics, while the studies related to new technologies, new applications, and cross-domain integration have attracted attention, though it is apparently to obtain only raw data about the development of the terms.
In addition, we obtain core terms (Table 3). Because of the co-occurring terms, all terms can constitute a large terms network. The terms’ centrality indicates a central position by the relationship between term and term in all nodes, and these core terms belong to crucial words in the whole field.
Keywords are extracted from the keyword list of the collected literature. These are special terms that are subjectively selected by authors. The analysis result of co-occurring keywords is shown in Figure 5 and Table 4.
The top-ranked item by centrality is “supply chain” in Cluster 0, with a centrality of 0.18. The second one is “supply chain resilience” in Cluster 2, with a centrality of 0.13. The results of the clustering are shown in Table 4. In this paper, the result of the co-occurring keywords analysis is better than the co-occurring terms analysis, because the keywords are provided by authors, as the conclusion of the full text, are more representative.
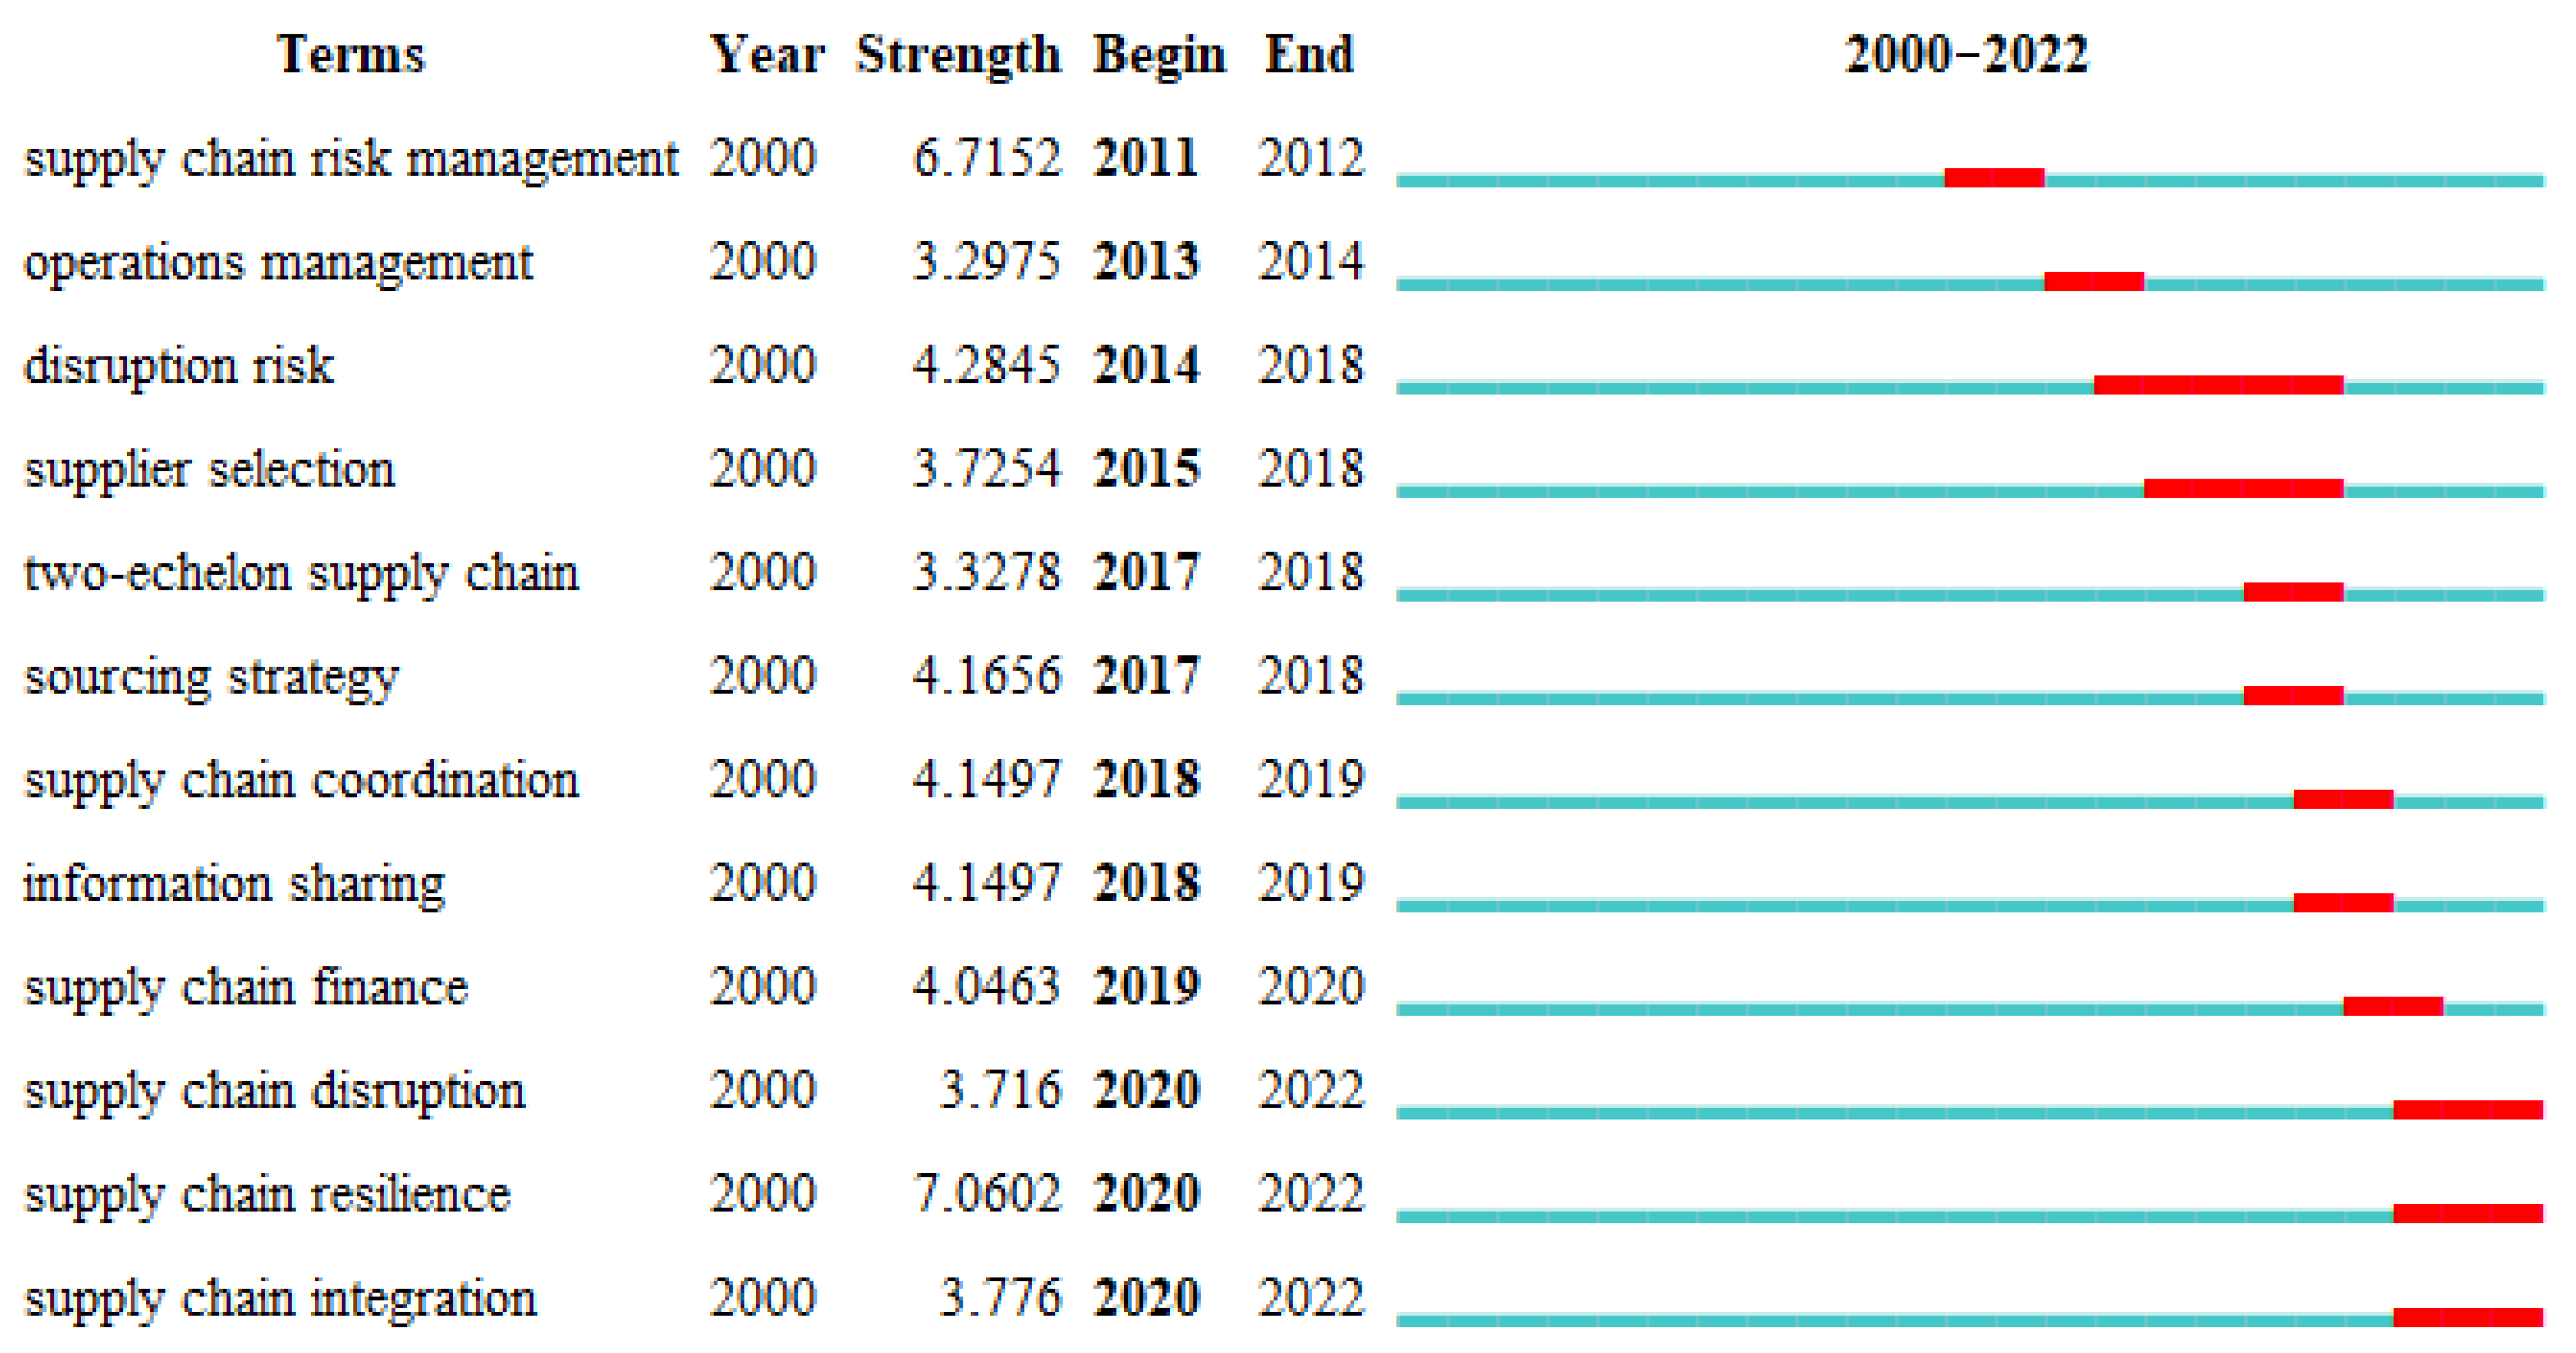
Secondly, we find some burst keywords by using burst detection. The most active research terms may be determined via burst detection, which also reveals the terms that become more prevalent with time. In CiteSpace, Burst is a detection of a burst event, which can last for multiple years as well as a single year. It provides evidence that a term is associated with a surge of research, and this term has attracted an extraordinary degree of attention. The goal of burst keywords detection is to determine whether the appearance of a keyword increases sharply with reference to other keywords. For example, if the number of articles with the keyword “internet” in their titles or abstracts sharply increased between 2009 and 2012 at a much faster rate than other keywords, then this keyword is defined as a burst word. The top nine burst keywords are shown in Figure 6.

3.2. Cooperation Analysis of Authors, Institutions, and Countries

CiteSpace can help us understand which authors, institutions, or countries are pivotal in the field of supply chain risk. The network of authors’ cooperation, institutions’ cooperation, and countries’ cooperation will be constructed, as follows.
Because the authors’ cooperation network does not form a whole structure, there is no point in computing the centrality of the authors. Therefore, we use the PageRank value to present the importance of authors instead. Google makes use of this algorithm in order to categorize webpages within their search results. It is a method for determining how significant a node is by providing an approximate estimate based on the quantity and quality of connections that go to a specific node. This approach measures the relevance of nodes. The underlying assumption is that more important websites are likely to receive more links from another node. From Figure 7 and Table 5, the top-ranked author item in twenty journals is Tsan-Ming Choi with 30 papers. The second one is Dmitry Ivanov.
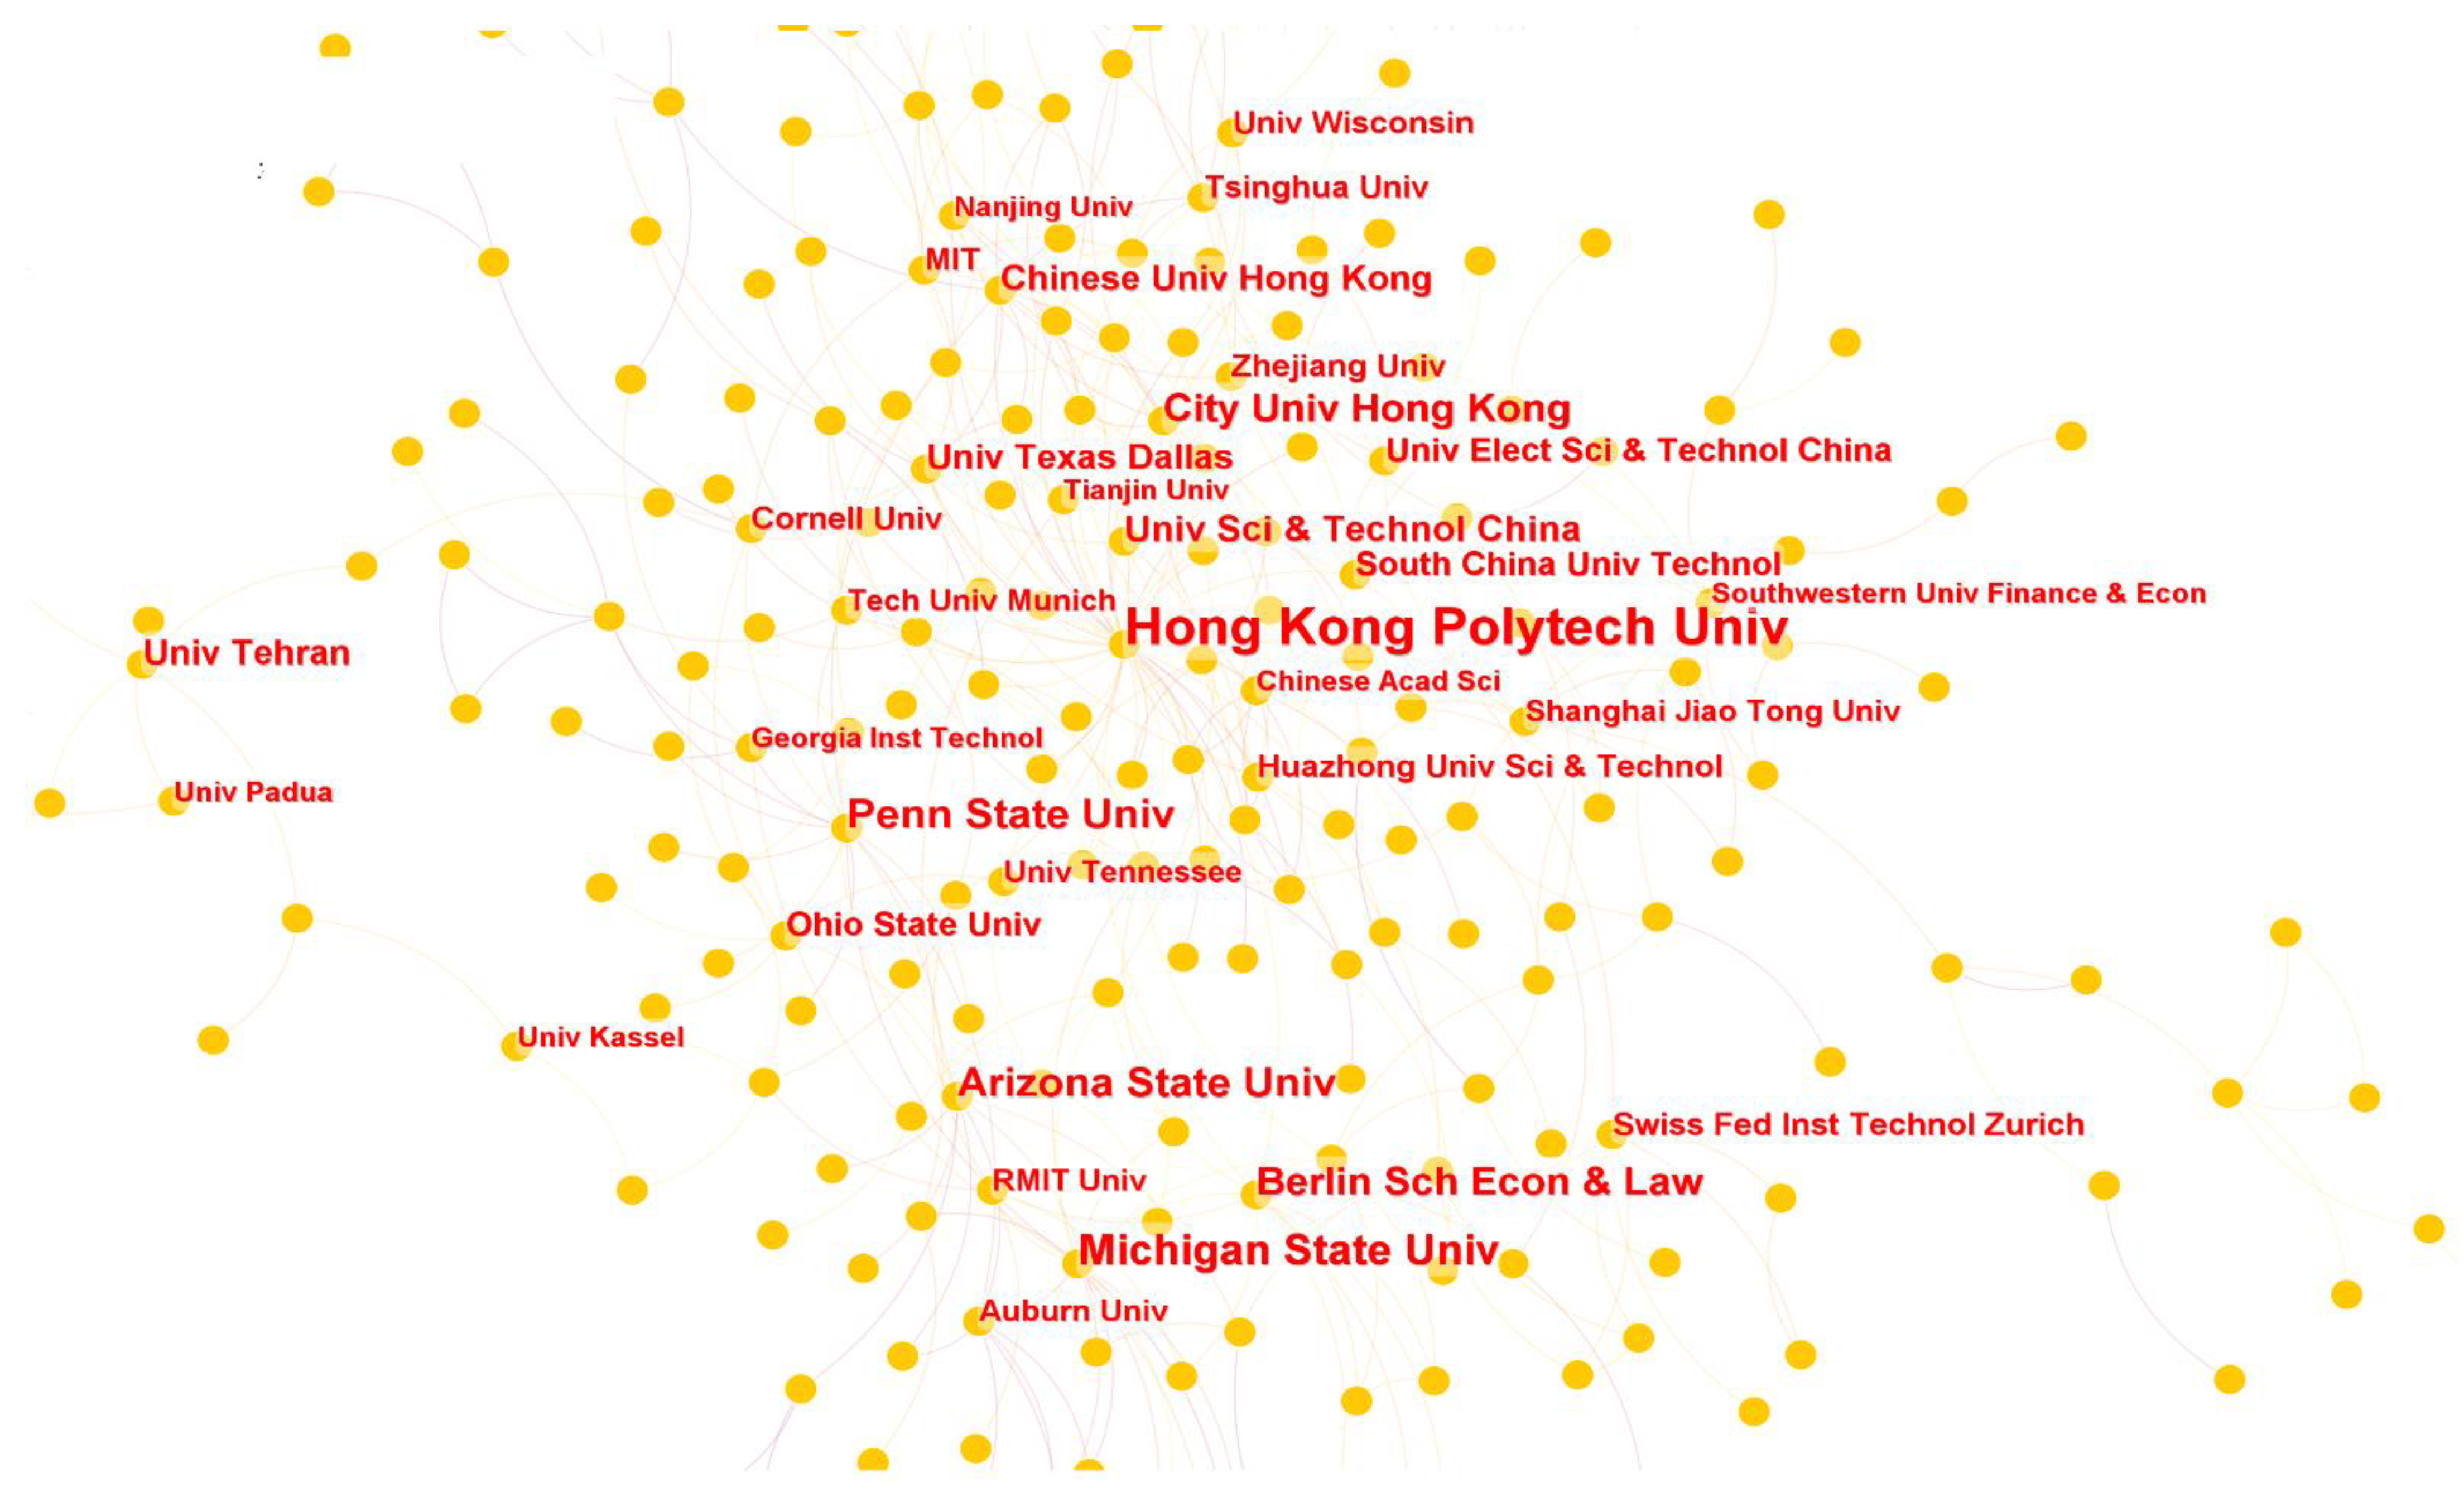
The institutions’ cooperation network is shown in Table 6 and Figure 8. Ordering by the numbers of published papers or PageRank, Hong Kong Polytech University, Michigan State University, and Penn State University occupy the top three slots.
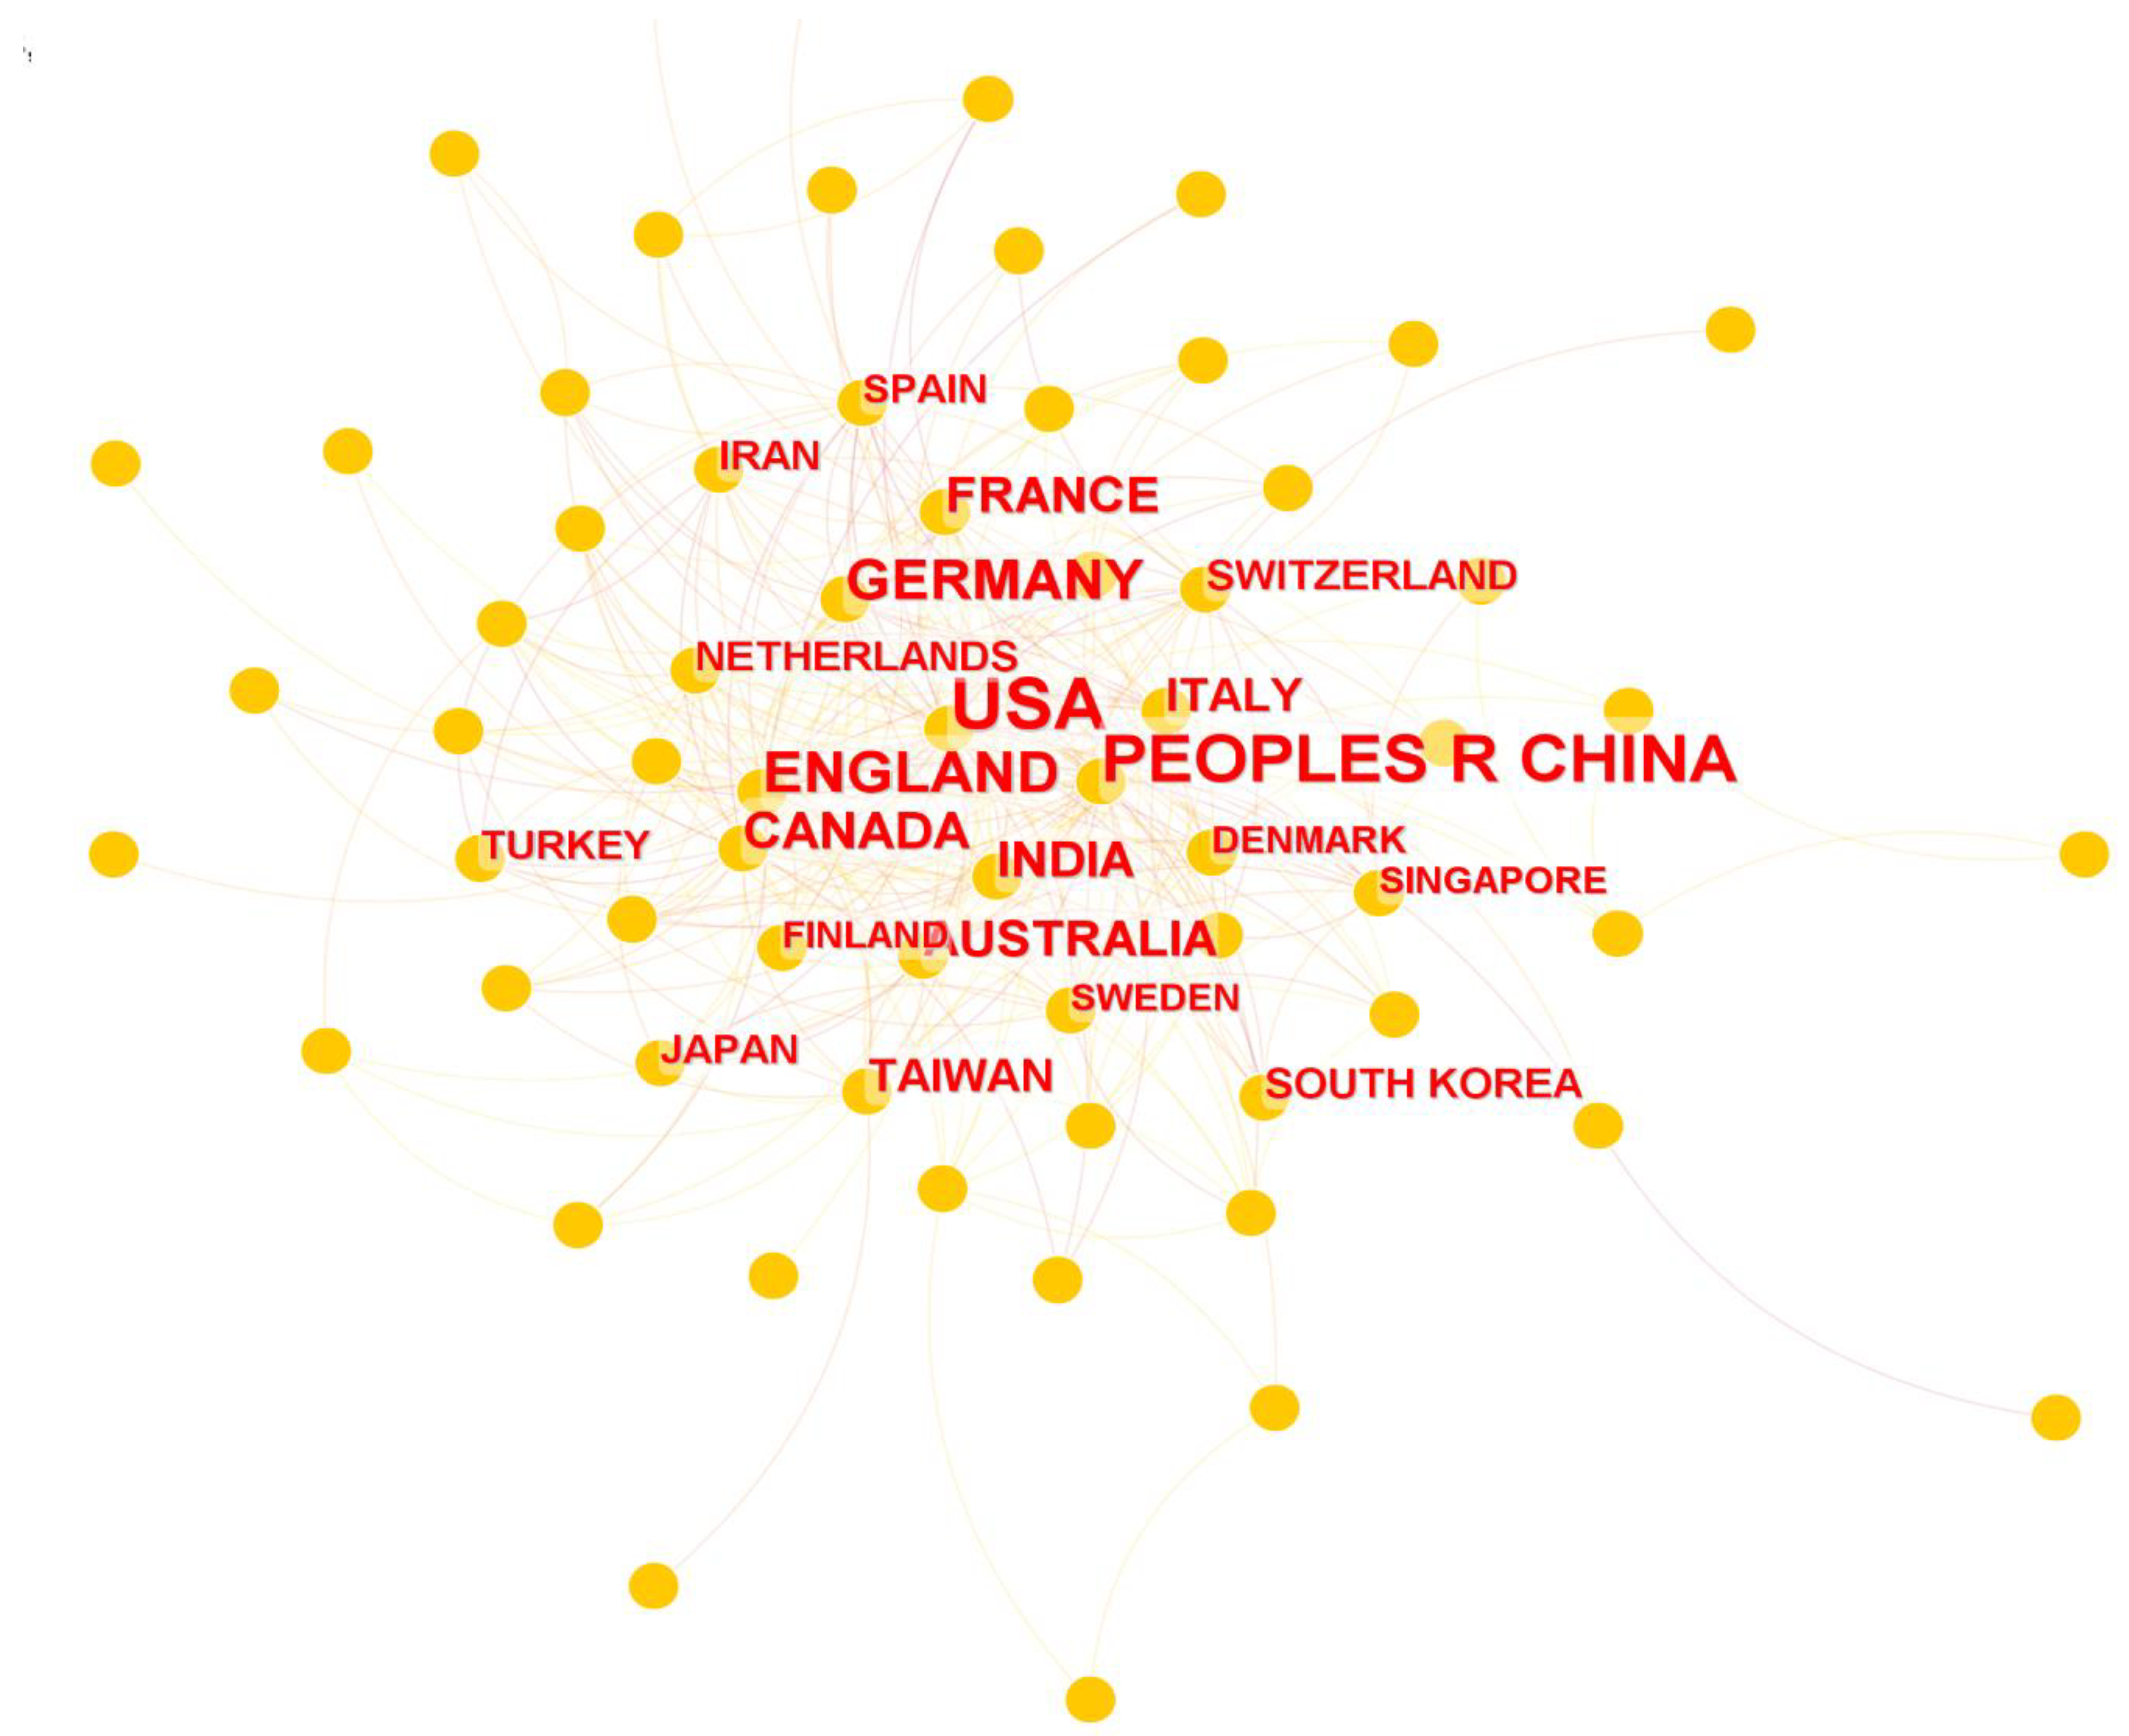
Then, we build the countries cooperation network. From Figure 9 and Table 7, the USA is first both in terms of quantity and centrality. China and England take up second and third place.

4. Cited References Analysis

4.1. Co-Cited Reference Analysis

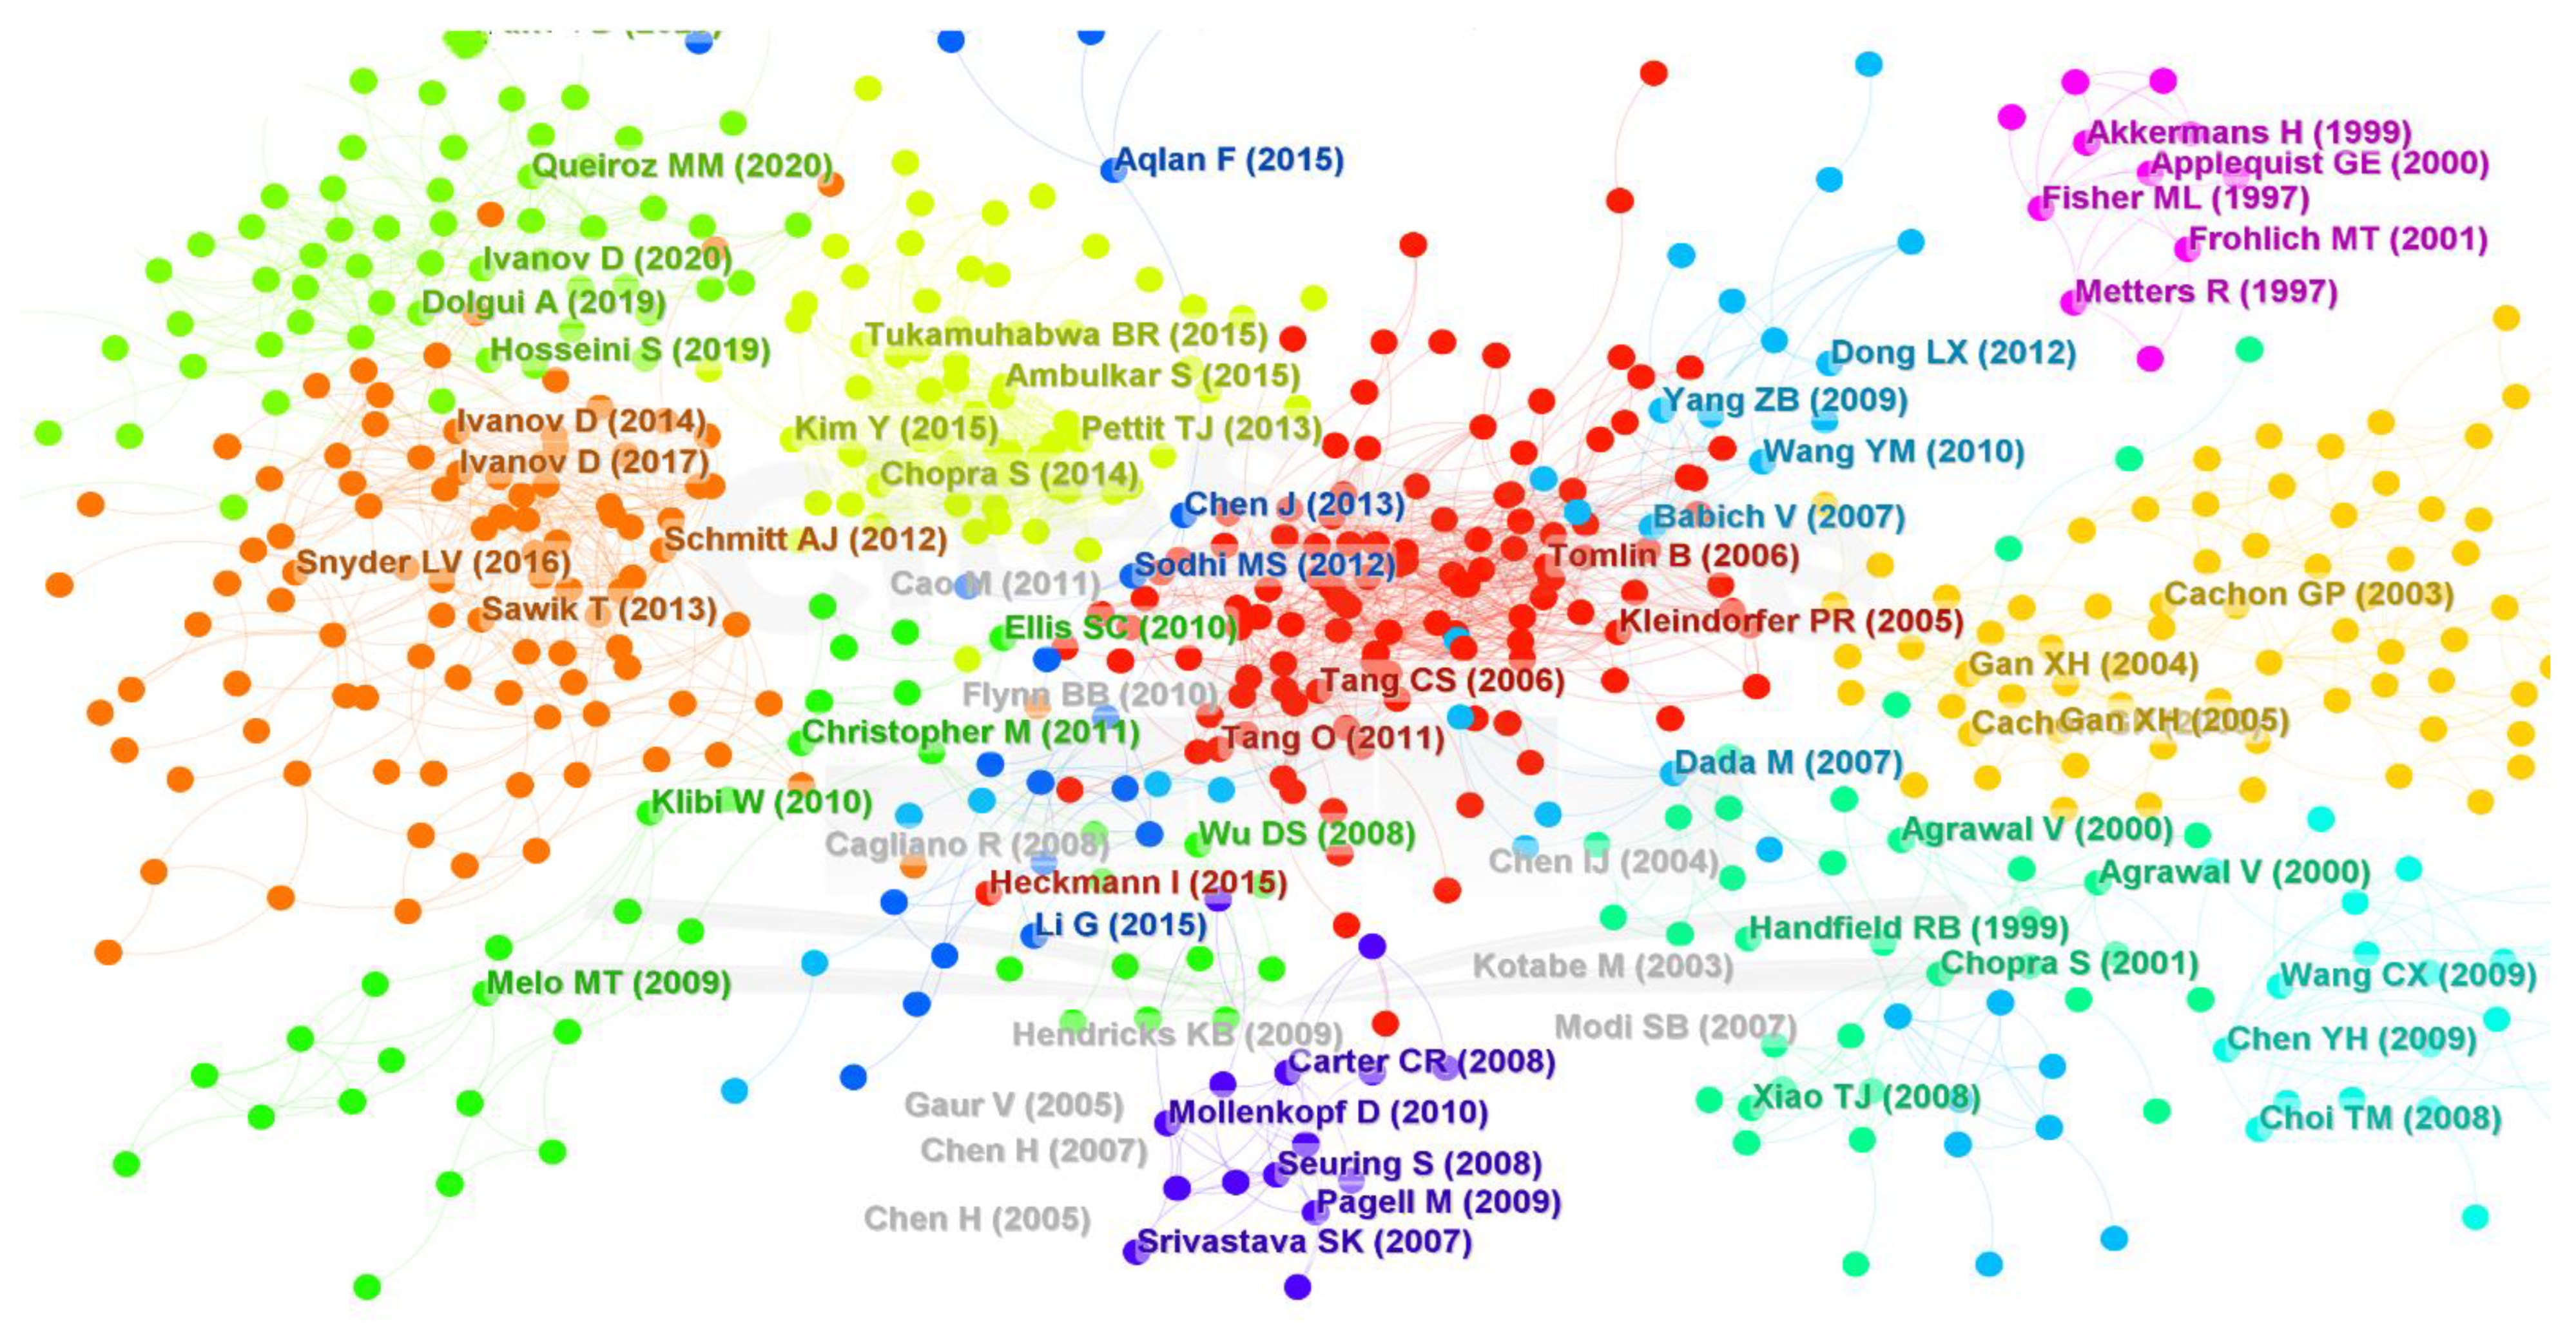
Our data include 57,451 references. Some valuable information is contained in references [27,28]. These references will be processed by CiteSpace. In the first step, the co-cited reference network is constructed in Figure 10.
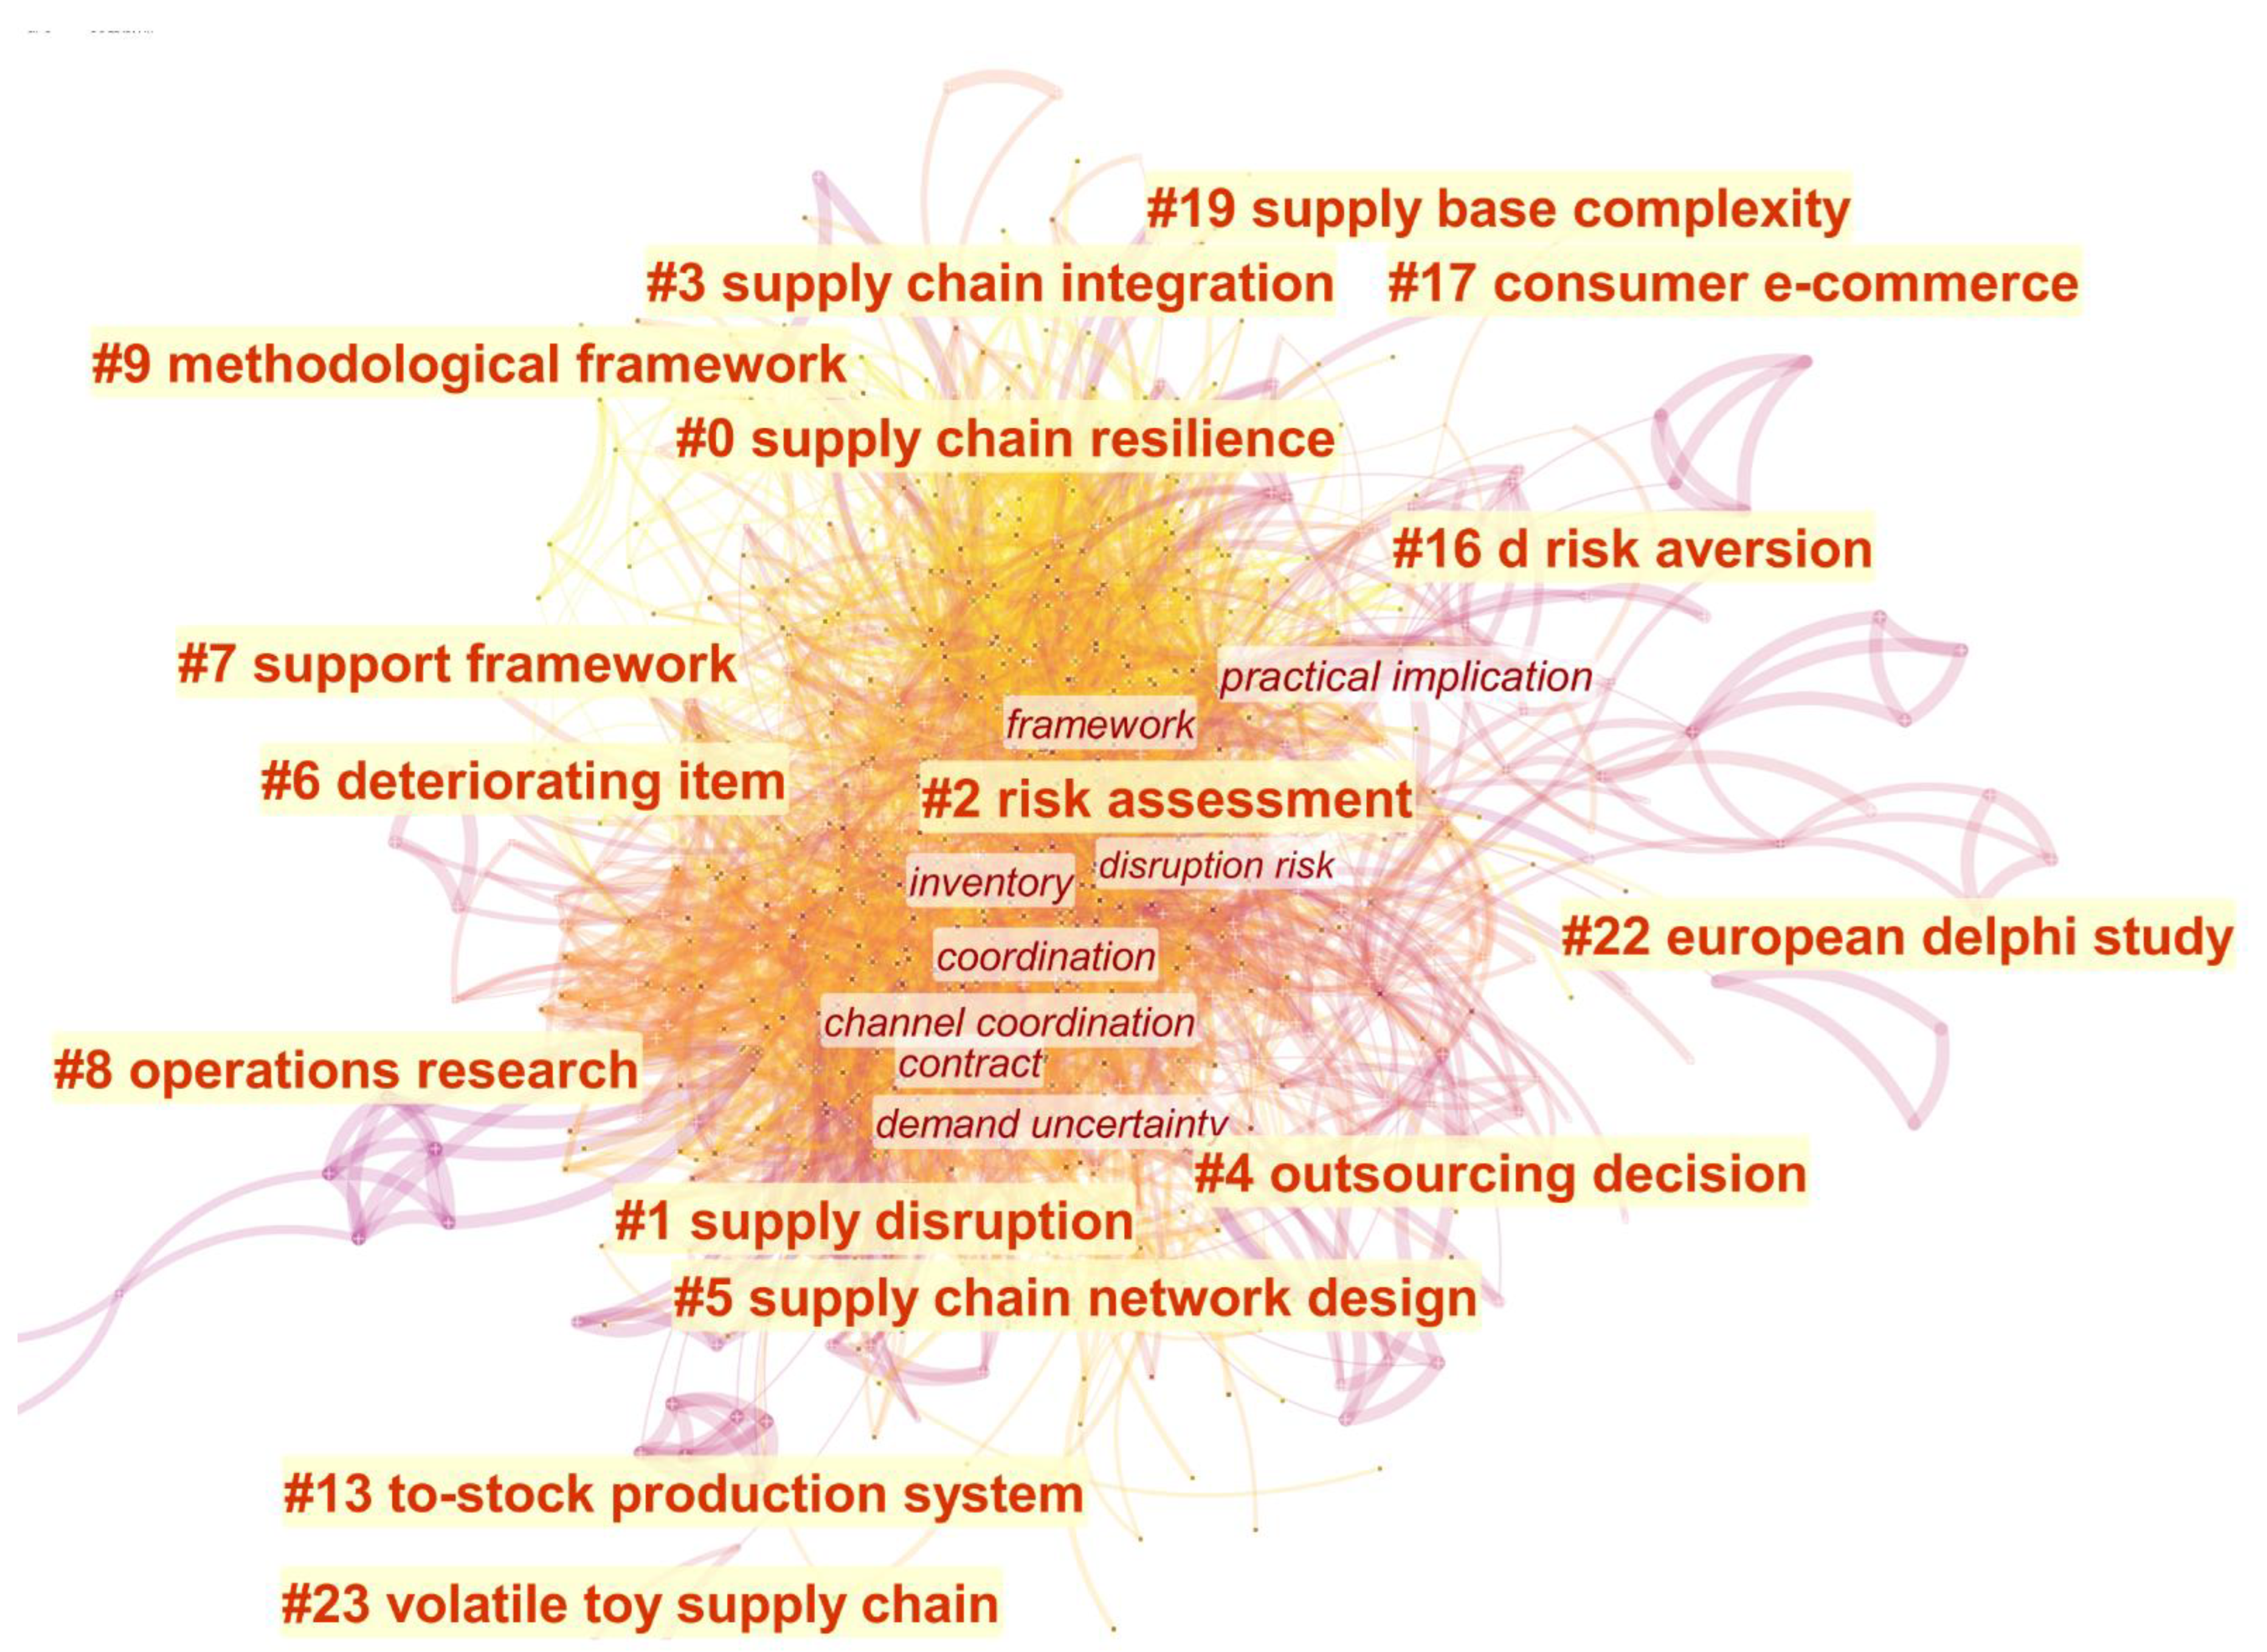
From Table 8, the top-ranked item by citation counts is the paper written by William Ho (2015) with a citation count of 100. It was published in the International Journal of Production Research. The second one is Christopher S. Tang (2006) with citation counts of 81. The third is Iris Heckmann, et al. (2015) with citation counts of 75. Next, all references will be clustered with CiteSpace, the results of which are shown in Figure 10. Because co-cited references could include most literature in the field of SCRM, the results of clustering are more decentralized. Secondly, we obtain different categories, the top 10 of which are shown in Figure 11 and Table 9.
The largest cluster, 0, has 117 papers with a silhouette value of 0.870. It is named “empirical study” by the LLR algorithm. In this cluster, the major citing article is Ghadge, A (2012), Supply chain risk management: present and future scope. The second one has 97 papers with a silhouette value of 0.919. It is labeled as disruption risk, and Dolgui, A (2020) is the major citing article.
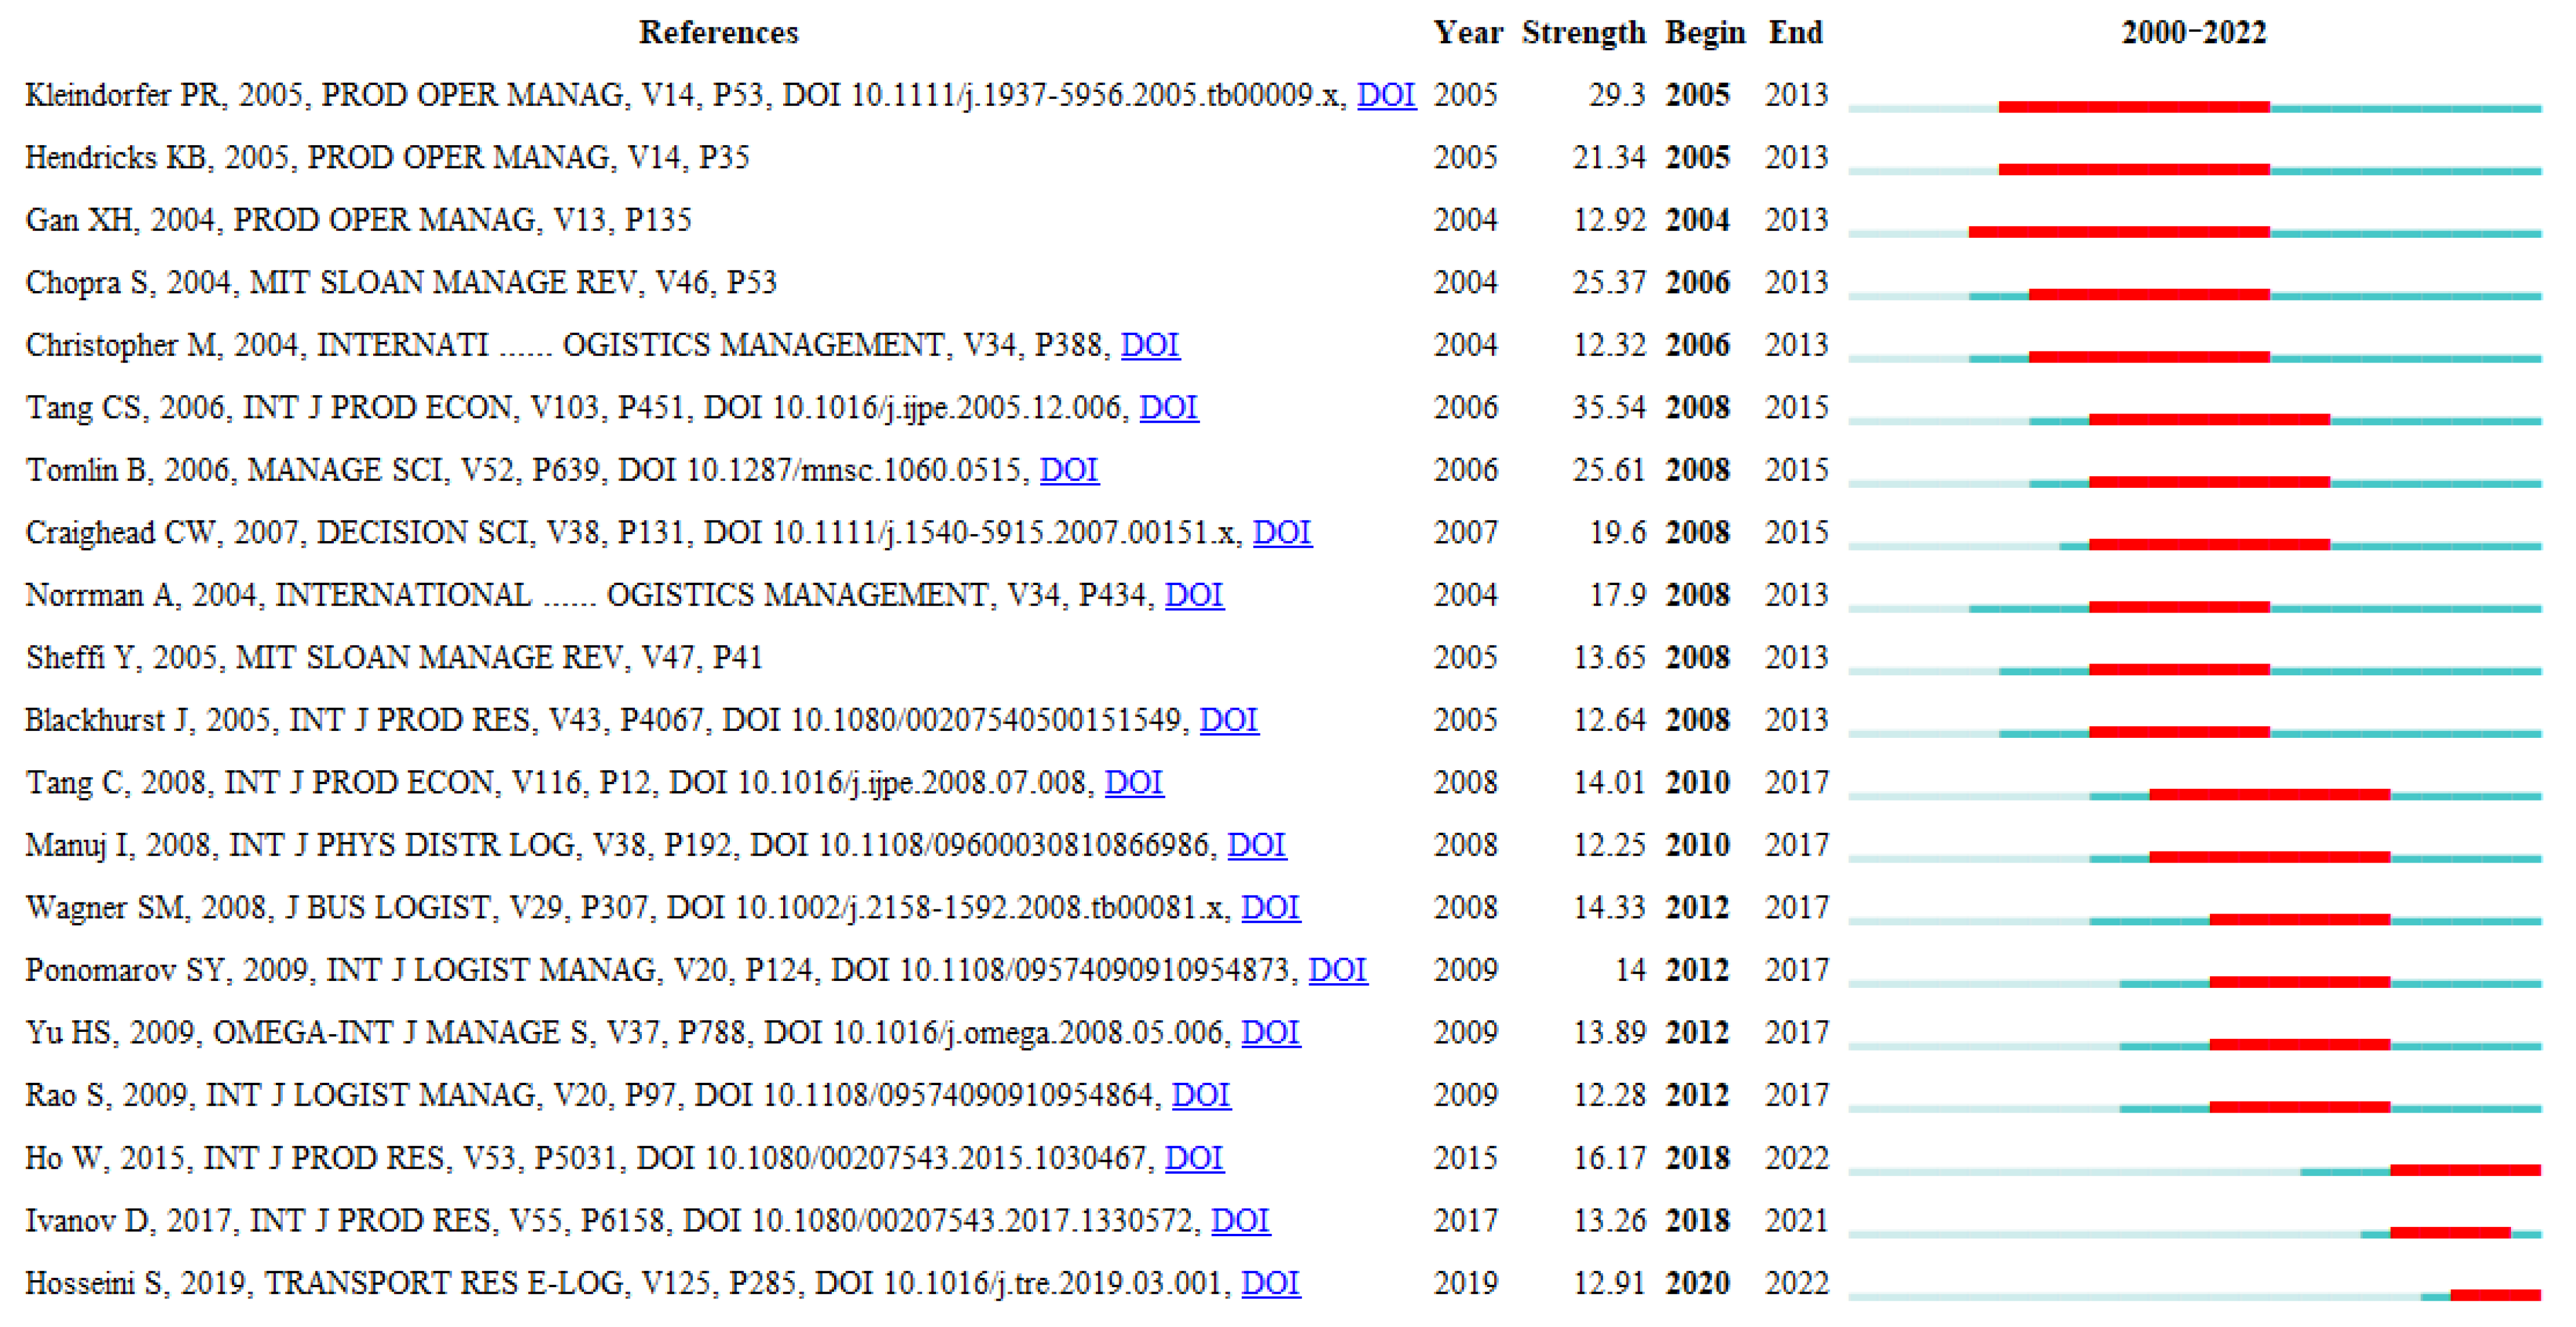
Finally, we obtain the citation burst, which is a detection of the sustainability of citation. For example, from Figure 12, we can tell that Kleindorfer and Saad (2005) have the strongest bursts among articles published between 2005 and 2013. It is also interesting to note that Hendricks KB (2005) has the second strongest citation burst from 2005 to 2013.

4.2. Co-Cited Author Analysis

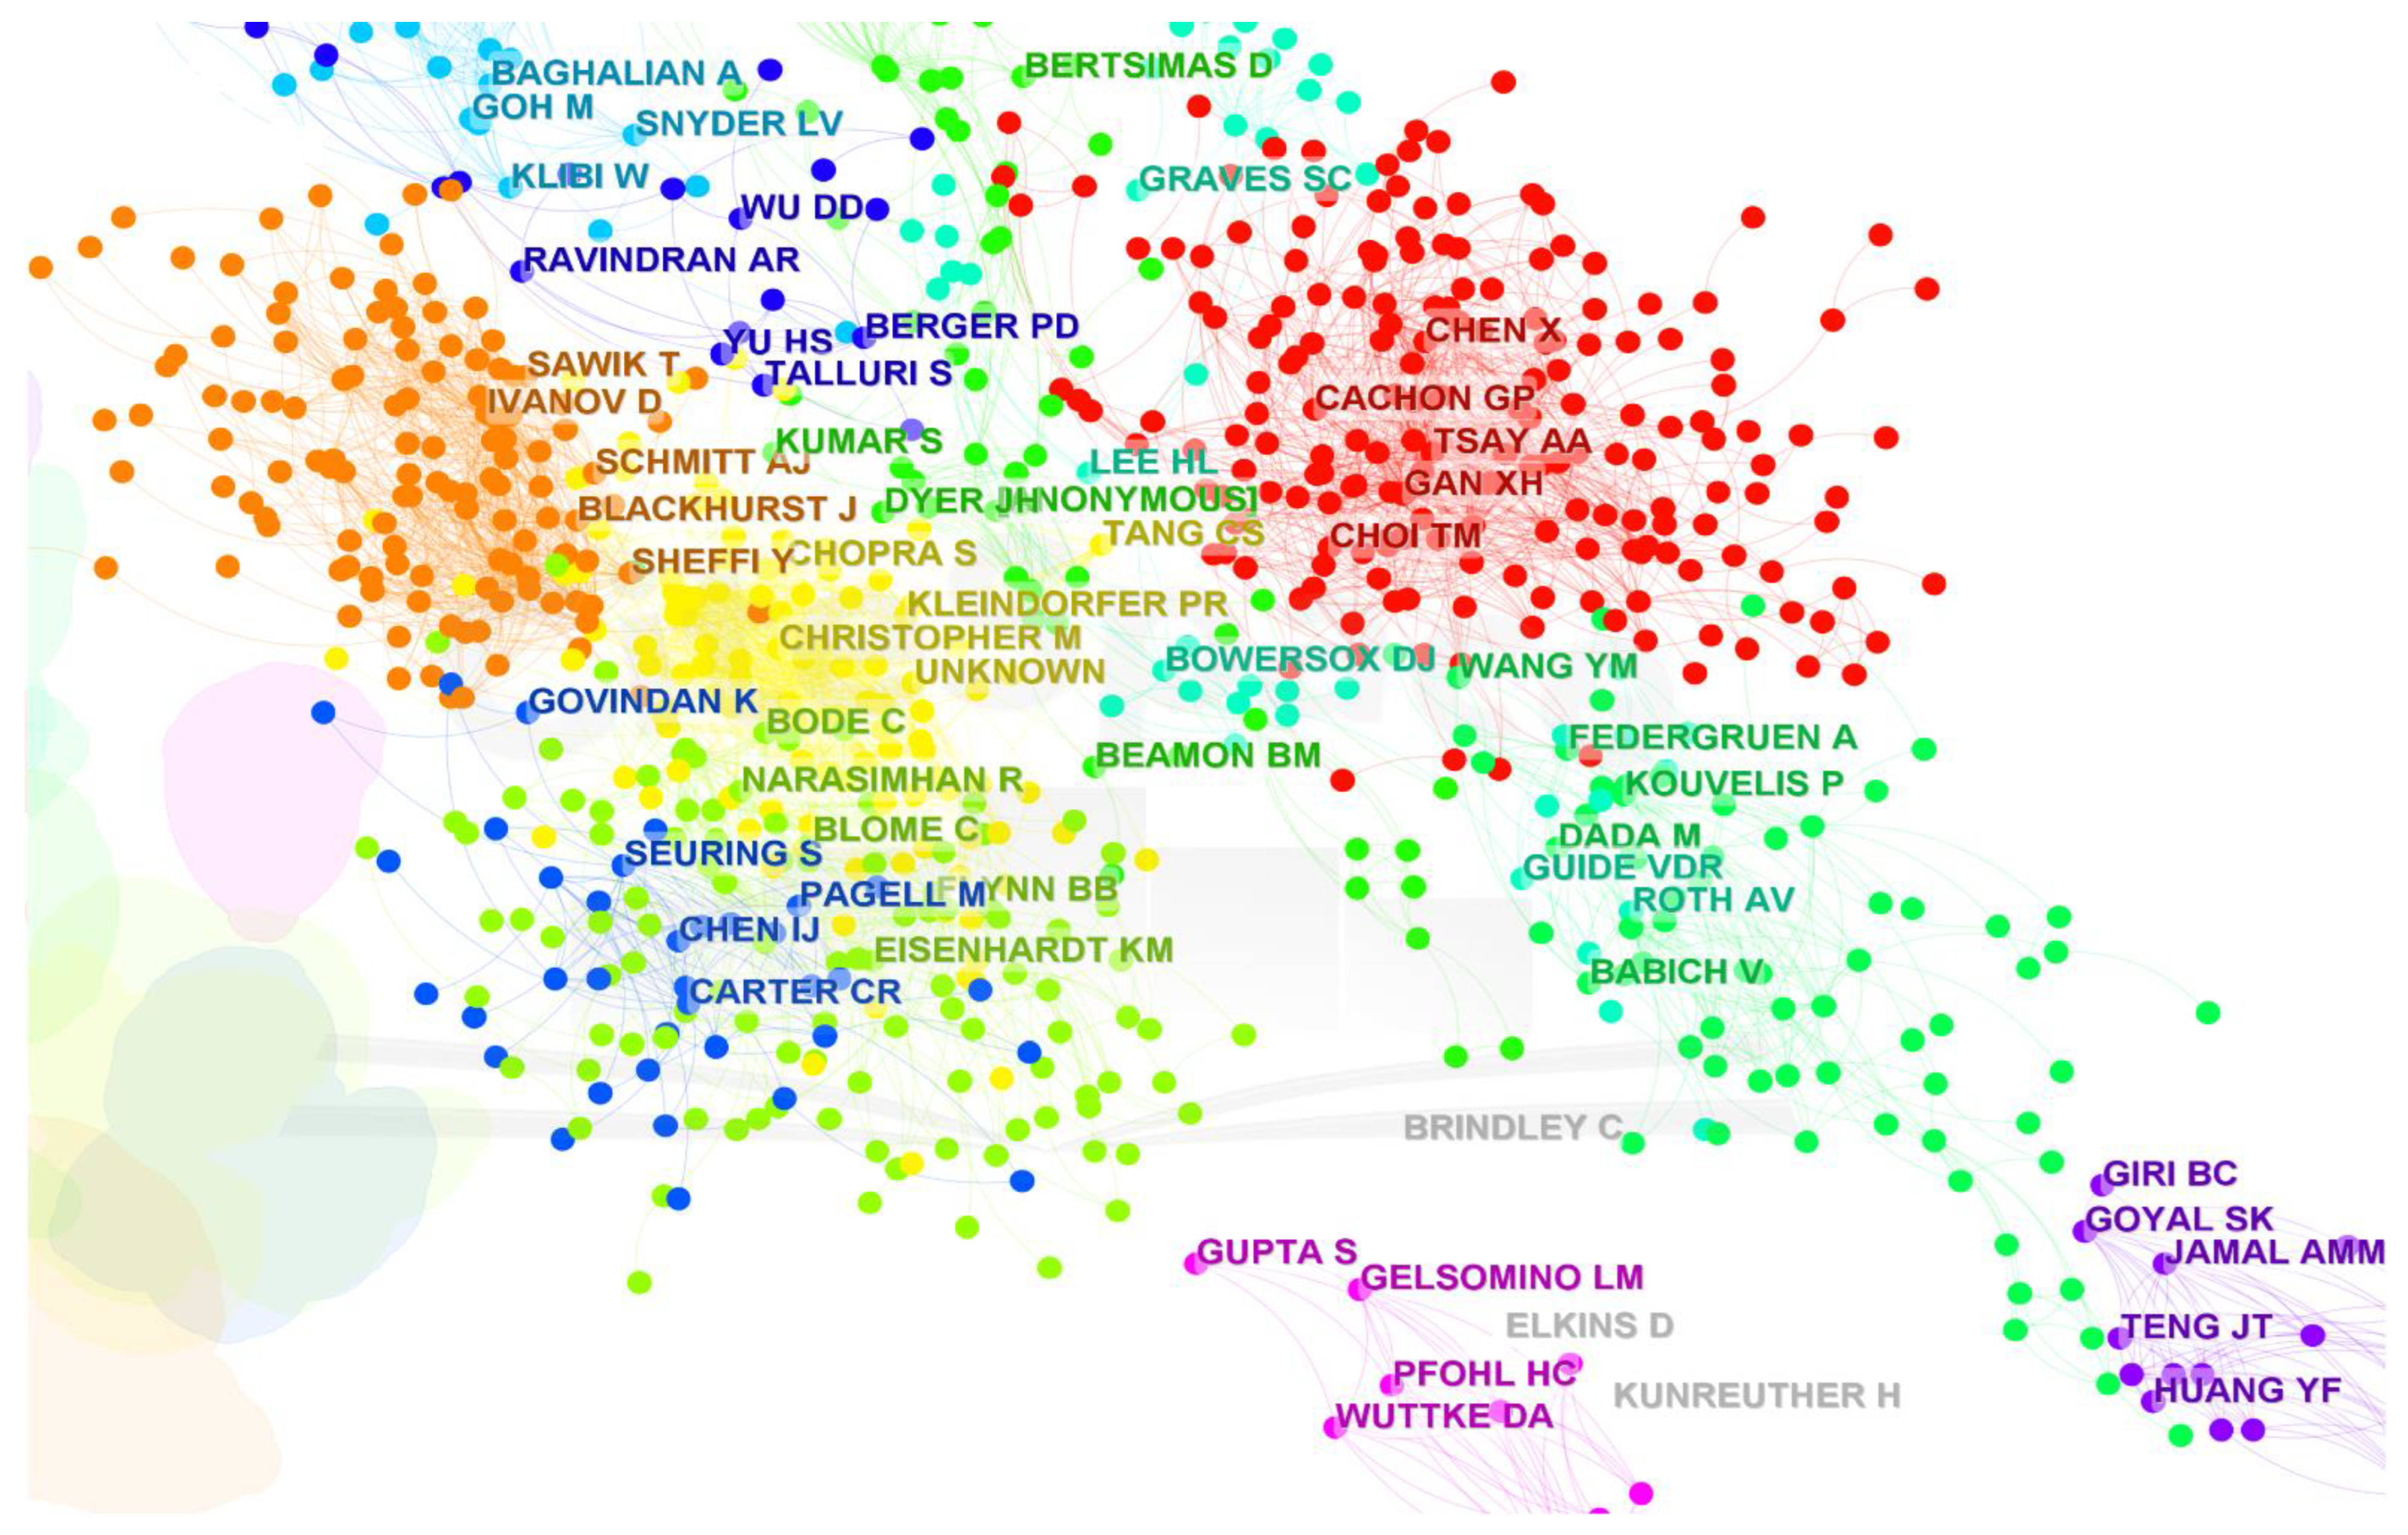
This analysis of the co-cited author is the same as the authors’ cooperation analysis. The relations of authors are connected (as shown in Figure 13).
From Table 10, some important authors in references are identified. Tang CS, Chopra S, Cachon GP, Lee HL, and Christopher M are key scholars with a high number of citations. Moreover, the category of each author is also acquired. Tang CS and Chopra S belong to the direction of supply chain risk management. In Figure 14, the distribution of these authors is shown. It is obvious that three directions in supply chain risk, “supply chain resilience”, “trust”, and “supply chain finance”, have received increased attention.

4.3. Co-Cited Journal Analysis

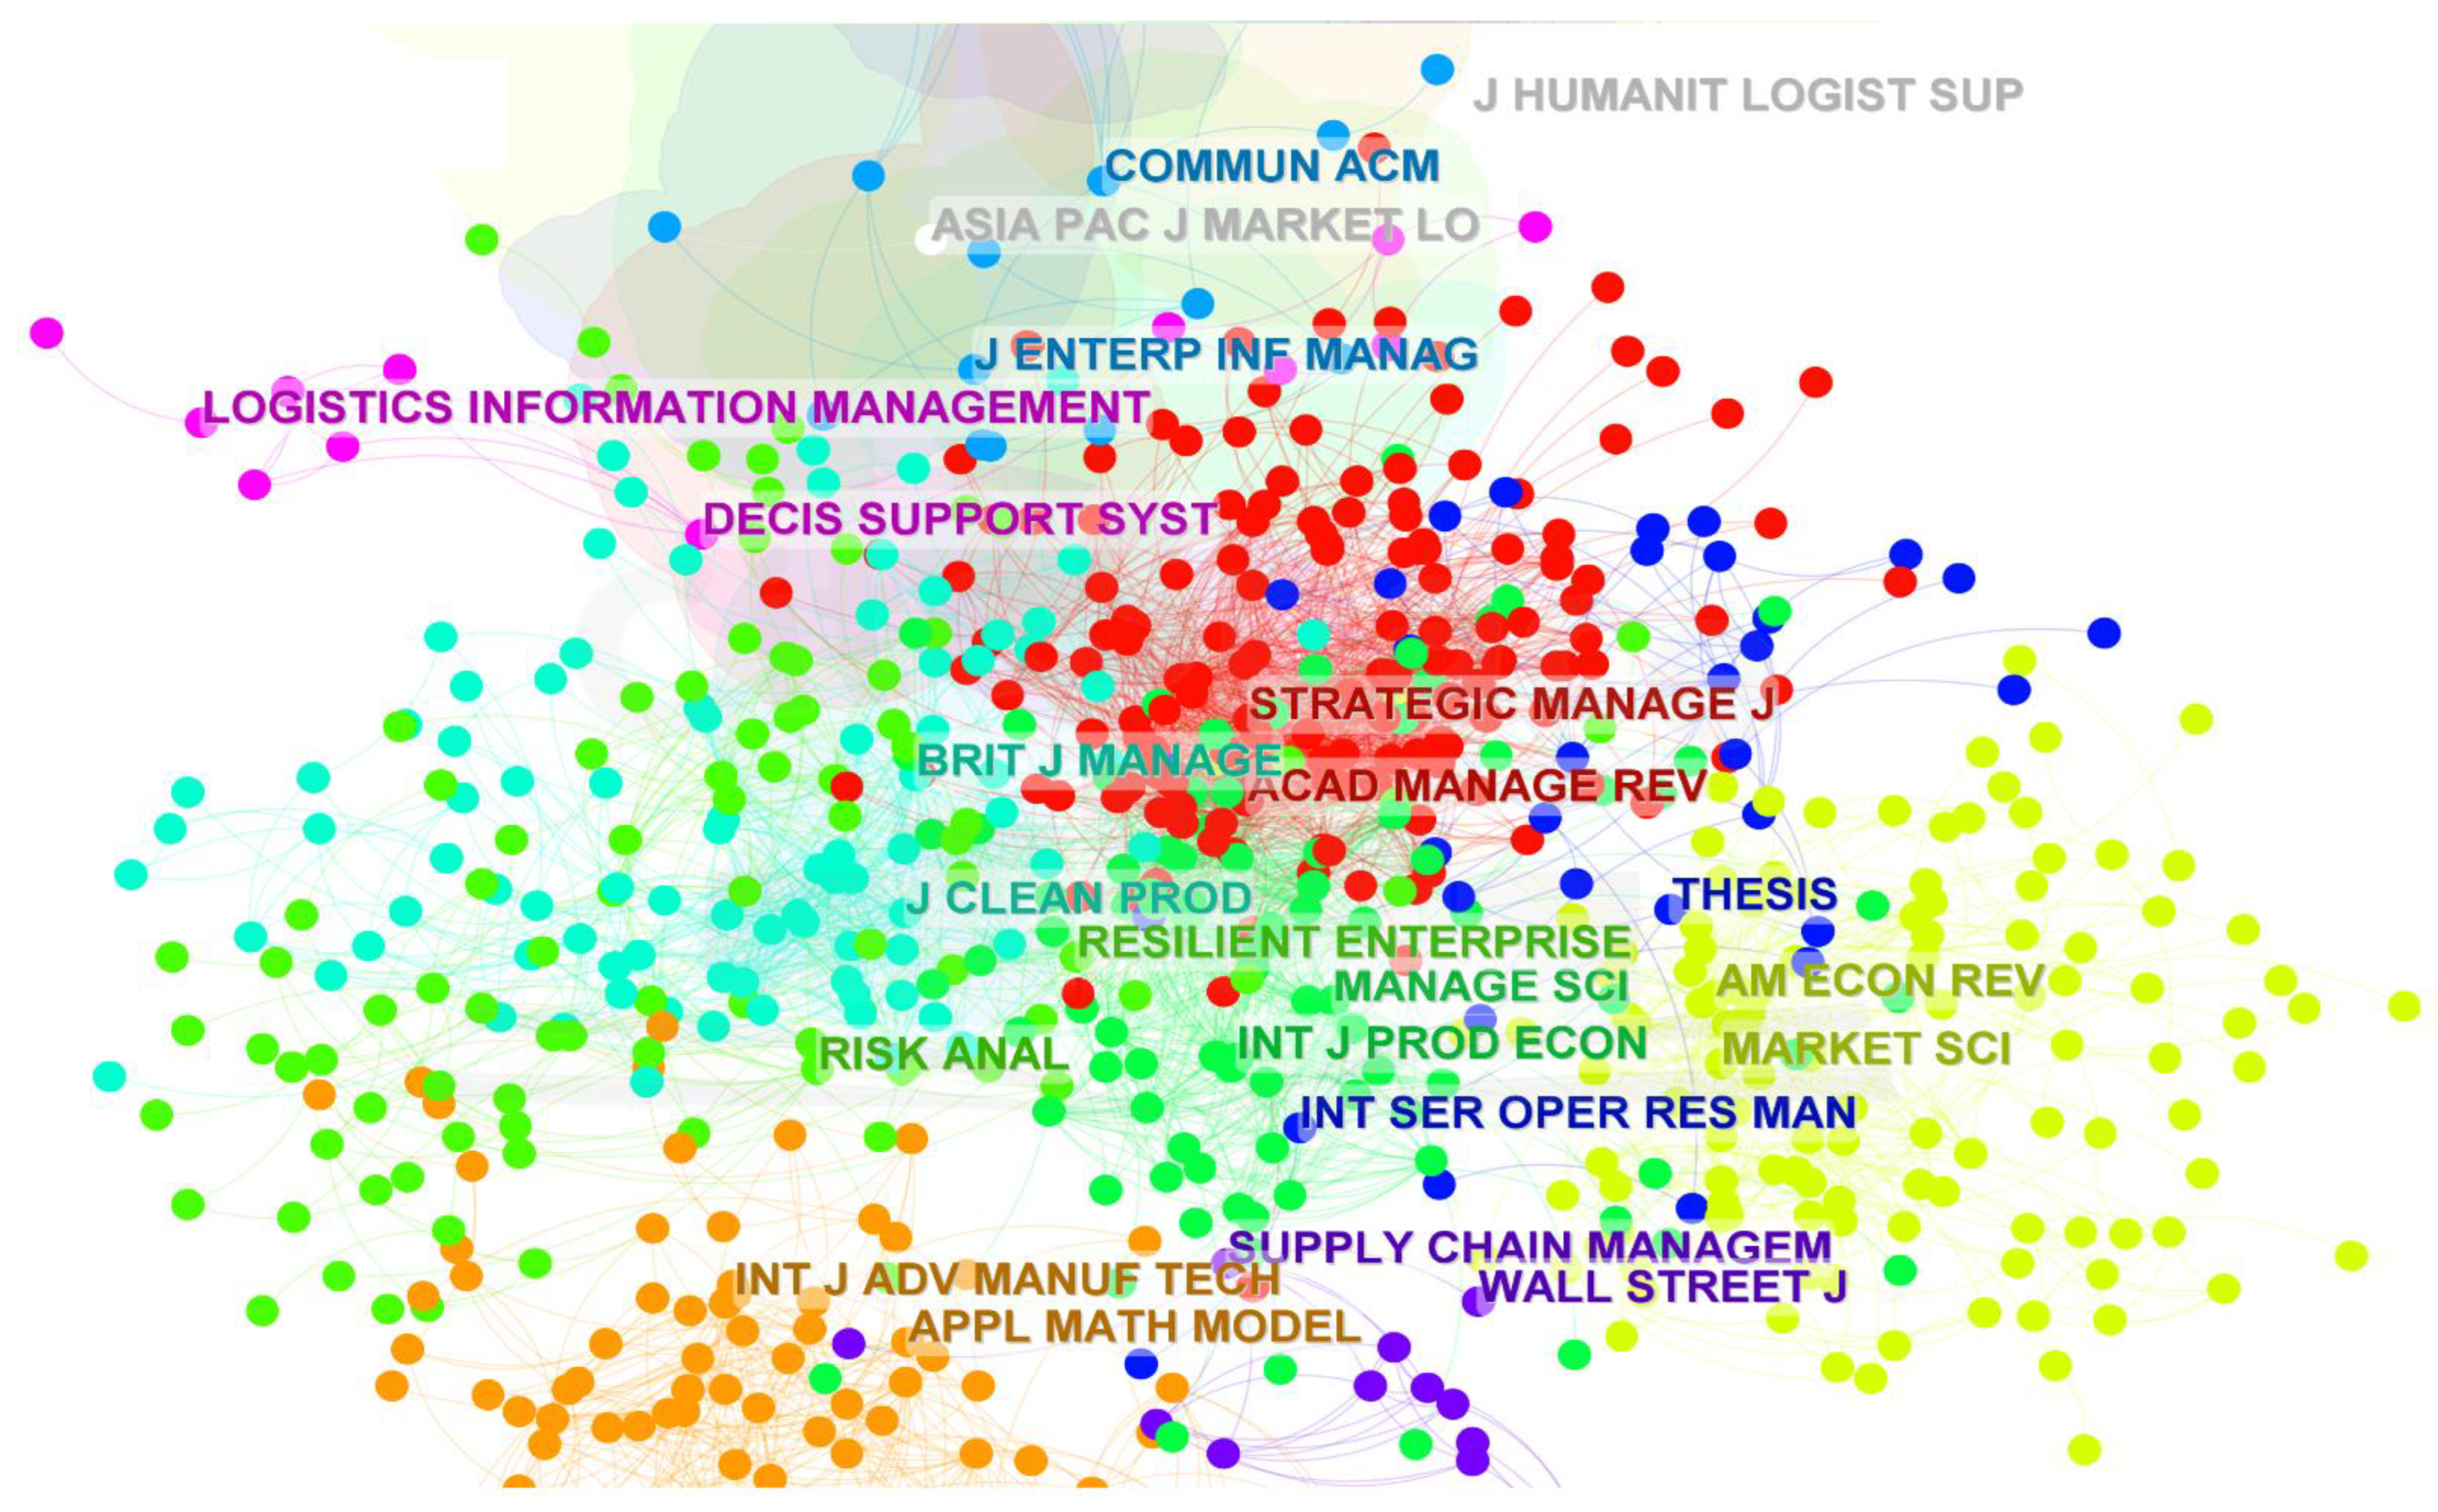
In this section, some journals about SCRM will be identified. The results are shown in Figure 15 and Table 11.
In Table 11, the top-ranked item by citation counts is International Journal of Production Economics, with citation counts of 1207. The top-ranked item by centrality is Management Science with a centrality of 0.22. From this network, we can learn which journals are more valuable in this field.

5. Topics Evolution

The processing result of terms by CiteSpace is rough and unclear. Moreover, those networks are constructed based on co-words, and clustering is processed by the algorithm of spectral clustering. Considering this, topic development needs to find more relationships in word and word, topic and topic, year and year. Topic modeling is a better technology for extracting and clustering topics. It is a generative probabilistic model for collections text corpora. LDA is a classical topic model. This technology is a three-level hierarchical Bayesian model, and it models each item in a collection as a finite mixture over an underlying set of topics. After that, every topic is modeled as an infinite mixture placed over an underlying collection of topic probabilities [26]. This section will study the emerging trends and new developments in supply chain risk. It is of great significance to study the topic further.
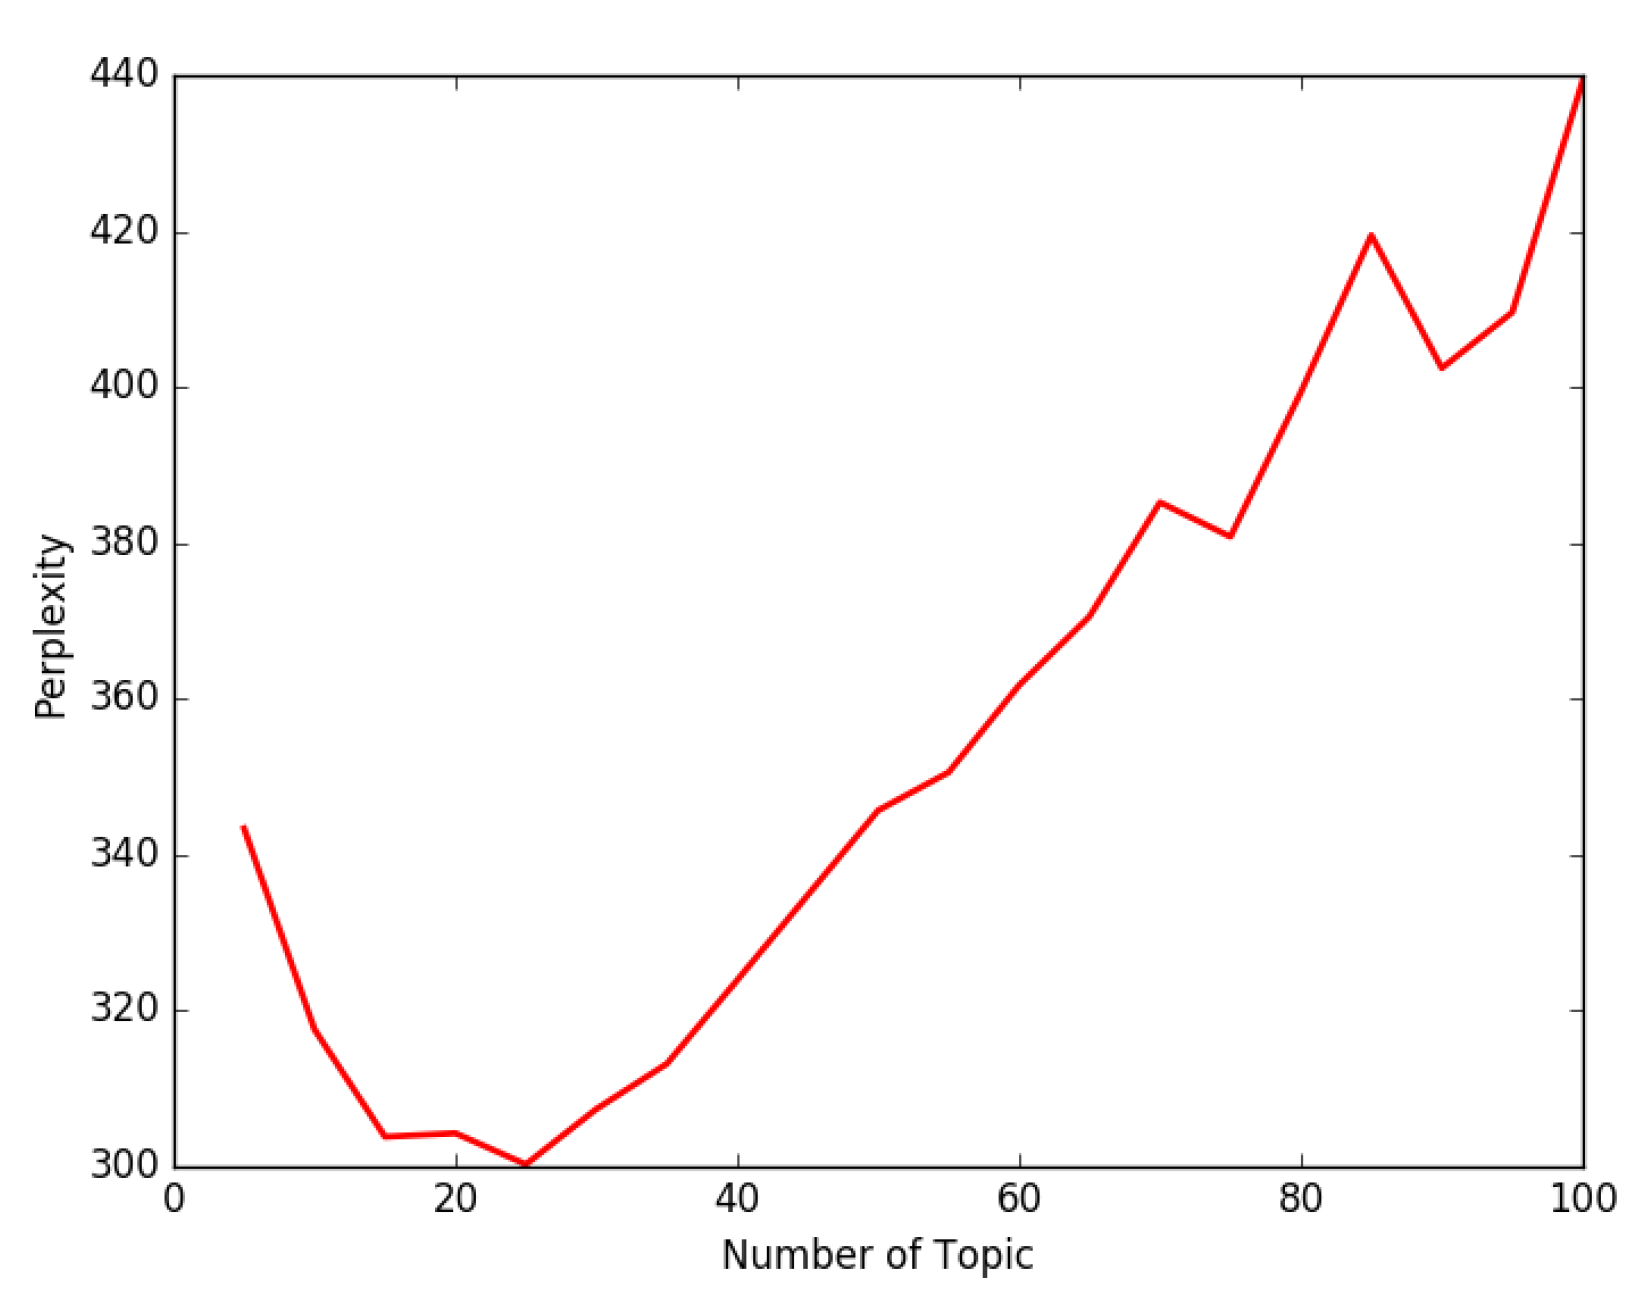
Firstly, perplexity is used to determine the most optimal number of topics. The most appropriate number in this study is 25 (as shown in Figure 16). Secondly, the data from 2000 to 2022, which only include title, abstract, and keywords, are processed by LDA technology. Topic words are shown in Table 12. Considering each topic includes a list of words, it is difficult to retrieve the meaning of topics. Therefore, we will conceptualize the words of each topic with Google Scholar and the Microsoft Concept Tagging model [29]. Google Scholar can rearrange these terms and retrieve relevant research, whereas the Microsoft Concept Tagging model seeks to map typographic entities into semantic concept categories with some probabilities, which may rely on the context texts of the things.
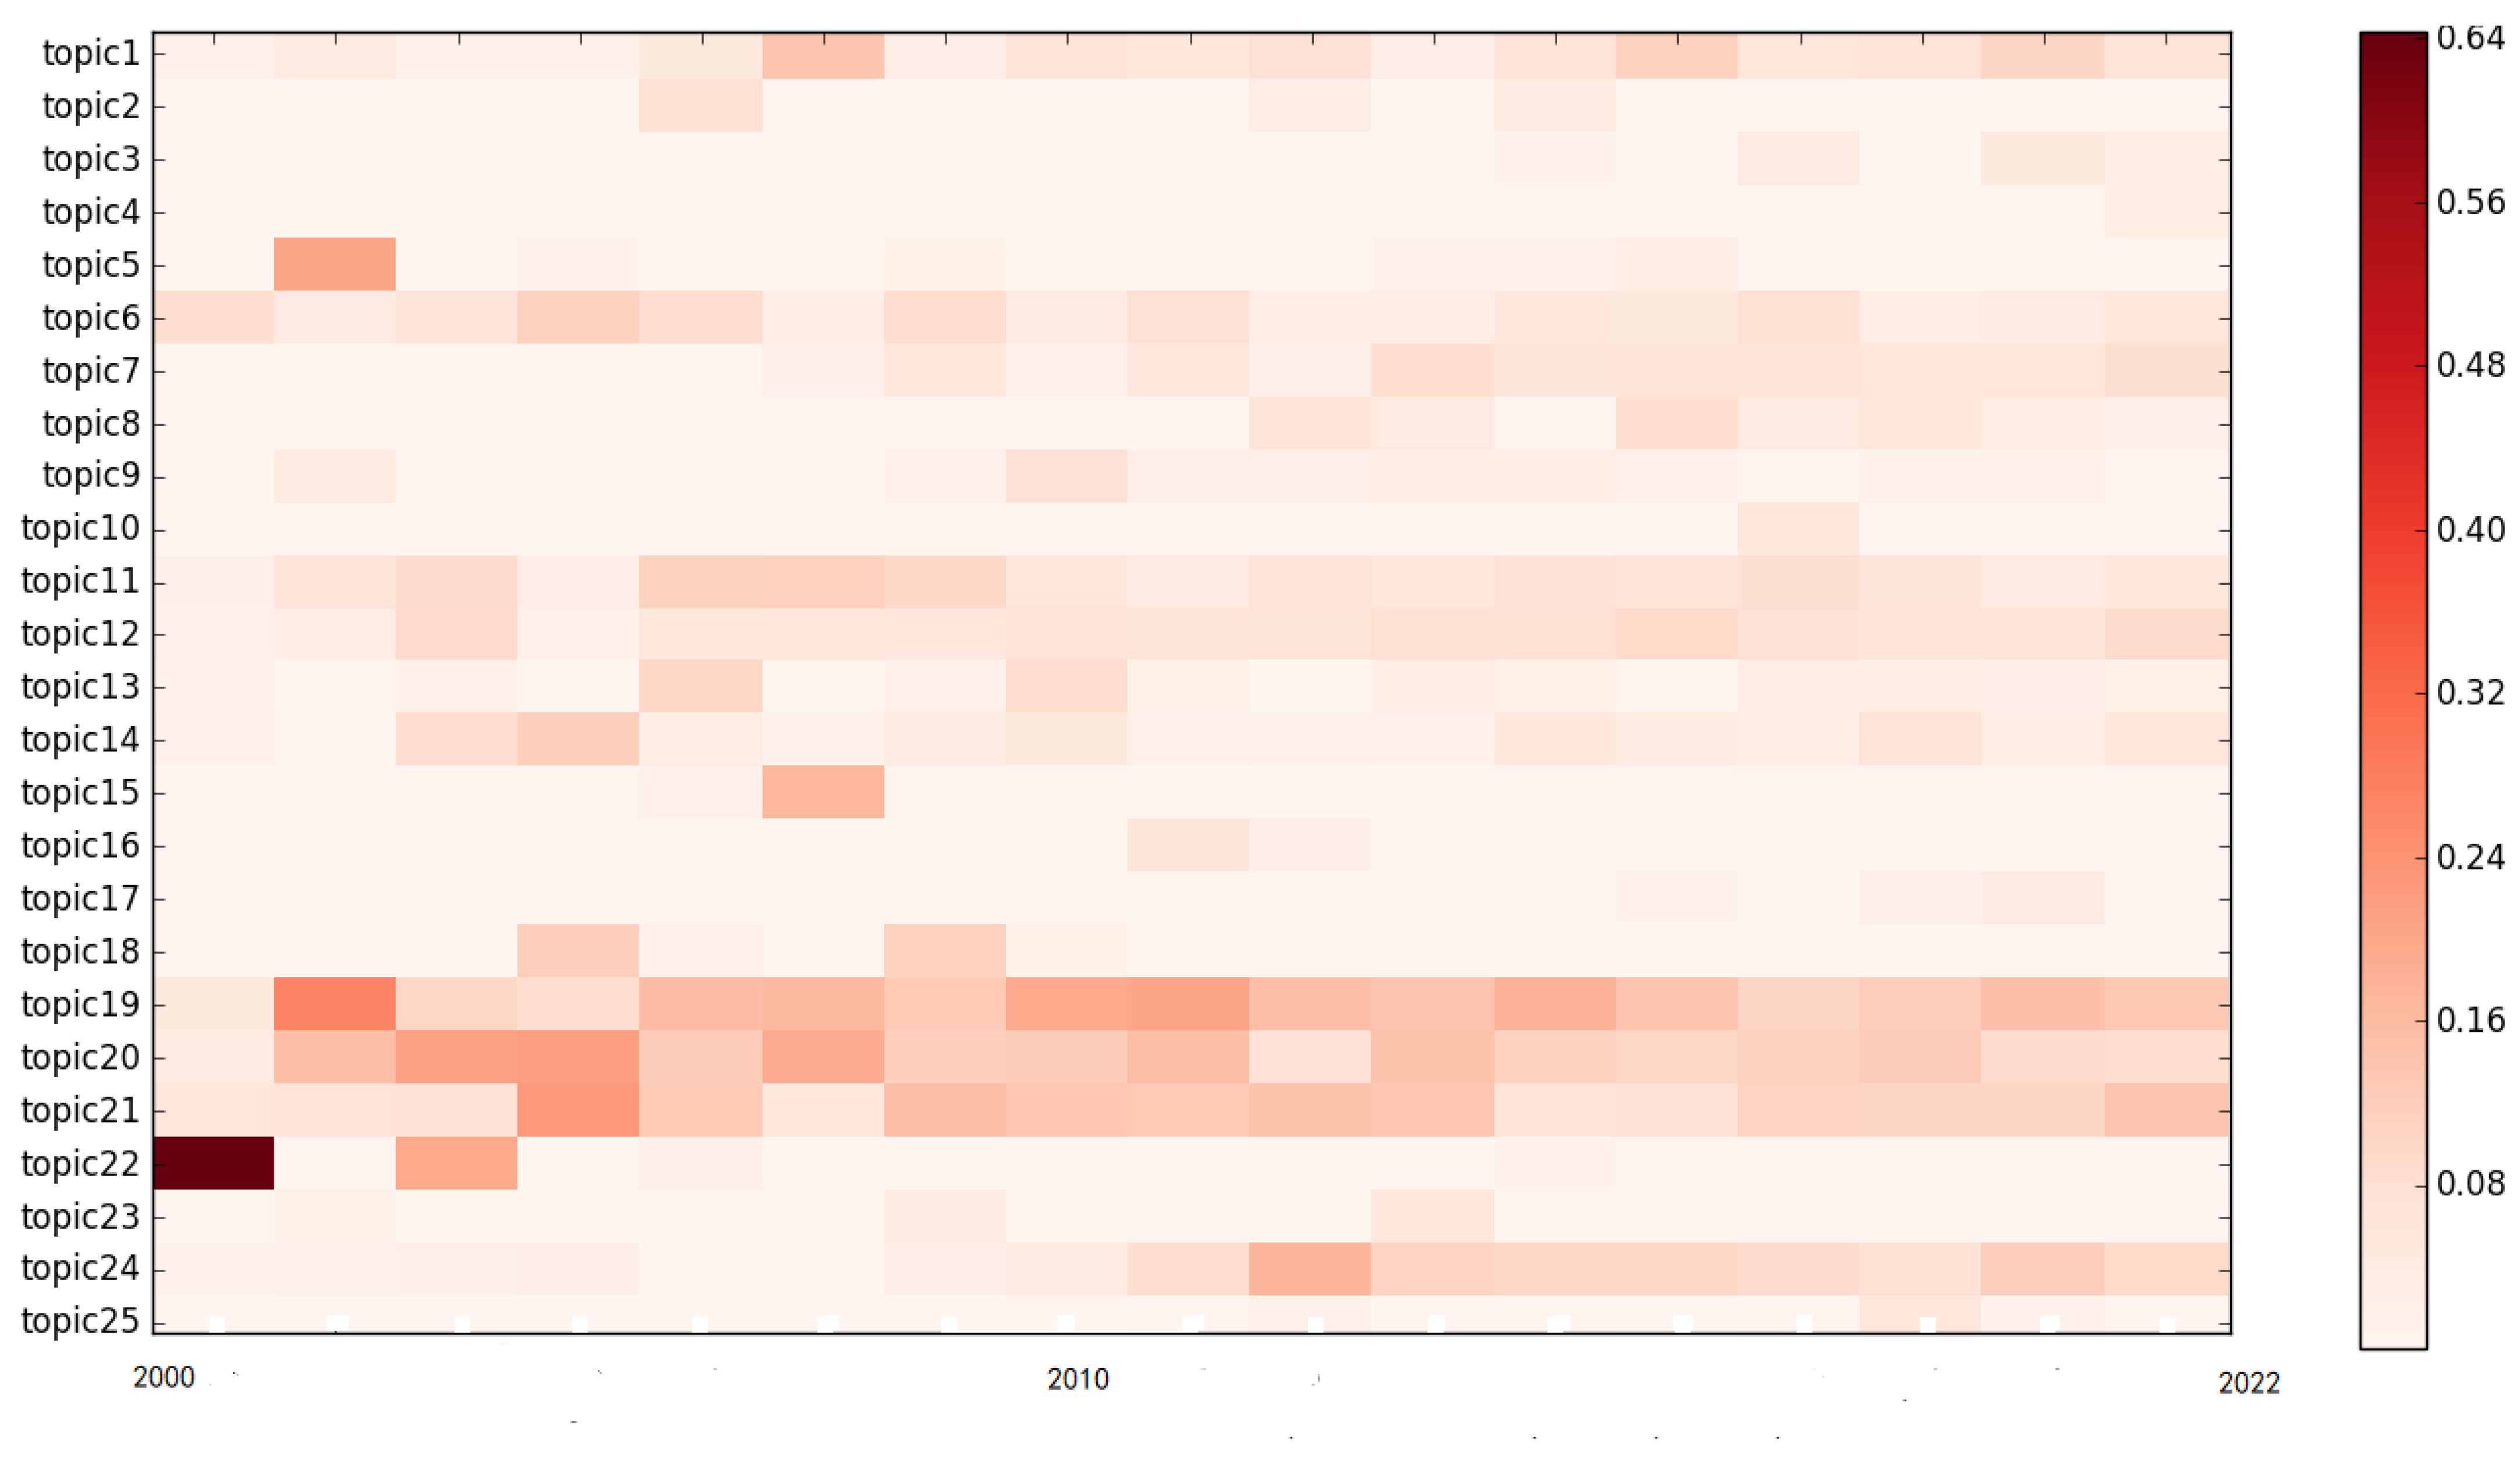
In the next step, we will observe the evolution of 25 topics from 2000 to 2022, as shown in the heatmap in Figure 17 and Table 13.
Furthermore, the distribution values of each topic every year are also calculated by LDA, with the results shown in Table 14. Emerging trends and new developments in these topics can be found in Table 14. It is obvious that the variation tendency of some topics could be learned from Figure 14 and Figure 17. For all topics, topics 19, 20, 21, and 22 attracted the attention of a large number of studies in the past. Moreover, topics 20, 21 and 22 are still studied as of recently, but topic 22 has been decreasing recently. Conversely, topics 1, 3, 4, and 24 are attracting more and more attention, and thus it is worthy to focus on these topics in the future. Moreover, we should note that some topics, such as 15, 16, and 23, have seen little research over the last five years, which indicates further work on these topics requires a tremendous breakthrough.
Finally, we define four years as a research period. The time dimension is divided into four stages, from 2000 to 2006, 2007 to 2011, 2012 to 2016, and 2017 to 2022. All the literature from twenty journals is divided into four sections by publication date. The same technology is used to extract 20 topics of different periods, as shown in the top five words in Table 14 Then, the similarity of topics between two adjacent stages is measured by the method of computing sentence similarity. It is clear that topic 15 in stage 2 originates in topic 1 in stage 1, and evolves into topic 3 in stage 3 and topic 17 in stage 4. Topic 5 in stage 1 is divided into topics 7, 16, and 18 in stage 2, and further into topics 1, 2, 6, 14, 17, and 19 in stage 3.

6. Conclusions and Future Work

6.1. Conclusions

This paper introduces the intellectual structure of supply chain risk from 2000 to 2022. Firstly, terms, keywords, authors, institutions, and countries from twenty journals are analyzed respectively based on CiteSpace. Valuable information is acquired, such as core terms, key authors, important institutions, and so on. Secondly, all cited references are extracted, and the analysis of co-cited references, co-cited authors, and co-cited journals is extremely significant in this field. We obtain the clustering of references, cooperation relations of authors, and journals with high centrality. From the above research, it is easy to learn the whole structure of supply chain risk. Finally, emerging trends and new developments in this field are presented by LDA technology and the Microsoft Concept Tagging model. We find some interesting variations of different topics. It is of help to understand the development tendency of research. Our next step will focus on the integration and separation of different topics in this field.

6.2. Managerial Implication

The contributions of this paper are twofold. First, we have reviewed the most recent literature on SCRM and presented the evolution of the topic in the field. Second, we have proposed a research framework to understand the intellectual structure of SCRM research based on text mining technology, as displayed in Figure 1. This framework can be easily adapted to other research fields.
The study results indicate that the literature review can be made more objective and hopefully also more accurate. We explore the possibility to objectively review literature with the support of text mining technology. By observing the core terms, important keywords, the clustering of references, the cooperation relations of authors, and journals with high citations, we can acquire the knowledge structure, differences in the importance of terms or authors, and relationship network among terms or authors. These results can help readers understand the overall structure, breakdown areas and current hot spots of a certain field. Moreover, it is believed that the objectivity and authenticity of research conclusions are directly related to the quantity and accuracy of text information.
To further understand the development and evolution of topics in a certain field, we develop an approach to evaluate topic evolution. By applying crawling technology, computing perplexity, LDA technology, and a text similarity algorithm, we acquire the topics automatically and conceptualize each topic using topic words and the top three papers within each topic. Additionally, emerging trends and new developments in this field are presented by LDA technology. This approach can reveal some variation in a certain field; take the research results of the SCRM field as an example: (1) empirical studies and reviews are very representative topics, especially in the early period of the field; (2) quantitative modeling, system perspective, and supply side risks are among the interesting topics; (3) ordering behavior, absorptive capacity, social sustainability, and organization issues are less explored yet represent new trends in the field. Compared with the clustering results of terms or authors, the topic analysis generated by LDA technology could generate further insights into the field, such as content explanation and topic evolution. This study also indicates the possibility of applying text mining when reviewing the literature. The study results are generated by newly developed text mining technology, which can process a large number of texts in other fields.

6.3. Future Work

Nevertheless, the framework and technology of text mining still need to be further developed for bibliometric analysis. For instance, we observe that data quality is very important for LDA analysis of full texts to obtain focused topics. Even in our study, when there are relatively fewer data available (such as in stage 1 of Table 14), several topics present the same topic content. Improving raw data quality and merging similar topics still require the development of new algorithms. In addition, when conceptualizing the topics, content analysis is again used, which reintroduces subjective judgment to some extent. Thus, this approach requires new methods to construct the relationships between topics words and topics in an objective manner.

Author Contributions

Methodology, S.G.; Writing—original draft, X.L.; Writing—review & editing, Y.Z. All authors have read and agreed to the published version of the manuscript.

Funding

This work is supported by the Natural Science Foundation of China [72001215] and funding from Chongqing Key Laboratory of Social Economics and Applied Statistics [KFJJ2019099].

Data Availability Statement

The data presented in this study are available on request from the corresponding author.

Conflicts of Interest

The authors declare no conflict of interest.

References

  1. Lawrence, J.M.; Hossain, N.U.I.; Jaradat, R.; Hamilton, M. Leveraging a Bayesian network approach to model and analyze supplier vulnerability to severe weather risk: A case study of the US pharmaceutical supply chain following Hurricane Maria. Int. J. Disaster Risk Reduct. 2020, 49, 101607. [Google Scholar] [CrossRef] [PubMed]
  2. Tang, O.; Musa, S.N. Identifying risk issues and research advancements in supply chain risk management. Int. J. Prod. Econ. 2011, 133, 25–34. [Google Scholar] [CrossRef] [Green Version]
  3. Sharma, S.K.; Srivastava, P.R.; Kumar, A.; Jindal, A.; Gupta, S. Supply chain vulnerability assessment for manufacturing industry. Ann. Oper. Res. 2021, 6, 1–31. [Google Scholar] [CrossRef]
  4. Butt, A.S. Strategies to mitigate the impact of COVID-19 on supply chain disruptions: A multiple case analysis of buyers and distributors. Int. J. Logist. Manag. 2021, 3, 1–19. [Google Scholar] [CrossRef]
  5. Yang, J.; Xie, H.; Yu, G.; Liu, M. Antecedents and consequences of supply chain risk management capabilities: An investigation in the post-coronavirus crisis. Int. J. Prod. Res. 2021, 59, 1573–1585. [Google Scholar] [CrossRef]
  6. Pournader, M.; Kach, A.; Talluri, S. A review of the existing and emerging topics in the supply chain risk management literature. Decis. Sci. 2020, 51, 867–919. [Google Scholar] [CrossRef] [PubMed]
  7. Colicchia, C.; Strozzi, F. Supply chain risk management: A new methodology for a systematic literature review. Supply Chain Manag. 2012, 17, 403–418. [Google Scholar] [CrossRef]
  8. Hamdi, F.; Ghorbel, A.; Masmoudi, F.; Dupont, L. Optimization of a supply portfolio in the context of supply chain risk management: Literature review. J. Intell. Manuf. 2018, 29, 763–788. [Google Scholar] [CrossRef]
  9. Ho, W.; Zheng, T.; Yildiz, H.; Talluri, S. Supply chain risk management: A literature review. Int. J. Prod. Res. 2015, 53, 5031–5069. [Google Scholar] [CrossRef]
  10. Donthu, N.; Kumar, S.; Mukherjee, D.; Pandey, N.; Lim, W.M. How to conduct a bibliometric analysis: An overview and guidelines. J. Bus. Res. 2021, 133, 285–296. [Google Scholar] [CrossRef]
  11. Dahesh, M.B.; Tabarsa, G.; Zandieh, M.; Hamidizadeh, M. Reviewing the intellectual structure and evolution of the innovation systems approach: A social network analysis. Technol. Soc. 2020, 63, 101399. [Google Scholar] [CrossRef]
  12. Dionisio, M. The evolution of social entrepreneurship research: A bibliometric analysis. Soc. Enterp. J. 2019, 15, 22–45. [Google Scholar] [CrossRef]
  13. Ferreira, F.A.; Santos, S.P. Two decades on the MACBETH approach: A bibliometric analysis. Ann. Oper. Res. 2021, 296, 901–925. [Google Scholar] [CrossRef]
  14. Linnenluecke, M.K.; Marrone, M.; Singh, A.K. Conducting systematic literature reviews and bibliometric analyses. Aust. J. Manag. 2020, 45, 175–194. [Google Scholar] [CrossRef]
  15. Li, X.; Lei, L. A bibliometric analysis of topic modelling studies (2000–2017). J. Inf. Sci. 2021, 47, 161–175. [Google Scholar] [CrossRef]
  16. Lopes, J.M.; Sousa, A.; Calçada, E.; Oliveira, J. A citation and co-citation bibliometric analysis of omnichannel marketing research. Manag. Rev. Q. 2021, 72, 1017–1050. [Google Scholar] [CrossRef]
  17. Hota, P.K.; Subramanian, B.; Narayanamurthy, G. Mapping the intellectual structure of social entrepreneurship research: A citation/co-citation analysis. J. Bus. Ethics 2020, 166, 89–114. [Google Scholar] [CrossRef]
  18. Khanra, S.; Dhir, A.; Kaur, P.; Mäntymäki, M. Bibliometric analysis and literature review of ecotourism: Toward sustainable development. Tour. Manag. Perspect. 2021, 37, 100777. [Google Scholar] [CrossRef]
  19. Zhao, L.; Yang, M.M.; Wang, Z.; Michelson, G. Trends in the dynamic evolution of corporate social responsibility and leadership: A literature review and bibliometric analysis. J. Bus. Ethics 2022, 1, 1–23. [Google Scholar] [CrossRef]
  20. Behrend, J.; Eulerich, M. The evolution of internal audit research: A bibliometric analysis of published documents (1926–2016). Account. Hist. Rev. 2019, 29, 103–139. [Google Scholar] [CrossRef]
  21. Albort-Morant, G.; Leal-Rodríguez, A.L.; Fernández-Rodríguez, V.; Ariza-Montes, A. Assessing the origins, evolution and prospects of the literature on dynamic capabilities: A bibliometric analysis. Eur. Res. Manag. Bus. Econ. 2018, 24, 42–52. [Google Scholar] [CrossRef]
  22. Wang, L.; Cheng, Y.; Wang, Z. Risk management in sustainable supply chain: A knowledge map towards intellectual structure, logic diagram, and conceptual model. Environ. Sci. Pollut. Res. 2022, 29, 66041–66067. [Google Scholar] [CrossRef] [PubMed]
  23. Xu, S.; Zhang, X.; Feng, L.; Yang, W. Disruption risks in supply chain management: A literature review based on bibliometric analysis. Int. J. Prod. Res. 2020, 58, 3508–3526. [Google Scholar] [CrossRef]
  24. Hallinger, P. Analyzing the intellectual structure of the Knowledge base on managing for sustainability, 1982–2019: A meta-analysis. Sustain. Dev. 2020, 28, 1493–1506. [Google Scholar] [CrossRef]
  25. Chen, C. Science Mapping: A Systematic Review of the Literature. J. Data Inf. Sci. 2017, 2, 1–40. [Google Scholar] [CrossRef] [Green Version]
  26. Blei, D.M.; Ng, A.Y.; Jordan, M.I. Latent dirichlet allocation. J. Mach. Learn. Res. 2003, 3, 993–1022. [Google Scholar]
  27. Köseoglu, M.A.; Sehitoglu, Y.; Craft, J. Academic foundations of hospitality management research with an emerging country focus: A citation and co-citation analysis. Int. J. Hosp. Manag. 2015, 45, 130–144. [Google Scholar] [CrossRef]
  28. Pilkington, A.; Meredith, J. The evolution of the intellectual structure of operations management—1980–2006: A citation/co-citation analysis. J. Oper. Manag. 2009, 27, 185–202. [Google Scholar] [CrossRef]
  29. Ji, L.; Wang, Y.; Shi, B.; Zhang, D.; Wang, Z.; Yan, J. Microsoft concept graph: Mining semantic concepts for short text understanding. Data Intell. 2019, 1, 238–270. [Google Scholar] [CrossRef]
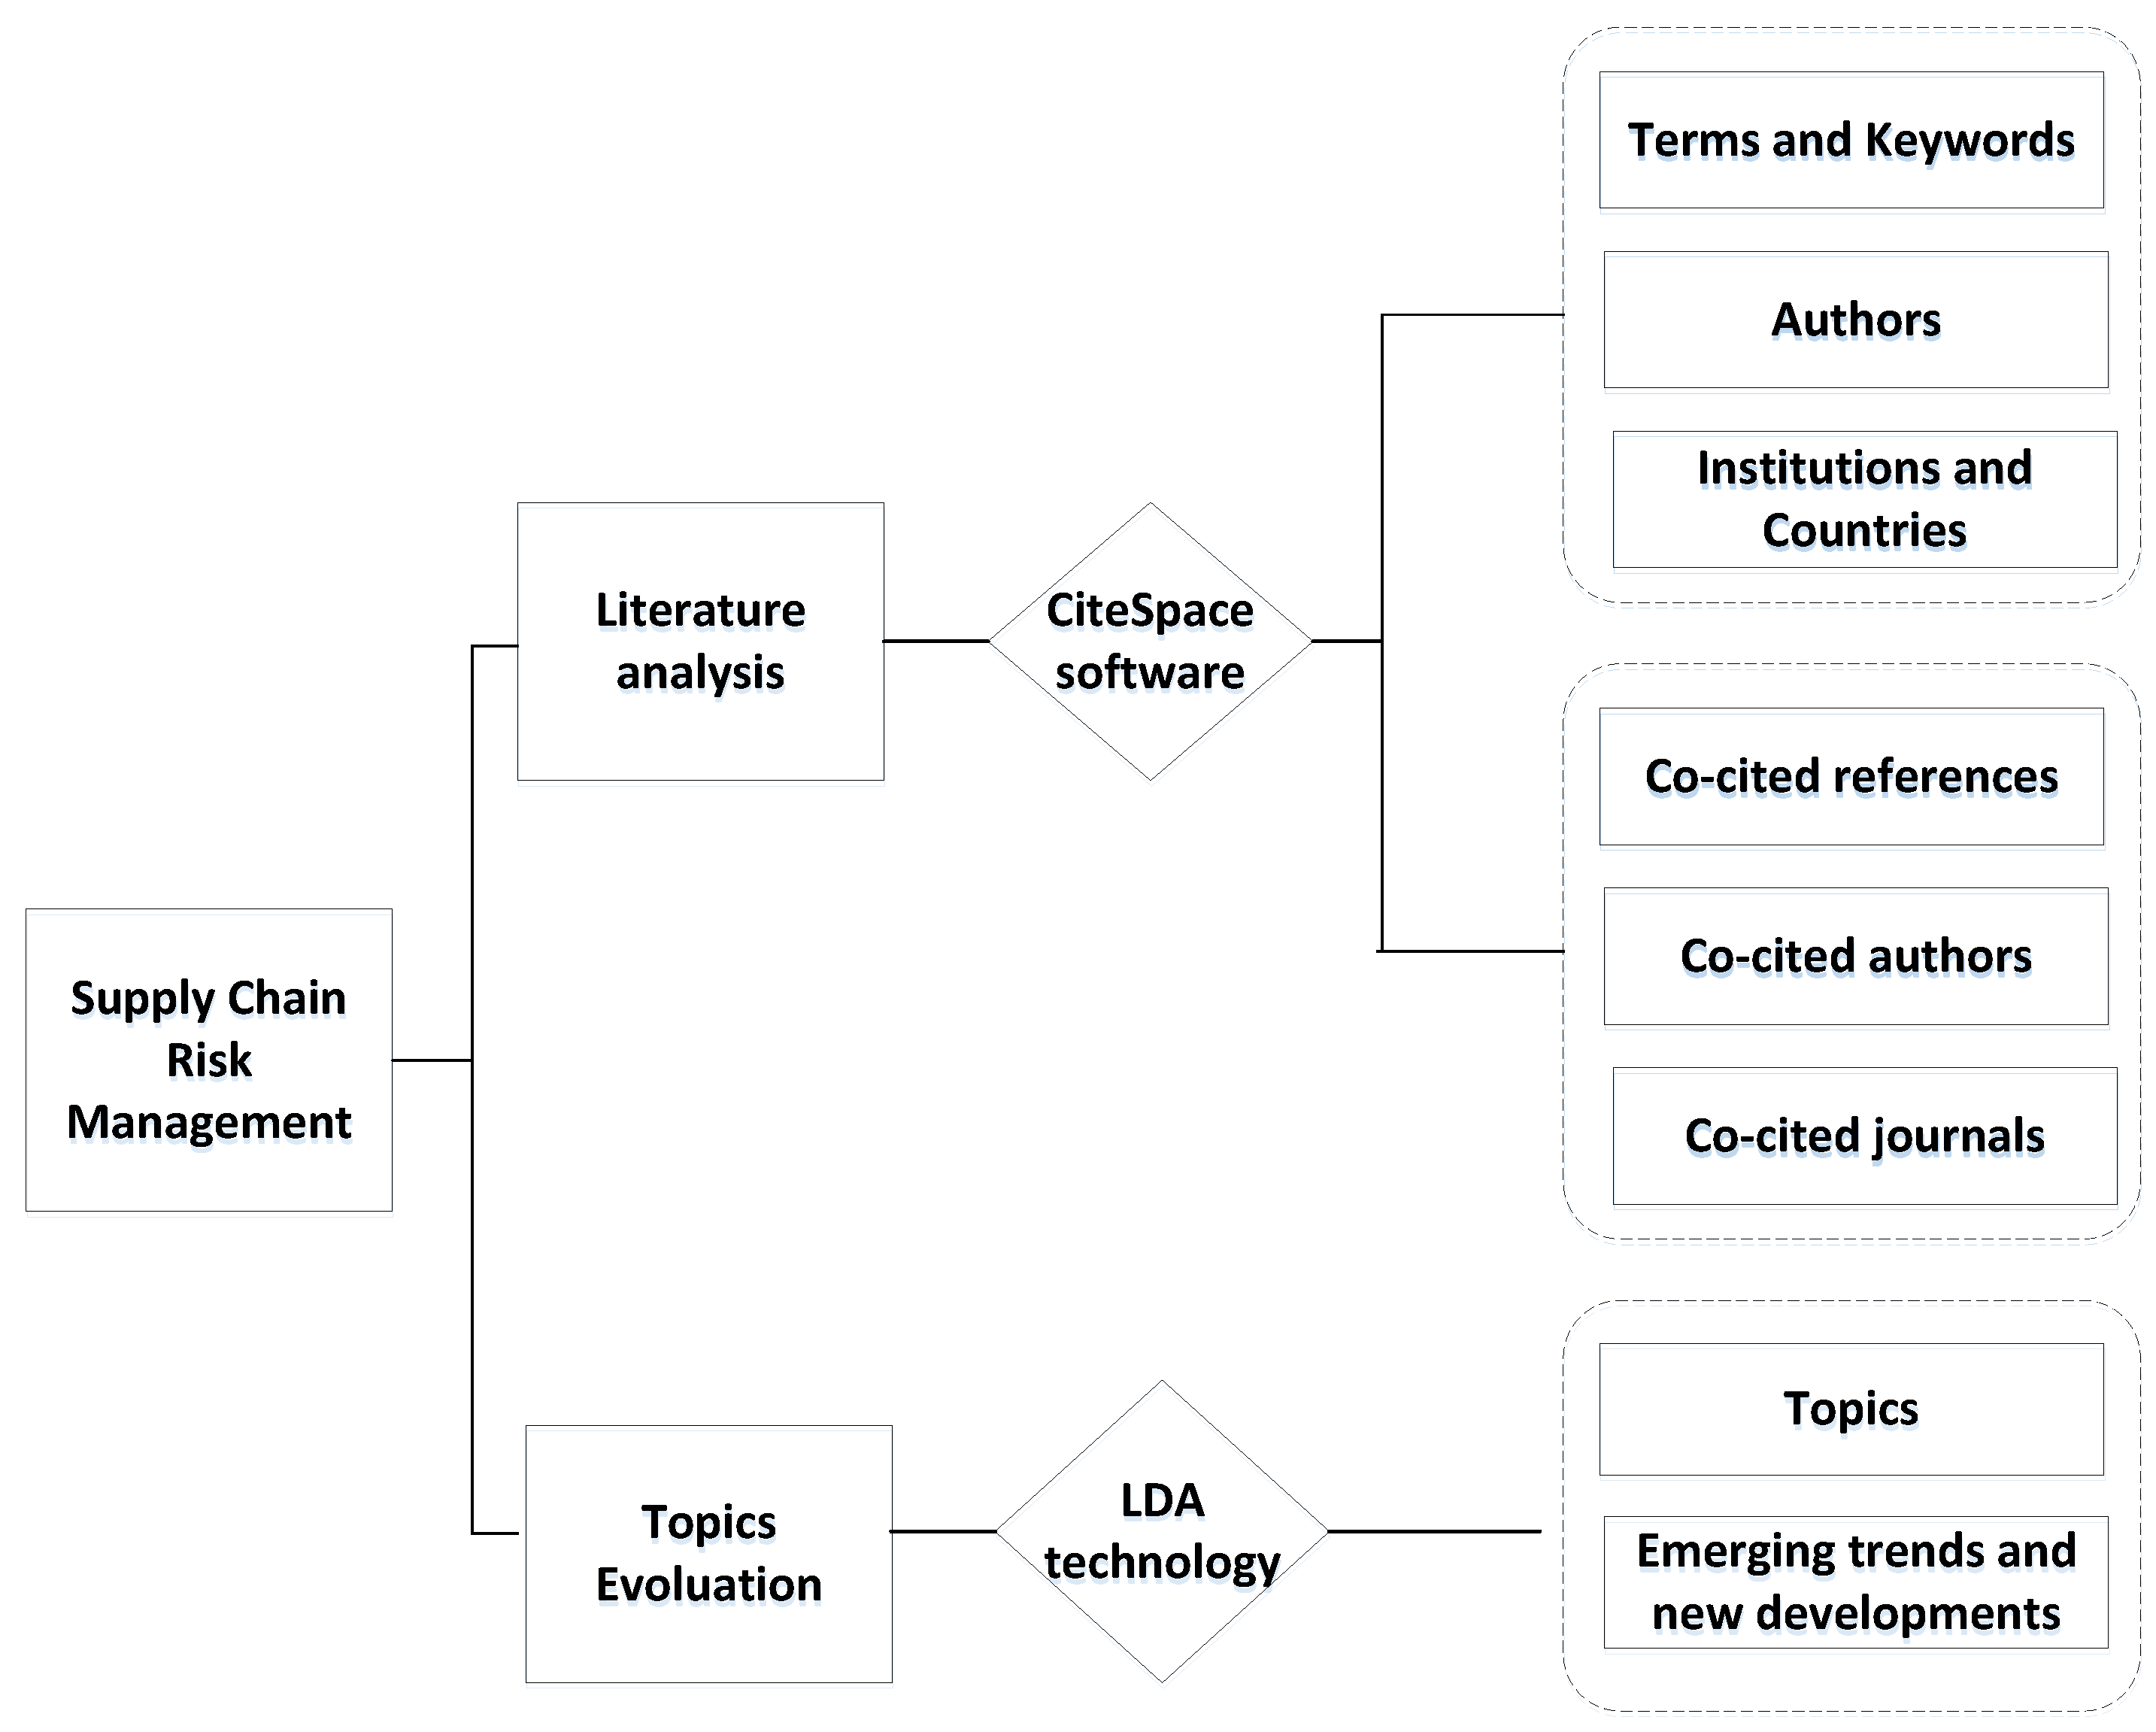
Figure 1. Research framework for investigating the literature in SCRM.
Sustainability 14 16245 g001
Figure 2. Diagram of latent Dirichlet allocation.
Sustainability 14 16245 g002
Figure 3. Co-occurring terms network.
Sustainability 14 16245 g003
Figure 4. Terms development.
Sustainability 14 16245 g004
Figure 5. Co-occurring keywords network.
Sustainability 14 16245 g005
Figure 6. Top keywords with strongest citation bursts.
Sustainability 14 16245 g006
Figure 7. Authors cooperation network.
Sustainability 14 16245 g007
Figure 8. Institutions cooperation network.
Sustainability 14 16245 g008
Figure 9. Countries cooperation network.
Sustainability 14 16245 g009
Figure 10. Co-cited reference network.
Sustainability 14 16245 g010
Figure 11. Cluster of Co-cited reference network.
Sustainability 14 16245 g011
Figure 12. Top 20 references with strongest citation bursts.
Sustainability 14 16245 g012
Figure 13. Co-cited author network.
Sustainability 14 16245 g013
Figure 14. The distribution of authors.
Sustainability 14 16245 g014
Figure 15. Co-cited journal network.
Sustainability 14 16245 g015
Figure 16. The most optimal numbers.
Sustainability 14 16245 g016
Figure 17. Evolution of 25 topics in supply chain risk.
Sustainability 14 16245 g017
Table 1. Distribution of data.
JournalQuantityProportion
International Journal of Production Economics42323.31%
International Journal of Production Research41422.72%
European Journal of Operational Research22912.57%
Supply Chain Management: An International Journal1628.90%
Production and Operations Management1457.96%
International Journal of Logistics Management1075.87%
Omega834.56%
Journal of Operations Management673.68%
Decision Sciences553.02%
Journal of the Operational Research Society492.69%
Management Science331.81%
Planning and Control221.21%
Interfaces110.60%
Operations Research70.38%
Harvard Business Review50.27%
California Management Review50.27%
MIT Sloan Management Review50.27%
Table 2. Terms cluster.
ClusterSizeSilhouetteLabel (LLR)Label (LSI)
#0610.973supply chain (86.02, 1.0 × 10⁻⁴); empirical investigation (45.94, 1.0 × 10⁻⁴); financial flow (39.61, 1.0 × 10⁻⁴); financial supply chain management (39.61, 1.0 × 10⁻⁴); dominant retailer (37.51, 1.0 × 10⁻⁴);supply chain; inventory risk; advance-purchase discount contracts; allocation; lead time variability;
#1160.990supply chain resilience (108.17, 1.0 × 10⁻⁴); risk propagation (46.09, 1.0 × 10⁻⁴); network characteristics (46.09, 1.0 × 10⁻⁴); artificial intelligence (40.91, 1.0 × 10⁻⁴); agriculture supply chain perspective (40.91, 1.0 × 10⁻⁴);supply chain resilience; adaptive cycle approach; insurance; role; behavioral experiment;
#2150.956behavioral investigation (74.02, 1.0 × 10⁻⁴); operations management (69, 1.0 × 10⁻⁴); supply chain risk management (69, 1.0 × 10⁻⁴); supply chain integration (62.99, 1.0 × 10⁻⁴); empirical analysis (54.01, 1.0 × 10⁻⁴);behavioral investigation; supply chain; transshipments; literature; review;
#3120.995supply chain management (169.31, 1.0 × 10⁻⁴); literature review (68.84, 1.0 × 10⁻⁴); COVID−19 outbreak (59.52, 1.0 × 10⁻⁴); blockchain adoption (54.88, 1.0 × 10⁻⁴); quality inspection v (45.63, 1.0 × 10⁻⁴); supply chain management; theoretic model; blockchain; smart contracts; game;
#4120.944ripple effect (93.42, 1.0 × 10⁻⁴); systematic literature review (78.24, 1.0 × 10⁻⁴); conceptual framework (47.56, 1.0 × 10⁻⁴); synchromodal freight transport (43.45, 1.0 × 10⁻⁴); system dynamics approach (43.45, 1.0 × 10⁻⁴);supply risk; systematic literature review; digging; price risks; agent-based simulation study;
#5120.986demand uncertainty (153.08, 1.0 × 10⁻⁴); sourcing strategies (68.16, 1.0 × 10⁻⁴); agglomeration economies (45.19, 1.0 × 10⁻⁴); retail competition (45.19, 1.0 × 10⁻⁴); capacity risk (45.19, 1.0 × 10⁻⁴);demand uncertainty; coordination; consumer return; supply chain; air shipment;
#6120.957risk management (129.92, 1.0 × 10⁻⁴); supply network (75.97, 1.0 × 10⁻⁴); exploratory study (47.14, 1.0 × 10⁻⁴); automotive supply chain (47.14, 1.0 × 10⁻⁴); risk assessment (37.63, 1.0 × 10⁻⁴);risk management; closed loop supply chain; kanban system; risk assessment; strategic cooperation;
#770.997assembly system (41.22, 1.0 × 10⁻⁴); channel coordination (32.83, 1.0 × 10⁻⁴); advance demand information (32.83, 1.0 × 10⁻⁴); replenishment strategies (32.83, 1.0 × 10⁻⁴); distribution system (32.83, 1.0 × 10⁻⁴);assembly system; hybrid push-pull contract; delivery quantity; processing time; facing uncertain demand;
#860.997integrative supply chain strategy (12.44, 1.0 × 10⁻⁴); indirect relationship (12.44, 1.0 × 10⁻⁴); financial performance (12.44, 1.0 × 10⁻⁴); customer service (12.44, 1.0 × 10⁻⁴); supply chain (0.67, 1.0 × 10⁻⁴); integrative supply chain strategy; customer service; financial performance: indirect relationships; supply chain;
#960.993deteriorating item (139.32, 1.0 × 10⁻⁴); expiration date (47.15, 1.0 × 10⁻⁴); two-level trade credit financing (26.75, 1.0 × 10⁻⁴); lot size (26.75, 1.0 × 10⁻⁴); partial trade credit (20.01, 1.0 × 10⁻⁴);deteriorating items; optimal credit period; supply chain; cycle time; partial trade credit;
Table 3. Core terms.
TermCentrality
supply chain0.18
supply chain resilience0.17
demand uncertainty0.16
risk management0.14
supply chain management0.13
disruption risks0.13
empirical analysis0.11
ripple effect0.1
supply chain disruptions0.09
Table 4. Keywords analysis.
FreqCentralityKeywordCluster ID
1930.18supply chain#0
310.13supply chain resilience#2
270.13supply chain risk management#0
210.13disruption risk#6
180.12demand uncertainty#4
150.12supply chain disruption#6
140.12systematic literature review#0
120.11supply disruption#6
120.11ripple effect#5
120.11empirical analysis#4
90.10COVID-19 pandemic#0
80.10supply network#4
Table 5. Authors cooperation analysis.
FreqPagerankAuthorClusterID
303.19Choi, Tsan-Ming#0
231.93Ivanov, Dmitry#2
161.95Cheng, T. C. Edwin#0
121.93Dolgui, Alexandre#2
111.92Blackhurst, Jennifer#1
81.65Chernonog, Tatyana#4
81.65Avinadav, Tal#4
71.92Gunasekaran, Angappa#5
71.65Wagner, Stephan M.#6
61.92Blome, Constantin#1
61.69Talluri, Srinivas#2
61.65Azadegan, Arash#1
Table 6. Institutions cooperation analysis.
FreqPageRankInstitution
735.17Hong Kong Polytech University
303.12Michigan State University
252.89Penn State University
252.60Arizona State University
233.32City Univ Hong Kong
232.07Berlin Sch Econ and Law
181.01Univ Sci and Technol China
162.07Univ Texas Dallas
163.05Chinese Univ Hong Kong
151.01Univ Tehran
141.18Univ Elect Sci and Technol China
132.55South China Univ Technol
131.18Ohio State Univ
Table 7. Countries cooperation analysis.
FreqCentralityCountry
6730.67USA
3900.50PEOPLES R CHINA
1750.58ENGLAND
1370.49GERMANY
1090.41CANADA
860.43FRANCE
860.41INDIA
750.36AUSTRALIA
600.35ITALY
560.35TAIWAN
390.36SWITZERLAND
370.33NETHERLANDS
Table 8. Co-cited reference analysis.
FreqBurstAuthorYearJournal
10016.17William Ho, et al.2015International Journal of Production Research
8135.54Christopher S. Tang2006International Journal of Production Economics
759.20Iris Heckmann, et al.2015Omega
7211.70Ou Tang,
S.Nurmaya Musa
2011International Journal of Production Economics
6911.02Saurabh Ambulkar, et al.2015Journal of International Management
6811.52ManMohan S. Sodhi, et al.2012Production and Operations Management
668.70Dmitry Ivanov, et al.2014International Journal of Production Research
6311.73Lawrence V. Snyder, et al.2016IIE Transactions
6329.30Paul R. Kleindorfer,
Germaine H. Saad
2005Production and Operations Management
596.94Benjamin R. Tukamuhabwa, et al.2015International Journal of Production Research
5925.61Brian Tomlin2006Mangement Science
5611.92Chopra, Sunil,
Sodhi, Manmohan S.
2014MIT Sloan Management Review
Table 9. Result of cluster.
ClusterSizeSilhouetteLabel (LLR)The Major Citing Article
#01170.870Empirical studyGhadge, A (2012) Supply chain risk management: present and future scope.
#1970.919Disruption riskDolgui, A (2020) Reconfigurable supply chain: the x-network.
#2780.973Supply chain managementTang, CS (2006) Perspectives in supply chain risk management.
#3690.935Supply chain resilienceAli, A (2017) Analysing supply chain resilience: integrating the constructs in a concept mapping framework via a systematic literature review.
#4660.924COVID-19 pandemicRozhkov, M (2022) Adapting supply chain operations in anticipation of and during the COVID-19 pandemic.
#5370.960Supply chain network designHo, W (2015) Supply chain risk management: a literature review.
#6360.997Trade creditWang, J (2020) Operations-finance interface in risk management: research evolution and opportunities.
#7360.985Risk-averse retailerYang, DQ (2009) Pricing, service level and lot size decisions of a supply chain with risk-averse retailers: implications to practitioners.
#8340.977Risk aversionMerzifonluoglu, Y (2015) Impact of risk aversion and backup supplier on sourcing decisions of a firm.
#9340.979Dynamic supply risk managementGao, L (2015) Long-term contracting: the role of private information in dynamic supply risk management.
Table 10. Co-cited author analysis.
FreqYearAuthorCluster
3472009Tang CSSupply chain risk management
3222004Chopra SSupply chain risk management
3142002Cachon GPNewsvendor problem
2782000Lee HLClosed-loop supply chain
2762005Christopher MSupply chain risk management
2432005Kleindorfer PRSupply chain risk management
2412005Hendricks KBSupply chain risk management
2392009Tomlin BSupply chain risk management
2152008Sheffi YSupply chain resilience
1992008Juttner USupply chain risk management
1952009Wagner SMSupply chain risk management
1782004Zsidisin GASupply chain risk management
1562009Craighead CWSupply chain risk management
Table 11. Co-cited journal analysis.
FreqCentralityJournal
12070.22International Journal of Production Economics
11490.16Management Science
11050.13European Journal of Operational Research
9220.12Production and Operations Management
8690.12International Journal of Production Research
7150.1Journal of Operations Management
6630.08Omega-International Journal of Management Science
6530.05Operations Research
5700.03Supply Chain Management-An International Journal
4990.03Decision Sciences
4700.02M&SOM-Manufacturing & Service Operations Management
4400.02International Journal of Operations & Production Management
4320.01Harvard Business Review
4260.01International Journal of Logistics Management
4210.01Journal of Supply Chain Management
Table 12. Topics from 2000 to 2022.
TopicImportance DegreeWordsConceptualization
11.781research operations supply price firmPerspectives on risk management in supply chains
20.210suppliers model manufacturers’ procurement trustHow to mitigate supplier risk in the supply chain
30.208risks disruption resilience operational impactDisruption risks in supply chains
40.110research mitigation time project cycleSupply chain risk mitigation
50.352systems control mismanaging modelsInformation modeling, control systems
61.959supply decision research security informationInformation systems research about risk
71.107engineering China research performance factorsSupplier selection and order lot sizing modeling
80.587science university engineering food designDesign and build the resilient supply chain
90.651approach contract framework performance probabilityGlobal supply chain risks management
100.021financial approach performance scheduling facility Quantitative and qualitative criterion of SCRM
112.364chain engineering management results firmsPurchasing and supply chain management: analysis, strategy, planning and practice
122.188management analysis industrial uncertainty optimal Managing disruption risks in supply chains
130.841coordination contract contracts price costSupply chain coordination with contracts
141.353study strategy science products performanceCorporate decision, strategy, and qualitative of supply chain risk
150.371industry level continuity issues resourceResource flexibility and continuity management
160.154RFID simulation business levels pressRFID with SCRM
170.102China sustainability option profit improveCorporate sustainability and economic foundations
180.256information production press differentiation commitmentInformation, ERP software, and forecast
194.275risks economics model retailer caseSupply chain design and analysis, model and method
203.789science research operations demand issuePlanning and operational design issue
213.586operations supply risk supplier inventoryOperations supply risk and supplier inventory
220.127product buyer supplier quality costsInformation, contracting, and quality costs
230.275vendor transport economic stock outsourcingVendor, retailer, and consumer
241.400logistics international research distribution physicalQuantitative models
250.369trade buyer manager retailer timeBullwhip effect and decision-making
Table 13. Distribution value of each topic.
Topic20002001……20212022
10.0156720.040315……0.1042720.069218
20.0011840.000537……0.0005290.003918
30.0011730.003086……0.0453520.036030
40.0006190.000281……0.0001360.037414
50.0019860.205277……0.0015060.000327
60.0843050.04077……0.0380490.058839
70.0062380.002827……0.0599860.080757
80.0033060.004053……0.0366060.023907
90.0036690.045093……0.0176490.002938
100.0001160.000527……0.0001310.000191
110.0245980.067353……0.0432340.051823
120.0179660.033691……0.0634740.08921
130.0103780.007259……0.0262390.021982
140.0188980.006012……0.0344620.058876
150.0020920.006058……0.0005400.002169
160.0008660.000392……0.0004610.000143
170.0005760.000261……0.0405730.002423
180.001440.000653……0.0004680.001509
190.0466350.268946……0.1524160.131726
200.0382620.155298……0.0896970.084718
210.0596590.070473……0.1053560.138902
220.643210.00288……0.0008200.000105
230.001550.02114……0.0059510.002531
240.0135250.01635……0.1181130.094242
250.0020780.000942……0.0149220.006717
Table 14. Topics of different periods.
Topic2000–2006/stage 12007–2011/stage 22012–2016/stage 32017–2022/stage 4
1economic policies theory provide relationshipstock companies factor critical relatedsupply science retailer models decisionsoperational practice practices selection enterprise
2purchasing variety determine cross-training decisionsglobal company development distribution physicalphysical model risk knowledge disruptionchain research supply paper production
3set modeling risks industrial sharingcontract manufacturer procurement strategiesmodel industry technology China capacityrisk research supplier market contract
4company effective flexibility structure stochasticchain risk science economics performanceprocurement prices examine failure purchasingfinancial system case multiple simulation
5engineering analysis environmental variety marketretailer incentives terms effort missionfirm price trust contract focussupply chain risks disruption service
6products state lead strategy allocationresearch demand planning supply issuesChina policy outsourcing selection industrialmodel planning networks mis product
7chain retailer systems analyze approachespaper model costs market pressorder analysis approach manufacturer decisionchannel service European sharing items
8control Sloan mis rev politicaloperations information management capacity systemsengineering transport contract city vendorproduct time decision stochastic capacity
9advertising product manufacturing yielddifferentiation forecast delayed demand changeprice quality networks parts safetytrade managing sustainability approaches culture
10manufacturer efficient output liabilities practicessupply management supplier results riskssystems supply state develop misoperations international demand economics performance
11operations information demand paper designoperations case product retailer productssimulation practices service levels RFIDinventory mis capability robust parts
12product supplier costs failure resultproduction decisions risk increasing levelstudy distribution manufacturers external managerssupply China quality price contracts
13ERP advance develop impact distributionmarkets wholesale purchase implementationinventory service environmental reducescience model supplier retailer uncertainty
14buyer quality appraisal activity expectedengineering price firms expected environmentoperations risk research supplier economicslogistics risks relationship price contract
15supply research science risk managementinternational control method theory datasupply chain management international suppliersanalysis logistics technology factors control
16uncertainty optimal data opportunities policyengineering decision responsiveness base componentchain risks product case marketsecurity sharing container transportation performance
17systems solution work influence theoreticalsupplier contracts inventory coordination quantitysecurity companies fashion supplies vaccinemanagement cost results network process
18capacity problem robust India distributionrobust online uncertain task robustnesslogistics inventory information university uncertaintyresearch literature manufacturer strategies
19planning case criteria model timesindustry continuity pricing lead equityengineering demand study strategies reviewscience distribution engineering physical order
20performance process operational model taskchange service potential selection logisticsperformance contracts profit programming timeengineering industrial strategy systems
Publisher’s Note: MDPI stays neutral with regard to jurisdictional claims in published maps and institutional affiliations.