1. Introduction
Countries have focused on the problems that hinder and affect their economic growth, as well as examining which factors come to the fore in their economic growth. Studies on the subject and literature reviews clearly reveal these facts.
Considering the fact that different methods may yield different results, such as the Topsis and Moora methods, it is clear that examining the prominent factors in economic growth with the multidimensional scaling analysis method, evaluating the findings, and discussing the results will contribute to the literature and the evaluation of these factors.
Being a global actor in today’s world requires not falling behind in the race to become an information and technology society and being successful in relation to the competition. The way to increase competitiveness is to produce goods and services produced with information-intensive technology and to increase productivity. In order to achieve this, there is a need for innovative initiatives and entrepreneurs who can design, manufacture, and market original, improved, or modified products that will enable the business to grow, increase its market share, make it profitable, and ensure the continuity of profit, use the idle capacity of the business, and put it ahead of the competitors in the sector.
It is important for countries to see the results of their efforts for economic growth, to make a cost-benefit analysis, and to evaluate the efficiency of innovation activities and R&D studies. For this reason, the evaluation of the efficiency of vocational education, the lifelong learning journey, innovation activities, R&D studies, entrepreneurial performances, and, accordingly, technological developments, have been research topics.
The main characteristics of the entrepreneur are innovation and invention. The level of entrepreneurial performance is directly proportional to the level of concentration with R&D and innovation. Therefore, it is emphasized that entrepreneurship is the most important source of all economic change [
1]. The effect of well-trained human capital on economic growth is of great importance in terms of economic productivity. In addition to entrepreneurship, it is accepted that education and economy are two dynamic variables that affect the development of countries. The success or failure on economic growth and, therefore, development, depends on the mutually supportive effect of these two dynamics. It should not be forgotten that one of the most important dynamics of development is change and progress [
2].
While questioning the role of entrepreneurship in economic development, the major role of entrepreneurs in the structural transformation of countries from low-income, primary sector-based societies to high-income service-and technology-based societies is clearly seen, at the same time, the impact of entrepreneurs on the opposite pole of stagnant development (including conflict) and innovation-based high growth is emphasized. Many policies routinely adopted for entrepreneurship, such as the provision of credit and training opportunities, all seem to have implications for growth-enhancing entrepreneurship [
3].
Ideas produced by using information-intensive innovative technologies and the products that come out with the realization of these ideas contribute to economic growth by strengthening the competitiveness and economic structure of countries, thus increasing living standards and increasing welfare. In this respect, it is important to measure and evaluate the entrepreneurship and innovation performances of countries.
Another parameter in economic growth is lifelong learning. Lifelong learning can be considered as a vital way to align the learning society with the knowledge economy. The conceptualization of the “learning society” and lifelong learning promoted in knowledge economy policy models is important in this respect. The dominant policy model of the knowledge-based economy and learning society directly affects education and lifelong learning but puts it in a narrow economic agenda. This risks further weakening the principles of education and lifelong learning [
4].
Developments in information and communication technologies, easy access to information, and competition between countries in almost every field, especially in economic and social fields, have brought about the phenomenon. The globalizing economy has created a global competitive environment in all sectors, especially due to the globalization of consumption. This situation, which is the reflection of natural selection in the economy, has prevented businesses from operating as before. Businesses no longer have a chance to continue their existence by accepting the domestic market as sufficient and offering their supply according to the demand, as before. While searching for the product they need, consumers, who have the opportunity to reach the products produced all over the world, have now drawn businesses not only into local but also global competition.
The study is based on the data in the Global Innovation Index (GII) report for 2021 and the data in the European Innovation Index scoring table for the same year. In addition, the study investigated the impact of lifelong learning journeys and entrepreneurship and innovation performances of the countries with the highest and lowest scores on economic growth, as well as the member states of the European Union and Turkey.
There are some factors that play an important role in the progress and development of countries. Vocational and technical education, lifelong learning, innovation activities, R&D studies, and the training of potential entrepreneurs that will drive them are among these important factors. It is seen that countries that are aware of this make significant expenditures for the development of innovation activities and to increase the efficiency of R&D studies.
Rational use of production factors comes to the fore in increasing competitiveness. Factors affecting economic growth and the use of new technologies, gain meaning with the presence of a well-trained workforce. Vocational and technical education and the lifelong learning journey aims to improve the knowledge, abilities, and competencies of the individual, as well as being a means of raising an efficient workforce in a systematic and planned manner in an integrated form with the learning process that will continue throughout life. There is a need, more than ever, to add value to economic life by raising entrepreneurs who have entrepreneurial skills, who, thus, are able to play an active role in the growth of economies and the development of societies.
2. Literature Review
In the literature research, studies evaluating the entrepreneurship and innovation performances of countries, R&D studies, policies for vocational education, lifelong learning efforts and, accordingly, the economic growth of countries, are included in accordance with the subject of the study. When the studies are examined, it is seen that multi-criteria decision making (MCDM) methods are predominantly used when evaluating the performances of countries for factors, such as innovation, R&D, and economic growth.
From a strategic perspective, innovation and human capital development target employees. Therefore, it is possible to identify knowledge as a key factor in developing and marketing innovation. Especially large investments in technology strengthen the competitive position of countries [
5] (p. 14). The importance of knowledge and investing in technology, which means the announcement of the known, has also emerged in this study.
The study titled “Entrepreneurship, Developing Countries and Development Economics: New Approaches And Insights”, which models and explores the role of the entrepreneur in areas that are important for development economics, such as structural change and economic growth, income and wealth inequalities, welfare, poverty traps and market failures, focuses on absolute poverty. Based on the premise that it is of great practical importance to understand whether and when entrepreneurship is a binding constraint on economic growth and development in developing countries, with more than one billion people living in it, it reveals that entrepreneurship is one of the factors that can stimulate economic growth and increase economic competitiveness [
6]. This study also reveals that entrepreneurship comes with education at the top of the factors that trigger economic growth and increase competitiveness.
In the study titled “The Role of Vocational Education and Training Curricula in Economic Development”, which discusses the necessity to compete in the global arena and successfully overcome the challenges of globalization, in order to maximize the effectiveness of vocational education and training based on special curriculum design, it is stated that information and technologies are renewed at an increasing rate. The study emphasizes that, because we live in a world where economic trends and goals arise, educational planning needs to be shifted towards new forms of teaching content and delivery to respond to the emerging updated needs [
7]. Every step taken in science and technology necessitates this change.
The study titled “Lifelong Learning in the USA: A Focus on Innovation and Efficiency for the 21st Century Learner” emphasizes that the needs cannot be met as desired due to the budget deficits of the states and the nation, and, thus, emphasizes that promising applications in lifelong learning should be replicated and scaled. The paper discusses how US educational institutions are using innovative principles and practices to meet current challenges and support lifelong learning. Claiming that innovative practices address six challenges based on desire, access, academic and career paths, transitions, affordability, and success [
8], this study states that the economy needs a more highly qualified and educated workforce.
In the study named “Measurement of R&D Performance by Integrated Entropy Weight-Topsis Method in EU Countries”, the R&D performances of 27 European Union member countries and 6 candidate countries for the European Union were evaluated. When the results are examined, it has been revealed that the countries with the best R&D performance are Germany, France, England, and the Netherlands, as expected [
9].
“Made in China: Challenge and Innovation in China’s Vocational Education and Training System” highlights that China’s economic model will require much higher levels of skills and productivity in the future. It reveals that this can only be achieved with a more advanced vocational education system [
10].
The study named “Vocational Education and Training in the Developed World: A Comparative Study” questions the vocational education and training policies of five developed countries, such as Japan, Australia, United States of America, Germany, and the United Kingdom. The study, which focuses on the training of qualified personnel at the operative, craft and technician levels, explains the effects of these trainings on industry and commerce. The study makes comparisons between countries, for example between “British” VET traditions in Australia and the United Kingdom, and the more “entrepreneurial” approaches of Japan and the United States [
11].
In order to examine the contribution of R&D investment expenditures to growth in Turkey, the Industrial Production Index for the 2005–2015 period and the variables of the shares of R&D expenditures in the gross domestic product were used in the research; as a result of the analysis of the empirical data, the causality towards growth has been determined [
12].
In the study titled “The Integrated Use of Entropy and MABAC Multi-Criteria Decision Making Methods in the Measurement of Innovation Performances of Countries”, the innovation performances of countries were evaluated under 10 different criteria by using the 2018 data from the European Innovation Scorecard. According to the findings obtained in the study, the countries are ranked according to their innovation performance [
13].
The study titled “The Importance of Vocational Education Institutions in Manufacturing Regions: Adding Content to a Broad Definition of Regional Innovation Systems”, which explores the importance of vocational education institutions in regional innovation systems and the role of qualified personnel in the implementation of new technologies in manufacturing industries, includes new training programs adapted for contemporary and future production. It explains how vocational education institutions are necessary for the competitiveness of producers in the development of programs [
14].
In the study named “Comparison of Innovation Performance of European Union Countries and Turkey with Multi-Criteria Decision Making Methods” by Oralhan and Büyüktürk [
15], the innovation performances of the countries were compared by using the TOPSIS and MOORA methods. According to the results of both methods, the ranking of the top three countries with the highest innovation performance has not changed, but the ranking of the three countries with the lowest innovation performance has changed. Therefore, the method used is important in terms of outputs.
In the study titled “Seçilmiş OECD Ülkelerinde Ar-Ge ve Ekonomik Büyüme: Panel Eşbütünleşme Yaklaşımından Yeni Kanıtlar” the relationship between R&D expenditures and economic growth of 20 OECD countries has been analyzed. The results obtained in the study are in line with the theory that R&D expenditures have a positive contribution to economic growth in the related countries [
16]. The results are in line with the findings of this study.
Many other studies have found a positive causal relationship between R&D expenditures and economic growth [
17,
18,
19].
In the study titled “Evaluation of Innovation Performances with ENTROPY-Based Gray Relational Analysis Method: The Example of G7 Group Countries”, the 2020 innovation performance of the G7 countries was evaluated. As a result of the study, the USA and the UK took the first two places as the countries with the highest innovation performance. It has been determined that there is a significant relationship between the results obtained by the entropy-based gray relational analysis method used in the study and the innovation performance values of the countries within the scope of the Global Innovation Index [
20].
In the study titled “The Measurement of Innovation Performance in OECD Countries”, the innovation performance of 37 OECD countries was evaluated by Data Envelopment Analysis. In the study, 21 sub-criteria under 7 headings in the Global Innovation Index 2019 reports were used [
21]. There are also many studies emphasizing the direct ratio between innovation and the increase in the number of patents and economic growth [
22,
23,
24,
25,
26].
The results of the study titled “The Role of Entrepreneurial Performance in Supporting Economic Development of Countries: An Empirical Approach”, in which it is stated that the Europe 2020 Strategy focuses on entrepreneurship as a key factor of economic growth, social progress and employment, shows that changes in entrepreneurial performance increase national competitiveness and economic growth highlights the important role it plays [
27].
As can be seen, there is a very rich portion of the literature which examines economic growth and development elements by using different methods. However, as the methods used differ, the results, especially the rankings, may also differ. For this reason, this study, conducted with multidimensional scaling analysis, will contribute to making comparisons of countries’ economic growth performances with different parameters, such as lifelong learning, R&D, innovation, and gross domestic product indicators.
3. Materials and Methods
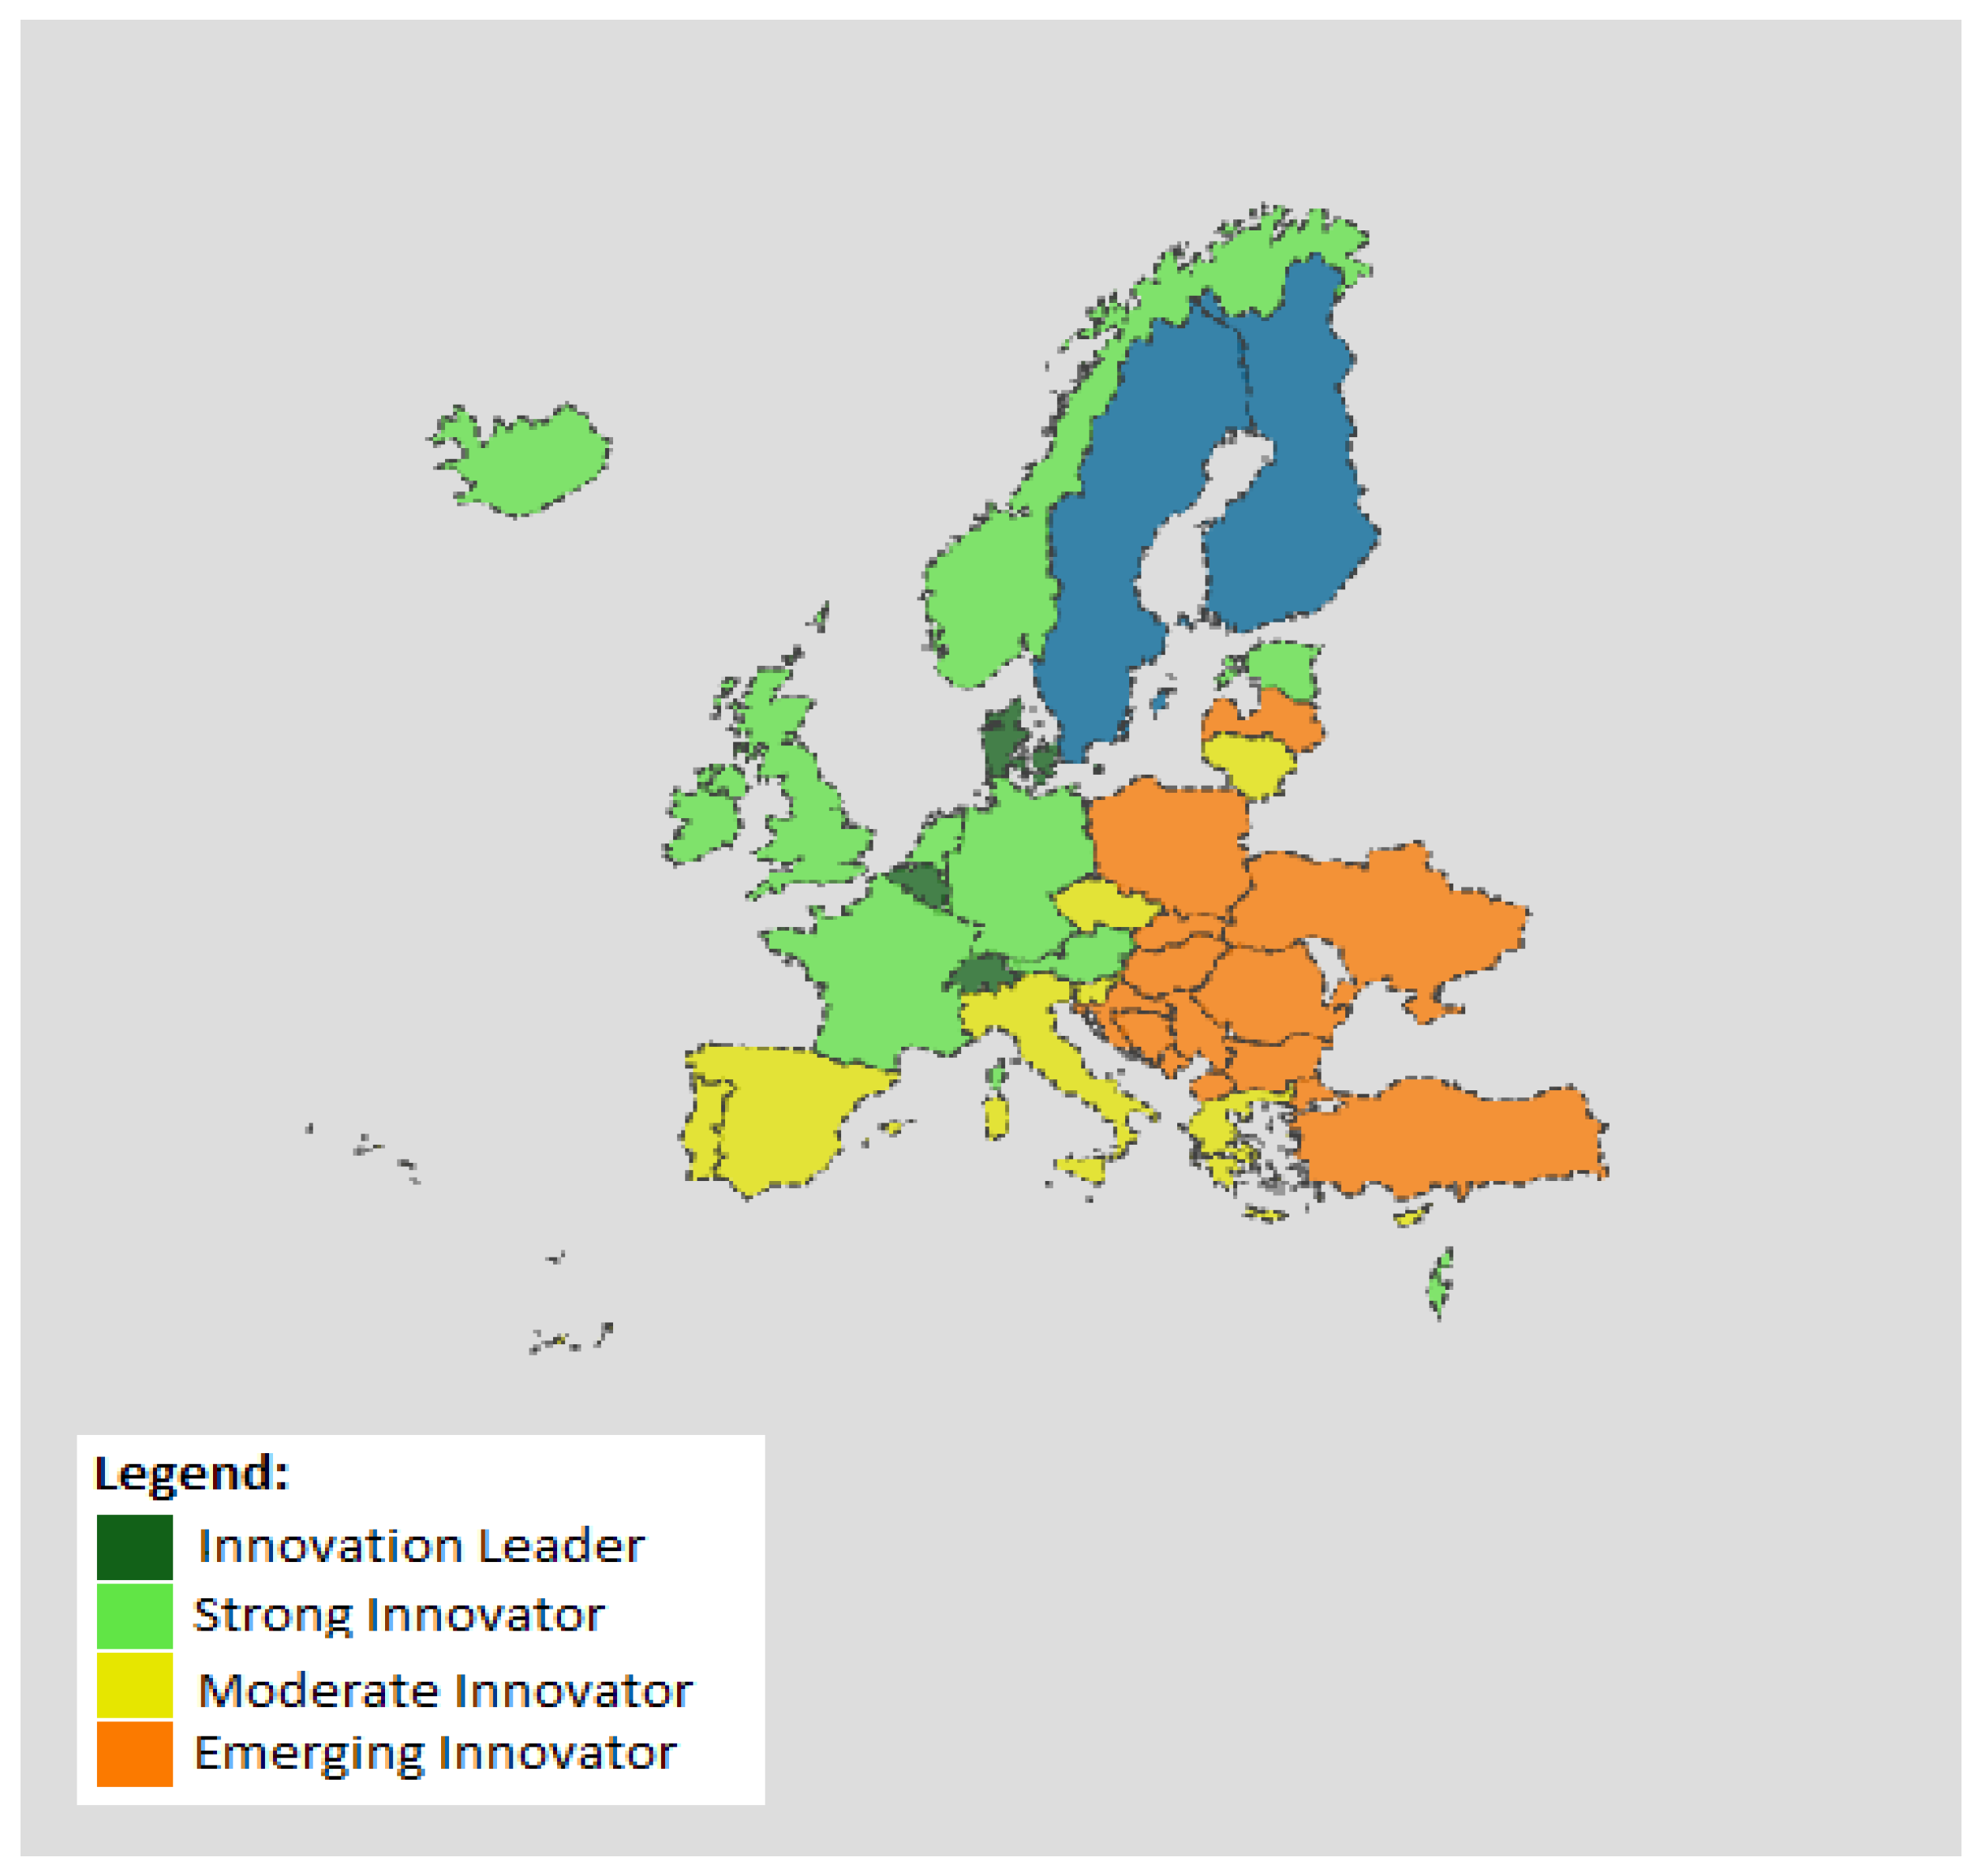
In the study, all the member states that became members of the European Union, the foundations of which were laid with the 1958 Treaty of Rome, and whose number has reached 27 today, are included. In addition, the data of countries, such as Ukraine, Switzerland, the United Kingdom, and Turkey, which are not members of the European Union; and the data of other countries, such as Norway, Iceland, and Israel, due to their socioeconomic relations with EU countries, are taken as reference.
The innovation and R&D performances of the countries were evaluated by using data from 27 countries that are members of the European Union and 11 countries that are not in the European Union, but most of them are candidates for the Union, which are included in the European Innovation Index Scoring Table for 2021 [
28] and Global Innovation Index [
29]. This study, aimed to evaluate the impact of lifelong learning intensity on national economies.
Figure 1, provides a clear introduction to the study area [
28].
Within the scope of the research, the index, values, and rankings, such as Countries’ Innovation Score—2021, Global Innovation Index 2021 (GII2021), population [
30], population involved in lifelong learning (regional), R&D expenditure in the business sector, gross domestic product (GDP), and GDP per capita (current USD) were created by using data confirmed by global institutions and organizations, such as the European Union (EU), International Monetary Fund (IMF) and the World Bank [
31,
32]. In this context, the Innovation Index of the Countries created by the European Union and the Global Innovation Index created by the World Intellectual Property Organization were used. The groups of countries as leaders, strong, moderate, and emerging are made according to their innovation performance. On the other hand, statistical data based on performance indicators (population, lifelong learning, R&D expenditures, domestic product, and per capita income, etc.), prepared and determined by the above-mentioned regional and global organizations/institutions, were taken as a basis.
Information on the criteria included in the European Innovation Index and also considered in this study to evaluate the innovation performance of countries is presented in
Table 1.
The data obtained from the evaluation criteria of the innovation indexes determined at the European and global level were analyzed with the SPSS package software. In order to determine the statistical tests to be used in the analysis of the data, the Kolmogrov—Smirnov Z test was used in the analysis of conformity to the normal distribution, and the Levene test was used to determine the homogeneity of the data. According to the results of these tests, the relations between the socio-economic indicators of the countries included in the research were analyzed with the Spearman-Brown rank differences correlation, while the relations between the socio-economic rankings of the countries were analyzed with the Pearson correlation. In the light of the criteria determined by the countries, descriptive statistics (mean, standard deviation, and minimum and maximum values) were used in the value averages.
In addition, the Mann—Whitney U test is used to compare the socio-economic indicators of the countries according to their European Union member status; in the comparison of the socio-economic rankings of the countries according to the European Union member statuses, a t-test was used for independent samples. When comparing the socio-economic indicators of countries according to their innovation performance, the Kruskal—Wallis H test is used; one-way analysis of variance (ANOVA) was used to compare the socio-economic rankings of countries according to their innovation performance. As a result of these tests, multiple comparisons were made with the Tukey test and Bonferroni test in order to determine between which subject groups the significant difference occurred. The significance level of 0.05 was taken as a basis in the analysis of the data.
4. Results
When the data obtained from the relations between the socio-economic indicators of the countries subject to the study are examined, it is seen that there is a high level of positive and significant relationship between the Population 2021 values of the countries and the GDP 2021 in billions of USD values (r = 0.84); there was also a moderate positive and significant relationship between R&D expenditure (r = 0.40). It is seen that there is a low-level negative and meaningless relationship between GDP per capita 2021 (r = −0.04) and population involved in lifelong learning (r = −0.03). One of the remarkable findings is that there is a high level of positive and significant relationship between the population involved in lifelong learning values of the countries and the GDP per capita 2021 values (r = 0.86).
The data in
Table 2, on the other hand, reflect the relationships between the socio-economic indicator rankings of the countries that are the subject of the research. When the aforementioned data are examined, it is seen that there is a low positive correlation (r = 0.04) between the population rank of the countries and the GDP growth rate, and a highly positive correlation with GDP rank (r = 0.84). There is a low level of negative correlation between GDP 2021 rank (r = −0.04), Global Innovation Index score (r = −0.17), and Countries’ Innovation Score (r = −0.04) and a highly negative correlation (r = −0.70) between countries’ GDP growth rates and GDP 2021 rank values. It is understood that there is a moderate positive relationship between the Global Innovation Index score (r = 0.61) and the Countries’ Innovation Score (r = 0.62). In addition, it is seen that there is a high level of positive correlation between the Global Innovation Index scores of the countries and the Countries’ Innovation Score (r = 0.75). Finally, the data obtained shed light on the high level of positive correlation between Countries’ Innovation Score and Global Innovation Index score (r = 0.91).
For the Population 2021 values of the 38 countries included in the study,
= 17,908,672.63; hs = 24,455,875.358; GDP 2021 (billions USD) = 605,654.39; hs = 956,260.895; GDP per capita 2021 = 38,206.7980; ss = 29,255.493; R&D expenditure = 73.1776; hs = 54.92811; population involved in lifelong learning = 120.1583; hs = 91.94866; Global Innovation Index score = 46,500; hs = 8.9221; Countries’ Innovation Score = 100.2411; ss = 37.62540 (
Table 3).
The Mann—Whitney U test was used to compare the socio-economic indicators of the countries included in the study according to their European Union member status. Analysis results for R&D expenditure [U = 10,000;
p < 0.05] show that the socio-economic indicators in the dimension differ significantly according to the European Union member statuses. Against this, other socio-economic indicators, including population 2021 [U = 139,000;
p > 0.05], GDP 2021 in billions USD [U = 121,000;
p > 0.05], GDP per capita 2021 [U = 111,000;
p > 0.05], and population involved in lifelong learning [U = 106,000;
p > 0.05] do not differ significantly according to European Union member statuses (
Table 4).
When an evaluation is made considering the mean rank, it is seen that the mean rank of the countries that are members of the European Union is higher in terms of all indicators related to the dimensions mentioned above. This means that European Union member countries have higher values of “Population 2021, GDP 2021 in billions USD, GDP per capita 2021, Population involved in lifelong learning and R&D Expenditure” (
Table 4).
The
t-test results for unrelated samples, which were conducted to determine whether the socio-economic indicator rankings of the countries have changed in the context of their European Union member status, are given in
Table 5.
According to the results of the analysis, the population rank of the countries included in the study [t(36) = −0.30;
p > 0.05]; GDP growth rate [t(36) = −1.45;
p > 0.05]; GDP rank [t(36) = −0.88;
p > 0.05], and GDP 2021 rank [t(36) = −0.99;
p > 0.05] shows that the rankings of the indicators in the dimensions do not differ significantly according to their European Union member statuses. This finding reveals that the European Union member status is not effective in the rankings of socio-economic indicators, such as population rank, GDP growth rate, GDP rank, and GDP 2021 rank of the researched countries (
Table 5).
The Kruskal—Wallis H test was used to compare the socio-economic indicators of the countries included in the study according to their innovation performance.
The results of the analysis of the countries included in the research are as follows. A GDP 2021 in billions USD [χ
2(3) = 8390;
p < 0.05], GDP per capita 2021 [χ
2(3) = 31,211;
p < 0.05], population involved in lifelong learning [χ
2(3) = 27.237;
p < 0.05], and R&D expenditure [χ
2(3) = 21,317;
p < 0.05] show that socio-economic indicators in dimensions differ significantly according to innovation performances. As a result of the multiple comparisons made with the Mann—Whitney U test, there was a significant difference in all dimensions; it is seen that this difference is between countries with innovation indicators “strong”, “leader”, and “moderate” and countries with the innovation indicator “emerging” (
Table 6).
When an evaluation is made by considering the average rank of the groups, the innovation indicators of the countries whose innovation indicators are “strong”, “leader”, and “moderate” in GDP 2021 in billions USD, GDP per capita 2021, population involved in lifelong learning, and R&D Expenditure dimensions are higher in “emerging” countries than other countries. Accordingly, it is understood that the mentioned socio-economic indicators of countries with “strong”, “leader”, and “moderate” innovation indicators are significantly higher (
Table 6).
One-way analysis of variance (ANOVA) was used for unrelated samples to compare the socio-economic indicator rankings of the countries included in the study according to their innovation performance.
Analysis of the results of GDP growth rate [F(3–37) = 0.05;
p < 0.05], GDP growth rate [F(3–37) = 8.79;
p < 0.05], GDP rank [F(3–37) = 3.32;
p < 0.05], GDP 2021 rank [F(3–37) = 61.11;
p < 0.05], Global Innovation Index score [F(3–37) = 44.10;
p < 0.05], and Countries’ Innovation Score [F(3–37) = 135.75;
p < 0.05] shows that there is a statistically significant difference in terms of innovation performance of countries (
Table 7).
As a result of the Bonferroni test, which was conducted to determine between which groups the differences between units occur, it is seen that there is a significant difference in all dimensions, between countries with “strong” innovation performance and countries with “emerging” and “moderate” innovation performances. Likewise, it is seen that there is a significant difference between countries with “leader” innovation performance and countries with “emerging” innovation performance. It is seen that there are differences among the countries with “emerging” performance. Accordingly, the countries with “strong” and “leader” innovation performances are compared to countries with “emerging” and “moderate” innovation performances in terms of GDP growth rate, GDP growth rate, GDP rank, GDP 2021 rank, Global Innovation Index score, and Countries’ Innovation Score indicators. It is understood that their rankings are significantly higher (
Table 8).
5. Discussion and Conclusions
Which factors come to the fore in the economic growth of countries? Which of these factors has the greatest impact on economic growth? We tried to find answers to the questions by using the multidimensional scaling analysis method. If we list the findings of this study conducted to find answers to the questions, it is revealed that there is a high level of positive and significant relationship between the populations and gross domestic product of the countries subject to the study.
As seen in the results obtained in the study by Türkmen [
16], in which the relationship between R&D expenditures and economic growth in 20 OECD countries was examined, it was seen that R&D expenditures had positive contributions to economic growth in EU member states and other countries that were the subject of this study.
In the study conducted by Taş et al. [
12] in order to examine the contribution of R&D investment expenditures to growth in Turkey, using the variables belonging to the Industrial Production Index for the period 2005–2015 and the shares of R&D expenditures in gross domestic product, it was found that, as a result of the analysis of empirical data, causality from R&D investments to economic growth has been determined in Turkey. The results obtained by Taş et al. show parallelism with the results of this study.
In the study conducted by Altıntaş and Mercan [
33] on 21 OECD countries, it was seen that there is a positive causal relationship between R&D expenditure and economic growth, as in many other studies [
17,
18,
19].
Another finding of the research is that there is a positive relationship between innovation performance and economic growth. It has been observed that innovation performance, which is an important output of entrepreneurship, has a significant relationship with gross domestic product. As it is known, one of the concrete reflections of the innovation phenomenon is the increase in the number of patents. This result supports many studies in the literature, such as Sinha [
22], Josheski, and Koteski [
23], Adak [
24], Türedi [
25], and Altıner and Toktaş [
26], emphasizing the direct ratio between the increase in the number of patents resulting from innovation and economic growth. As the justification for the causal relationship obtained, most of the countries examined should be among the leading economies of the world, and these countries should consider innovation as a part of their vision in addition to R&D in order to ensure sustainable economic growth.
In particular, the fact that sustainable development is based on innovation and sustainable entrepreneurship defines the entrepreneurship aspect of their country in the context of sustainable development and reveals the common characteristics of countries in an efficient way [
34].
Telatar and Terzi’s study [
35] on the relations between economic growth, population, and education found a negative causal relationship between economic growth and population and a positive causal relationship between the number of vocational high school graduates and economic growth. In this study, it has been determined that vocational education has a positive effect on economic growth by creating added value.
In this context, it has been seen in the study that there is a moderate positive and significant relationship between the expenditures made for research and development activities and the population of the country, and a low level negative and meaningless relationship between the population of the countries and the per capita income and the population in lifelong education. One of the notable findings is that there is a high level of positive and significant relationships between the population in lifelong learning and per capita income.
While there is a low-level positive relationship between the population rankings of the countries and the economic growth rate, it has been revealed that there is a high-level positive relationship between the population rankings of the countries and their GDP rankings. It has been observed that there is a high level of negative correlation between the GDP growth rates of the countries and the GDP 2021 rankings.
Comparing the socio-economic indicators of the countries included in the study according to their European Union member status, it shows that the expenditures made for research and development activities differ significantly according to the European Union member status. Against this, it has been observed that the socio-economic indicators of population, GDP, GDP per capita, and population in lifelong learning do not differ significantly according to European Union member status.
It has been revealed that the mean rank of the countries that are members of the European Union is higher. This shows that European Union member countries have higher values of “population, GDP, GDP per capita, population in lifelong learning and expenditures on research and development activities”.
In the evaluation made to determine whether the socio-economic indicator rankings of the countries have changed in the context of their European Union member statuses, it has been shown that the index rankings of the countries in terms of population ranking, GDP growth rate, and GDP ranking do not differ significantly according to the European Union member statuses. This finding reveals that the European Union member statuses are not effective in the rankings of socio-economic indicators, such as population ranking, GDP growth rate, and the GDP ranking of the countries subject to the research.
Comparing the socio-economic indicators of the countries included in the study according to their innovation performance, it can be seen that the socio-economic indicators of GDP, GDP per capita, population involved in lifelong learning and R&D expenditure differ significantly according to their innovation performance. As a result of the multiple comparisons, there was a significant difference in all dimensions; it has been observed that the innovation indicators are between the countries with “strong”, “leader”, and “moderate” statuses and the countries with the innovation indicator of “emerging”.
When an evaluation is made by considering the average rank of the groups, the innovation indicators of the countries whose innovation indicators are “strong”, “leader”, and “moderate” in GDP 2021 in billions USD, GDP per capita 2021, population involved in lifelong learning, and R&D expenditure dimensions are higher in “emerging”than other countries. Accordingly, it is understood that the mentioned socio-economic indicators of countries with “strong”, “leader”, and “moderate” innovation indicators are significantly higher.
Comparing the socio-economic indicator rankings of the countries included in the study according to their innovation performance, it has been shown that there is a statistically significant difference in terms of the innovation performance of the countries in the GDP growth rate and GDP rank dimensions. It has been observed that there is a significant difference between countries with “strong” innovation performance and countries with “emerging” and “moderate” innovation performance in all dimensions, as well as between countries with “leader” innovation performance and countries with “emerging” innovation performance. Accordingly, it has been observed that countries with “strong” and “leader” innovation performances have a significantly higher GDP growth rate and GDP rankings compared to countries with “emerging” and “moderate” innovation performances.
Vocational and technical education, lifelong learning, innovation activities, R&D studies, and the training of potential entrepreneurs that will drive them are factors that play an important role in the progress and development of countries. Countries that want to progress and develop should not refrain from making significant expenditures and allocating significant resources to increase the quality of human capital, to develop innovation activities, to make R&D studies result-oriented, and to increase efficiency. There is a Turkish proverb which means “throw out a sprat to catch a mackerel”. Countries should not ignore this fact. The findings of the research show that entrepreneurship, R&D, innovation and lifelong learning performances and investments in these subjects have a motivating effect on the development efforts of countries in the medium and long term.
We can define economic globalization as the “Compound Containers Environment” in the simplest sense. The E-27 and candidate countries are important part of that environment. The low level of aggregate demand, which is a natural reflection of the recession in trade and investments, is one of the main obstacles to global economic growth. To revive the desired goals of economic growth and development in the compound containers environment, the public should receive some more encouraging measures, such as tax exemption and simplification of bureaucratic processes, especially in R&D and innovation-based investments of the private sector.
Future studies on the elements of economic growth and development, policies implemented to increase the lifelong learning, entrepreneurship, R&D, and innovation performances of countries will focus on making up-to-date research on the constraints, obstacles, and solution proposals in front of countries, and producing applicable policies may be beneficial in terms of providing value added to the sustainable development efforts of these countries.


