Abstract
Drought is a natural hazard that stresses ecosystems, agricultural production, food security, and local economies. Given ongoing hydropower dam development in the Sesan and Srepok Basins, the two most dammed tributaries in the Lower Mekong Basin, characterizing baseline drought events and understanding how dams modify downstream flow is needed to manage water resources and mitigate drought effects. We used the Soil & Water Assessment Tool (SWAT) to estimate streamflow data from 2001 to 2019. For both rivers, we found that runoff varied, but contributed about 75% of streamflow, followed by shallow and deep groundwater, which contributed up to 25%. We used the Standardized Runoff Index to characterize drought and detected frequent, severe, and prolonged drought events in the two basins. Severe and prolonged droughts in the 2009–2011 and 2015–2016 periods corresponded to the occurrence of Typhoon Ketsana and the El Niño-Southern Oscillation. Streamflow alteration can be caused by climatic conditions and anthropogenic activities such as hydropower dam development and operations (e.g., the timing and magnitude of water releases). Results from this study can be used as a baseline to gauge potential future droughts and design appropriate drought management plans to preserve ecosystems and food security in the Lower Mekong Basin and its tributaries.
1. Introduction
Droughts are natural events that can be devastating for ecosystems, agriculture, food security, and economic production [1,2,3,4]. Droughts deplete reservoir storage and increase evapotranspiration so that water must be managed and allocated more tightly among competing uses [5,6]. In regulated rivers, dam operations may mediate or exacerbate drought, yet these relationships are not well understood in the Lower Mekong Basin and its major tributaries, which are undergoing rapid hydropower dam development.
The Mekong River flows through six countries in Asia. The Lower Mekong Basin (LMB), in particular, is characterized by rich biodiversity due to its large floodplain, and long and broad tributaries [7,8,9,10]. A major tributary system of the LMB is formed by the Sekong, Sesan, and Srepok Rivers (the 3S Basin), which contribute up to 25% of streamflow and sediment to the mainstem Mekong River [11]. This basin is currently experiencing hydrologic alteration due to rapid hydropower development [12]. The 3S Basin has 51 operational dams as of 2021. Of the rivers in the 3S Basin, the Sesan River is the most dammed, with 28 dams, followed by the Srepok River with 17 dams. These two rivers are the focus of our study (Figure 1). The Sekong River is also part of the 3S Basin and has the fewest dams [12]. The Sesan and Srepok Rivers originate from the central highland of Vietnam, with peak elevations ranging from 2000 to 2400 m [13], and flow through the northeastern mountain area of Cambodia to join and enter the Mekong River in Stung Treng Province. The Sesan Basin encompasses an area of 18,800 km2, which contains roughly 1 million people, and the Srepok River Basin has an area of 30,094 km2, which contains roughly 2.8 million people [14]. Most of the residents in the two basins are indigenous, live in rural areas, and produce crops such as paddy rice, coffee, and other agro-industrial crops [13,15]. The basins are influenced by seasonal monsoons, with distinct dry (November–April) and wet (May–October) seasons. The annual rainfall of the two rivers ranges from 1900 mm to 2000 mm [14].
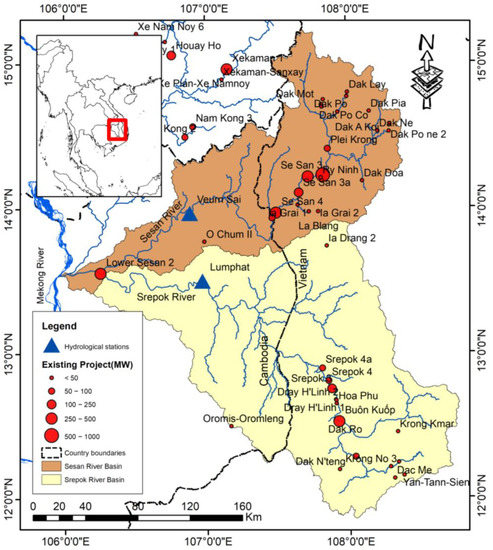
Figure 1.
The Sesan and Srepok Rivers with the Veurn Sai and Lumphat gauge stations. Dam data are from the Mekong Dam Monitor [16].
Research has shown that dams have significantly altered streamflow in the Mekong River by decreasing flow in the wet season and increasing flow in the dry season [17]. These altered flows have, consequently, led to low flow events and water quality changes in the Mekong Basin [18,19,20,21]. Assessing the effects of drought on streamflows versus changes from dam operations is needed to better manage reservoirs during drought, maintain adequate streamflows to preserve the unique biodiversity of the LMB, and understand the duration and severity of historical droughts.
To mitigate the impacts of drought, researchers have developed methods to detect drought using indices and models [22]. The Soil & Water Assessment Tool (SWAT), a rainfall-runoff model, has been widely implemented globally and in the LMB [23,24,25,26]. Similarly, the Standardized Runoff Index (SRI) is commonly used to characterize drought intensity, duration, and severity. Sam et al. [26] used SWAT to investigate climate change impacts from meteorological, hydrological, and agricultural drought in the Srepok River, using SRI, the standardized precipitation index, and the standardized soil moisture index to characterize drought. Akoko et al. [23] also used SWAT with SRI, the standardized precipitation index, and the standardized soil moisture index to assess drought impacts on hydrology, sediment, and nutrient loss with climate variability. Brouziyne et al. [24] applied SWAT to conduct drought analysis and project climatic change effects for a Mediterranean watershed.
Given ongoing hydropower dam development in the 3S Basin, the simulation of historical streamflow and characterizing baseline drought events in the Sesan and Srepok Rivers is needed to understand drought effects on river management and the sustainable development of hydropower. In this study, we use (1) the SWAT model to simulate 2001–2019 streamflow and quantify streamflow contributions from surface runoff, and shallow and deep groundwater, and (2) modeled data to characterize baseline drought events using SRI to show spatial and temporal drought trends.
2. Materials and Methods
2.1. River Flow Data
Flow data from the Veurn Sai gauge station on the Sesan River and the Lumphat gauge station on the Sekong River were provided by the Mekong River Commission (MRC). Streamflow from these gauge stations are daily time-series data from 2001 to 2019.
2.2. Soil & Water Assessment Tool (SWAT) Hydrologic Modeling
Monthly streamflow in the Sesan and Srepok Basins was estimated with SWAT for 2001–2019. SWAT was developed by the United States Department of Agriculture and is now widely used [27]. The model simulates hydrologic pathways of surface and groundwater [23,28,29,30]. SWAT is capable of estimating streamflow, sediment, nutrients, and pesticide yields in ungauged catchments [27,31]. Catchments are generally divided into sub-catchments, then further subdivided into hydrological response units (HRUs) with homogenous land use, topography, and soil type characterization [32]. HRUs are represented as a percentage of sub-catchment areas. Canopy interception may prevent rainfall from reaching the soil surface. However, rainwater that reaches the soil surface will either evapotranspirate, infiltrate into the soil layer and contribute to groundwater, or flow as runoff to streams [33].
SWAT is based on a water balance as depicted below:
where is soil water content (mm), t is time (days), is precipitation on day i (mm), is the surface runoff on day i (mm), is evapotranspiration on day i (mm), is water entering the vadose zone on day i (mm), and is groundwater flow to streams on day i (mm).
To simulate streamflow, SWAT requires geospatial input data, including a digital elevation model (DEM) of topography, soil types, and land use/land cover data. We used a 90 m resolution DEM (Table 1) with elevation ranging from 43 m to 2403 m above sea level, a gridded 250 m resolution soil map, and a gridded 250 m resolution land use/land cover map. We delineated 25 sub-catchments with an average area of 198,000 ha and 467 HRUs. Our model had 7 land uses, 5 soil types, and 5 slope categories (0–1%, 1–2%, 2–5%, 5–20%, and >20%) [10]. Meteorological input included daily precipitation (Table 1). We calibrated and validated the model with monthly observed streamflow from the Veurn Sai and Lumphat gauges of the Sesan and Srepok Rivers, respectively.

Table 1.
Data inputs and sources for the Sesan and Srepok Basin SWAT models.
2.3. SWAT Calibration, Validation and Perfomance Evaluation
We calibrated and validated SWAT using observed streamflow data from 2001 to 2010, as well as observed streamflow data from 2011 to 2019, respectively. We manually calibrated the model by altering sensitive model parameters, a process that is commonly used (see Arnold et al. [32], Ich et al. [38], Sok et al. [39], and Nair et al. [40]). For the Sesan River, we calibrated one parameter, “effective hydraulic conductivity in main channel alluvium,” while we adjusted eight sensitive parameters for the Srepok River model (see Appendix A, Table A1).
Model performance was evaluated using the coefficient of determination (R2), Nash-Sutcliffe efficiency (NSE), root mean standard deviation ratio (RSR), and percentage bias (PBIAS) [41]. R2 was used to evaluate the correlation between the simulated and observed flow data, NSE and RSR were used to evaluate extreme and peak values, and PBIAS was used to evaluate whether models over- or under-estimated streamflow [32,42].
The watershed conditions generated from the SWAT model were used to analyze hydrological pathways of water for each river. These pathways included surface runoff, shallow and deep groundwater, and total water yield.
2.4. Standardized Runoff Index and Drought Characterization
We used the Standardized Runoff Index (SRI) as an indicator of hydrologic drought because it is widely implemented [43]. We calculated SRI over a 12-month timescale to reflect a true drought, versus a few dry months, and to represent a time frame useful for water and land planning. The SRI values were computed from SWAT output based on the following equation:
where Vi is the cumulative runoff for each year i, and and SD are the mean and standard deviation of the monthly runoff, respectively. The index values range from −3.0, indicating the driest years, to 3.0, indicating the wettest years. For instance, an SRI value of −2 means that surface runoff is less than the mean with two times the variance (Table 2) [44]. Heatmaps and maps of SRI drought classification were used to visualize results. They were produced using Python JupyterLab with version 3.1.18.
Table 2.
Drought classification based on the Standardized Runoff Index (SRI).
3. Results
3.1. Streamflow Simulation and Hydrologic Pathways
The simulated SWAT streamflow matched observed flows well, with NSE ranging from 0.72 to 0.79 and R2 ranging from 0.75 to 0.81 (Table 3). In the Sesan River, surface runoff averaged 79% of streamflow, deep groundwater averaged 17%, and shallow groundwater (lateral flow) averaged 4%. Similarly, for the Srepok River, the largest average contributor to streamflow was surface runoff (71%), followed by deep groundwater (25%), and shallow groundwater (lateral flow) (4%) (Table 4, Figure 2 and Figure 3). The average annual streamflow at the outlet of the Sesan River was 1430 mm/year and was 929 mm/year at the outlet of the Srepok River.
Table 3.
SWAT performance for monthly Sesan River streamflow (Veurn Sai station) and Srepok River streamflow (Lumphat station). Dark green shading indicates very good model performance, light green shading indicates good model performance, and no shading indicates performance categorization was unavailable (Moriasi, et al. [45]).
Table 4.
Average annual surface runoff, and shallow and deep groundwater contributions to Sesan and Srepok River streamflow at the two gauging stations, with average annual 2001–2019 discharge at the river outlets.
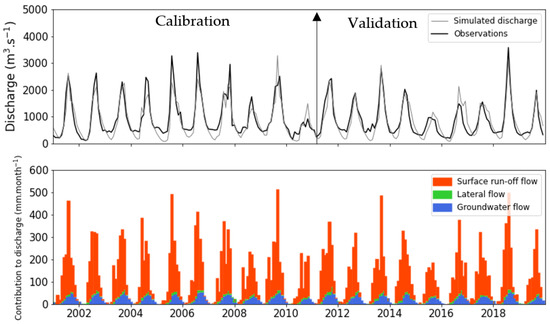
Figure 2.
Monthly observed and simulated discharge (top) and hydrologic pathways (bottom) that contribute to streamflow at the Veurn Sai station in the Sesan River.
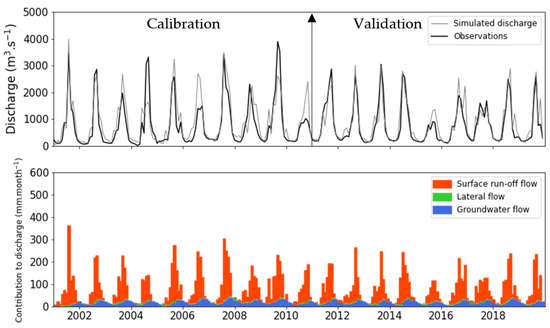
Figure 3.
Monthly observed and simulated discharge (top) and hydrologic pathways (bottom) that contribute to streamflow at the Lumphat station in the Srepok River.
Surface runoff in the Sesan and Srepok Basins was highly variable (Figure 2 and Figure 3). In the Sesan Basin, the average surface runoff across the study period was 1133 ± 313 mm. The wettest year occurred in 2009, when surface runoff was 1539 mm, followed by 2018 with 1319 mm, and 2014 with 1236 mm. The driest years occurred in 2005, 2010, and 2015. The year 2010 had the lowest annual surface runoff, with 695 mm (Figure 2). In the Srepok Basin, the average surface runoff across the study period was 663 ± 198 mm. The wettest year occurred in 2009, with annual surface runoff of 856 mm, followed by 2018 with 716 mm, and 2014 with 707 mm. Again, the driest years were 2005, 2010, and 2015, where 2015 had the lowest annual surface runoff at 385 mm (Figure 3).
3.2. Hydrologic Drought Characterisation
We identified two severe and extreme drought events from June 2010 to August 2011 and from June 2015 to April 2017, respectively (Figure 4). In 2010–2011, the drought lasted 13 months and, in 2015–2017, the drought lasted 22 months. Another moderate drought occurred from 2004 to 2005, with abnormally dry periods from 2008 to 2009 and from 2012 to 2014 (Figure 4 and Figure 5).
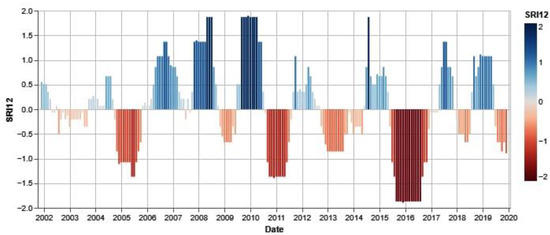
Figure 4.
The 12-month Standardized Runoff Index (SRI12) from 2001 to 2019 in the Sesan and Srepok River Basins.
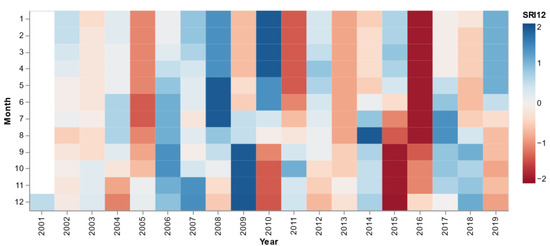
Figure 5.
The 12-month Standardized Runoff Index (SRI12) heatmap for the Sesan and Srepok Basins.
Transitions from wet and dry years can be abrupt (Figure 5). For example, 2009 started out dry, but transitioned to a very wet year, then 2010 transitioned from a wet year to severe drought. Dark blue shading indicates very wet conditions, while dark red shading indicates extreme drought.
Droughts were not uniform throughout the study basins (Figure 6). The 12-month accumulation periods of SRI ending in June 2010 (SRI12-June) showed wet-to-normal conditions. While the dry 12-month accumulation periods were just finishing in August 2010 (SRI12-August), only sub-catchments near the outlet of basins registered drought. However, the 12-month accumulating timescale ending in in November 2010 (SRI12-November) showed that severe drought was widespread throughout the Sesan and Srepok Basins. These space and time trends were even more pronounced during the extreme 2015–2016 drought (Figure 6).
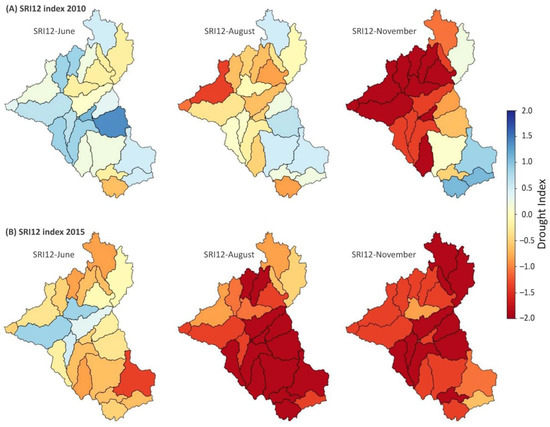
Figure 6.
Spatial distribution of 12-month drought events based on SRI indices in 2010 (A) and in 2015 (B). June is typically the beginning of the wet season and November is typically the end of wet season [2,46].
4. Discussion
4.1. SWAT Performance, Streamflow, and Drought in the Sesan and Srepok Rivers
SWAT performance was good to very good for the Sesan and Srepok Rivers, which is consistent with the model performance from other studies [10,26,30]. Surface runoff was the largest contributor to streamflow in the two rivers, with more minor groundwater contributions. This finding has also been previously reported [10,47,48,49]. Precipitation was the source of surface runoff [10,47], and maximum precipitation in headwater streams of the central Vietnamese Highlands and northeastern Cambodia can exceed 2000 mm per year [10].
Severe and extreme droughts were evident in the Sesan and Srepok Rivers, with three major droughts, thus far, in the 21st century. Twelve-month-or-longer drought events occurred from 2010 to 2011 and from 2015 to 2016 in the Sesan and Srepok Basins. Reduced precipitation across the Mekong Basin reduced surface runoff. Interestingly, these drought events spanned the dry and wet seasons (Figure 5 and Figure 6). Our findings reiterate those of other studies that reported droughts in 2010, including in Russia [50], the Amazon River Basin [51], and the broader Mekong River Basin [3].
From 2015 to 2016, the severe and prolonged drought was likely caused or exacerbated by El Niño conditions, which lead to very dry conditions in Southeast Asia [52,53]. The 2015–2016 drought is considered to be the longest and most severe drought to date in the Lower Mekong Basin [26,54]. Severe and prolonged droughts that were caused by El Niño conditions were typically preceded by wet periods caused by La Niña conditions. La Niña years increase precipitation and streamflow [53]. From 2009 to 2010, Typhoon Ketsana and another tropical storm flooded the 3S Basin and the LMB [55]. That year, there was a tremendous release of water from Yali Falls Dam in the upper Sesan Basin due to the very wet conditions [56].
4.2. Drought in Regulated Watersheds
Aside from drought, streamflow alteration is caused by anthropogenic activities such as hydropower dam operations and water extraction for agricultural irrigation [57]. For instance, summer baseflow in dammed rivers is generally higher than free-flowing rivers [18,58], which is the case for the Sesan River [12]. Li et al. [18] and Wild et al. [58] reported that dams have significantly decreased streamflow in the wet season in the Mekong River and Tonle Sap Lake, and increased streamflow in the dry season. Although 45 dams have been built in the Sesan and Srepok Basins, we observed no evidence that they mediated the effects of drought. Droughts that began in the dry season were likely to decrease streamflow despite the potential of the upstream dams to re-regulate flows. This may portend that hydropower generation and ecosystems that depend on consistent streamflows could be susceptible to the anticipated increase in drought intensification from climate change [6].
5. Implications and Conclusions
Prolonged droughts impact water resources, river ecosystems, agricultural productivity, food security, and the socio-economic status of local residents [1,2]. In the 3S Basin, the 2015–2016 drought reduced the production of cashews, pepper, and coffee by approximately 15% [59], which consequently impacted global supply chains [60], and affected the livelihoods of about two million people [59]. Given the global impacts of droughts, characterizing hydrological drought in the Srepok and Sesan Basins can provide baseline metrics for future droughts. Our findings of prolonged and severe droughts from 2009 to 2011 and from 2015 to 2016 corresponded to Typhoon Ketsana and El Niño conditions that reduced surface runoff in the 3S Basin. These findings can provide insights into future drought impact mitigations. For example, early drought warnings could reduce water demands or improve streamflow management to mitigate drought effects. Drought metrics, such as those provided here, can be used to support appropriate drought management and decision-making for sustainable river ecosystems, water resources, agricultural productivity, and food security in the 3S Basin and the Lower Mekong River.
Author Contributions
Conceptualization: K.C., R.S. and S.E.N.; methodology and formal analysis: K.C., R.K., S.V., V.M., T.S. and R.S.; investigation: T.S., C.O., S.V., R.S. and S.E.N.; data acquisition and curation: R.S., S.E.N. and K.C.; writing—original draft preparation: K.C.; writing—review and editing: K.C., R.K., T.S., S.V., V.M., C.O., R.S. and S.E.N.; visualization: K.C., V.M. and R.S.; supervision: T.S., C.O., S.V., R.S. and S.E.N.; funding acquisition: S.E.N. and R.S. All authors have read and agreed to the published version of the manuscript.
Funding
This research was funded by the United States Agency for International Development’s ‘Wonders of the Mekong’ Cooperative Agreement No: AID-OAA-A-16-00057.
Institutional Review Board Statement
Not applicable.
Informed Consent Statement
Not applicable.
Data Availability Statement
The data presented in this study are available in GitHub at https://github.com/menvuthy/3S_LMB_drought_data.
Acknowledgments
Authors would like to thank the Mekong River Commission for providing the database for our analysis. We are also grateful for the technical support by HydroMet and Disaster Management Lab, Institute of Technology of Cambodia, Phnom Penh, Cambodia. The first author would like to thank Department Water Resources of Engineering at Chulalongkorn University, Bangkok, Thailand for hosting his mobilized program for one semester with supported by Higher Education Improvement Project (HEIP-ITC). We would like to thank to Ich Ilan for facilitating the geospatial data collection.
Conflicts of Interest
The authors declare no conflict of interest.
Appendix A
Table A1.
SWAT calibration parameters, their ranges, and fitted values.
Table A1.
SWAT calibration parameters, their ranges, and fitted values.
| Parameter | Name | Input | Range | Fitted Value |
|---|---|---|---|---|
| V_CH_K2 | Effective hydraulic conductivity in main channel alluvium | .rte | 0–500 | 100 |
| V_RCHRG_DP | Deep aquifer percolation fraction | .gw | 0–1 | 0 |
| V_REVAPMN | shallow aquifer for “revap” to occur (mm) | .gw | 0–1000 | 0 |
| V_GW DELAY | Groundwater delay (days) | .gw | 0–500 | 150 |
| R_SOL_AWC | Available water capacity of the soil layer (mm/mm soil) | .gw | 0–1 | 0.25 |
| R_SOL-Z | Saturated hydraulic conductivity (mm/hour) | .sol | −0.25–0.25 | 0.2 |
| V_CANMIX | Maximum canopy storage | .hru | 0–100 | 100 |
| V_ESPO | Plant uptake compensation factor | .bsn | 0–1 | 0.3 |
| V_ESCO | Soil evaporation compensation factor | .bsn | 0–1 | 0.2 |
References
- Bond, N.R.; Lake, P.S.; Arthington, A.H. The impacts of drought on freshwater ecosystems: An Australian perspective. Hydrobiologia 2008, 600, 3–16. [Google Scholar] [CrossRef]
- Chhinh, N.; Millington, A.J.C. Drought monitoring for rice production in Cambodia. Climate 2015, 3, 792–811. [Google Scholar] [CrossRef]
- Hao, Z.; AghaKouchak, A.; Nakhjiri, N.; Farahmand, A. Global integrated drought monitoring and prediction system. Sci. Data 2014, 1, 140001. [Google Scholar] [CrossRef] [PubMed]
- Pimentel, D.; Berger, B.; Filiberto, D.; Newton, M.; Wolfe, B.; Karabinakis, E.; Clark, S.; Poon, E.; Abbett, E.; Nandagopal, S.J.B. Water resources: Agricultural and environmental issues. BioScience 2004, 54, 909–918. [Google Scholar] [CrossRef]
- Aghakouchak, A.; Feldman, D.; Stewardson, M.J.; Saphores, J.-D.; Grant, S.; Sanders, B. Australia’s Drought: Lessons for California. Science 2014, 343, 1430–1431. [Google Scholar] [CrossRef]
- Ficklin, D.L.; Null, S.E.; Abatzoglou, J.T.; Novick, K.A.; Myers, D.T. Hydrological intensification will increase the complexity of water resource management. Earth’s Future 2022, 10, e2021EF002487. [Google Scholar] [CrossRef]
- Rainboth, W.J.; Vidthayanon, C.; Yen, M.D. Fishes of the Greater Mekong Ecosystem with Species List and Photographic Atlas; University of Michigan: Ann Arbor, MI, USA, 2012. [Google Scholar]
- Sor, R.; Boets, P.; Chea, R.; Goethals, P.L.; Lek, S.J.L. Spatial organization of macroinvertebrate assemblages in the Lower Mekong Basin. Limnol.-Ecol. Manag. Inland Waters 2017, 64, 20–30. [Google Scholar] [CrossRef]
- WWF. Annual Report 2020 WWF-Cambodia; WWF-Cambodia: Kratie, Cambodia, 2020. [Google Scholar]
- Sok, T.; Oeurng, C.; Ich, I.; Sauvage, S.; Miguel Sánchez-Pérez, J. Assessment of hydrology and sediment yield in the Mekong River Basin using SWAT model. Water 2020, 12, 3503. [Google Scholar] [CrossRef]
- Commission, M.R. Overview of the Hydrology of the Mekong Basin; Mekong River Commission: Vientiane, Laos, 2005. [Google Scholar]
- Sor, R.; Ngor, P.B.; Lek, S.; Chann, K.; Khoeun, R.; Chandra, S.; Hogan, Z.S.; Null, S.E. Fish biodiversity declines with dam development: Implications for sustainable development. Sci. Rep. 2022. In Review, v3. [Google Scholar]
- Watt, B.J.I. Bangkok, Thailand, Strategic Priorities for Trans-Boundary Water Cooperation in the Sekong, Sesan and Sre Pok (3S) Basins. 2015. Available online: https://data.opendevelopmentmekong.net/library_record/strategic-priorities-for-trans-boundary-water-cooperation-in-the-sekong-sesan-and-sre-pok-3s-basins (accessed on 15 July 2020).
- MRC. Transboundary Water Resources Management Issues in the Sesan and Srepok River Basins; Mekong River Commission: Vientiane, Laos, 2017. [Google Scholar]
- ADB. Sesan, Sre Pok, and Sekong River Basins Development Study in Kingdom of Cambodia, Lao People’s Democratic Republic, and Socialist Republic of Viet Nam; ADB: Mandaluyong, Philippines, 2009. [Google Scholar]
- STIMSON Mekong Dam Monitor: An Open-Source Online Platform for Near-Real Time Monitoring of Dams and Environmental Impacts in the Mekong Basin. Available online: https://www.stimson.org/project/mekong-dam-monitor (accessed on 10 August 2021).
- Tha, T.; Chung, S.; Oeurng, C. Integrated modeling to assess flow changes due to future dam development and operation in Stung Sen River of Tonle Sap Lake Basin, Cambodia. J. Water Clim. Chang. 2020, 11, 1123–1133. [Google Scholar]
- Li, D.; Long, D.; Zhao, J.; Lu, H.; Hong, Y. Observed changes in flow regimes in the Mekong River basin. J. Hydrol. 2017, 551, 217–232. [Google Scholar] [CrossRef]
- Lu, X.X.; Li, S.; Kummu, M.; Padawangi, R.; Wang, J. Observed changes in the water flow at Chiang Saen in the lower Mekong: Impacts of Chinese dams? Quat. Int. 2014, 336, 145–157. [Google Scholar] [CrossRef]
- Null, S.E.; Farshid, A.; Goodrum, G.; Gray, C.A.; Lohani, S.; Morrisett, C.N.; Prudencio, L.; Sor, R. A Meta-Analysis of Environmental Tradeoffs of Hydropower Dams in the Sekong, Sesan, and Srepok (3S) Rivers of the Lower Mekong Basin. Water 2021, 13, 63. [Google Scholar] [CrossRef]
- Sor, R.; Ngor, P.B.; Soum, S.; Chandra, S.; Hogan, Z.S.; Null, S.E.J.W. Water Quality Degradation in the Lower Mekong Basin. Water 2021, 13, 1555. [Google Scholar] [CrossRef]
- Miao, C.; Zhang, Y.; Bai, X.; Qin, T. Insights into the Response of Perennial Ryegrass to Abiotic Stress: Underlying Survival Strategies and Adaptation Mechanisms. Life 2022, 12, 860. [Google Scholar] [CrossRef]
- Akoko, G.; Le, T.H.; Gomi, T.; Kato, T.J.W. A Review of SWAT Model Application in Africa. Water 2021, 13, 1313. [Google Scholar] [CrossRef]
- Brouziyne, Y.; Abouabdillah, A.; Chehbouni, A.; Hanich, L.; Bergaoui, K.; McDonnell, R.; Benaabidate, L.J.W. Assessing hydrological vulnerability to future droughts in a Mediterranean watershed: Combined indices-based and distributed modeling approaches. Water 2020, 12, 2333. [Google Scholar] [CrossRef]
- Qiu, J.; Shen, Z.; Xie, H. Drought impacts on hydrology and water quality under climate change. Sci. Total Environ. 2022, 858, 159854. [Google Scholar] [CrossRef]
- Sam, T.T.; Khoi, D.N.; Thao, N.T.T.; Nhi, P.T.T.; Quan, N.T.; Hoan, N.X.; Nguyen, V.T.J.W. Impact of climate change on meteorological, hydrological and agricultural droughts in the Lower Mekong River Basin: A case study of the Srepok Basin, Vietnam. Water Environ. J. 2019, 33, 547–559. [Google Scholar] [CrossRef]
- Arnold, J.G.; Bieger, K.; White, M.J.; Srinivasan, R.; Dunbar, J.A.; Allen, P.M. Use of decision tables to simulate management in SWAT+. Water 2018, 10, 713. [Google Scholar] [CrossRef]
- Ricci, G.F.; De Girolamo, A.M.; Abdelwahab, O.M.; Gentile, F. Development, Identifying sediment source areas in a Mediterranean watershed using the SWAT model. Land Degrad. Dev. 2018, 29, 1233–1248. [Google Scholar] [CrossRef]
- Oeurng, C.; Sauvage, S.; Sánchez-Pérez, J.-M. Assessment of hydrology, sediment and particulate organic carbon yield in a large agricultural catchment using the SWAT model. J. Hydrol. 2011, 401, 145–153. [Google Scholar] [CrossRef]
- Vu, M.; Raghavan, S.V.; Liong, S.Y.; Sciences, E.S. SWAT use of gridded observations for simulating runoff—A Vietnam river basin study. Hydrol. Earth Syst. Sci. 2012, 16, 2801–2811. [Google Scholar] [CrossRef]
- Wu, J.; Yen, H.; Arnold, J.G.; Yang, Y.E.; Cai, X.; White, M.J.; Santhi, C.; Miao, C.; Srinivasan, R. Development of reservoir operation functions in SWAT+ for national environmental assessments. J. Hydrol. 2020, 583, 124556. [Google Scholar] [CrossRef]
- Arnold, J.G.; Moriasi, D.N.; Gassman, P.W.; Abbaspour, K.C.; White, M.J.; Srinivasan, R.; Santhi, C.; Harmel, R.; Van Griensven, A.; Van Liew, M.W. SWAT: Model use, calibration, and validation. Trans. ASABE 2012, 55, 1491–1508. [Google Scholar] [CrossRef]
- Neitsch, S.L.; Arnold, J.G.; Kiniry, J.R.; Williams, J.R. Soil and Water Assessment Tool Theoretical Documentation Version 2009; Texas Water Resources Institute: College Station, TX, USA, 2011. [Google Scholar]
- Yamazaki, D.; Ikeshima, D.; Tawatari, R.; Yamaguchi, T.; O’Loughlin, F.; Neal, J.C.; Sampson, C.C.; Kanae, S.; Bates, P.D. A high-accuracy map of global terrain elevations. Geophys. Res. Lett. 2017, 44, 5844–5853. [Google Scholar] [CrossRef]
- Nachtergaele, F.O. The Future of the FAO Legend and the FAO/UNESCO Soil Map of the World. In Soil Classification; CRC Press: Boca Raton, FL, USA, 2002; pp. 147–156. [Google Scholar]
- Loveland, T.R.; Zhu, Z.; Ohlen, D.O.; Brown, J.F.; Reed, B.C.; Yang, L. An analysis of the IGBP global land-cover characterization process. Photogramm. Eng. Remote Sens. 1999, 65, 1021–1032. [Google Scholar]
- Kummerow, C.; Barnes, W.; Kozu, T.; Shiue, J.; Simpson, J. The tropical rainfall measuring mission (TRMM) sensor package. J. Atmos. Ocean. Technol. 1998, 15, 809–817. [Google Scholar] [CrossRef]
- Ich, I.; Sok, T.; Kaing, V.; Try, S.; Chan, R.; Oeurng, C. Climate change impact on water balance and hydrological extremes in the Lower Mekong Basin: A case study of Prek Thnot River Basin, Cambodia. J. Water Clim. Chang. 2022, 13, 2911–2939. [Google Scholar] [CrossRef]
- Sok, T.; Ich, I.; Tes, D.; Chan, R.; Try, S.; Song, L.; Ket, P.; Khem, S.; Oeurng, C. Change in Hydrological Regimes and Extremes from the Impact of Climate Change in the Largest Tributary of the Tonle Sap Lake Basin. Water 2022, 14, 1426. [Google Scholar] [CrossRef]
- Nair, S.S.; King, K.W.; Witter, J.D.; Sohngen, B.L.; Fausey, N.R. Importance of crop yield in calibrating watershed water quality simulation tools 1. JAWRA J. Am. Water Resour. Assoc. 2011, 47, 1285–1297. [Google Scholar] [CrossRef]
- Krause, P.; Boyle, D.P.; Bäse, F. Comparison of different efficiency criteria for hydrological model assessment. Adv. Geosci. 2005, 5, 89–97. [Google Scholar] [CrossRef]
- Abbaspour, K.C.; Rouholahnejad, E.; Vaghefi, S.; Srinivasan, R.; Yang, H.; Kløve, B. A continental-scale hydrology and water quality model for Europe: Calibration and uncertainty of a high-resolution large-scale SWAT model. J. Hydrol. 2015, 524, 733–752. [Google Scholar] [CrossRef]
- Farahmand, A.; AghaKouchak, A. A generalized framework for deriving nonparametric standardized drought indicators. Adv. Water Resour. 2015, 76, 140–145. [Google Scholar] [CrossRef]
- McKee, T.B.; Doesken, N.J.; Kleist, J. The Relationship of Drought Frequency and Duration to Time Scales. In Proceedings of the 8th Conference on Applied Climatology, Anaheim, CA, USA, 17–22 January 1993; pp. 179–183. [Google Scholar]
- Moriasi, D.N.; Arnold, J.G.; Van Liew, M.W.; Bingner, R.L.; Harmel, R.D.; Veith, T.L. Model Evaluation Guidelines for Systematic Quantification of Accuracy in Watershed Simulations. Trans. ASABE 2007, 50, 885–900. [Google Scholar] [CrossRef]
- Helmers, K.; Jegillos, S. Linkage between Flood and Drought Disasters and Cambodian Rural Livelihoods and Food Security: How Can the CRC Community Disaster Preparedness Program Further Enhance Livelihood and Food Security of Cambodian Rural People in the Face of Natural Disaster; DiPECHO: Phnom Penh, Cmbodia, 2004. [Google Scholar]
- Cao, L.; Zhang, Y.; Shi, Y. Climate change effect on hydrological processes over the Yangtze River basin. Quat. Int. 2011, 244, 202–210. [Google Scholar] [CrossRef]
- Oeurng, C.; Cochrane, T.A.; Arias, M.E.; Shrestha, B.; Piman, T. Assessment of changes in riverine nitrate in the Sesan, Srepok and Sekong tributaries of the Lower Mekong River Basin. J. Hydrol. Reg. Stud. 2016, 8, 95–111. [Google Scholar] [CrossRef]
- Putthividhya, A.; Laonamsai, J. Hydrological assessment using stable isotope fingerprinting technique in the Upper Chao Phraya river basin. Lowl. Technol. Int. 2017, 19, 27–40. [Google Scholar]
- Wegren, S.K. Food security and Russia’s 2010 drought. Eurasian Geogr. Econ. 2011, 52, 140–156. [Google Scholar] [CrossRef]
- Lewis, S.L.; Brando, P.M.; Phillips, O.L.; Van Der Heijden, G.M.; Nepstad, D. The 2010 amazon drought. Science 2011, 331, 554. [Google Scholar] [CrossRef]
- Rasmusson, E.M.; Wallace, J.M. Meteorological aspects of the El Nino/southern oscillation. Science 1983, 222, 1195–1202. [Google Scholar] [CrossRef] [PubMed]
- Sutton, W.R.; Srivastava, J.P.; Koo, J.; Vasileiou, I.; Pradesha, A.A. Striking a Balance: Managing el NInño and la Niña in Cambodia’s Agriculture; 132065; World Bank: Washington, DC, USA, 2019. [Google Scholar]
- MRC. Annual Report 2019, Part 1, Progress and Achievements; Mekong River Commission: Vientiane, Laos, 2019. [Google Scholar]
- MRC. Annual Mekong Flood Report 2009; Mekong River Commission, Office of the Secretariat in Phnom Penh: Vientiane, Laos, 2010; 80p. [Google Scholar]
- Hai, T.T.; Dong, D.T.T.; Tu, D.T.; Van Hue, L.T.; Trung, T.C. Hydropower dam Development and Local Communities Livelihoods: A Case of Yali Hydropower Project, Viet Nam; 2013. Available online: https://wle-mekong.cgiar.org/download/all/mk4-water-governance/MK4_Dam%20Management%20and%20Livelihoods%20Vietnam_Document.pdf (accessed on 1 July 2022).
- Oeurng, C.; Sok, T. Assessing changes in flow and water quality emerging from hydropower development and operation in the Sesan River Basin of the Lower Mekong Region. Sustain. Water Resour. Manag. 2020, 6, 27. [Google Scholar]
- Wild, T.B.; Reed, P.M.; Loucks, D.P.; Mallen-Cooper, M.; Jensen, E.D. Balancing hydropower development and ecological impacts in the Mekong: Tradeoffs for Sambor Mega Dam. J. Water Resour. Plan. Manag. 2019, 2, 05018019. [Google Scholar] [CrossRef]
- UNDP. Vietnam Drought and Saltwater Intrusion Transitioning from Emergency to Recovery; UNDP: New York, NY, USA, 2016. [Google Scholar]
- Sowcharoensuk, C. Severe Drought: Agriculture Sector Takes Direct Hit and spillOVEREFFECTS on Manufacturing Supply Chains; Krungsri Research: Bangkok, Thailand, 2020. [Google Scholar]


Publisher’s Note: MDPI stays neutral with regard to jurisdictional claims in published maps and institutional affiliations. |
© 2022 by the authors. Licensee MDPI, Basel, Switzerland. This article is an open access article distributed under the terms and conditions of the Creative Commons Attribution (CC BY) license (https://creativecommons.org/licenses/by/4.0/).