Article

Sustainability Investigation in the Building Cement Production System Based on the LCA-Emergy Method

1
School of Civil and Ocean Engineering, Jiangsu Ocean University, Lianyungang 222005, China
2
School of Civil Engineering and Architecture, Jiangsu University of Science and Technology, Zhenjiang 212100, China
3
M.E. Rinker, Sr. School of Construction Management, College of Design, Construction and Planning, University of Florida, Gainesville, FL 32603, USA
4
School of Design Art, Lanzhou University of Technology, Lanzhou 730050, China
5
School of Art and Design, Yangzhou University, Yangzhou 225009, China
*
Author to whom correspondence should be addressed.
Sustainability 2022, 14(24), 16380; https://doi.org/10.3390/su142416380
Submission received: 7 November 2022 / Revised: 3 December 2022 / Accepted: 5 December 2022 / Published: 7 December 2022
(This article belongs to the Special Issue Life Cycle Assessment in Sustainable Products Development)

Abstract

:
As one of the highest energy and resource consumption industries in China, discussion on the sustainability of the cement production system has great significance. This study conducted sustainable calculations and analyses for cement production systems based on the emergy method. This study also considers the sustainability impact of clean energy on the overall cement production system. Through a series of sustainable indicator measurements, the results prove that: (1) the two primary sections, non-renewable resource and non-renewable energy, contribute 88.6% and 11.1% of the emergy proportion, respectively; (2) the emergy sustainability indicator (ESI) was only 0.058, which is significantly less than the standard; (3) through the analysis of eight hypotheses, a very small change between the absolute values was found, which demonstrates that the sensitivity changes are within acceptable limits for the cement production system; and (4) by integrating the biological power generation subsystem, sustainability has been optimized in the cement production system. Finally, two ameliorated strategies are discussed in this paper for the better sustainability performance of the cement production system in the future.

1. Introduction

The cement industry plays a crucial role in infrastructure construction. However, it is also responsible for serious environmental pollution and resource consumption in China. According to a national authority document from China [1], in 2021, China produced 2.363 billion tons of cement. The enormous amount of cement produced has resulted in significant pollution. Taking nitrogen oxide exhaust as an example, the cement produced in 2021 emitted 98,200 tons of nitrogen oxide, which led to huge environmental damage. In order to improve this situation, the sustainability of nitrogen oxide exhaust should be analyzed in the cement production system.
The industrial system of cement production is a tremendous and complicated process, and sustainable research is also a concern for many scholars. Through literature reviews, researchers focus on and have interest in aspects such as sustainable performance [2,3,4], materials for sustainability [5,6,7], sustainable production processes [8], sustainable application [9], environmental sustainability [10,11], etc.
As an ecological economic concept, the emergy approach has provided a new perspective for sustainability; based on its inherent advantages, it has been used in a wide range of applications, including national sustainability assessments [12], city sustainability studies [13,14,15,16], industry evaluations [17,18,19], building system research [20,21], water system protection directions [22,23,24], material fields [25,26,27], waste areas [28], etc. For example, the world coastal ecosystem was chosen to assess sustainability based on the emergy method [12]. By relying on the integration of the emergy approach and ecological footprint method, the ecological security of Beijing city has been assessed [13]. From the aspect of material circulation, an emergy assessment of Taipei’s urban construction has been conducted [14]. Through the emergy and slack-based model, the urban metabolism in Beijing city has been studied [15]. Emergy methods have been applied in three areas, including peri-urbanization, land teleconnections, and the equality of ecological exchange [16]. On account of sustainability and ecological efficiency, a solar power plant was selected for a quantitative assessment study [17]. An emergy evaluation has been conducted in one mining system to explore the effects of sustainability [18]. Similarly, some scholars have applied emergy theory to power plant systems for their sustainability assessment [19]. Similarly, emergy theory has been applied to the building system. Bahareh et al. executed an uncertainties analysis based on the emergy method by using the example of a paved road system [20]. By relying on an emergy ternary diagram, a sustainability comparison has been performed in the building system [21]. A cross-study between the water conservation field and the emergy approach was also conducted. Shaozhuo et al. carried out a sustainability assessment of the Erhai Lake Basin based on emergy theory [22]. By taking a new sewage treatment factory as a case, its entire emergy indicators have been studied for their sustainability effects [23]. By integrating the hybrid neural network and emergy framework, a dynamic comparison sustainability study has been realized in two types of wastewater treatment systems [24]. Through analysis of emergy indexes, the sustainability degree of specific materials has been applied to optimize the selection of materials [25]. Based on a comprehensive life cycle assessment and sustainability evaluation, sewer pipe materials were selected [26]. According to the emergy analysis of the clay brick manufacturing system, the ecological impact was explained [27]. The effect of waste slag reuse has been evaluated in the secondary lead industry using the emergy method [28].
The sustainability of the cement production system was evaluated by Wei et al. based on the emergy method [29]. Using emergy and ecological footprint frameworks, a diverse cement production system was selected to discuss environmental evaluation [30]. By taking an independent cement plant as an example, the emergy method was adopted and used to assess sustainability [31]. Cement production has been studied through the unit emergy values perspective [32]. A comparative investigation was conducted when sewage sludge reduction and reuse in clinker production were considered for their eco-industrial effect [33]. Through two kinds of comparison, the sustainability of cement pavement and brick pavement were analyzed [34]. By integrating a heat recovery power generation, an emergy analysis was utilized for an economic evaluation [35]. From a supply chain perspective, a sustainable assessment of the cement production system was conducted [36].
However, partially imperfect sections should be supplemented for a better sustainability assessment in the cement production system, involving: (1) old emergy calculation baselines: only a few articles use the latest emergy baseline to calculate emergy for sustainability assessment; (2) lack of clean energy alternative analysis for the impact on the cement production system; (3) the effectiveness of targeted improvement measures have not been verified; (4) insufficient sensitivity results in the calculation and analysis of the cement production system using the emergy methodology.
This paper aims to confirm the sustainability status of the cement production based on the emergy method. Three questions aim to be solved and discussed for the cement production system. Firstly, the overall sustainability of the cement plant should have a quantitative evaluation, especially the main emergy supply section. Secondly, the implementation and evaluation of sensitivity links should be considered, as it is related to the validity of the entire evaluation results. Thirdly, targeted improvements need to be implemented and discussed to determine their actual effects.
Finally, the paper structure is organized as follows: After the Introduction, Section 2 illustrates the data and methods, including the data source, cement production system introduction, emergy method, etc. Section 3 shows the main emergy calculated processes and sustainable emergy analysis. Section 4 discusses preventive strategies and positive suggestions. At last, the conclusion is displayed in Section 5.

2. Materials and Methods

2.1. Research Framework

In Figure 1, the research framework is portrayed. Depending on the emergy method, the sustainable state was studied in the cement production system. Two scenarios should be compared. On the one hand, Scenario (A) is the basic system, including the renewable and non-renewable resource inputs. Compared with Scenario (A), Scenario (B) is a comprehensive system, which integrates a clean energy subsystem. Based on the contrastive analysis, their sustainability results were assessed and analyzed. Finally, the positive strategies were presented and analyzed for better sustainability in the cement production system.

2.2. Cement Production System

We selected a typical cement production plant as the study target (in Figure 2). Cement production is a complex systematic process involving a series of core devices, such as a rotary kiln, cement mill, chimney, baghouse, homogenizing silo, raw mill, cyclone, electrostatic precipitator, and preheater, among other items. Among them, the rotary kiln is a vital piece of equipment, which is the key to the success of the cement preparation. Figure 2 demonstrates the specific processes of cement production.
By collecting data from the factories in the actual site and publicly available production reports, the main data were obtained to support this study.
In the cement production process, three types of waste gas will be generated and discharged, including dust, sulfur dioxide (SO2), and nitrogen oxides (NOx), which impact human health and the sustainability of the system, causing issues such as respiratory disease and unbalanced ecological conditions. To confirm the human health and ecological harm impacts, the ecological service and economic loss calculations must be considered and computed in this study. According to the national mandatory standard in China (GB 3095-2012), the standard emission rates are 35 mg/m3 of dust, 50 mg/m3 of SO2, and 80 mg/m3 of NOx; however, current emissions are much higher than these standards, which were recorded at 110 mg/m3 of dust, 250 mg/m3 of SO2, and 300 mg/m3 of NOx, respectively.
The DALY data has been displayed in Table 1. DALY represents the disability-adjusted life year.
(1)
Economic loss accounting
In this study, economic loss accounting should be computed in the cement treatment system. According to the related reference [23], the human health effect can be evaluated based on Equation (1).
T = M j × D A L Y j × δ
where T represents the emergy loss due to human health effects (the unit is sej/a), J is the type of gas, including dust, SO2, and NOx, and Mj demonstrates the exhaust value. The DALY details have been shown in Table 1. δ is the emergy value to humans per year (1.68 × 10¹⁶ sej/a·person).
(2)
Ecological services calculation
In the ecological system of cement production, ecological services need to be assessed for the negative impact, especially in consideration of the three types of exhaust gas (dust, SO2, and NOx). To complete the calculation, two steps should be progressed. Firstly, the exhaust gas value should be obtained by Equation (2).
M j = α × N j × 10 6 X j
where M j is the dilution air amount (kg/a), j represents the gas types, α is the air density (1.23 kg/m3), N j represents the annual air pollutants in the cement production (kg/a), and X j represents the acceptable concentrations of the three exhaust gases, which are dust (0.08 mg/m3), SO2 (0.02 mg/m3) and NOx (0.05 mg/m3) [23].
Secondly, the ecological service emergy can be obtained by Equation (3).
Z a i r , j = 0.5 × M j × v 2 × P w
where Z a i r , j represents the environmental service emergy (sej/a), v represents the annual average wind speed (3.25 m/s), and P w is the transformity of wind (1.86 × 10³ sej/J based on the latest baseline).
(3)
Wastewater emergy calculation
A cement production system generates a lot of wastewater, and the wastewater emergy cannot be ignored. The specific calculation procedures can be performed based on Equations (4) and (5).
F i = k × U i × 10 3 c i Q w
where F i is the freshwater consumption amount (kg/a), k represents the water density (1000 kg/m3), U i shows the annual value of wastewater treatment capacity (8.7 × 10³ t/a), c i uncovers the acceptable concentration (15 mg/L), and Q w is the discharged wastewater for the cement production system (6.39 m3/a).
Therefore, the wastewater emergy can be obtained based on Equation (5).
E w w = F i × D j
where F i displays the wastewater emergy (sej/yr) and D j is the transformity of surface runoff in China (2.85 × 10⁷ sej/kg).
(4)
Sludge waste emergy calculation
In the process of cement production, a large amount of sludge is produced, and their emergy impact needs to be considered. Equation (6) has been selected for the emergy calculation.
S = R s × U s × V s
where S is the sludge waste emergy, R s is the dry sludge (2.9 × 10⁶ t/a), U s is the used land for landfill (3.91 × 10⁴ t/ha), and V s is the transformity of local land (0.8 × 10¹⁵ sej/ha based on the latest baseline).

2.3. Emergy Analysis Method

2.3.1. Emergy Introduction

From the start, emergy was used to evaluate the ecological system based on solar embodied energy. After continuous developments, emergy theory has developed into an important evaluation method for system assessment. Emergy is defined as the available energy that can be obtained and calculated by transformations to directly and indirectly be used for a product or service [37]. By focusing on the natural selection of a system, it explicates the phenomenon: how sustainable the particular system is. This theory divides the whole system into different energy and matter systems for comparison and further identifies the quantitative sustainability. Compared with other environmental assessment tools, it defines the ability to utilize available energy types for the target system. More importantly, it can also compare natural and artificial systems on a unified platform through the energy transformation process.
All types of energy can be converted into emergy based on transformity, and the unit utilized is solar emjoule (sej). For example, a product or service can be calculated by the multiplication of transformity and available energy quantity. The calculated equation can be expressed by (7):
R e m e r g y = T U e v s × N
where R e m e r g y is the holistic emergy value, T U e v s is the transformity or unit emergy value of each unit matter (a product or service), and N is the available energy output.
Compared with the embodied energy concept, the emergy approach expands the study boundary for the system, which includes nature flows (sun, wind, rain, heat, and tidal energy) and material flows. All input flows can be divided into renewable resources and non-renewable energy and resources to support the system. In this study, the geobiosphere global emergy baseline was selected, which 12 × 1024 sej/yr [38]. Lastly, a set of appropriate indicators were utilized in this study, such as the emergy yield ratio (EYR), environmental loading ratio (ELR), and emergy sustainability index (ESI), among others.

2.3.2. Emergy Diagram

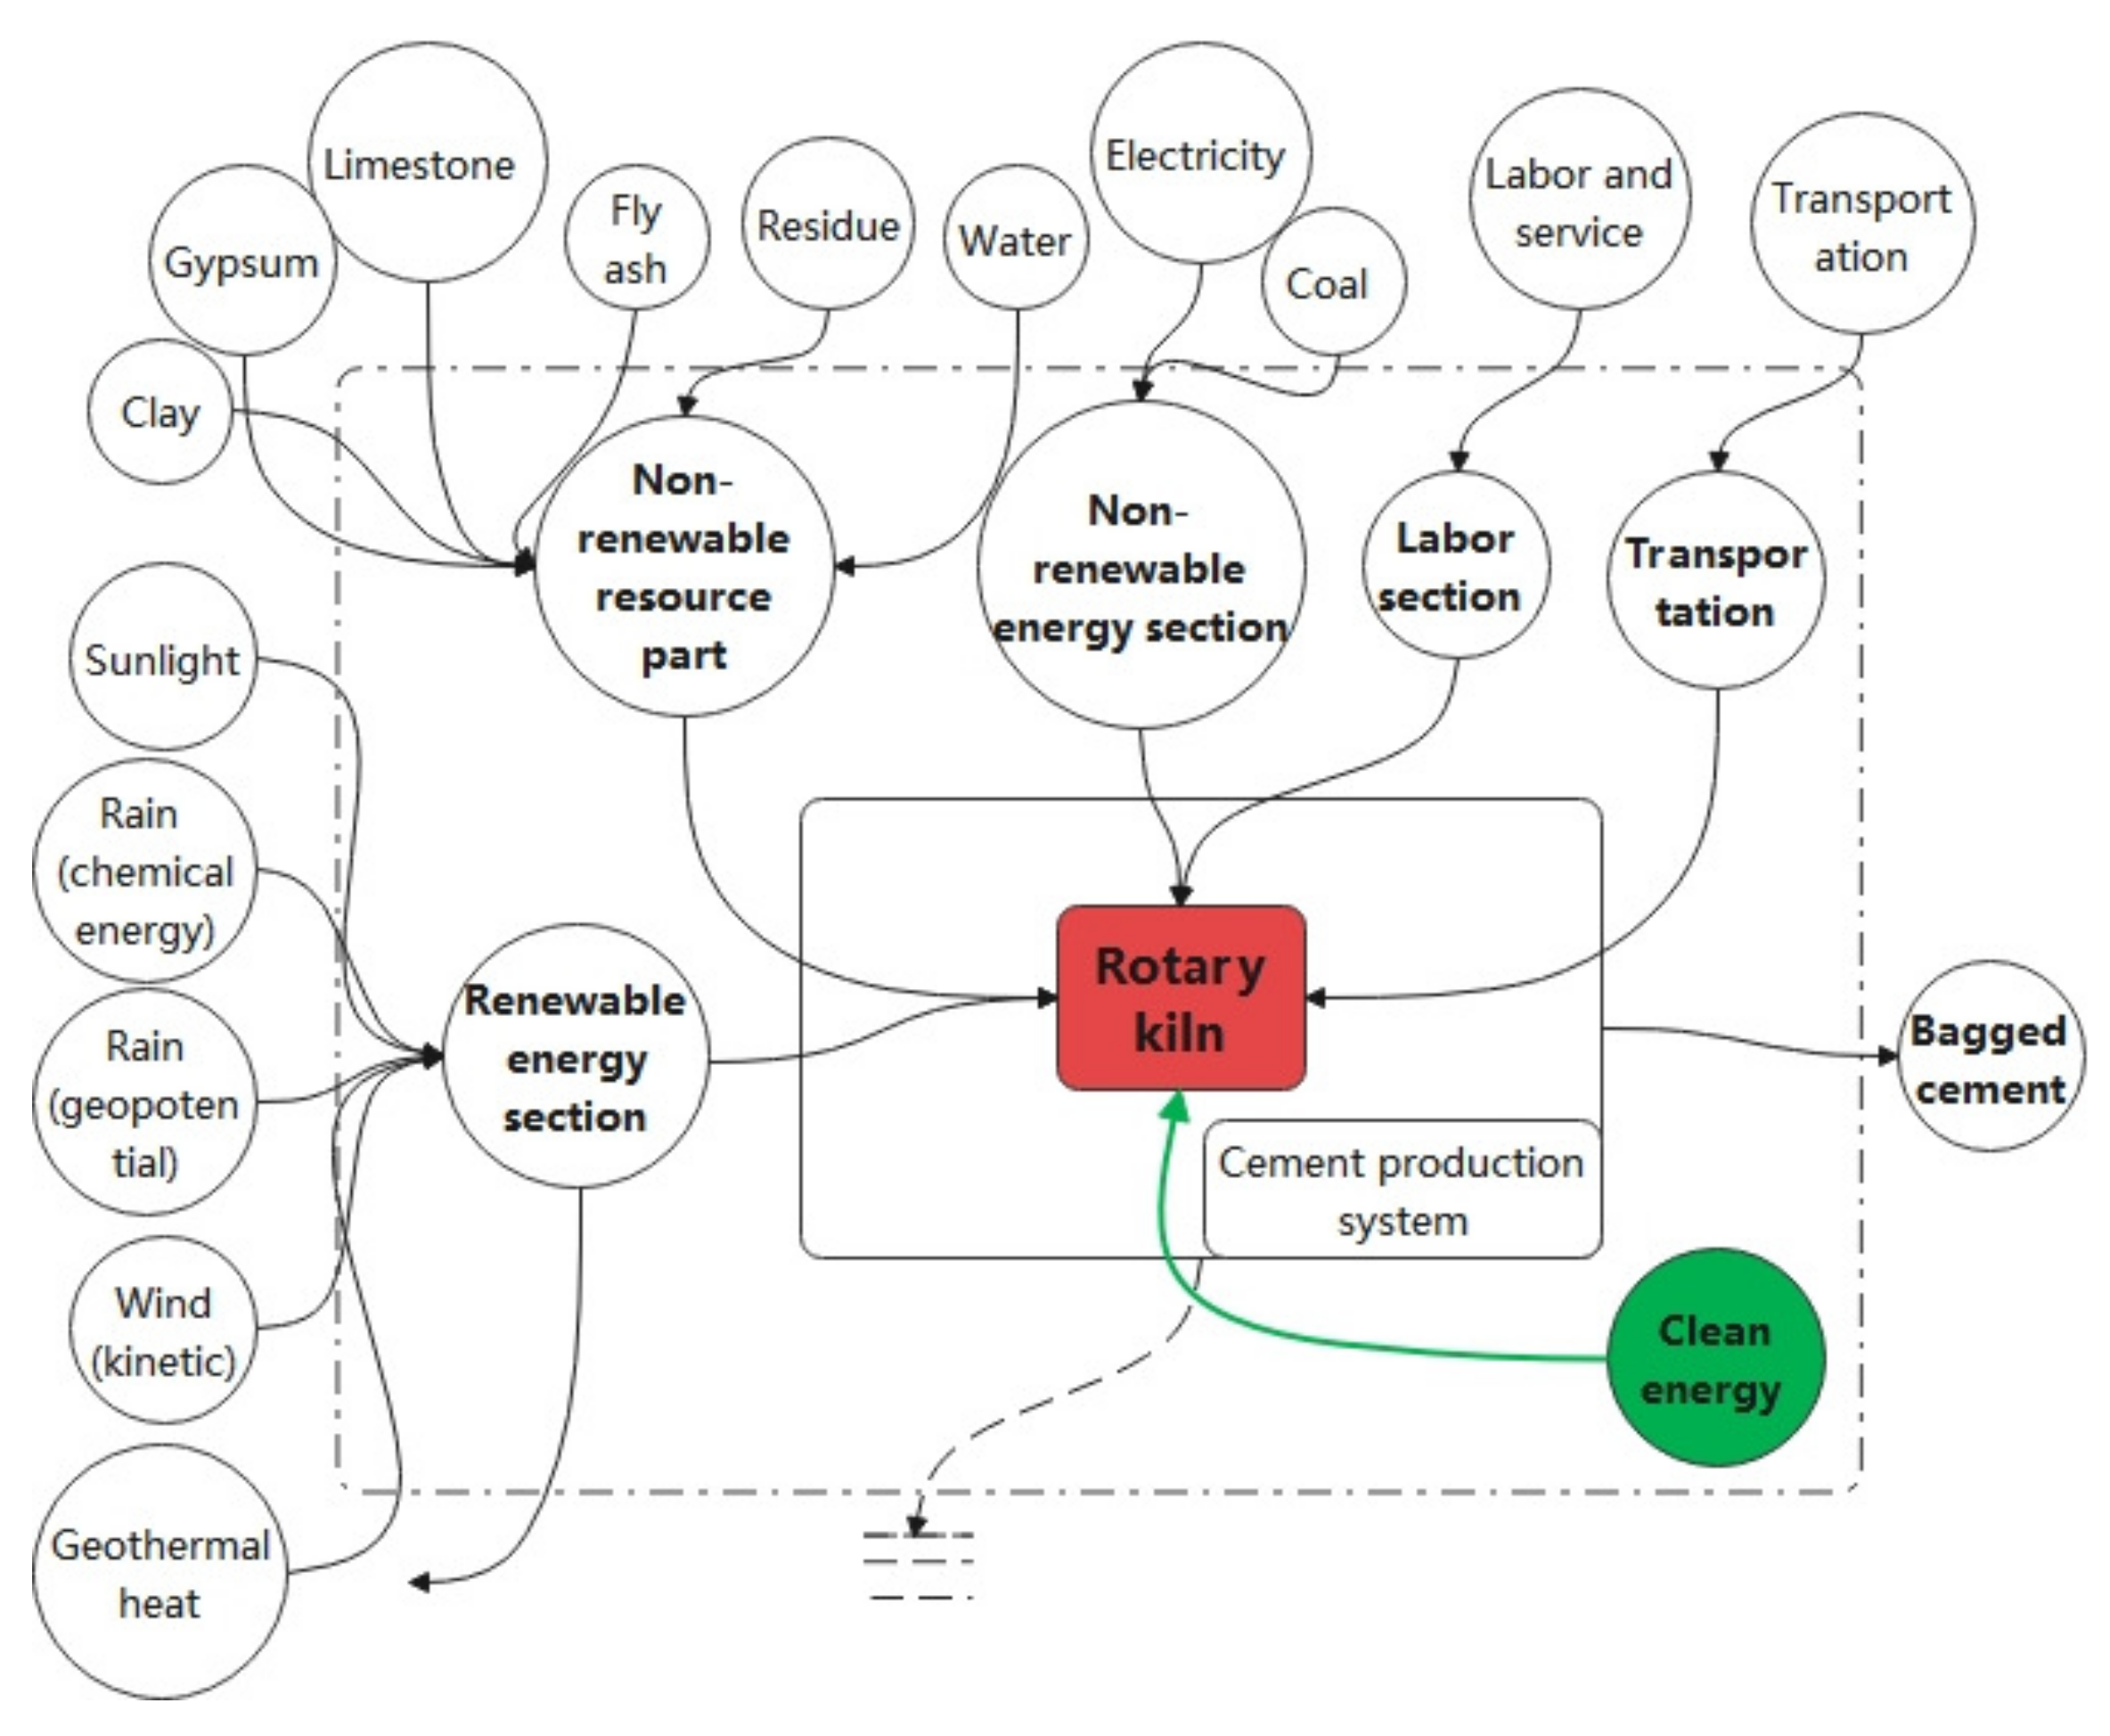
The sustainability of two cement production systems has been calculated and analyzed in this paper by comparing them. In Figure 3 and Figure 4, two types of emergy diagrams have been designed. In Figure 3, the conventional emergy diagram in the cement production system has been displayed, mainly including the renewable energy section, non-renewable resource part, non-renewable energy section, labor section, transportation, etc. In the cement production system, the rotary kiln has been placed as the primary device in the diagram. Compared with Figure 3, the improved system is shown in Figure 4, which has an additional new subsystem (clean energy).

2.3.3. Ecological Indexes

Several indicators have been adopted to evaluate the ecological status in this paper.
For example:
(1)
The renewable rate is the ratio between the renewable parts and total emergy values. In general, a higher renewability rate indicates a better ecological input.
(2)
The non-renewable rate is the ratio between the renewable inputs and total inputs; this rate is the negative indicator for the system.
(3)
The emergy yield ratio can be obtained based on the total emergy and imported emergy input, showing the ability to generate emergy. It uncovers the system structure and emergy distribution.
(4)
The environmental loading ratio reveals the ecological stress for the system. When the system has a higher number, it means that the system has a higher pressure.
(5)
The emergy sustainability indicator states the final ecological situation for a system from an emergy perspective. A value below 1 indicates that the entire system is unsustainable in the long run.

2.3.4. Sensitivity Analysis

Considering the uncertainty and diversity of data sources, the sensitivity analysis must be noticed. In this study, we performed a sensitivity analysis for the main contributor and checked the accuracy of the results. In general, the equation can be represented by (8).
E S = [ D ± α ] × [ E ± β ]
where Es is the emergy value; D is the data of energy, mass, and service; E is the unit emergy value; α is the data change; and β is the error of transformity in this study.

3. Results and Discussion

3.1. Main Emergy Contributor

For the cement production system, there are five sections for the emergy contribution (in Table 2): renewable energy, non-renewable resource part, non-renewable energy, labor, and air pollutants. The primary emergy contributor part was the non-renewable resource part, accounting for 88.6% of the entire emergy, followed by 11.1% of the non-renewable energy section. Other sections accounted for a small proportion and thus cannot play a major role. Because of the main contributor effect, we took the non-renewable resource part as the example for our analysis; the non-renewable resource part was constituted by six subsystems, including clay, gypsum, limestone, fly ash, residue, and water. Among them, limestone manifested as a controller, having 76.2% of the proportion of the whole emergy, demonstrating its prominent effect and position in the cement proportion system. As the second most influential factor, gypsum and clay also played a corresponding role, having 7.5% and 4.21%, respectively.

3.2. Emergy Indicator Analysis

The most critical indicators have been presented in Table 3. In the last section, the renewable rate and non-renewable rate have been explained. Due to the inefficiency of the renewable energy section, the renewable rate was at a substandard level. On the other hand, the non-renewable rate was much higher than normal. The emergy yield ratio was five, illustrating that the cement system has a low ability to obtain emergy; it is a positive parameter for the cement production system. The higher the EYR is, the more sustainable the whole system’s renewable capacity is. The environmental loading ratio (ELR) reveals the pressure of the entire system. According to a related reference [23], the ELR was far more than the normal standard (126.6 > 5), which signifies the huge stress on the system. Based on the EYR and ELR values, the emergy sustainability indicator (ESI) was calculated (far less than one). As the most comprehensive sustainability index for emergy, it uncovers the unsustainable state.

3.3. Sensitivity Result Analysis

To confirm the data reliability, the sensitivity analysis must be tested. In this study, by considering the primary contributor, the non-renewable resource part and limestone have been selected as the variable factors. Based on these two input items, eight kinds of assumptions have been executed, including:
Hypothesis 1.
+5% emergy of the non-renewable resource part has been reduced in the cement production system; five indicators changes need to be evaluated in Table 3 to check the resulting uncertainty.
Hypothesis 2.
Similar to Hypothesis 1, 5% proportion emergy of the non-renewable resource part will be chosen, and the test result will change.
Hypothesis 3.
Based on the variable proportion upgrade, +10% emergy of the non-renewable resource part has also been designed for the final sensitivity.
Hypothesis 4.
Compared with Hypothesis 2, −10% proportion has been compared and analyzed for the system.
Hypothesis 5.
By changing the evaluated object, +5% emergy of limestone has been considered for testing the sustainable indicators changes.
Hypothesis 6.
–5% emergy of limestone is the most obvious difference from the other assumptions.
Hypothesis 7.
The sustainable results have been focused based on +10% emergy change for limestone.
Hypothesis 8.
Unlike Hypothesis 7, −10% emergy ratio is adjusted for limestone in the cement production system.
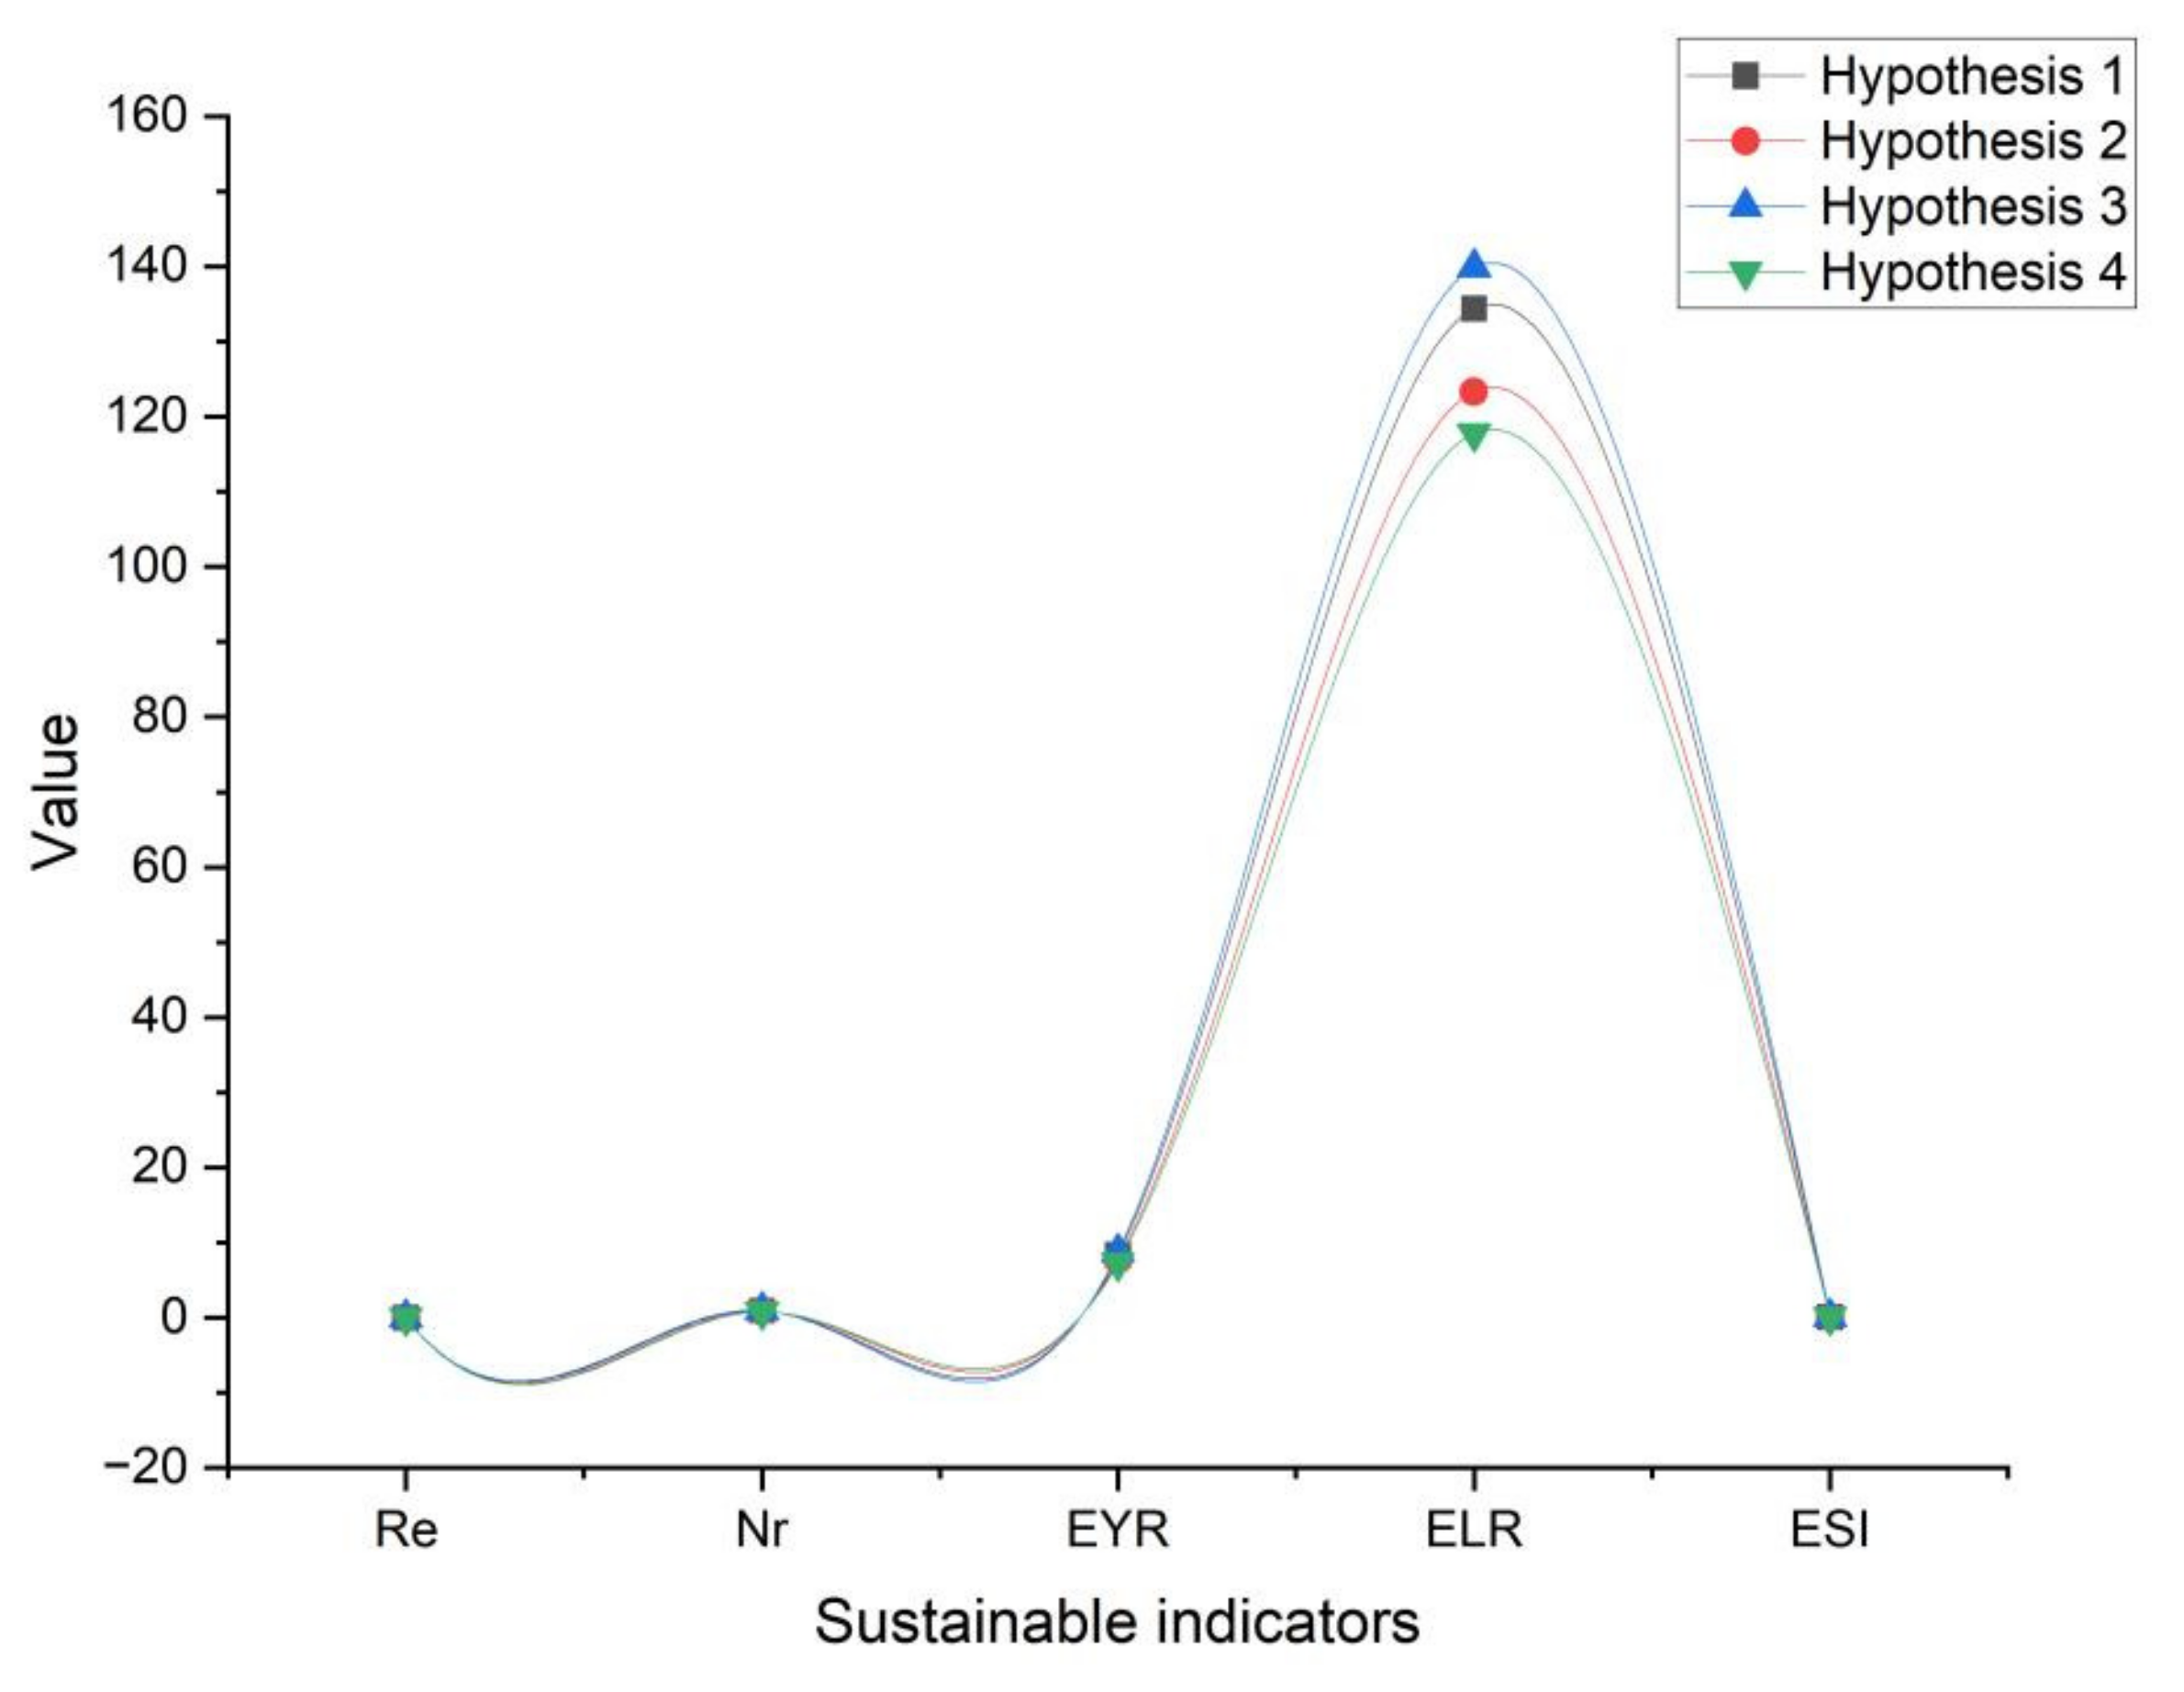
The details of the emergy indicator changes have been listed from Hypothesis 1–4 in Table 4. Overall, except for the sustainability indicators, the four indexes all have different degrees of change trends. A clear trend can be seen in Figure 5. The environmental loading ratio had the largest value, followed by the emergy yield ratio, non-renewable rate, and emergy sustainability index. Taking the degree of change as the instance to analyze (in Table 4), the ELR indicator displayed the largest variation and the other parameters did not change much. For example, the ELY had 6.87%, −3.32%, 12.01%, and −8.45% moving from Hypothesis 1 to Hypothesis 4, respectively. To sum up, from Hypothesis 1 to Hypothesis 4, there is little fluctuation in the sustainable indexes. In particular, changes in the sustainability indicators (ESI) were at a low level (Table 4, Figure 5 and Figure 6).
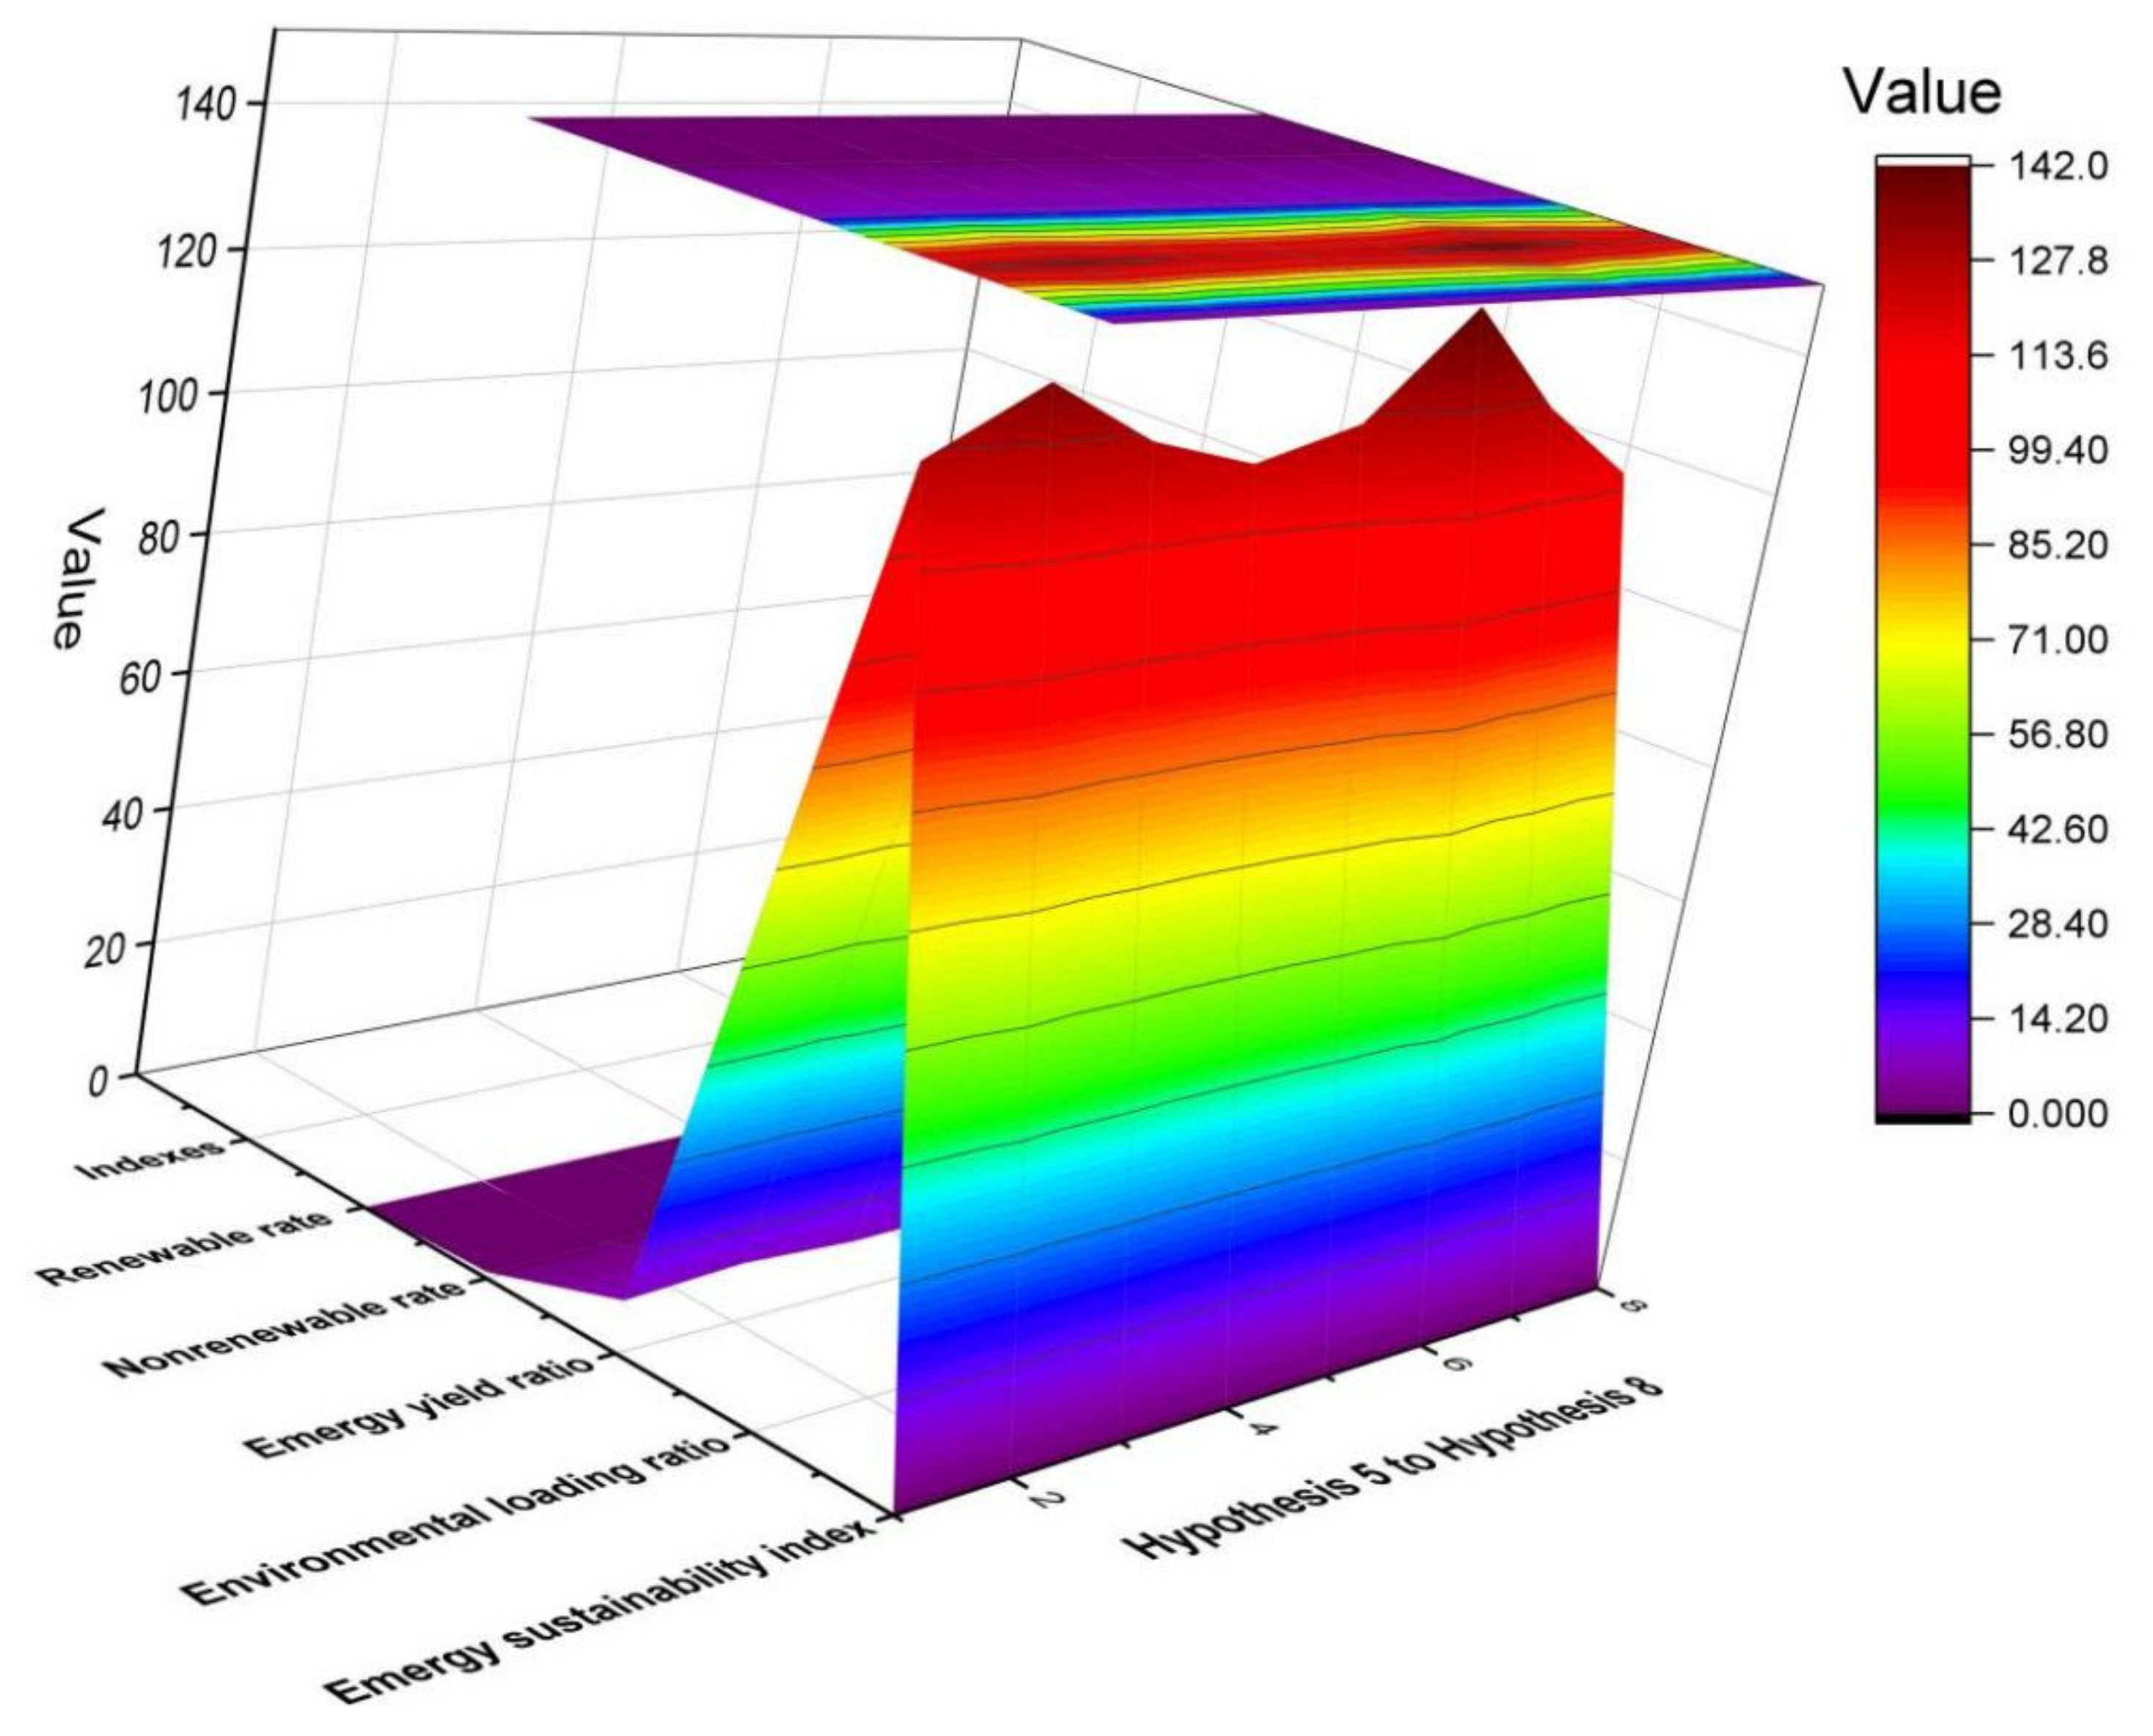
In Table 5, the emergy indicator changes have been displayed from Hypothesis 5 to Hypothesis 8. In view of Table 5, Figure 7 and Figure 8 have been visualized, which have two distinct characteristics. On the one hand, the environmental loading ratio (ELR) had the biggest quantity of the indexes, and it can be clearly found in Figure 7 and Figure 8. The EYR was the second factor after the ELR. In terms of analyzing the variation change in Hypothesis 5, the EYR had the obvious floating (12.21%), followed by the ESI (6.9%), ELR (6.16%), Nr (4.63%), and Re (0%). A similar set of conclusions from Hypothesis 6 to Hypothesis 8 can be found in Figure 9. Taking the most important sustainability indicator (ESI) as an example, it can be clearly found that the values had a very small change in the absolute values, which demonstrates that the sensitivity changes were within acceptable limits for the cement production system.

3.4. Clean Energy Alternative Analysis

In order to enhance the sustainability of the cement production system, a new type of biological power generation system is considered and harnessed in Figure 10. The specific technological process is shown in Figure 10.

3.4.1. The Specific Process Flow Introduction

In Figure 10, fourteen subsystems constitute the entire new power generation system, including: the chicken manure collection, wastewater subsystem, gravel hydrolysis tank, first stage aerobic reaction cell, secondary anaerobic reactor, fermentation tank, solid–liquid separation, methane mud pond, biological desulfurization tower, gas tank, methane torch, methane power generation system, waste heat boiler, hot water storage tank, etc. Among these processes, six categories of key processes (first stage aerobic reaction cell, secondary anaerobic reactor, solid–liquid separation, biological desulfurization tower, methane power generation system, and waste heat boiler) are extracted and need to be focused on because of their main emergy effect in the biological power generation system.

3.4.2. Sustainable Analysis by Integrating the New Energy System

For a single part of the entire cement production system, its sustainability needs to be evaluated for checking the sustainable impact. Firstly, an emergy diagram has been designed to establish an evaluated framework and define the assessment boundary in Figure 11.
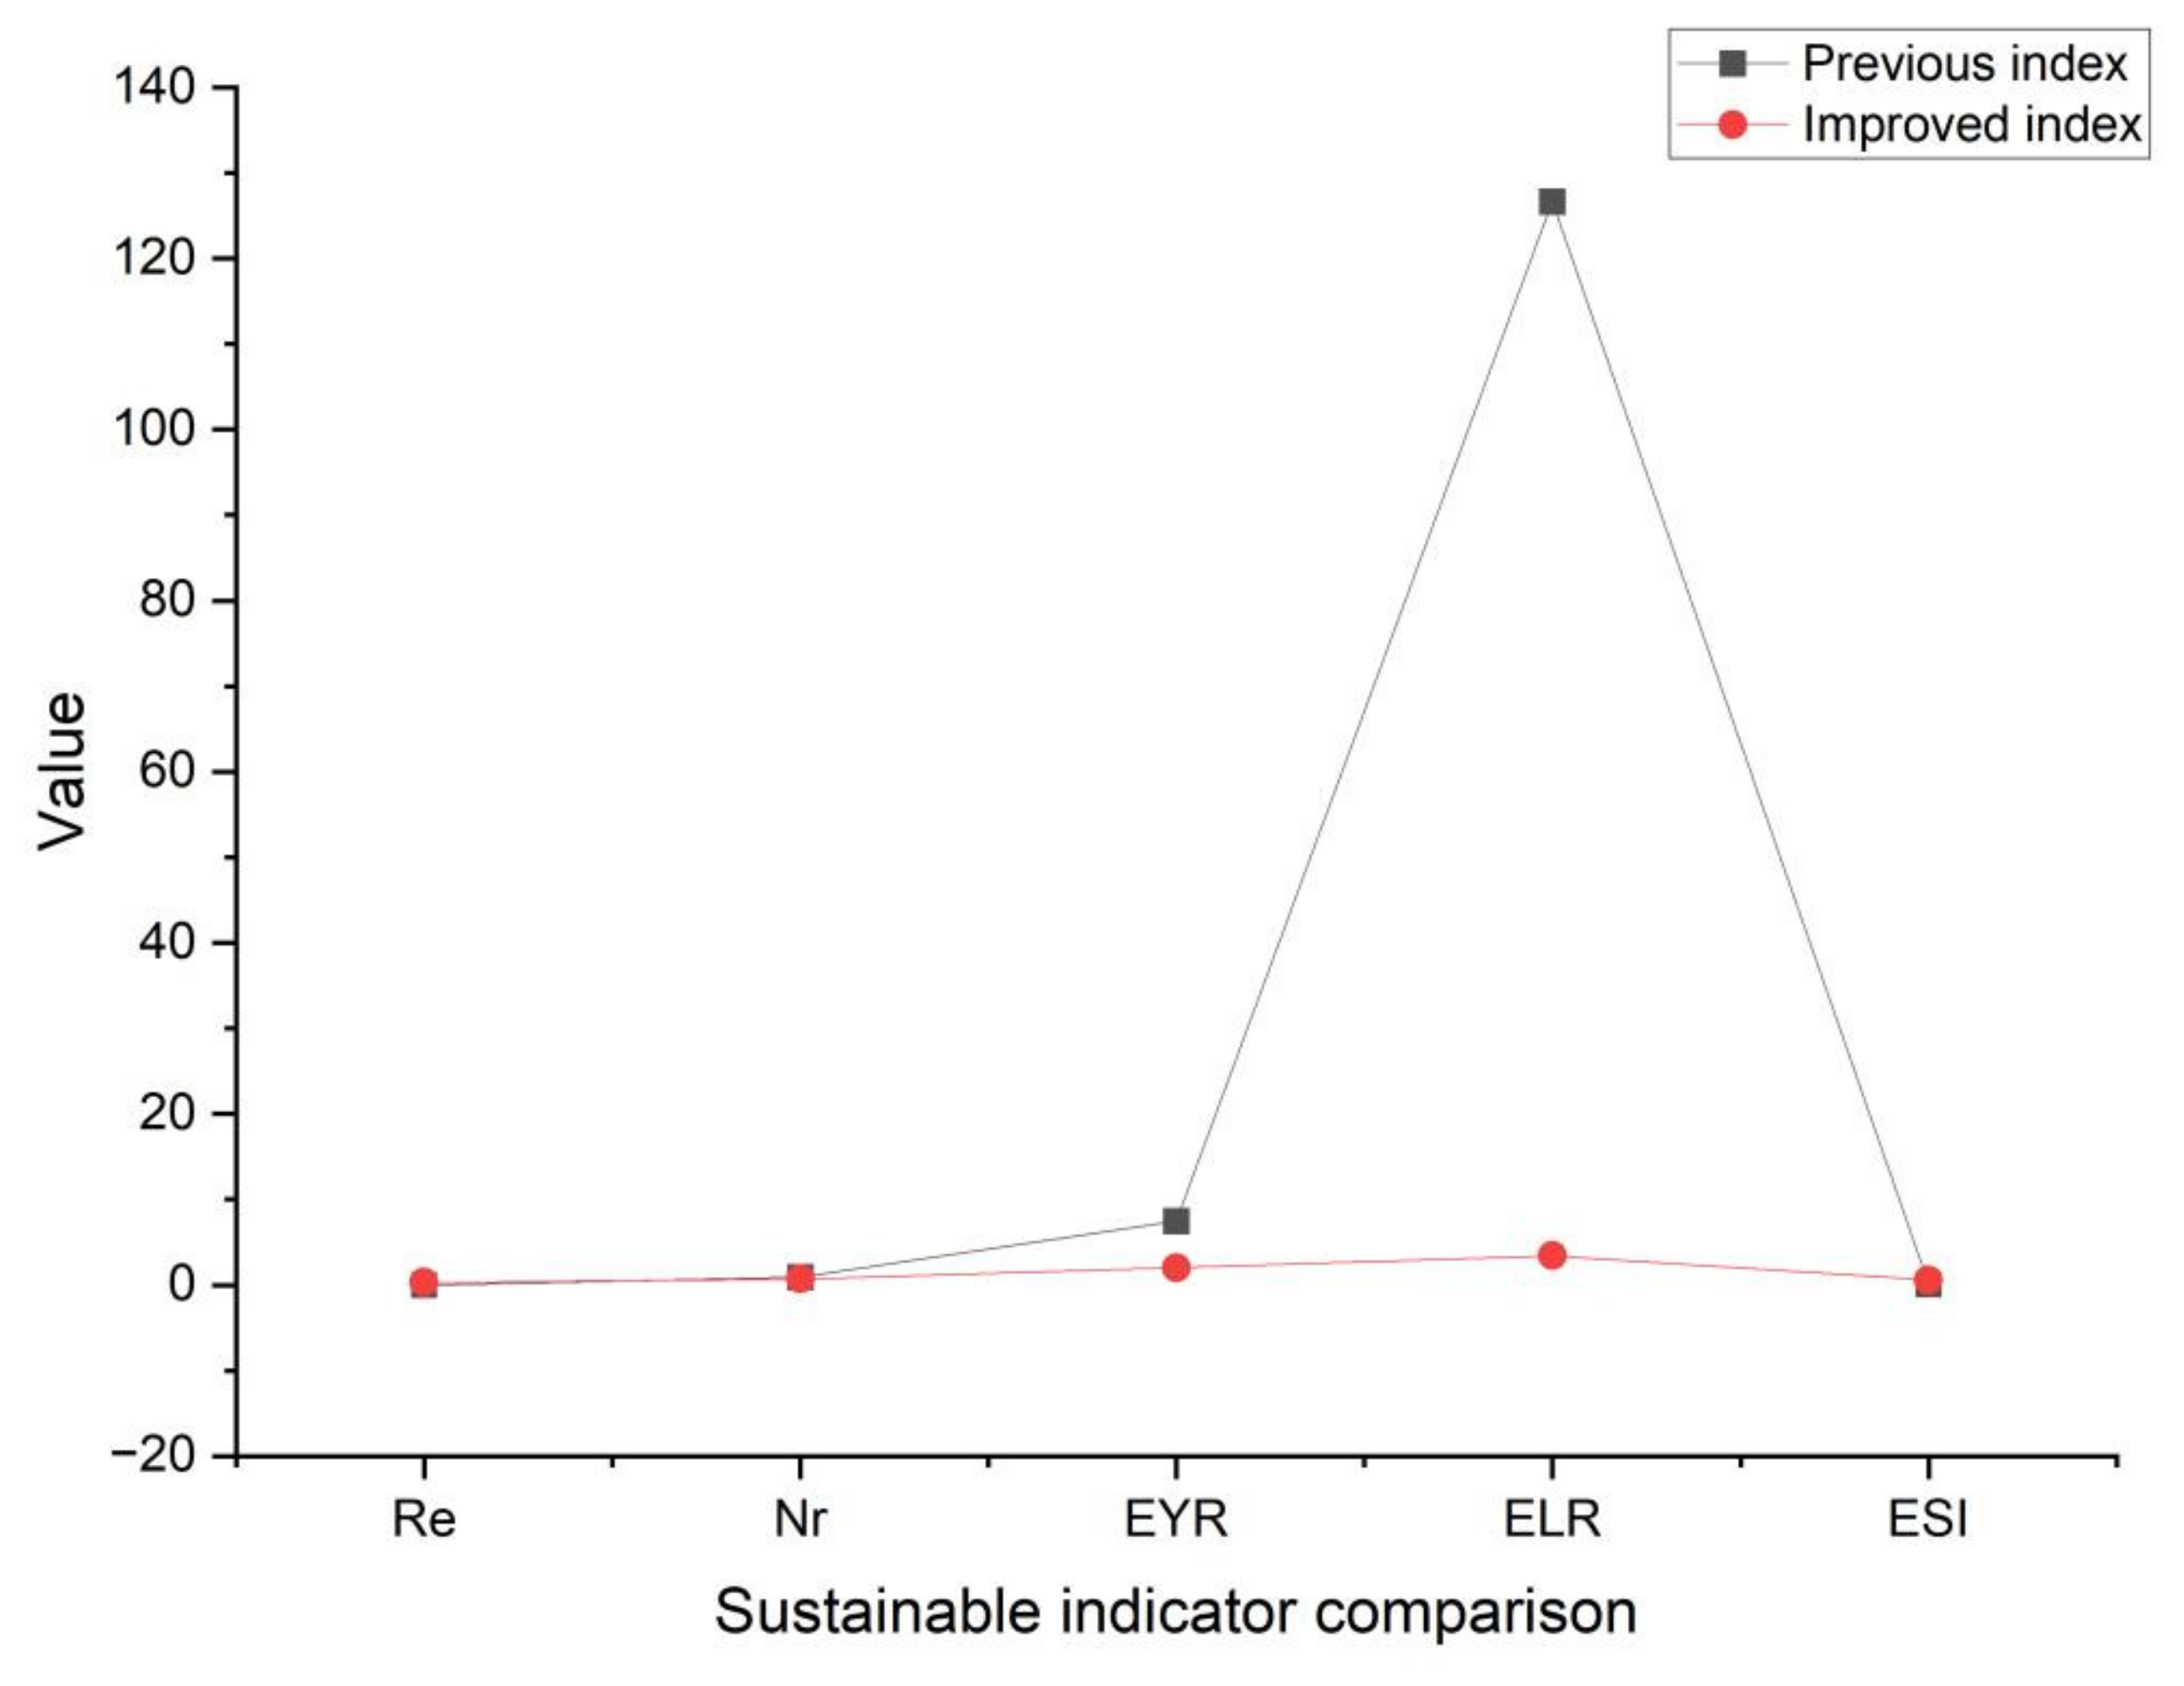
Then, based on the emergy diagram definition, the quantitative assessment procedures and details were conducted in Table 6. Through emergy replacement and the addition of new renewable energy in the cement production system, the improved sustainability indicators are displayed in Table 6, Table 7 and Figure 12.
Improved renewable rates and reduced non-renewable rates contribute to sustainability in the cement production system. The most obvious change is that the renewable rate has improved from 0–29.3%, which illustrates that the renewable electric energy input changes the structure of the cement production system, then increases the overall system’s renewable rate. The increase in renewable rates reduces the proportion of non-renewable rates from 88.6 to 70.7%.
The EYR, ELR, and ESI have also distinctly changed. A new type of biological power generation system input upgrades the configuration in the cement production system, resulting in a low emergy generation yield, which is responsible for the EYR variation (from 7.45 to 2.02). Among them, the EYR has a dramatic decrease from 126.6 to 3.42 because of the clean electric energy input, which squeezes the proportion of non-renewable resources. The emergy sustainability indicator (ESI) has a clear improvement from 0.058 to 0.591, which is approximately a tenfold increase. To sum up, the addition of a clean energy alternative plan has effectively improved the ecological sustainability of the whole cement production system.

4. Sustainability Improvement Strategies Discussion

In this study, sustainable promotion faced three problems in the cement production system: inadequate sustainable energy inputs, excessive non-renewable resource use, and a huge investment of local resources (or the unreasonable structural system), etc. In response, two solutions and strategies have been proposed.

4.1. Sustainable Energy Reuse Strategies

For the cement production system, enhancing the proportion of clean energy use is an effective style for improving the sustainability. In Section 3.4, the reuse of the biopower subsystem by integrating the whole cement system plays a positive role in sustainability. However, there are many types of sustainable energies that exist, such as solar energy, wind energy, and hydropower, which are the most common forms of clean energy in China [44]. This section develops and discusses the corresponding strategies around these three energy types.

4.1.1. Select the Basis of Three Types of Clean Energy

According to the latest document of clean energy development in China [45], solar energy (wind energy or hydropower) has a broad application prospect. Taking the development of solar energy as an example, considering that China is rich in solar energy, especially in the central and western regions, approximately 96% of the area can be solar-powered [46]. Hence, these three types of clean energy can be considered in the cement production system by replacing fossil energy generation.

4.1.2. The Effectiveness Validation

After choosing a form of new energy, their effectiveness needs to be further verified to further determine the proportion of energy that can be substituted. Using solar power as the example again, if all electricity input is replaced by solar energy in the cement production system (Table 8), the final sustainable indicators will change.
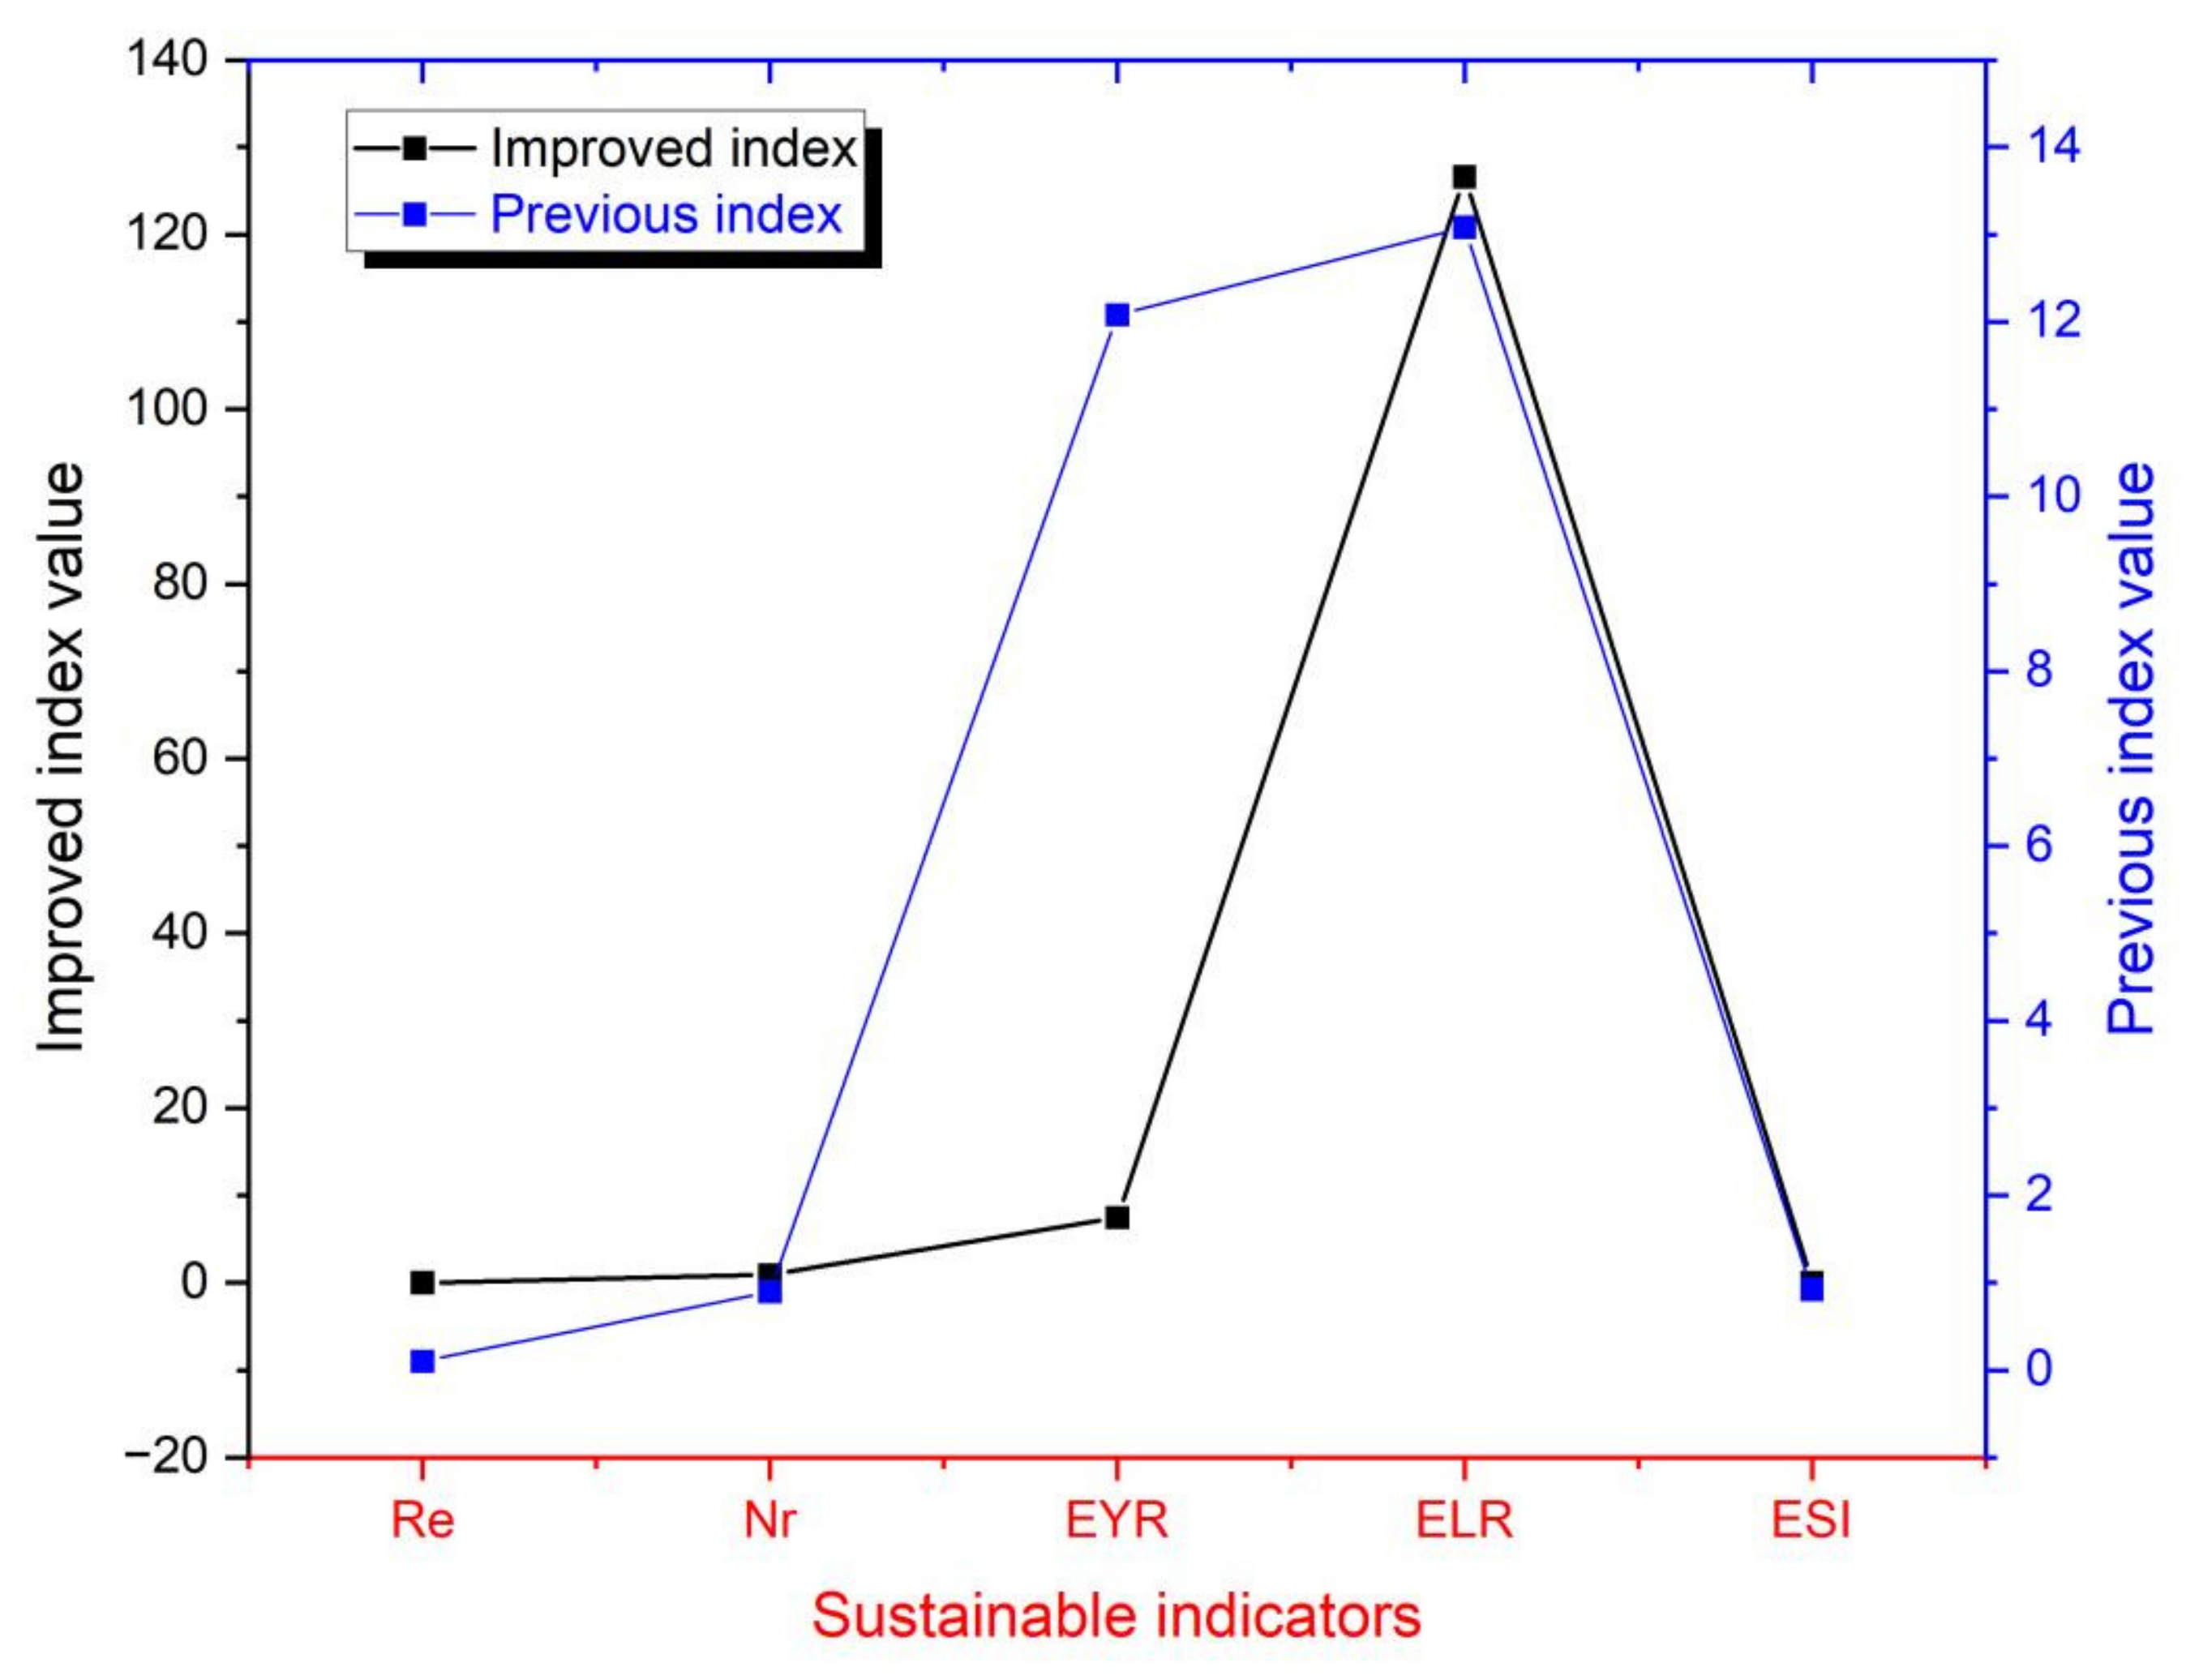
In Table 8 and Figure 13, a clear fact can be obtained that the EYR can vary a lot from 126.6 to 9.01 in terms of the emergy perspective. This indicates that the environmental load of the whole system dramatically decreases when solar energy is added. The final ESI has been considerably improved from 0.058 to 0.125, a roughly 2.16-fold advancement. This phenomenon states that the reuse of renewable energy is effective in the cement production system.

4.1.3. Advantages and Barriers to Solar Energy Adoption

Solar energy utilization has two advantages. Firstly, it has very mature technology to support the power generation implementation in China, which can be verified from [47]. By 2030, according to the mandatory national documents of the National Energy Administration in China, the total installed capacity of solar power will reach 1.2 billion kilowatts. Compared with the installed capacity in 2022, this would be a tremendous increase. Secondly, benefitting from not being limited by the site, the widespread use of solar energy can be achieved on a large scale. For instance, solar panels can be placed on the roof of a cement factory to generate electricity without occupying the actual factory floor space.
However, there are two barriers to applying solar energy in the cement production system. On the one hand, solar power generation is a set of independent systems; if it is coupled to the cement production system, an additional sustainability re-evaluation of the solar energy subsystems is required. Then, the sustainability of an integrated system can be quantitatively calculated and assessed, which adds a certain amount of workload. On the other hand, the new solar system addition will require modifications to the cement plant, such as installing solar photovoltaic panels on the roof of the plant and revamping the electrical system.
If photovoltaic panels do not occupy the factory’s roof, a new site is needed to support the power generation system. This is a significant cost output for the entire cement production system, which increases the burden on the whole system and reduces sustainability in the long run.
Several scholars have also conducted a series of explorations on the utilization of clean energy, such as for wind energy resource development [48], clean electrical energy [49], and studies investigating the solar and wind energy status in Poland [50] and the solar and wind energy distribution in China [51].

4.2. Alternative Resources Reuse Strategies

For a cement production system, ingredient substitutions have also been studied by many scholars. For example, the river sediment has been selected and considered as the primary raw material for building materials [52]. Dredged sediment as a raw material was reused for Portland cement production [53]. Aluminate cement substitution was tested for performance changes [54]. To explore the geological characteristics, low-grade calcined clays were investigated as supplementary cementitious materials [55]. Under the condition of ensuring product performance, these studies demonstrate that material substitution can be achieved in the cement production system.
On account of the emergy structure analysis in the cement production system, there are two primary impact elements, including the renewable energy part and the non-renewable resource section. In Section 4.1, sustainable energy reuse strategies have been displayed and discussed. In this chapter, alternative non-renewable resource reuse strategies will be selected and analyzed. Compared with these two impact inputs, non-renewable resource reuse has more influence than renewable energy reuse in view of their emergy proportion. Therefore, this section’s discussion is necessary.
In the non-renewable resource part of the cement production system, two types of additives can be replaced by recycled materials. The first resource is clay, which can be displaced by fly ash to produce Portland cement. Assuming that all clay in the cement production system is replaced by renewable resources, the sustainable indexes are shown in Table 9.
In addition, part of the limestone can also be replaced by waste cement to reduce the input of non-renewable resources in the cement production system. The decreased ELR indicator and increased ESI index in Table 9 and Figure 14 demonstrate that the cement production system has become more sustainable than before.
Another alternative material is limestone which, assuming that 10% of the limestone in this system is replaced by renewable cement fertilizer, presents the sustainability indicators shown in Table 10.
Similar results can be obtained when limestone is partially replaced. The load pressure of the whole cement production system is reduced, and the sustainability is boosted in Table 10 and Figure 15. These two examples (clay and limestone substitute) clarify that the substitution of non-renewable resources can improve sustainability in the cement production system.
Of course, the premise of replacement (clay and limestone substitute) is that the product is qualified. If the substituted cement product is not up to standard, the substitution of recycled materials is meaningless.

5. Comparative Analysis and Economic Strategy Research

5.1. Comparative Analysis of Similar Studies

Compared with the cement production system in this study, similar studies have been carried out in other areas [29,30,31,56].
For example, Xiaohong et al. (2017) conducted the environmental sustainability assessment of China’s entire cement industry based on the emergy method [56]. Hrvoje et al. (2016) utilized emergy and ecological footprint analyses to explore the environmental assessment for different cement manufacturing processes [30]. Dan et al. (2016) chose a typical cement factory in China to analyze the emergy situation for sustainability [31]. Through the view of life cycle emergy, Wei et al. (2016) analyzed the cement production system in China [29].
In contrast to these studies, this study focused on the impact of renewable energy systems on cement production systems. In particular, when renewable energy systems are integrated into the entire cement production system, the resulting impact on the sustainability of the cement system is significant, which has not been covered or discussed in other studies.

5.2. Economic Impact on Cement Industry

In the face of environmental deterioration, as a typical high-energy consumption and high-pollution industry, sustainable research has a great positive significance in the cement industry, especially in the context of China’s declining real estate industry growth and market contraction. Some scholars have studied the relationship between the cement industry and the economy [57,58,59,60]. In this study, the depression of the economic market has a negative impact on the sustainability of the cement industry, limiting the sustainable transformation of the cement system.

6. Conclusions

This study implemented a sustainability investigation in the cement production system based on an emergy method. In particular, five primary sustainable indexes have been adopted to assess the ecological status of the system, including the renewable rate (Re), non-renewable rate (Nr), emergy yield ratio (EYR), environmental loading ratio (ELR), and emergy sustainability indicator (ESI). At the same time, corresponding improvement strategies were also hypothesized and evaluated to boost the sustainability level in the cement production system. The main conclusions are presented as follows.
The primary emergy contributor part was the non-renewable resource part, accounting for 88.6% of the entire emergy, followed by 11.1% being accounted for by the Non-renewable energy section.
(1)
Based on the EYR and ELR, the emergy sustainability indicator (ESI) was calculated (far less than one), which indicated that the cement instruction system is unsustainable.
(2)
Through the analysis of eight hypotheses, it can be clearly found that the indicators have a very small change in the absolute values, which demonstrates that sensitivity changes were within acceptable limits for the cement production system.
(3)
The new type of biological power generation subsystem has effectively improved the ecological sustainability of the whole cement production system.
In order to optimize the sustainability in the cement production system, two solutions were validated and discussed, which involved sustainable energy and alternative resources reuse strategies. Among these two solutions, their initial positive effects were revealed.
In the long run, there are two aspects that need to be accomplished. On the one hand, a new building cement system coupled with renewable measures needs to be selected and designed to further verify its sustainability effects based on the LCA-emergy method. On the other hand, LCA-emergy evaluation models of different cement systems need to be established in order to have more accurate evaluation results.

Author Contributions

Conceptualization, H.W. and J.Z.; investigation, H.W., Y.L., L.H., D.X. and C.Z.; formal analysis, H.W. and J.Z.; methodology, H.W. and J.Z.; resources, H.W. and J.Z.; writing—review and editing, H.W., J.Z. and H.Z. All authors have read and agreed to the published version of the manuscript.

Funding

The work described in this paper was supported by the open fund of the State Key Laboratory of Silicate Materials for Architectures (Wuhan University of Technology) (SYSJJ2022-16), General project of philosophy and social sciences research in Jiangsu education department (Project No.2021SJA1723) “ Research on the Artistic style Characteristics and Value of Early Modernist Architectural in Jiangsu during the Republic of China” (Project No.: 22YSC009).

Institutional Review Board Statement

Not applicable.

Informed Consent Statement

Not applicable.

Data Availability Statement

The study did not report any data.

Conflicts of Interest

The authors declare no competing interests.

Appendix A

Renewable energy calculation:
(1)
Solar energy calculation: area of cement production plant = 120,000 m2; insolation = 5.00 × 10⁹ J/m2/y [61]; albedo = 0.30 [61]; energy = (insolation) × (1 − albedo) × (area) = 4.2 × 10¹⁴ J/y. UEV = 1.00 sej/J by definition; emergy = 4.2 × 10¹⁴ sej.
(2)
Rain (chemical potential energy) calculation: area of cement production plant = 120,000 m2; rainfall = 0.68 m/yr; water density = 1000 kg/m3; evapotranspiration rate = 60%; Gibbs free energy of water = 4.94 × 10³ J/kg; energy = (area) × (rainfall) × (evapotranspiration rate) × (water density) × (Gibbs free energy of water) = 2.42 × 10¹¹ J/yr. UEV = 2.35 × 10⁴ sej/J [62]; emergy of one yr =5.69 × 10¹⁵ sej.
(3)
Rain (geopotential energy) calculation: area of cement production plant =120,000 m2; rainfall = 0.68 m/yr; average elevation = 316 m [63]; water density = 1.00 × 10³ kg/m3; runoff rate = 40.00%; energy = (area) × (rainfall) × (runoff rate) × (water density) × (average elevation) × (gravity) = 1.01 × 10¹¹ J/y; UEV = 2.79 × 10⁴ sej/J [39]; emergy of one year = 1.01 × 10¹¹ J/y × 1 y × 2.79 × 104 sej/J = 2.82 × 10¹⁵ sej.
(4)
Wind energy calculation: area of cement production plant = 120,000 m2; air density = 1.29 kg/m3; velocity of geostrophic wind = 3.25 m/s; drag coefficient = 0.001 [64]; energy = (area) × (air density) × (drag coefficient) × (velocity of geostrophic wind)3 = 5.31 × 10³ J/y; UEV = 1.90 × 10³ sej/J; emergy of one year = 1.01 × 10⁷ sej.
(5)
Geothermal heat calculation: area of cement production plant = 120,000 m2; heat flow (average) = 0.035 J/m2/s; energy = (area) × (heat flow) = 4.2 × 10³ J/y; UEV = 3.44 × 10⁴ sej/J; emergy of one year = 1.44 × 10⁸ sej.

References

  1. Cement Industry Environmental Assessment Report in China. 2021. Available online: https://huanbao.bjx.com.cn/news/20221008/1258794.shtml (accessed on 2 December 2022).
  2. Tempa, K.; Chettri, N.; Thapa, G.; Phurba; Gyeltshen, C.; Norbu, D.; Gurung, D.; Wangchuk, U. An experimental study and sustainability assessment of plastic waste as a binding material for producing economical cement-less paver blocks. Eng. Sci. Technol. 2022, 26, 101008. [Google Scholar] [CrossRef]
  3. Xuan, M.-Y.; Bae, S.C.; Kwon, S.-J.; Wang, X.-Y. Sustainability enhancement of calcined clay and limestone powder hybrid ultra-high-performance concrete using belite-rich Portland cement. Constr. Build. Mater. 2022, 351, 128932. [Google Scholar] [CrossRef]
  4. Yehong, H.; Wen, X.; Feng, Z.; Jialei, Y.; Tian, X.; Ruijun, L.; Xin, W.; Xuefeng, X. Study on Mechanical and Microscopic Properties of Fly Ash Cement-Based Materials in High Geothermal Environment. Adv. Civ. Eng. 2022, 2022, 1768562. [Google Scholar]
  5. Chen, Y.K.; Sun, Y.; Wang, K.Q.; Kuang, W.Y.; Yan, S.R.; Wang, Z.H.; Lee, H.S. Utilization of bio-waste eggshell powder as a potential filler material for cement: Analyses of zeta potential, hydration and sustainability. Constr. Build. Mater. 2022, 325, 126220. [Google Scholar] [CrossRef]
  6. Zhang, X.; Ding, Y. Design of Environmentally Friendly Ca-Alginate Beads for Self-Healing Cement-Based Materials. Materials 2022, 15, 5844. [Google Scholar] [CrossRef]
  7. Zheng, J.; Zeng, G.; Zhou, H.; Cai, G. Experimental Study on Carbonation of Cement-Based Materials in Underground Engineering. Materials 2022, 15, 523. [Google Scholar] [CrossRef]
  8. Petroche, D.M.; Ramirez, A.D. The Environmental Profifile of Clinker, Cement, and Concrete: A Life Cycle Perspective Study Based on Ecuadorian Data. Buildings 2022, 12, 311. [Google Scholar] [CrossRef]
  9. Huo, J.; Wang, Z.; Zhang, T.; Ji, X.; Zhang, H.; He, R. The evolution of early-age cracking of cement paste cured in low air pressure environment. J. Build. Eng. 2022, 52, 104489. [Google Scholar] [CrossRef]
  10. Feng, C. Granger Causality Analysis of Foreign Trade in Cement Products and Ecological Impact in China. Math. Probl. Eng. 2022, 2022, 3467483. [Google Scholar] [CrossRef]
  11. Zapata, J.F.; Azevedo, A.; Fontes, C.; Monteiro, S.N.; Colorado, H.A. Environmental Impact and Sustainability of Calcium Aluminate Cements. Sustainability 2022, 14, 2751. [Google Scholar] [CrossRef]
  12. Liu, C.; Liu, G.; Yang, Q.; Luo, T.; He, P.; Franzese, P.P.; Lombardi, G.V. Emergy-based evaluation of world coastal ecosystem services. Water Res. 2021, 204, 117656. [Google Scholar] [CrossRef]
  13. Zhang, J.; Ma, L. Urban ecological security dynamic analysis based on an innovative emergy ecological footprint method. Environ. Dev. Sustain. 2021, 23, 16163–16191. [Google Scholar] [CrossRef]
  14. Huang, S.-L.; Hsu, W.-L. Materials flow analysis and emergy evaluation of Taipei’s urban construction. Landsc. Urban Plan. 2003, 63, 61–74. [Google Scholar] [CrossRef]
  15. Song, T.; Cai, J.; Xu, H.; Deng, Y.; Niu, F.; Yang, Z.; Du, S. Urban Metabolism Based on Emergy and Slack Based Model: A Case Study of Beijing, China. Chin. Geogra. Sci. 2015, 25, 113–123. [Google Scholar] [CrossRef] [Green Version]
  16. Huang, S.-L.; Chiu, H.-W. Peri-urbanization, land teleconnections, and the equality of ecological exchange: An emergy approach. Landsc. Urban Plan. 2020, 198, 103781. [Google Scholar] [CrossRef]
  17. Fan, Y.; Meng, J.; Ye, H.; Wang, P.; Wang, Y.; Wang, Y. Sustainability and ecological efficiency of low-carbon power system: A concentrating solar power plant in China. J. Environ. Manag. 2021, 290, 112659. [Google Scholar] [CrossRef]
  18. Pan, H.; Geng, Y.; Tian, X.; Wilson, J.; Chen, W.; Zhong, S.; Song, S. Emergy-based environmental accounting of one mining system. Environ. Sci. Pollut. Res. 2019, 26, 14598–14615. [Google Scholar] [CrossRef]
  19. Pang, M.; Zhang, L.; Wang, C.; Liu, G. Environmental life cycle assessment of a small hydropower plant in China. Int. J. Life Cycle Assess. 2015, 20, 796–806. [Google Scholar] [CrossRef]
  20. Reza, B.; Sadiq, R.; Hewage, K. A fuzzy-based approach for characterization of uncertainties in emergy synthesis: An example of paved road system. J. Clean. Prod. 2013, 59, 99–110. [Google Scholar] [CrossRef]
  21. Zhao, Y.; Yu, M.; Xiang, Y.; Kong, F.; Li, L. A sustainability comparison between green concretes and traditional concrete using an emergy ternary diagram. J. Clean. Prod. 2020, 256, 120421. [Google Scholar] [CrossRef]
  22. Zhong, S.; Geng, Y.; Kong, H.; Liu, B.; Tian, X.; Chen, W.; Qian, Y.; Ulgiati, S. Emergy-based sustainability evaluation of Erhai Lake Basin in China. J. Clean. Prod. 2018, 178, 142–153. [Google Scholar] [CrossRef]
  23. Zhang, J.; Ma, L. Environmental Sustainability Assessment of a New Sewage Treatment Plant in China Based on Infrastructure Construction and Operation Phases Emergy Analysis. Water 2020, 12, 484. [Google Scholar] [CrossRef] [Green Version]
  24. Zhang, J.; Ma, L.; Yan, Y. A Dynamic Comparison Sustainability Study of Standard Wastewater Treatment System in the Straw Pulp Papermaking Process and Printing & Dyeing Papermaking Process Based on the Hybrid Neural Network and Emergy Framework. Water 2020, 12, 1781. [Google Scholar]
  25. Brown, M.; Buranakarn, V. Emergy indices and ratios for sustainable material cycles and recycle options. Resour. Conserv. Recycl. 2003, 38, 1–22. [Google Scholar] [CrossRef]
  26. Akhtar, S.; Reza, B.; Hewage, K.; Shahriar, A.; Zargar, A.; Sadiq, R. Life cycle sustainability assessment (LCSA) for selection of sewer pipe materials. Clean Techn. Environ. Policy 2015, 17, 973–992. [Google Scholar] [CrossRef]
  27. Zhang, J.; Srinivasan, R.S.; Peng, C. Ecological Assessment of Clay Brick Manufacturing in China Using Emergy Analysis. Buildings 2020, 10, 190. [Google Scholar] [CrossRef]
  28. Wang, W.; He, Y.; Wu, Y.; Pan, D. Impact of waste slag reuse on the sustainability of the secondary lead industry evaluated from an emergy perspective. Resour. Conserv. Recycl. 2021, 167, 105386. [Google Scholar] [CrossRef]
  29. Chen, W.; Liu, W.; Geng, Y.; Ohnishi, S.; Sun, L.; Han, W.; Tian, X.; Zhong, S. Life cycle based emergy analysis on China’s cement production. J. Clean. Prod. 2016, 131, 272–279. [Google Scholar] [CrossRef]
  30. Mikul, H.; Cabezas, H.; Vujanovic, M.; Duic, N. Environmental assessment of different cement manufacturing processes based on Emergy and Ecological Footprint analysis. J. Clean. Prod. 2016, 130, 213–221. [Google Scholar] [CrossRef] [Green Version]
  31. Song, D.; Lin, L.; Wu, Y. Emergy analysis of a typical New Suspension Preheaters cement plant in China. J. Clean. Prod. 2019, 222, 407–413. [Google Scholar] [CrossRef]
  32. Zhang, J.; Srinivasan, R.S.; Peng, C. A Systematic Approach to Calculate Unit Emergy Values of Cement Manufacturing in China Using Consumption Quota of Dry and Wet Raw Materials. Buildings 2020, 10, 128. [Google Scholar] [CrossRef]
  33. Liu, G.; Yang, Z.; Chen, B.; Zhang, J.; Liu, X.; Zhang, Y.; Su, M.; Ulgiati, S. Scenarios for sewage sludge reduction and reuse in clinker production towards regional eco-industrial development: A comparative emergy-based assessment. J. Clean. Prod. 2015, 103, 371–383. [Google Scholar] [CrossRef]
  34. Wang, Q.; Ma, Z.; Yuan, X.; Wang, J.; Mu, Z.; Zuo, J.; Zhang, J.; Hong, J.; Wang, S. Is cement pavement more sustainable than permeable brick pavement? A case study for Jinan, China. J. Clean. Prod. 2019, 226, 306–315. [Google Scholar] [CrossRef]
  35. Zhang, X.; Xiang, N.; Pan, H.; Yang, X.; Wu, J.; Zhang, Y.; Luo, H.; Xu, C. Performance comparison of cement production before and after implementing heat recovery power generation based on emergy analysis and economic evaluation: A case from China. J. Clean. Prod. 2021, 290, 125901. [Google Scholar] [CrossRef]
  36. Songa, D.; Chen, B. Sustainability evaluation of a typical cement production chain in China—An emergy perspective. Energy Procedia 2016, 104, 98–103. [Google Scholar] [CrossRef]
  37. Odum, H.T. Environmental Accounting: Emergy and Environmental Decision Making; John Wiley and Sons: New York, NY, USA, 1996. [Google Scholar]
  38. Brown, M.T.; Ulgiati, S. Assessing the global environmental sources driving the geobiosphere: A revised emergy baseline. Ecol. Model 2016, 339, 126–132. [Google Scholar] [CrossRef] [Green Version]
  39. Brown, M.T.; Bardi, E. Handbook of Emergy Evaluation: A Compendium of Data for Emergy Computation in a Series of Folios, Folio; University of Florida: Gainesville, FL, USA, 2001. [Google Scholar]
  40. Brown, M.T.; Raugei, M.; Ulgiati, S. On boundaries and ‘investments’in emergy synthesis and LCA: A case study on thermal vs. photovoltaic electricity. Ecol. Indic. 2012, 15, 227–235. [Google Scholar] [CrossRef]
  41. Lou, B.; Ulgiati, S. Identifying the environmental support and constraints to the Chinese economic growthdan application of the emergy accounting method. Energy Policy 2013, 55, 217–233. [Google Scholar] [CrossRef]
  42. GB3095-2012; Ambient Air Quality Standards. Ministry of Environmental Protection of PRC: Beijing, China. Available online: https://www.doc88.com/p-3867369563075.html (accessed on 28 October 2022).
  43. Zhang, H.; Asutosh, A.T.; Zhang, J. A quantitative sustainable comparative study of two biogas systems based on energy, emergy and entropy methods in China. Environ. Dev. Sustain. 2022, 24, 13583–13609. [Google Scholar] [CrossRef]
  44. Report on In-Depth Research and Investment Prospects of China’s Photovoltaic Industry in 2022–2026. Available online: http://www.ocn.com.cn/reports/2326guangfuchanye.shtml (accessed on 2 December 2022).
  45. China Clean Energy Development Report in 2022. Available online: http://ep.baidajob.com/article-6625460.html (accessed on 2 December 2022).
  46. Solar Thermal Utilization Industry Health Report in China of 2021. Available online: https://wenku.baidu.com/view/49b87135c6da50e2524de518964bcf84b8d52d48.html (accessed on 2 December 2022).
  47. The Implementation Plan for Promoting the High-Quality Development of New Energy in the New Era, National Energy Administration of China. Available online: http://www.nea.gov.cn/2022-05/30/c_1310608545.htm (accessed on 2 December 2022).
  48. Zhu, R.; Wang, Y.; Xiang, Y.; Sun, C.; Chang, R.; Hu, G.; Gao, Z. Study on climate characteristics and development potential of wind energy resources in China. Acta Energ. Sol. Sin. 2021, 42, 409–418. [Google Scholar]
  49. Huang, Q.; Guo, Y.; Jiang, J.; Ming, B. Development pathway of China’s clean electricity under carbon peaking and carbon neutrality goals. J. Shanghai Jiaotong Univ. 2021, 55, 1499–1509. [Google Scholar]
  50. Jurasz, J.; Mikulik, J.; Dabek, P.; Guezgouz, M.; Ka’zmierczak, B. Complementarity and ‘Resource Droughts’ of Solar and Wind Energy in Poland: An ERA5-Based Analysis. Energies 2021, 14, 1118. [Google Scholar] [CrossRef]
  51. Lv, A.; Li, T.; Zhang, W.; Liu, Y. Spatiotemporal Distribution and Complementarity of Wind and Solar Energy in China. Energies 2022, 15, 7365. [Google Scholar] [CrossRef]
  52. Wang, Z.; Li, B.; Liang, X. Utilization of river sediment, sewage sludge and wheat straw as the primary raw material in sintered-shale bricks. J. Mater. Cycles Waste Manag. 2022, 24, 2401–2415. [Google Scholar] [CrossRef]
  53. Chu, D.C.; Kleib, J. Mouhamadou Amar, Mahfoud Benzerzour, Nor-Edine Abriak. Recycling of dredged sediment as a raw material for the manufacture of Portland cement—Numerical modeling of the hydration of synthesized cement using the CEMHYD3D code. J. Build. Eng. 2022, 48, 103871. [Google Scholar] [CrossRef]
  54. Kim, H.-J.; Khalid, H.R. The Effects of Calcium Aluminate Cement Substitution on Physicochemical Properties of Geopolymer–Zeolite Composites. Arab. J. Sci. Eng. 2022, 47, 5073–5078. [Google Scholar] [CrossRef]
  55. Vásquez-Torres, O.O.; Cabrera-Poloche, F.D.; Tobón, J.I. Performance of Low-Grade Calcined Clays as Supplementary Cementitious Material in Relation to their Geological Characteristics. Clays Clay Miner. 2022, 70, 233–251. [Google Scholar] [CrossRef]
  56. Zhang, X.; Shen, J.; Wang, Y.; Qi, Y.; Liao, W.; Shui, W.; Li, L.; Qi, H.; Yu, X. An environmental sustainability assessment of China’s cement industry based on emergy. Ecol. Indic. 2017, 72, 452–458. [Google Scholar] [CrossRef]
  57. Cormos, C.-C. Decarbonization options for cement production process: A techno-economic and environmental evaluation. Fuel 2022, 320, 123907. [Google Scholar] [CrossRef]
  58. Mancini, V.; Verdone, N.; Trinca, A.; Vilardi, G. Economic, environmental and exergy analysis of the decarbonisation of cement production cycle. Energy Convers. Manag. 2022, 260, 115577. [Google Scholar] [CrossRef]
  59. Zheng, R.; Wang, Y.; Liu, Z.; Zhou, J.; Yue, Y.; Qian, G. Environmental and economic performances of municipal solid waste incineration fly ash low-temperature utilization: An integrated hybrid life cycle assessment. J. Clean. Prod. 2022, 340, 130680. [Google Scholar] [CrossRef]
  60. Wojtacha-Rychter, K.; Smoliński, A. Multi-Case Study on Environmental and Economic Benefits through Co-Burning Refuse-Derived Fuels and Sewage Sludge in Cement Industry. Materials 2022, 15, 4176. [Google Scholar] [CrossRef]
  61. Lu, Y.M.; Yue, T.X.; Chen, C.F.; Fan, Z.M.; Wang, Q.M. Solar radiation modeling based on stepwise regression analysis in China. J. Remote Sens. 2010, 14, 852–864. [Google Scholar]
  62. Wu, M.Q.; Zhang, A.D.; Kan, Z.Q.; Sun, X.B.; Lin, X. Land surface temperature retrieved using MODIS data in Shandong Province. In Proceedings of the 2013 21st International Conference on Geoinformatics, San Francisco, CA, USA, 20–22 June 2013. [Google Scholar]
  63. Lee, J.M.; William, B.W. Building emergy analysis of Manhattan: Density parameters forhigh-density and high-rise developments. Ecol. Model. 2017, 363, 157–171. [Google Scholar] [CrossRef]
  64. Miller, B.I. A study of the fifilling of hurricane Donna over land (2000). Mon. Weather Rev. 1964, 92, 389–406. [Google Scholar] [CrossRef]
Figure 1. Sustainability study framework in the cement production system.
Sustainability 14 16380 g001
Figure 2. Cement production system of the targeted plant.
Sustainability 14 16380 g002
Figure 3. Emergy diagram of the conventional cement production system.
Sustainability 14 16380 g003
Figure 4. Emergy diagram of the cement production system integrating clean energy.
Sustainability 14 16380 g004
Figure 5. Comparison analysis from Hypothesis 1 to Hypothesis 4.
Sustainability 14 16380 g005
Figure 6. Change analysis of the sustainable indexes from Hypothesis 1 to Hypothesis 4.
Sustainability 14 16380 g006
Figure 7. Comparison analysis of the primary indexes from Hypothesis 5 to Hypothesis 8.
Sustainability 14 16380 g007
Figure 8. Change analysis of the five indexes from Hypothesis 5 to Hypothesis 6.
Sustainability 14 16380 g008
Figure 9. Quantitative change magnitude from Hypothesis 5 to Hypothesis 8.
Sustainability 14 16380 g009
Figure 10. Methane power generation process.
Sustainability 14 16380 g010
Figure 11. The emergy diagram of the biological power generation system.
Sustainability 14 16380 g011
Figure 12. Sustainable indicator comparison.
Sustainability 14 16380 g012
Figure 13. Indicator change comparison based on solar energy input.
Sustainability 14 16380 g013
Figure 14. Indicator change comparison based on a clay substitute.
Sustainability 14 16380 g014
Figure 15. Indicator change comparison based on a limestone substitute.
Sustainability 14 16380 g015
Table 1. DALY details of exhaust gas.
ItemHuman Health DamageDALY (a/kg)
DustRespiratory disease5.46 × 10−5
SO2Respiratory disease8.87 × 10−5
NOxRespiratory disease3.75 × 10−5
Table 2. Five emergy sections showing the cement production system.
Section Item DataRef. For DataUEVs
(sej/Unit)
Emergy
(sej/Yr)
UEVs Ref.%
Renewable energy sectionSunlight4.2 × 1014 JCalculated 14.2 × 10¹⁴[39]0.00
Rain
(chemical energy)
2.42 × 10¹¹ JCalculated2.35 × 1045.69 × 1015[39]0.00
Rain(geopotential)1.01 × 10¹¹ JCalculated2.79 × 1042.82 × 1015[39]0.00
Wind(kinetic)5.31 × 10³ JCalculated1.9 × 1031.01 × 107[39]0.00
Geothermal heat4.2 × 103 JCalculated3.44 × 1041.44 × 108[39]0.00
Non-renewable resource partClay2.4 × 1010 kgCollected 2.0 × 10124.8 × 1022[25]4.21
Gypsum 6.73 × 10¹⁰ kgCollected1.27 × 10128.55 × 1022[25]7.50
Limestone 6.84 × 10¹¹ kgCollected1.27 × 10128.69 × 1023[25]76.2
Fly ash5.6 × 108 kgCollected1.4 × 10137.84 × 1021[40]0.69
Residue 9.4 × 10⁷ kgCollected1.42 × 10121.33 × 1020[32]0.01
Water 2.5 × 10¹⁰ kgCollected1.29 × 1063.23 × 1016[40]0.00
Non-renewable energy sectionElectricity 2.81 × 10¹⁷ JCollected4.5 × 1051.26 × 1023[40]11.09
Coal 5.2 × 10¹⁵ JCollected8.77 × 1044.56 × 1020[32]0.04
Labor section Labor and service 6.8 × 10⁸Collected7.42 × 10115.05 × 1020[41]0.04
TransportationTransportation72 t·kmCollected7.61 × 10115.48 × 1016[25]0.00
Air pollutants sectionDust 80 mg/m3Calculated~1.34 × 1012[42]0.00
SO220 mg/m3Calculated~2.89 × 1011[42]0.00
NOX50 mg/m3Calculated~7.13 × 1011[42]0.00
Total 100
The detailed calculation process of Renewable energy section can be found in the Appendix A.
Table 3. Emergy indicator list.
No. Indexes Value
1Renewable rate (Re)0.0%
2Non-renewable rate (Nr)88.6%
3Emergy yield ratio (EYR)7.45
4Environmental loading ratio (ELR)126.6
5Emergy sustainability indicator (ESI)0.058
Table 4. Emergy indicator changes from Hypothesis 1 to Hypothesis 4.
Indexes 5% Change−5% Change10% Change−10% Change
Former Latter Former Latter Former Latter Former Latter
Re0.0%0.0%0.0%0.0%0.0%0.0%0.0%0.0%
Nr88.6%89.38%88.6%88.4%88.6%89.82%88.6%87.79%
EYR7.458.427.457.627.458.827.457.22
ELR126.6135.3126.6122.4126.6141.8126.6115.9
ESI0.0580.062230.0580.062250.0580.06220.0580.06229
Table 5. Emergy indicator changes from Hypothesis 5 to Hypothesis 8.
Indexes 5% Change−5% Change10% Change−10% Change
Former Latter Former Latter Former Latter Former Latter
Re0.0%0.0%0.0%0.0%0.0%0.0%0.0%0.0%
Nr88.6%92.7%88.6%85.1%88.6%96.5%88.6%81.2%
EYR7.458.367.457.677.458.717.457.33
ELR126.6134.4126.6123.3126.6139.9126.6117.8
ESI0.0580.0620.0580.06220.0580.06230.0580.062
Table 6. Emergy calculation details.
InputDataRef. For DataUEVs (sej/Unit)UEVs Ref.Emergy (sej)
Sunlight3.24 × 1011 JCollected 1[39]3.24 × 10¹¹
Rain (chemical energy)5.1 × 10⁸ JCollected2.35 × 104[39]1.2 × 10¹³
Rain (geopotential)8.2 × 10⁸ JCollected2.79 × 104[39]2.29 × 10¹³
Wind (kinetic)6.72 × 10² JCollected1.9 × 103[39]1.28 × 10⁶
Geothermal heat8.1 × 102 JCollected3.44 × 104[39]2.79 × 10⁷
Water 3.3 × 10¹⁴ kgCollected1.29 × 106[39]4.26 × 10²⁰
Manure 2.49 × 10¹⁶ kgCollected1.68 × 106[43]4.18 × 10²³
Total 4.18 × 10²³
Table 7. The enhanced emergy indicator list.
Sustainable Indexes Previous Index Improved Index
Renewable rate (Re)0.0%29.3%
Non-renewable rate (Nr)88.6%70.7%
Emergy yield ratio (EYR)7.452.02
Environmental loading ratio (ELR)126.63.42
Emergy sustainability indicator (ESI)0.0580.591
Table 8. Change in sustainable indexes by considering a solar energy input.
Sustainable IndexesPrevious Index Improved Index
Renewable rate (Re)0.0%11.1%
Non-renewable rate (Nr)88.6%88.9%
Emergy yield ratio (EYR)7.451.12
Environmental loading ratio (ELR)126.69.01
Emergy sustainability indicator (ESI)0.0580.125
Table 9. Change in the sustainable indexes by considering a clay substitute.
Sustainable IndexesPrevious Index Improved Index
Renewable rate (Re)0.0%4.22%
Non-renewable rate (Nr)88.6%95.8%
Emergy yield ratio (EYR)7.456.53
Environmental loading ratio (ELR)126.623.69
Emergy sustainability indicator (ESI)0.0580.276
Table 10. Change in the sustainable indexes by considering a 10% limestone substitute.
Sustainable IndexesPrevious Index Improved Index
Renewable rate (Re)0.0%10%
Non-renewable rate (Nr)88.6%90%
Emergy yield ratio (EYR)7.4512.08
Environmental loading ratio (ELR)126.613.08
Emergy sustainability indicator (ESI)0.0580.924
Publisher’s Note: MDPI stays neutral with regard to jurisdictional claims in published maps and institutional affiliations.