Abstract
Based on provincial dynamic panel data from 2010 to 2019, this paper constructs a panel threshold model and explores the nonlinear relationship between environmental regulation and economic growth through channels of technological innovation. In addition, a spatial panel Durbin model is constructed to test the spatial spillover effects of environmental regulation and technological innovation on economic growth. The results show that environmental regulation has a significant positive impact on economic growth through channels of technological innovation. The interaction between environmental regulation and technological innovation has a single threshold effect on economic growth. When the intensity of environmental regulation exceeds the critical value, environmental regulation will change from promoting economic growth to inhibiting economic growth through channels of technological innovation. Environmental regulation has negative spatial spillover effect on economic growth of neighboring regions, while technological innovation has positive spatial spillover effect on economic growth of neighboring regions.
1. Introduction
The contradiction between environmental protection and economic growth has been widely debated by the international community. After joining the WTO, China has become the Second largest economy of the world. However, under the guidance of “economic priority”, extensive development is accompanied by massive resource consumption and environmental degradation. Environmental problems have been exposed sharply and become the focus of economic growth. In 2020, chemical oxygen demand emissions from China’s wastewater, emphysema sulfur dioxide emissions, particulate matter emissions and volatile organic matter emissions reached 25.648 million tons, 3.182 million tons, 6.114 million tons and 6.102 million tons, respectively.
This reflects relatively serious environmental pollution and weak environmental supervision. Therefore, strengthening environmental regulation has become an inevitable choice for China. Faced with an increasingly severe environmental situation, China has realized the importance of environment protection. In the 14th Five-Year Plan, a series of countermeasures has been put forward to advocate green and low-carbon development, vigorously optimize ecological environment, obtain new achievements in the construction of ecological civilization, and attain harmony between man and nature. According to traditional economic theory, technological innovation is the core power of economic growth and the fundamental way to transform economic growth mode. Enterprises are the main body of economic development and technological innovation. Therefore, technological innovation of enterprises is the fundamental and effective channel to balance environmental protection and economic growth [1,2]. How to promote efficiency of technological innovation to realize harmony between environment and economy is a difficult problem in China. We attempt to construct a dynamic panel model with the data of 30 provinces in China except Tibet (Considering the integrity and availability of data, Tibet is excluded.) from 2010 to 2019. System GMM is adopted to explore the impact mechanism of environmental legislation on economy through technological innovation channels. We empirically test the non-linear and spatial relevance between regulation and economy by panel threshold model and spatial panel Durbin model.
The structure of this article is as follows: relevant literature and the environmental regulation theory of economic growth is reviewed in Section 2. An econometric model and estimated indicator variables are constructed in Section 3. In Section 4, the system GMM analysis of the dynamic panel model is conducted to explore the economic benefits of regulation, meanwhile the panel threshold model and the spatial panel Dubin model is used to verify the threshold effect and spatial spillover effect. Conclusions and policy implications are put forward in Section 5.
2. Literature Review
2.1. Literature on the Direct Relationship
There is lots of literature on the relationship of environmental regulation and economic growth, but research results are controversial. Costa-Campi et al. [3] investigated the influence of electricity regulation on economy, and found that the economic growth rate and social electricity consumption were significantly negatively affected by the two regulatory policies of renewable energy promotion costs and industrial network costs. Coria and Jaraite [4] used Swedish companies as case studies and found that CO2 emission regulations have less obvious impact on business production behaviors and operating profits. Hering and Poncet [5] took Chinese cities as case studies, and their study showed that strengthening regulation by the government has a negative influence on enterprise exports. Wang et al. [6] studied the data of 37 industries in China and found that atmospheric environmental regulation had an inhibitory effect on the total factor productivity. Albrizio et al. [7] used cross-country data to study the heterogeneity of the influence of regulation intensity on the productivity growth rate in different productivity firms, and discovered that stricter regulatory policies have improved efficiency of high-productivity firms, while it reduced the production efficiency of low-productivity enterprises. Subject to the availability of data and the size of data samples, there is still no convincing detailed study on the mechanism of how regulations affect the efficiency of enterprises. Calel and Dechezlepretre [8] focused on the impact of the EU’s specific environmental regulatory policy on the innovation ability of enterprises. Research showed that this policy improved both technological innovation and total factor productivity of regulated enterprises. In the view of urban perspective, Chen et al. [9] found that series of governance can help optimize the atmospheric environment and promote the quality of economy in China. Shi et al. [10] tested the mechanism of regulation on regional economy by difference-in-difference method, and found that the economic dividend brought by environmental regulation has a marginal increasing effect. Qian et al. [11] and Wang et al. [12] empirically tested the influence of regulation on green economy efficiency with the data of China’s provincial level and OECD industrial sector, respectively. The former pointed out that with continuous enhancement of regulation, green economy efficiency shows characteristics of U-shaped change. Meanwhile, the latter held the influence of regulation on green economy efficiency, presenting an inverted U-shaped change. Shang et al. [13] believed that environmental regulation would have a nonlinear effect of “first promoting, then inhibiting” on green technology innovation.
2.2. Literature on the Indirect Relationship
The second part of study tried to verify the indirect effect of regulation on economy. Porter et al. [14] set forth the famous “Porter hypothesis”, proposing that regulation with moderate intensity can boost enterprise technological innovation, offsetting the increase in production costs due to the increase in relative prices of production factors, and then increasing productivity. Subsequently, many scholars have verified the hypothesis. Lanjouw and Mody [15] took three developed countries as examples to test the relationship between regulation and technology innovation. They found out that technological innovation and regulation has a positive correlation lag period of 1–2 years. Different from Lanjouw’s research, Brunnermeier and Cohen [16] added government inspection and supervision activities as additional variables to estimate the strength of regulation. The results showed a small but statistically remarkable positive correlation between the cost of pollution control and technological innovation. For every $1 million increase in pollution control costs, technological innovation increases by 0.04%. However, it has not been found that government supervision and inspection activities have a significant influence on technological innovation. Song and Wang [17] used the DEA method to decontruct environmental efficiency into technical factors and environmental regulation factors. It is proposed to promote industrial upgrading through technological progress, and improve environmental efficiency by strengthening regulations in China. Chen et al. [18] used Chinese companies as a case study, revealing the positive impact of environmental supervision on improving the green innovation capability of enterprises.
Santis and Lasinio [19] tested the “Weak Porter Hypothesis” based on European economic data from 1995 to 2008, and found out that strict environmental policies benefit the enhancement of production efficiency and technological upgrading.
2.3. Research Ideas of This Paper
Up to now, most of the research literature measured environmental regulation by a single variable, mainly focusing on the monistic relationship between regulation and economy, ignoring the spillover, feedback and coupling effects of technological innovation. In view of this, this paper attempts to make the following four contributions: First, we adopt principal component analysis (PCA) and stochastic frontier analysis (SFA) to systematically study regulation intensity in different areas and efficiency of technological innovation, respectively. Second, this paper constructs a dynamic panel data model to study the influence of regulation on economy and the moderating effect of technological innovation in the relationship between the two. Third, we empirically test the threshold effect of the interaction between regulation and innovation on economy with the panel threshold model, and explore their nonlinear impact relationship through the channel of innovation. Fourth, a spatial panel Durbin model is taken to verify the spatial spillover effects of regulation and innovation on economy.
3. Method
3.1. Theory about Environmental Regulation and Economic Growth
Since the 1970s, economic development has brought more and more serious environmental pollution problems. People have realized the necessity of environmental protection. Therefore, reducing environmental pollution and strengthening environmental regulation have gradually become popular choices of all countries and regions. Effective environmental regulation can minimize the negative influence on economic growth in regulated regions. Magat [20] put forward the idea that technological innovation is a key factor to balance environmental legislation and regional economic performance. There are some different theories about how environmental regulation might affect economy.
- (1)
- The Direct Effects of Environmental Regulation on Economic Growth
The traditional school of “cost theory” believes that environmental regulations are not conducive to economic growth because they increase the cost of companies and restrain the production efficiency. To address the externalities of environmental pollution, companies are required to make necessary investments in pollution control, adopt effective pollution reduction technologies, or develop and use new production processes. Under the premise of limited capital, the increase in pollution control input will erode the production input of companies, and lead to the decline of production performance so that it inhibits the development of economy. Christainsen and Haveman [21] argued that environmental regulation results in increased production costs, and investment in promising projects would be crowded out by capital investment to reduce pollution. In addition, the tightening of environmental regulatory standards will occupy part of the management time of enterprises, drain enterprises’ financial resources, and restrict the improvement of profits so as to constrain economic growth. Shen et al. [22] studied the influence of the government’s economic growth targets on green technology innovation. The results showed that economic growth targets had a significant inhibitory effect on green technology innovation.
- (2)
- The Indirect Effects of Environmental Regulation on Economic Growth
The “Innovation Compensation Theory” by Porter proposes that reasonable environmental supervision stimulates companies to innovate, offsets the cost constraint, and also brings about technological diffusion effects and structural optimization and upgrading, and improves the productivity of enterprises, thereby promoting economic growth. Danish et al. [23] believed that reasonable environmental regulations could effectively reduce the emission of pollutants, offset the market failure caused by the negative externalities of environmental pollution, and promote economic development. The government’s relevant policies have brought about technological innovation opportunities for enterprises, which will encourage companies to carry out environmental technology upgrades and production technology innovations, hastening product innovation compensation so that enterprise production costs will be reduced and product value will be increased. Meirun et al. [24] studied the dynamic effects of green technology innovation on economic growth and carbon dioxide emissions in Singapore by the ARDL model. The results showed that there was a significant positive relationship between green technology innovation and economic growth. At the same time, environmental regulation will also improve pollution control technology and environmental management innovation to optimize the production process of enterprises, improve resource productivity, and bring about the compensation effect of technological improvement during the production process. The joint effect of product and process innovation will promote companies to accelerate transformation and upgrading, thereby boosting regional economic prosperity. Carrión-Flores and Innes [25] proposed that by setting green barriers to entry, environmental regulation promotes enterprises that have been screened by environmental assessment standards to carry out technological innovation activities, promoting industrial restructuring, and then promoting regional economic development through the benign interaction of technological innovation and operation performance.
In summary, the influence of regulation on economy is achieved through combined effects of direct and indirect effects mediated by technological innovation. The detailed mechanism is shown in Figure 1.
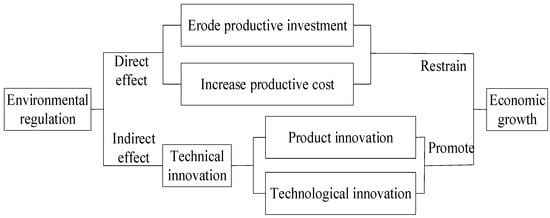
Figure 1.
Mechanism of environmental regulation on economic growth.
Strict environmental regulation will produce “following cost effect” and “innovation compensation effect”. Meanwhile the net effect of regulation is decided by which of the two effects is stronger and therefore needs to be tested by empirical research.
3.2. Model Construction and Method Description
To make a profound study on the impact of regulation and technological innovation on economy, we modify the ideas of Sohn et al. [26]. Considering the hysteresis effect of the dependent variable and the possible endogeneity of the model, a first-order lag term of the dependent variable economic growth is introduced. At the same time, in order to reflect the regional environmental regulation behavior caused by technological innovation, the interaction item between technological innovation and regulation is introduced. The model is specified as follows:
where lny denotes economic growth, er denotes environmental regulation intensity, rd denotes technological innovation efficiency, X denotes other control variable vectors that have an impact on economic growth, δi denotes region fixed effects, φ and Φ are the parameters which will be estimated, εi,t is the idiosyncratic error term.
- (1)
- The System GMM Method
By introducing the lag item of the explained variables in the regression model, a dynamic panel model is constructed to explore the influence of regulation on economy from a dynamic perspective. GMM constructs an equation with unknown parameters from moment conditions, and solves the parameters by using the equation. Neither the distribution of variables nor the exact distribution information of random error terms need to be assumed. The estimators of standard fixed effects model and random effects model are biased and inconsistent due to the existence of endogeneity. The generalized moment estimation method (System GMM) proposed by Blundell and Bond [27] solves the above problems well. Since the system GMM utilizes the information of the level change and difference of the endogenous variables at the same time, it is more effective than the differential GMM. Therefore, this paper uses the system GMM method to estimate the model.
- (2)
- Threshold Effect of Interaction Between Environmental Regulation and Technological Innovation
Hansen [28] introduced the econometric analysis method of Panel Threshold Regression Model, determined the threshold based on the minimization of residual sum of squares, tested the significance of the threshold, and established a regression model suitable for panel data.
This paper is based on Hansen’s panel threshold method to explore whether there are differences in influence coefficients of the interaction item of regulation and technological innovation on economy under different regulation intensity, that is, examining the threshold effect of the interaction item. The following threshold estimation model is constructed:
where I(·) is the indication function, the environmental regulation intensity er is the threshold variable, and τ is the specific threshold value. When the intensity er is less than the threshold value τ, the influence coefficient of the interaction item is θ3. When the intensity er is greater than the threshold value τ, the influence coefficient of the interaction item is θ4. The multi-threshold model can be extended by introducing more τ.
Two problems should be focused on in the threshold estimation. One is to estimate the threshold value τ and the estimated coefficients of the important variable er×rd, the other is to test the threshold value accordingly. τ and er×rd are obtained by minimizing the residual of the ordinary least squares estimation under the assumption of threshold. After obtaining the corresponding estimation coefficients, it is necessary to test and estimate the significance of the threshold effect and the confidence interval of the threshold value.
- (3)
- Spatial Panel Durbin Model (SPDM)
Sun and Wang [29] considered that there may be spatial spillover effect between regulation and economy in China considering the proximity of geographical space. The empirical analysis based solely on the classical panel model may lead to errors due to neglecting spatial correlations. Spatial Panel Durbin Model (SPDM) is an extension of panel data, which comprehensively examines the spatial correlation between independent variables and dependent variables, and has a unique advantage in identifying spatial structure patterns and spatial correlation between variables. Thus, this paper discusses the spatial spillover effects by spatial panel Durbin model and constructs a spatial econometric model:
3.3. Data
The variables included in the estimation model are defined as:
(1) Economic growth (lny). Economic growth is measured by GDP per capita in logarithmic form.
(2) Environmental regulation intensity (er). There is still controversy on how to measure environmental regulation in literature. The main alternative indicators include environmental regulation policy [30], emissions of different pollutants [31], emission density of different pollutants [32], per capita income level [33], proportion of investment in pollution control in industrial output [34], and resource consumption. The incompleteness of a single measurement index may lead to deviation of results. In view of this, we make use of the principal component analysis (PCA) method to measure regulation intensity systematically based on the mixed calculation of the actual regulation effect indicators in various regions.
In terms of index selection, on the basis of the availability, the relevant data of pollution discharge, resource consumption, pollution disposal and waste utilization indexes of 30 provinces and regions, except Tibet, during 2010–2019 are used as samples. The data derive from yearbooks such as China Environmental Statistics Yearbook, China Energy Statistics Yearbook and China Statistics Yearbook. Detailed indicators are shown in Table 1:

Table 1.
Index selection and formula.
Because of the differences between the dimensions and unit attributes of each index, the index should be dealt with to analyze the intensity of regulation. Parameters such as X1, X2, X3, X4, X5 are negatively correlated with the intensity and the reciprocal is taken for measurement. The data are standardized to obtain dimensionless data.
Taking Jiangsu as an example, this paper uses spss22.0 software to calculate regulation intensity by principal component analysis (PCA).
- (a)
- KMO and Bartlett test
KMO and Bartlett test are used to study the feasibility of the analytical method. Tts results show that the KMO statistic is 0.615, that is, the correlation between variables is strong. The significance level of Bartlett’s sphericity test is 0, which meets the conditions of factor analysis. Therefore, principal component analysis (PCA) can be carried out.
- (b)
- Extraction of principal components
Select the principal component whose feature root is greater than 1. Table 2 shows that the characteristic roots of the first two principal components are greater than 1, it is better to retain the two principal components, and the interpretation of the first two principal components to the total variance reaches 92.664%, that is, 92.664% of the total information of the original data is concentrated, thus transforming the nine original variables into two new variables. While playing a role of dimension reduction, it also basically contains the information of the original indicators. Therefore, Y1 and Y2 are extracted for analysis.
Table 2.
Total variance decomposition.
- (c)
- Calculation of the intensity of environmental regulation
Multiply calculated eigenvector matrix (Table 3) by standardized index value (), and the expression of the principal component function is as follows:
Table 3.
Eigenvector matrix.
By substituting the relevant index data of Jiangsu Province in 2010–2019 into the comprehensive principal component expression, the value of environmental regulation intensity (ERI) is obtained (Table 4).
Table 4.
ERI values of Jiangsu Province in 2010–2019.
Based on the above data processing method, ERI in 30 provinces and cities, except Tibet, in 2010–2019 is calculated. ERI is shown in Table 5. We can see that the ERI values of China’s regions in 2010–2019 basically show an increasing trend and the intensity increases year to year.
Table 5.
Environmental Regulation Intensity (ERI) values of provinces and autonomous regions in 2010–2019.
(3) Technological innovation efficiency (rd). In recent years, scholars have measured the efficiency of technological innovation by data envelopment analysis (DEA) and stochastic frontier analysis (SFA). Stochastic Frontier Analysis (SFA) works better for large sample analysis. Compared with other analytical methods, a significant advantage of the stochastic frontier analysis method is that it does not need to include all the influencing factors. SFA is to analyze the individual’s relative efficiency differences and to study the specific role of factors affecting efficiency differences. This effectively separates influence factors and determinants. With the data of large industrial enterprises in China, stochastic frontier analysis is used to estimate efficiency of technological innovation.
Following Battese and Coelli [35], a stochastic frontier model (SFA) of technological innovation efficiency is constructed for large industrial enterprises. The model is set as follows with patent application number as output index, R&D funds and R&D personnel as the input index:
where i means region, t means time, Y means output index, expressed as number of patent applications. X1 means the R&D investment, and X2 means the number of full-time R&D personnel. TE means technical efficiency and represents the technological innovation efficiency here.
(4) The control variable X in Equation (1) includes: (a) Capital factor lnk, expressed in logarithm of the total investment of fixed assets in China. (b) Labor factor lnw, calculated by the logarithm of the average salary of the employees.
Variable description statistics are shown in Table 6.
Table 6.
Variable description statistics.
4. Results and Discussion
4.1. Dynamic Panel Model Regression
According to the regression results of fixed effects and system GMM, the consistency of the sign and significance of the coefficients indicates the robustness of the research. Such regression results are shown in Table 7.
Table 7.
Panel data regression results.
It is necessary to carry out AR (1), AR (2) and Sargan tests on the estimation results as the prerequisite of the system GMM method. When p-value is greater than 0.1, we cannot reject the null hypothesis at 10% significance level. The test results of AR(1) and AR(2) show that there is only first-order autocorrelation in the difference of disturbance term instead of second-order autocorrelation. Therefore, the autocorrelation test is passed. As the null hypothesis of Sargan test, all instrumental variables are exogenous. There is no over identification of the model shown by Sargan test results, which validates the validity of the instruments.
According to results of model (4), the coefficient of one period lag of economic growth on the current period is 0.403, significant at 1% level, showing the dynamic positive sustainability of economic growth in China. The coefficient of regulation is −0.026, significant at 1% level, showing that regulation has a remarkable negative inhibitory impact on economic growth.
The coefficient of technological innovation efficiency is 0.256, significant at 1% level. The significance of positive impact on economic growth by technological innovation efficiency indicates that the improvement of technological innovation efficiency is a strong engine of regional economic growth. For the control variables, the influence coefficients of capital factor and labor factor are positive and significant at 1% level, indicating that production factors are the main driving force to boost regional economy.
We calculate the technological innovation effect of environmental regulation by the interaction item of environmental regulation and technological innovation. The result shows that the coefficient of the interaction item of environmental regulation and technological innovation is 0.013, significant at 1% level. So, we can find out that regulation will promote economy by the path of technological innovation. With the tightening of regulation standards, enterprises will improve production processes or enhance emission reduction capabilities through technological innovations to decrease costs. It will enhance the competitiveness of enterprises, and achieve economic growth while protecting the environment.
4.2. Threshold Effect Analysis of Interaction between Environmental Regulation and Technological Innovation
Then, we study the influence of interaction between environmental regulation and technological innovation on economic growth under different regulation intensity. F value of single threshold is 46.37, p value is 0.000, significant at 1% level. F value of double threshold is 10.85, p value is 0.623, not statistically significant. Therefore, we make use of a single threshold model for regression and relative results are shown in Table 8.
Table 8.
Estimation of threshold effect of interaction between environmental regulation and technological innovation.
It can be found from Table 8 that the coefficient of environmental regulation is negative and significant at 5% level while the coefficient of technological innovation is positive and significant at 1% level. The capital and labor coefficients are 0.210 and 0.318, and both are significant at 1% level.
The single threshold value of environmental regulation intensity is 1.120, which divides the intensity into two sections. The first section is the lower level of intensity. When er is less than threshold value of 1.120, the coefficient of er×rd is positive and significant at 1% level. The second section is the higher level of intensity; when er is bigger than threshold value of 1.120, the influence coefficient of er×rd is negative and significant at 1% level. It shows that when intensity is low, regulation will promote economy by the path of technological innovation. When intensity exceeds a certain range, the technological innovation effect will significantly restrain economy.
The intuition behind the threshold is that when regulation intensity is relatively low, the enforcement of regulation will encourage enterprises to promote the efficiency of technological innovation, and develop regional economy through “learning effect” and “innovation compensation effect”. When regulation intensity is too high, due to its own cost factors, the adaptive cost of enterprise environmental governance is too much, “innovation compensation effect” caused by supervision is less than its negative impact, and overly stringent environmental regulations stifle technological innovation and stifle economic growth.
4.3. Analysis of Spatial Spillover Effect
We construct the spatial weight matrix by Rook Contiguity, the adjacent element is 1, the non-adjacent element is 0, and we set Hainan and Guangdong provinces adjacent to each other to eliminate the island effect. The Moran’s I index of environmental regulation and economic growth in China from 2010 to 2019 is calculated with Stata 14.0 software. We find out that Moran’s I index is significant at 5% level, and environmental regulation and economic growth show significant spatial correlation. Since the influence of independent variables on dependent variables cannot be directly shown by the regression coefficients of the spatial panel Durbin model [36], we empirically study the spatial effects of environmental regulation on economic development from three aspects such as direct effect, indirect effect and total effect. Results are shown in Table 9.
Table 9.
Test results of spatial panel Durbin model.
Regarding the impact of environmental regulation on economic growth, from the angle of direct effect, the regression coefficient is −0.021, significant at 1% level. It shows that the regulation of each spatial unit has a remarkable negative influence on the economy of the spatial unit. For every unit of increasing regulation intensity, economic growth level of this spatial unit decreases by an average of 0.021%. From the angle of indirect effect, the indirect effect coefficient is −0.047, significant at 1% level. It shows that regulation has negative spillover effect on economy of adjacent spatial units. When environmental regulation intensity increases by one unit, the economic growth level of adjacent spatial units decreases by 0.047%. From the angle of total effect, the estimated coefficient is −0.068, significant at 1% level. When regulation intensity increases by one unit, the economic growth level of all spatial units decreased by 0.068%. By comparison, we find out that indirect effect is much greater than direct effect, which means the negative influence of regulation on economy in adjacent areas is more apparent than that of local regulation.
The impact of technological innovation on economic growth is also shown in Table 9. The direct effect coefficient is 0.174, significant at 1% level, indicating that economic development of the spatial unit is 0.174% for one unit increase in technological innovation efficiency. The indirect effect coefficient is 0.523, significant at 1% level. It shows that technological innovation has a positive spillover effect on economic growth in neighboring regions. When environmental regulation intensity increases by one space unit, the economic growth of adjacent space units is 0.523%. The total effect coefficient is 0.697, significant at 1% level. The economic growth of overall spatial units is 0.697% for each unit increase in technological innovation efficiency.
The direct effect coefficient of the interaction item of environmental regulation and technological innovation is 0.013, significant at 1% level. It shows that the interaction effect of each spatial unit will boost economy. The indirect effect coefficient of the interaction item is 0.022, significant at 1% level. We will find out that the interaction effect has positive spatial spillover effect on the economic growth of adjacent regions.
At the same time, both capital and labor benefit economic growth, indicating that capital and labor are the main positive factors driving economic development and the local capital and labor force’s role in promoting economic growth is greater than that in neighboring areas. Weber’s Location Selection Theory explains this result very well. Industries tend to choose areas with more abundant capital and labor factors for production. Therefore, the direct effect of capital and labor input is greater than the indirect effect.
5. Conclusions and Policy Implications
Resource depletion and environmental pollution have become a worldwide problem. How to take a sustainable developmental path that leads not only to economic development but also protection of the environment has become a focus of academia. With pollution discharge and resource consumption approaching the limit of environmental carrying capacity, changing China’s economic development pattern is imminent, and technological innovation is always the key to achieving environmental gains and economic prosperity. Therefore, facing the dual constraints of environmental improvement and economic growth, it is a theoretical and practical problem to study how environmental regulation promotes economic prosperity by means of technological improvement. By collecting the provincial panel data in China from 2010 to 2019, a dynamic panel data model is constructed to verify economic benefits of environmental regulation and technological innovation in economic growth. We construct a panel threshold model and Durbin model to study the threshold effect and spatial spillover effect. The study shows that: (1) Environmental regulation does not support economic growth, while improvement of technological innovation efficiency benefits economic growth. However, the interaction between environmental regulation and technological innovation is beneficial to economic growth. (2) The technological innovation effect of regulation has remarkable single threshold effect for economic growth. Low regulation intensity will promote economic prosperity by means of technological innovation. Meanwhile technological innovation effect of environmental regulation will restrain economy if regulation intensity is too high. (3) Environmental regulation shows a remarkable negative spatial spillover effect on economic development of neighborhood, and technological innovation shows a positive spatial spillover effect on the neighborhood.
The above empirical results contain important policy implications. Firstly, it is necessary to establish an appropriate environmental regulation system with reasonable grades of regulation and appropriate environmental regulation intensity that can significantly encourage enterprises to promote the effectiveness of technological innovation, and lower implementation cost in order to boost economy. Secondly, it is important to strengthen technological innovation, fully implement the “innovation-driven” strategy, and promote growth of the real economy so as to make technological innovation work efficiently in economic development and promote deep integration of science, technology and economy. Thirdly, the development and implementation of the environmental management policy should be guided by the promotion of technological innovation efficiency, and make full use of technological innovation to compensate for the disadvantage of “following cost” caused by environmental regulation. It is helpful for technological innovation to play a better role in adjusting environmental regulation and economic growth. Finally, in order to strengthen the overall planning of trans-regional environmental regulation and realize the common economic development of all provinces, environmental regulation must be developed in harmony with technological innovation.
This study enriches and expands the relevant theories about environmental regulation and economic growth, and provides a key decision-making basis for local governments to coordinate environmental protection and economic development. It has profound reference value for China to implement a reasonable environmental regulation system and promote technological innovation to jump away from the vicious circle named “economic growth-environmental deterioration” and fulfill a coordinated developing situation between environmental protection and economic prosperity.
Author Contributions
Methodology, L.H.; Writing—original draft, J.C. All authors have read and agreed to the published version of the manuscript.
Funding
This research received no external funding.
Institutional Review Board Statement
Not application.
Informed Consent Statement
Not application.
Data Availability Statement
The data derives from yearbooks such as China Environmental Statistics Yearbook, China Energy Statistics Yearbook and China Statistics Yearbook during 2010–2019.
Conflicts of Interest
The authors declare no conflict of interest.
References
- Mensah, C.N.; Long, X.; Dauda, L.; Boamah, K.B.; Salman, M.; Appiah-Twum, F.; Tachie, A.K. Technological innovation and green growth in the organization for economic cooperation and development economies. J. Clean. Prod. 2019, 240, 118–204. [Google Scholar] [CrossRef]
- Zhang, J.; Liu, Y.; Chang, Y.; Zhang, L. Industrial eco-efficiency in China: A provincial quantification using three-stage data envelopment analysis. J. Clean. Prod. 2017, 143, 238–249. [Google Scholar] [CrossRef]
- Costa-Campi, M.T.; García-Quevedo, J.; Trujillo-Baute, E. Electricity regulation and economic growth. Energy Policy 2018, 113, 232–238. [Google Scholar] [CrossRef]
- Coria, J.; Jaraite, J. Carbon pricing: Transaction costs of emissions trading vs. carbon taxes. Work. Pap. Econ. 2015, 609, 1–33. [Google Scholar] [CrossRef]
- Hering, L.; Poncet, S. Environmental policy and exports: Evidence from Chinese cities. J. Environ. Econ. Manag. 2014, 68, 296–318. [Google Scholar] [CrossRef]
- Wang, Q.; Ren, S.G.; Hou, Y. Atmospheric environmental regulation and industrial total factor productivity: The mediating effect of capital intensity. Environ. Sci. Pollut. Res. 2020, 27, 33112–33126. [Google Scholar] [CrossRef]
- Albrizio, S.; Kozluk, T.; Zipperer, V. Environmental policies and productivity growth: Evidence across industries and firms. J. Environ. Econ. Manag. 2017, 81, 209–226. [Google Scholar] [CrossRef]
- Calel, R.; Dechezleprêtre, A. Environmental policy and directed technological change: Evidence from the European carbon market. Rev. Econ. Stat. 2016, 98, 173–191. [Google Scholar] [CrossRef]
- Chen, S.Y.; Chen, D.K. Air pollution, government regulations and high-quality economic development. Econ. Res. J. 2018, 53, 20–34. [Google Scholar]
- Shi, B.B.; Feng, C.; Zhang, Y.; Yang, F. Increasing marginal effect of environmental regulation dividend. China Ind. Econ. 2017, 12, 40–58. [Google Scholar]
- Qian, Q.; Liu, X. Analysis of regional differences and influencing factors of green economic efficiency in China. China Popul. Resour. Environ. 2013, 23, 104–109. [Google Scholar]
- Wang, Y.; Sun, X.; Guo, X. Environmental regulation and green productivity growth: Empirical evidence on the Porter Hypothesis from OECD industrial sectors. Energy Policy 2019, 132, 611–619. [Google Scholar] [CrossRef]
- Shang, L.; Tan, D.; Feng, S. Environmental regulation, import trade, and green technology innovation. Environ. Sci. Pollut. Res. 2022, 29, 12864–12874. [Google Scholar] [CrossRef] [PubMed]
- Porter, M.E. Towards a dynamic theory of strategy. Strateg. Manag. J. 1991, 12, 95–117. [Google Scholar] [CrossRef]
- Lanjouw, J.O.; Mody, A. Innovation and the international diffusion of environmentally responsive technology. Res. Policy 1996, 25, 549–571. [Google Scholar] [CrossRef]
- Brunnermeier, S.B.; Cohen, M.A. Determinants of environmental innovation in US manufacturing industries. J. Environ. Econ. Manag. 2003, 45, 278–293. [Google Scholar] [CrossRef]
- Song, M.; Wang, S. Analysis of environmental regulation, technological progression and economic growth from the perspective of statistical tests. Econ. Res. J. 2013, 3, 122–134. [Google Scholar]
- Chen, F.; Shi, B.; Kang, R. Does Environmental Policy Reduce Enterprise Innovation?-Evidence from China. Sustainability 2017, 9, 872. [Google Scholar]
- De Santis, R.; Jona Lasinio, C. Environmental policies, innovation and productivity in the EU. Glob. Econ. J. 2016, 16, 615–635. [Google Scholar] [CrossRef]
- Magat, W.A. Pollution control and technological advance: A dynamic model of the firm. J. Environ. Econ. Manag. 1978, 5, 1–25. [Google Scholar] [CrossRef]
- Christainsen, G.B.; Haveman, R.H. The contribution of environmental regulations to the slowdown in productivity growth. J. Environ. Econ. Manag. 1981, 8, 381–390. [Google Scholar] [CrossRef]
- Shen, F.; Liu, B.; Luo, F.; Wu, C.; Chen, H.; Wei, W. The effect of economic growth target constraints on green technology innovation. J. Environ. Ment. Manag. 2021, 292, 112765. [Google Scholar] [CrossRef] [PubMed]
- Ulucak, R.; Khan SU, D.; Baloch, M.A.; Li, N. Mitigation pathways toward sustainable development: Is there any trade-off between environmental regulation and carbon emissions. Sustain. Dev. 2020, 28, 813–822. [Google Scholar]
- Meirun, T.; Mihardjo, L.W.; Haseeb, M.; Khan SA, R.; Jermsittiparsert, K. The dynamics effect of green technology innovation on economic growth and CO2. emission in Singapore: New evidence from bootstrap ARDL approach. Environ. Sci. Pollut. Res. 2021, 28, 4184–4194. [Google Scholar] [CrossRef]
- Carrión-Flores, C.E.; Innes, R. Environmental innovation and environmental performance. J. Environ. Econ. Manag. 2010, 59, 27–42. [Google Scholar] [CrossRef]
- Sohn, S.Y.; Jeon, J.; Han, E.J. A new cost of ownership model for the acquisition of technology complying with environmental regulations. J. Clean. Prod. 2015, 100, 269–277. [Google Scholar] [CrossRef]
- Blundell, R.; Bond, S. Initial conditions and moment restrictions in dynamic panel data models. J. Econom. 1998, 87, 115–143. [Google Scholar] [CrossRef]
- Hansen, B.E. Threshold effects in non-dynamics panels: Estimation, testing and inference. J. Econ. 1999, 93, 345–368. [Google Scholar] [CrossRef]
- Sun, X.; Wang, J. Effects of environmental regulation on Chinese enterprises size distribution. China Ind. Econ. 2014, 12, 44–56. [Google Scholar]
- Hao, X.; Deng, F. The marginal and double threshold effects of regional innovation on energy consumption structure: Evidence from resource-based regions in China. Energy Policy 2019, 131, 144–154. [Google Scholar] [CrossRef]
- Chen, Y.; Lee, C.C. Does technological innovation reduce CO2 emissions? Cross-country evidence. J. Clean. Prod. 2020, 263, 121–130. [Google Scholar] [CrossRef]
- Zhang, Y.; Xing, C.; Wang, Y. Does green innovation mitigate financing constraints? Evidence from China’s private enterprises. J. Clean. Prod. 2020, 264, 690–698. [Google Scholar] [CrossRef]
- Guarascio, D.; Tamagni, F. Persistence of innovation and patterns of firm growth. Research Policy 2019, 48, 1493–1512. [Google Scholar] [CrossRef]
- Wang, H.Q. Study on threshold effects of environmental regulation on economic growth from the perspective of human capital. China Soft Sci. 2016, 6, 52–61. [Google Scholar]
- Battese, G.E.; Coelli, T.J. Prediction of firm-level technical efficiencies with a generalized frontier production function and panel data. J. Econom. 1988, 38, 387–399. [Google Scholar] [CrossRef]
- LeSage, J.P.; Pace, R.K. Spatial econometric modeling of origin-destination flows. J. Reg. Sci. 2008, 48, 941–967. [Google Scholar] [CrossRef]

Publisher’s Note: MDPI stays neutral with regard to jurisdictional claims in published maps and institutional affiliations. |
© 2022 by the authors. Licensee MDPI, Basel, Switzerland. This article is an open access article distributed under the terms and conditions of the Creative Commons Attribution (CC BY) license (https://creativecommons.org/licenses/by/4.0/).