Abstract
Fossil fuel-based energy systems are mostly used for supplying energy that creates negative impacts on the environment, so in this study, the development of a 100% renewable energy system is evaluated for Pakistan for sustainable climate change. This study modeled three scenarios, namely, ongoing (ONG), energy saving policy (ESP), and green energy policy (GEP) scenarios using low emission analysis platform (LEAP) software for the study period 2022 to 2050 for Pakistan. The results revealed that a 100% renewable energy supply could be achieved through the GEP scenario. Model results show that the share of renewable sources in the total energy mix is 1117.08 TWh and non-renewable sources contribute only 18.12 TWh to meet the energy demand of 966.05 TWh until 2050. Non-renewable production leads to the generation of 8.85 million metric tons of carbon emissions, which is too low compared with the 135.47 million metric tons under the ONG scenario. The USD 1482.46 billion investment cost required for adding renewable energy capacity until 2050 is too high as compared with the USD 46.80 billion under the ONG scenario. Energy demand and production requirements are reduced by 34.18% under the ESP scenario until 2050. This approach can also be applicable to the majority of nations worldwide.
1. Introduction
As stated in the Fifth Assessment Report (AR5) of the Intergovernmental Panel on Climate Change (IPCC), United Nations, global warming in the South Asian region is predicted to be higher than the average worldwide warming [1]. South Asian nations are particularly vulnerable to the harmful effects of climate change due to socio-economic considerations, demographic trends, reliance on fossil fuels, and sluggish adaptation of renewable penetration measures. Furthermore, climate change is expected to affect glacier melt rates, weather patterns, and the strength and timing of the monsoon, also with implications for fossilized energy systems [2]. In this regard, Intended Nationally Determined Contributions (INDCs) at the United Nations Framework Convention on Climate Change (UNFCCC) Conference of the Parties in Paris in December 2015 intended to keep global temperature rise far below 2 degrees Celsius with the goal of limiting it even further to 1.5 degrees Celsius [3]. Limiting the rise in the global mean temperature at any level essentially requires that global carbon emissions be net zero by a certain point in the twenty-first century, even though the precise amount of carbon emissions associated with global warming below a given temperature threshold is unknown [4].
In order to achieve zero emission pathways, ambitious climate action goals are set and have recently gained higher momentum. European Union set a target in 2019 to reduce carbon emissions from 80% to 90% by the year 2050; furthermore, this path leads to achieving net zero carbon emissions [5]. With the intention of achieving net zero carbon emissions, the Green Deal was distributed in the 16th Congress. In June 2019, the UK passed legislation establishing a legally enforceable net zero carbon objective for the year 2050, making it the first G20 economy to achieve so [6]. Pakistan lacks such a practice. The largest source of carbon emissions in Pakistan is the country’s energy industry. However, Pakistan’s high reliance on imported fossil fuels, the construction of contested hydropower projects, and a growing reliance on antiquated coal technologies pose a danger to both energy security and the country’s economic progress [7].
Bioenergy, geothermal, solar, and wind are available options for reducing carbon emissions. Renewable electricity has been the preferred method over fossil-based power generation in recent years due to tremendous cost reductions in renewable energy technologies [8]. As such, IPCC suggested that renewables will need to account for 52% to 67% of the primary energy supply of the world by 2050 [9]. The International Renewable Energy Agency (IRENA) depicts that renewables will account for almost two-thirds of total energy consumption for the global energy transformation on the way to well below 2 degrees Celsius [10]. Aside from eliminating carbon emissions, transitioning to a highly renewable energy system has a number of other advantages, including resolving the issue of fossil fuel depletion, assuring energy supply security, stabilizing energy prices, and lowering pollution and health concerns [11].
Furthermore, in comparison to 100% renewable energy supply targets, the current policy framework is not ambitious enough to attain renewable energy targets [12]. California, Portugal, Bangladesh, Sweden, Colombia, and Cambodia are among the countries and territories that have established 100% renewable energy generation targets [13]. Outside of the power industry, Governmental targets for renewables are also significantly less aggressive. Cities such as Hague, Hamburg, Vancouver, and Frankfurt are setting goals for 100% renewable energy systems [14]. Denmark is now the only country that has set a goal of using 100% renewable energy in total final energy consumption by 2050 [15].
Pakistan, on the other hand, offers a large potential for renewable energy generation; several studies have been conducted to assess the potential of various renewable resources, including hydro, biomass, wind, tidal, geothermal, and solar [16]. The motivation factor for exploiting the power potential of renewable resources in Pakistan is the declining cost of renewable energy technologies [17]. However, there is not a single study in Pakistan that focuses on achieving a 100% renewable energy grid [18,19]. Therefore, during the transition period from 2022 to 2050 under this study, the country’s aggregated renewable energy potential is analyzed to determine to what extent renewable energy supply can meet the energy demand of all economic sectors, including residential, commercial, industrial, and agriculture. In this regard, the research gaps and significant contribution of this study are given below:
Research Gaps and Significant Contributions
Within a strong climate policy framework, carbon reduction targets should be aligned with exploiting renewable energy goals. Some research gaps have been discovered in the available literature between existing studies and studies on developing 100% renewable energy systems in terms of analytical technique and sectorial coverage, as noted below:
- In Pakistan, energy modeling tools are not being used to create a 100% renewable energy system.
- The techniques of least cost optimization and complete system solutions are not effectively addressed inside a 100% renewable energy system.
- When using energy modeling tools to analyze a 100% renewable energy system, it has been noted that balancing energy demand and production is a major challenge.
This work aims to overcome the research gaps between existing studies and studies on developing 100% renewable energy systems with the following significant contributions:
- To create an integrated modeling framework for evaluating the most cost-effective energy transition pathways, including when and how the transition to a 100% renewable energy system is possible.
- The simulation model of LEAP was used to investigate the feasibility of a 100% renewable energy mix based on exogenous and endogenous assumptions in Pakistan.
- Three scenarios are developed, including an ongoing scenario, energy saving policy scenario, and green energy policy scenario in a single LEAP model to compare renewable energy and fossil fuels targets side by side, providing insights that could aid policymakers in developing renewable energy policies that are consistent with carbon mitigation goals.
Section 2 presented a brief review of the 100% renewable energy system around the globe. Section 3 pertains to information related to the research area, including the present scenario of energy mix and energy source utilization in the country, with the main focus on domestic renewable and non-renewable assets. Research methodology covers the proposed model used in this study; model setup and complete data collection are given in Section 4. Section 5 covers results and discussion. Section 6 covers limitations and future research directions, and the conclusion and recommendations are presented in Section 7.
2. Current Research on 100% Renewable Energy Systems—A Review
There is no universal definition of 100% renewable energy systems, as evidenced by the published literature [20]. Many studies focused primarily on the electricity sector (specifically on the transition to a 100% renewable energy system), whereas others looked at the overall energy system (including industry, transportation, and heating/cooling). Both categories (electricity sector and overall energy system) are considered to obtain a comprehensive review of the current research [21].
The concept of 100% renewable electricity is currently gaining importance among a range of stakeholders. Denmark, Sweden, Cambodia, California, Mongolia, Bangladesh, Hawaii, Ethiopia, Barbados, Vietnam, Ghana, Uruguay, Costa Rica, Colombia, and Norway are among the countries aiming for a 100% renewable energy supply by 2045 or 2050 [22]. A similar trend has been followed by different communities around the globe, including for consuming 100% renewable energy supply such as Vancouver in Canada (2050), Copenhagen in Denmark (2050), Vaxjo and Malmo in Sweden (2030), Hague in the Netherlands (2040), and Hamburg and Frankfurt in Germany (2050) [23]. A similar trend can be seen in major corporations such as IKEA, BMW, and Walmart, as well as technology companies such as Sony, Google, Facebook, Apple, and eBay, among many others, and even the first company from the fossil energy industry named Wartsila, which has also committed to 100% renewable electricity system [24]. Europe, Australia, and North Africa have placed a greater emphasis on establishing a renewable energy grid based on a 100% renewable energy supply [25]. On the other hand, there is less tradition for 100% renewable energy systems in under-researched regions, including Sub-Saharan Africa, South Asia, Northeast Asia, South America, Southeast Asia, and Eurasia [26]. Decision-makers will have less support when establishing future high-renewable policies due to the lack of research. The research that is 100% is mainly centered on national studies, particularly in the developed regions. There is no single worldwide study that defines the clear path for energy transformation in developing countries (those countries which are rich in renewable sources) [27]. The literature review is conducted in terms of research emphasis (research focus, methodology, and typical geographies considerations) and approaches examined (energy modeling efforts) in constructing a 100% renewable energy system, as indicated in Table 1.

Table 1.
Current research on 100% renewable energy systems.
In order to implement the concept of this study, a total of 138 studies were reviewed, and only peer-reviewed journal articles were considered for this study. The exact number of studies on 100% renewable energy systems is given in Figure 1. The publications from the peer-reviewed journals that were chosen have a strong emphasis on supply-side strategies as well as demand-side tactics. Demand-side measures concentrate on reducing energy demands at the consumer level to minimize the need for energy supply by incorporating energy efficiency measures, whereas supply-side solutions focus on the integration of additional renewable energy sources or on technology integration to improve energy system efficiency. For all industries to switch to 100% renewable energy systems, demand reduction is essential. This analysis finds the best compromises between energy output measurements and energy savings measures.
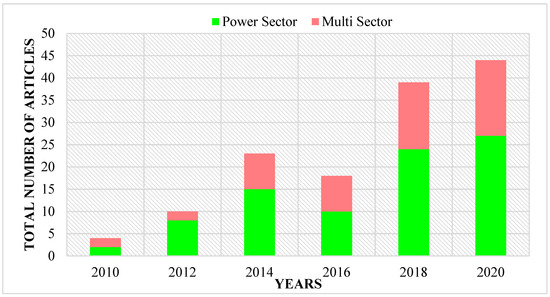
Figure 1.
According to the publication year, the number of 100% renewable energy studies.
3. Research Area
Baluchistan, Punjab, Khyber Pashtun Khuwa, and Sindh are the four provinces of Pakistan, plus Gilgit Baltistan, Azad Jammu, and Kashmir as special areas. The geographical breadth of this study is depicted in Figure 2 [37].
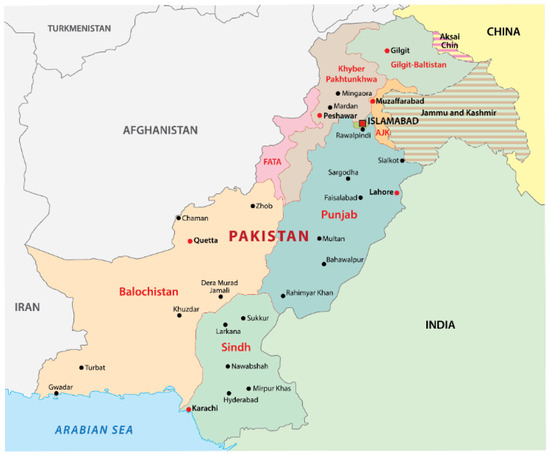
Figure 2.
This study takes into account all of Pakistan’s provinces and sub-regions.
3.1. Pakistan’s Current Energy Mix
The country’s installed capacity to generate energy increased by 3.6% from 35,972 MW in 2020 to 37,261 MW in 2021. According to the Economic Survey 2021, hydro generation’s proportion of the energy mix increased by 26% to 9874 MWs in 2021, as compared to hydel last year. Similarly, degasified liquefied natural gas (RLNG) based electricity has increased by 19.66% to 7325 MW. Residual furnace oil (RFO) based electricity has a 16.84% (6274 MW) stake in the energy mix, whereas coal-based power has a 12.80% (4770 MW) share. Natural gas accounts for 12.15% (4529 MW) of total electricity generation. Nuclear power now accounts for 6.68% (2490 MW) of electricity generation. Similarly, wind-generated power accounts for 3.31% (1235 MW) of the energy mix. Solar accounts for 1.07% of total power generation with 400 MW, while bagasse accounts for 0.98% with 364 MW [38].
Renewable electricity generation, particularly from wind, biomass, and solar, is less expensive in Pakistan than thermal and hydroelectric plants, and costs are likely to fall further in the future [39]. An increasing focus on renewable energy would lower electricity generation costs, cut carbon emissions, and alleviate the cost-tariff deficit problem. As reported by the National Electric Power Regulatory Authority (NEPRA) in January 2020, the average levelized cost of energy (LCOE) from solar is roughly 70 USD/MWh. The price drops to roughly 50 USD/MWh for plants with a power capacity of 50–100 MW [40]. However, according to the Economic Survey Report, there has been no significant change in the pattern of power usage. Agriculture’s share of total electricity usage was steady in 2021. However, the industry’s share of total electricity use has risen, indicating a recovery in economic activity [39,41]. Household electricity usage fell to 49.1% in 2021 from 49.2% compared with the previous year. The commercial sector’s electricity consumption also decreased to 7.4% in 2021 from 7.9% as compared with the previous year. The industrial sector, on the other hand, increased its electricity consumption to 26.3% in the time under review, compared to 25.5% in the same period last year. The agricultural sector’s consumption remained stable at 8.9% [39].
As seen in Figure 3, Pakistan’s energy sector has faced significant energy crises during the last few decades. Pakistan has implemented a number of energy projects in recent years to address its energy shortages, adding a total power generation capacity of 12.2 GW. While additional capacity has helped to alleviate urgent gaps to some extent, an inefficient transmission and distribution system has hampered the delivery of energy services to end users [42].
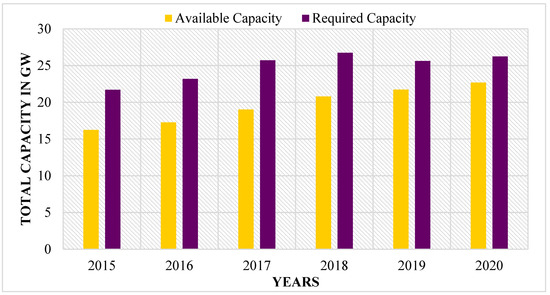
Figure 3.
Pakistan’s available and required capacity from 2015 to 2020.
Investments in renewable energy projects are difficult to gather in a struggling economy; as such, Pakistan needs to promote the role of domestic solar/wind prosumers so people’s active participation and a push at the grassroots level can help the economy to develop a de-fossilized energy system [43]. Unfortunately, the major problem is that Pakistan’s current power system structure is likely to attract large numbers of solar/wind prosumers and unable to develop a legislative framework that negatively encourages the transition from a fossilized to a de-fossilized energy system. Renewable energy sources currently account for about 4% of the country’s total energy mix [44].
3.2. Pakistan’s Fossil Fuels and Renewable Energy Potential and Resource Utilization
The catastrophic energy situation in Pakistan might have a long-term fix in renewable energy sources. A region of around 800,000 km2 in Pakistan has plenty of water, sunlight, and wind. Since it is an agricultural nation, there are several crops, agricultural waste products, and garbage that might be used to produce energy [45]. Pakistan is a sizable nation with a population of around 207 million. A third or more of the population lacks access to electricity. Over 40,000 towns and 44% of rural residences in the nation still do not have access to the main grid. Rural areas can employ solar, wind, biomass, and hydropower to meet their energy needs while also boosting the economy of the nation [46]. The summary on renewable energy sources and their potential is succinctly summarized below:
- Pakistan is in the sunniest region and has a lot of potential for solar energy [47]. The US National Renewable Energy Laboratory (NERL) conducted research to ascertain Pakistan’s solar energy potential in collaboration with the Alternative Energy Development Board of Pakistan (AEDB) [48]. The country is said to be in a location that is ideal for the development of solar energy projects in practice because the majority of its days are long and sunny. It also has high solar radiation and insulation. The country receives 8 to 10 h of sunlight each day in most of its regions, which receive an average of 15.5 to 1014 KWh of solar radiation annually, with 20 MJ/m of solar insulation and an average of 8.5 h of sunlight every day [48]. The province of Baluchistan has one of the highest potentials for sun irradiation, according to [49]. In addition, there is significant potential for solar energy production in the deserts of Punjab, Sindh, and Baluchistan. This land is perfect for solar installations because it is fertile and cannot be used for anything else [49]. Around 1600 GW per year, which is more than 40 times the capacity of the existing power generation system, is the estimated solar potential [50].
- Biomass in Pakistan offers enormous power potential [51]. Sixty-two percent of Pakistan’s population lives in villages and rural areas, making it an agricultural nation. These regions have employment opportunities in agriculture and vocations that are directly or indirectly related to agriculture [52]. The main source of energy generation in villages is traditional biomass, such as cow dung, fuel woods, and crop wastes [52]. According to [53], there are around 160 million animals in Pakistan, with a 9% yearly growth rate. On average, each animal produces 10 kg of excrement every day. More than 50 million people, or roughly 40% of the rural population, could be served by the efficient use of manure alone [53]. However, the majority of manure is used as fuel in its unprocessed form. Families use about 2300 Kg of firewood each year, 1200 Kg of crop waste, and 1500 Kg of manure. The author of [54] claims that the traditional way of resource use creates gases that are hazardous to human health, and this method is 25% less efficient. Along with other countries such as the United States, Germany, and Denmark, Pakistan’s AEDB has examined the possibilities of bagasse and waste for electricity generation in Pakistan [55]. Estimates indicate that garbage has a potential of 500 MW and bagasse has a capacity of 1800 MW [55].
- Pakistan is rich in wind energy resources [56]. In cooperation with the NREL, the United States Agency for International Development (USAID), and the Pakistan Meteorological Department (PMD), the AEDB of Pakistan has produced the nation’s first wind map [56]. Numerous locations have been found to have wind-generating potential, including Sindh, Baluchistan, and portions of Punjab [57]. Three hundred and forty-six gigawatts is the estimated total amount of economically exploitable wind potential [57]. The AEDB has identified a number of areas across the nation where wind-generating plants can be installed with the help of the private sector [58]. One example of such a place is the Ghoro-Keti Bandar wind farm, which runs along Sindh’s coast and has an average wind speed of 7 m/s at 50 m above ground level. The power density is estimated to be 400 w/m with a capacity factor of 25% [58]. One example of such a place is the Ghoro-Keti Bandar wind farm, which runs along Sindh’s coast and has an average wind speed of 7 m/s at 50 m above ground level. The power density is estimated to be 400 w/m with a capacity factor of 25% [59].
- Hydropower generates a sizable portion of the electricity in Pakistan. The total electricity generating capacity of the nation is 37,261 MW, with hydropower making up 9874 MW (or 26%) of that amount in 2021 [60]. The country’s total hydropower capacity is estimated to be 100 GW, with 59 GW of locations already known [61]. The public and commercial sectors have built about 300 micro and mini hydroelectric power plants in areas that are not connected to the national grid [62]. Recently, the government proposed building small-scale hydroelectric projects in Pakistan’s northern areas. Additionally, the Water and Power Development Authority (WAPDA) plans to produce at least 16,000 MW of electricity from hydro by 2025 [62].
- Geothermal energy, often known as earth heat, is a free, sustainable, clean, and renewable source of energy that can satisfy the nation’s rising energy needs [63]. Geothermal energy is accessible in Pakistan in the form of hot springs, geysers, steam springs, and subsurface hot aquifers [64]. Pakistan has been found to have abundant geothermal energy resources that can produce 100,000 MW of electricity at between 5 and 10 cents per unit [64]. Perhaps geothermal is one of Pakistan’s undiscovered energy options for producing electricity [65]. Most of Pakistan’s mud volcanoes and geothermal hot springs are located in its seismic belt [65].
- More than a third of the nation’s overall energy production comes from imported oil, making it a significant source of primary energy [66]. When compared to the enormous demands of the nation, Pakistan’s entire resource potential is estimated to be 22 million barrels [66]. The nation imports the majority of its oil due to low domestic production and high consumption [67]. Eighty-three percent of all the oil used in the nation is imported, according to the Sustainable Development Policy Institute (SDPI) [68]. The importation of petroleum products puts a heavy financial burden on the nation’s already precarious economy because oil is an expensive commodity. According to the Ministry of Finance in Pakistan, from 2021, Pakistan spent approximately USD 11.35 billion on petroleum imports, or more than 40% of all imports [16].
- Coal reserves are abundant throughout Pakistan. With proven reserves of 207 billion tonnes, Pakistan is believed to have 185 billion tonnes of total resources [69]. The majority of Pakistan’s known coal reserves are located in the Thar region of Sindh province [37]. Despite having a substantial resource base, Pakistan has not used coal to generate power. Compared to its potential, coal’s share of the world’s primary energy supply in 2021 will be negligible at 12.8% [70]. The coal deposits in the country are regarded to be of poor grade and contain higher concentrations of sulfur and ash. It is believed that despite its low quality, it nevertheless provides enough energy for domestic needs [70].
- Pakistan acquired nuclear technology in the 1970s. The government did not start using nuclear technology to generate electricity for three decades [71]. The year 2001 saw a total of 325 MW added to the grid. Nuclear technology has a history of being slow to advance. By the end of 2021, nuclear energy produced 4529 MW of power, representing 12.15 percent of the nation’s primary energy sources [72]. The Pakistani government has decided to strengthen the role that nuclear energy plays in the nation’s energy supply and has given the Pakistan Atomic Electricity Commission (PAEC) the go-ahead to build a system that can generate around 9000 MW of electricity by 2030 [73].
- According to the Energy Information Administration (EIA) [74], Pakistan has natural gas reserves of 282 trillion cubic feet (Tcf), with 24 Tcf of those reserves potentially recoverable. In Pakistan, natural gas has long been a significant energy source. It is concerning that the nation’s domestic natural gas reserves have already reached their peak as a result of rising demand from the power, industrial, and residential sectors and that the government is having trouble increasing natural gas output [75]. The country’s current resources will run out in 17 years if they are used at the current rate. In reality, consumption is most likely to grow by a factor of four, accelerating depletion [72].
4. Research Methodology
In Pakistan, energy transition pathways toward a 100% renewable energy supply have never been investigated. Pakistan is falling short of its climate goals and has a large gap in renewable energy adoption. As a result, the LEAP energy transition model is used to optimize Pakistan’s energy system from 2022 to 2050.
4.1. Proposed Method
The concept of a green and sustainable energy system is gaining importance for employing low-carbon future pathways and providing information on clean transition, environmental impacts, and economic consequences. Global carbon mitigation will help to limit the global temperature rise to 1.5 degrees Celsius; this will necessitate a rapid shift toward low-carbon energy sources and away from fossil assets. Earlier, the technique of a 100% renewable energy system was defined by IPCC United Nations in 2015 and has rarely been explored by developed and developing economic nations around the globe. In comparison to the existing energy system, the IPCC study notes that 100% renewable energy systems have much higher electrification levels and also the greater potential of geothermal, solar, biomass, hydro, geothermal, and wind exists. In this regard, LEAP software was used to create energy system transition paths in Pakistan. LEAP is a linear simulation and optimization tool that can predict future electricity production; manage demand accordingly; accommodate electricity units’ prices; forecast energy system capital, operational, and maintenance costs; and evaluate the carbon emissions based on the utilized energy sources for an entire or several years. The modeling and optimization algorithm’s main goal is to reduce the consumption of fossil assets, carbon emissions, and also the integrated energy system’s total annual system cost. The model aims to simulate and optimize the sum of installed capacities of each energy source, operational expenses, and generation ramping costs in order to calculate the lowest system cost, carbon emissions, and future energy production capacity of renewable sources. Under specified constraints, Pakistan’s energy transition is simulated in 10-year time intervals. The process flow associated with the LEAP model is depicted schematically in Figure 4.
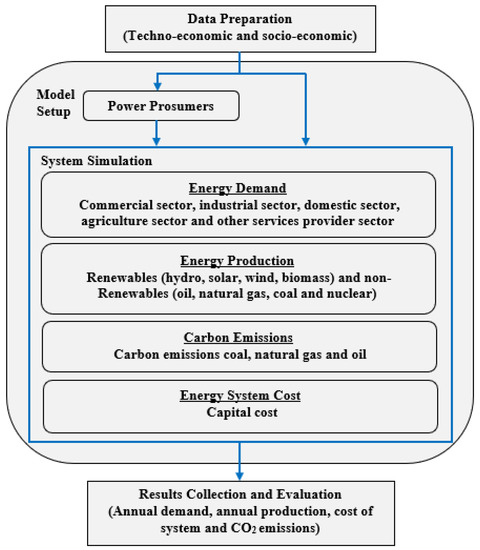
Figure 4.
Data flow schematic diagram for energy system transition.
4.2. LEAP Model Setup
The model has integrated all crucial aspects of an energy system, which includes energy demand sectors such as industrial, commercial, domestic, and agriculture and energy production sectors based on renewable and non-renewable energy sources. Considered techno-economic and socio-economic parameters in developing the LEAP model for Pakistan. All sectors are integrated and optimized together in full yearly resolution. Figure 5 illustrates the LEAP energy transition design.
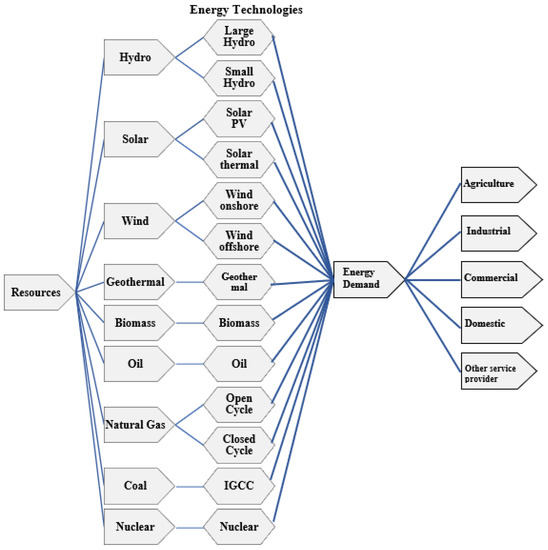
Figure 5.
LEAP energy transition model for Pakistan.
4.3. Main Input Parameters
The main input parameters for forecasting energy demand, production, CO2 emissions, and systems cost are considered based on the techno-economic and socio-economic parameters. LEAP energy demand module calculated energy demand based on the synthetic data, including key parameters of a region, such as population, the gross domestic product of the country and its growth rate, transmission and distribution losses, and past energy consumption patterns across the energy consuming sectors (industrial, commercial, domestic, agriculture, and other service provider sector). The data for the LEAP energy demand module are given in the annexure (Figure A1, Figure A2, Figure A3 and Figure A4) [19]. The energy production module of LEAP incorporated sustainable and clean technologies for harnessing power from domestic energy assets. The generation profile of the region for onshore wind energy, offshore wind energy, concentrated solar energy, and solar photovoltaic were calculated using the method explained in [76]. Hydropower is computed based on the water flow data using the method explained in [77]. Biomass and geothermal potential were estimated using the methods used in [28,78]. The power potential of nuclear, coal, natural gas, and oil-based power stations was calculated using the method described in [18]. Technical data, such as the capacity of power plants (exogenous capacity) in the LEAP energy production module, are given in the annexure (Figure A5 and Figure A6) [62]. Finally, CO2 emissions were also forecasted using the method described in [74]. The data for carbon emissions are also given in the annexure (Figure A7) [74]. Financial assumptions for finding the least cost solution are also critical in determining the energy transition path. Cost estimation for the energy generation system, energy conversion technologies, and also for transmission and distribution are considered in this study. Electricity prices of industrial, commercial, domestic, agriculture, and other service providers sector are also estimated using the method described in [73]. Financial assumptions for energy transition path are described in annexure (Figure A8) [73].
4.4. Scenario Analysis
In order to properly examine the potential transition pathways, three scenarios were taken into account. The following provides a detailed summary of these scenarios:
- Ongoing (ONG) scenario: Future energy demand, production, CO2 emissions, and cost of the energy system in Pakistan will be forecasted under the ongoing scenario. In order to create a solid foundation for the energy system transition analysis, in this case, the following constraints are taken into account:
- The purpose of this scenario is to go with the energy mix balance as suggested by the Government of Pakistan in the Indicative Generation Capacity Expansion Plan (IGCEP) of 2021 and considered that the same development will be proceeding in the future [62];
- As per IGCEP, power plants will run on imported fossil fuels, and also some new plants based on renewable sources will be established;
- Under this scenario, the hydro source will be exploited more as compared with other renewable sources.
- Green energy policy (GEP) scenario: The gradual elimination of carbon-emitting fuels, favoring more sustainable alternatives and also combatting the climate crisis. Future energy demand, production, CO2 emissions, and cost of the energy system in Pakistan will be forecasted under the renewable energy policy scenario. In order to create a solid foundation for the energy system transition analysis, in this case, the following constraints are taken into account:
- The aim of this scenario is to incorporate the Alternative and Renewable Energy (ARE) Policy of 2019. As per this policy, 20% of renewable energy will be generated by 2025, and 30% of renewable energy will be generated by 2030 [79];
- As per this ARE policy, no new nuclear, coal, natural gas, and oil-based power generation capacities could be built after 2030;
- This scenario emphasizes the use of domestic renewable (biomass, wind, solar and hydro) and non-renewable (nuclear, coal, oil, and natural gas) energy sources for power generation;
- Incorporating sustainable energy technologies (modem, latest and efficient) for harnessing electrical power;
- Under this scenario, solar, biomass, and wind source will be exploited more as compared with hydro sources because, in the future, a number of hydro plants will retire and focus less on the development of new hydro plants due to greater capital costs.
- Energy saving policy (ESP) scenario: Energy conservation or efficient use of energy resources has been implemented to cater to the energy deficit, which is cost-effective and environmentally feasible. In order to create a solid foundation for the energy system transition analysis, in this case, the following constraints are taken into account:
- This policy scenario is based on the National Energy Conservation Policy (NCEP) prepared by the National Energy Conservation Centre;
- This policy emphasizes end-use efficient devices for various energy consumption sectors. Its implementation is under consideration which promises a 20% to 25% reduction in total energy consumption [18];
- In this scenario, an energy model is built concerning the 20% decrease in electricity demand in comparison to the baseline scenario;
- This scenario will be part of the demand-side management DSM approach, which targets to reduce the current demand through using more efficient equipment and energy-saving measures, thus reducing the power generation;
- This strategy also helps in saving the initial and running cost of new power plants. A growth function is used in LEAP for the implementation of a 20% reduction in the overall demand sector.
5. Results and Discussion
The results of this study are forecasted for the study period 2022 to 2050. Results of ONG, GEP, and ESP scenarios are presented and compared in terms of energy demand, energy production, carbon emissions, and investment cost required to emphasize the greater renewable penetration.
The energy demand of all sectors is estimated in Figure 6. The demand for energy is increasing continuously throughout the study period, and the domestic sector is responsible for greater energy consumption because the day-by-day lifestyle of human beings is improved to a large extent. On the other hand, the industrial sector is also consuming greater energy because the new government has promoted the industries to boost the economy of the country. In this regard, the ratio of manufacturing industries is increasing to a greater number. The energy demand under the ONG and GEP scenarios is the same for the study period 2022 to 2050, but the energy demand is found to be very low under the ESP scenario because the energy-saving potentials of each sector are incorporated. ONG and GEP scenarios suggested that the energy demand of the domestic sector is 6686.67 TWh in the year 2050, followed by industrial 3682.77 TWh, agriculture 782.83 TWh, commercial 531.45 TWh, and others 833.02 TWh, respectively. The energy demand under the ESP scenario is found to be much less. The domestic sector consumed 5007.54 TWh of energy, followed by industrial 2708.42 TWh, agriculture 643.56 TWh, commercial 453.54 TWh, and others 655.71 TWh, respectively.
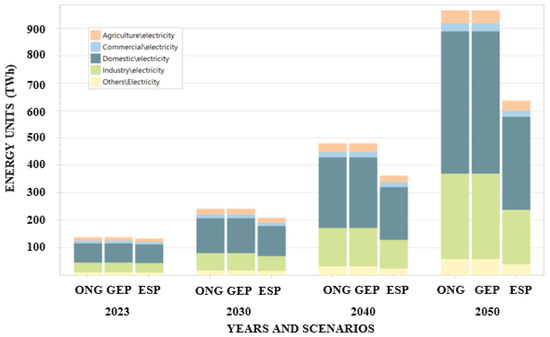
Figure 6.
Energy demand analysis under the ONG, ESP, and GEP scenarios.
Energy production is also estimated under the ONG, GEP, and ESP scenarios for the study period from 2022 to 2050, as shown in Figure 7. The share of hydro is greater under the ONG scenario because the government wants to install more hydro plants in the future, whereas under the GEP scenario, the share of biomass, wind, and solar is greater, which is suggested in the ARE policy. ESP scenario incorporated the energy saving potentials, which ultimately reduces the power generation capacity. In the ONG scenario, the hydro source has the greater contribution of 614.14 TWh in the total energy mix, followed by wind 177.07 TWh, coal 144.48 TWh, LPG 75.57 TWh, solar 64.61 TWh, nuclear 32.74 TWh, biomass 19.15 TWh, natural gas 7.25 TWh, and oil 0.19 TWh until 2050. Under the ESP scenario, the hydro source has a greater contribution of 404.21 TWh in the total energy mix, followed by wind 116.54 TWh, coal 95.09 TWh, LPG 49.74 TWh, solar 42.53 TWh, nuclear 21.55 TWh, biomass 12.60 TWh, natural gas 4.77 TWh, and oil 0.12 TWh until 2050. Finally, under the GEP scenario, 30% contribution of biomass, wind, and solar will be incorporated into the total energy mix by 2030. If this trend proceeds until the year 2050, biomass contribution in the total energy mix will be 378.80 TWh, followed by wind 368.56 TWh, solar 356.70 TWh, hydro 13.82 TWh, coal 8.83 TWh, LPG 6.45 TWh, nuclear 1.94 TWh, natural gas 0.88 TWh, and oil 0.02 TWh, respectively.
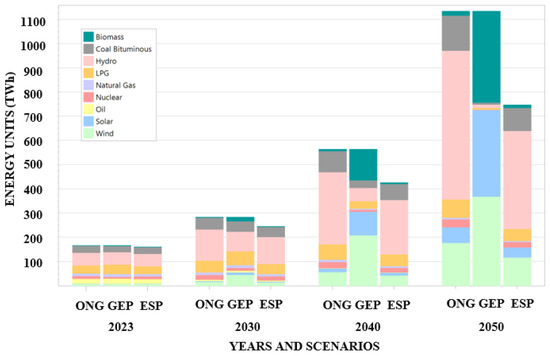
Figure 7.
Energy production analysis under the ONG, ESP, and GEP scenarios.
Carbon emissions of fossil fuels are also forecasted for the study period 2022 to 2050, as shown in Figure 8. Under the ONG scenario, coal produced 138.27 million metric tons of carbon emissions, followed by natural gas producing 3.17 million metric tons and 0.10 million metric tons by 2050. Under the ESP scenario, energy demand and production are reduced by incorporating energy efficiency measures, so carbon emissions are also reduced to some extent, but coal still contributed more, around 91.01 million metric tons, which was followed by natural gas, 2.09 million metric tons, and oil, 0.06 million metric tons by 2050. Under the GEP scenario, coal will produce 8.45 million metric tons of carbon emissions, followed by natural gas, 0.38 million metric tons, and oil, 0.01 million metric tons, by 2050.
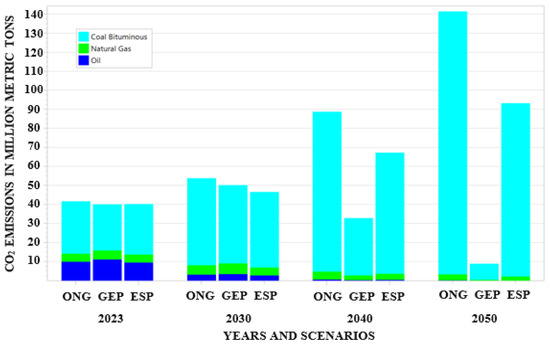
Figure 8.
Carbon emissions analysis under the ONG, ESP, and GEP scenarios.
The investment cost required to implement the energy systems is also forecasted, as shown in Figure 9. In the ONG and ESP scenarios, investment costs required lesser because the existing capacity will deliver power until 2050, and some new plants will also be installed to meet the energy demand of the nation. The greater investment cost required for the development of a hydro plant is USD 23.96 billion; solar, USD 9.47 billion; wind, USD 7.85 billion; coal, USD 3.14 billion; biomass, USD 1.27 billion; and nuclear, USD 1.10 billion until 2050. Under the GEP scenario, the development of solar power plants requires a greater investment cost of USD 417.07 billion; biomass, USD 286.31 billion; wind, USD 147.11 billion; hydro, USD 1.41 billion; coal, USD 0.94 billion; and nuclear, USD 0.40 billion until 2050, respectively.
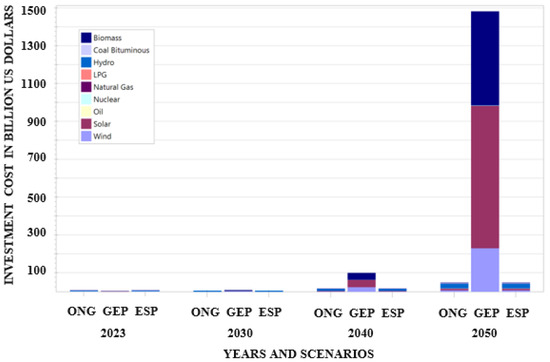
Figure 9.
Investment cost required under the ONG, ESP, and GEP scenario.
6. Limitations and Future Directions
The limitations of this work are discussed below:
- In all scenarios, the priority of energy sources for power dispatch was not set in the LEAP model because the purpose was to show the total carbon emissions as per the running policies of Pakistan’s power sector;
- We did not incorporate the geothermal and tidal energy resources for power production.
- The future directions of this research are discussed below:
- CO2 emissions can also be reduced by exploiting geothermal and tidal energy potential in Pakistan;
- There is a provision to forecast results based on hourly resolution data.
7. Conclusions
The objective of this study was to develop a clean energy transition pathway for developing, underdeveloped and developed countries and also to create optimal balances between energy savings and renewable energy output measures. We discussed and provided a set of recommendations in this paper, and then we applied this framework to Pakistan. The Low Emissions Analysis Platform (LEAP) software was used for modeling this study for the period 2022 to 2050. Three scenarios were developed, namely, ongoing (ONG) scenario, energy saving policy (ESP) scenario, and green energy policy (GEP) scenario, to find the exact solution to the green energy future. ONG scenario supports the ongoing fossil fuel-based energy projects, which are suggested by the indicative generation capacity expansion plan of Pakistan. ESP scenario incorporated the 20% energy saving potentials in the energy demand side, which is suggested by the national energy conservation policy of Pakistan, and the GEP scenario supports the 30% share of biomass, solar, and wind by 2030, which is suggested by the alternative and renewable energy policy of Pakistan. The results of this study are described given below:
- In the ONG scenario, energy production is 1135.20 TWh, which is enough to meet the energy demand of 966.05 TWh of the nation. The share of renewable sources in the total energy mix is 874.97 TWh, and non-renewable sources contribute 260.23 TWh. Non-renewable production leads to the generation of 135.47 million metric tons of carbon emissions. The investment cost required for implementing the new power capacity under this scenario is USD 46.80 billion until 2050.
- In the ESP scenario, forecasted energy demand and production are found to be very less as compared with the ONG scenario. The energy demand of the nation is 635.83 TWh, which can be fulfilled by the 747.15 TWh of energy production. Renewable sources produce 575.88 TWh, and non-renewable sources produce 171.27 TWh. A total of 93.16 million metric tons of carbon emissions are produced under this scenario, and USD 46.80 billion investment cost is required for additional capacity addition until 2050.
- In the GEP scenario, energy demand and production are the same as forecasted in the ONG scenario, but the share of renewable and non-renewable is different. The share of renewable sources in the total energy mix is 1117.08 TWh, and non-renewable sources contribute 18.12 TWh. Non-renewable production leads to the generation of 8.85 million metric tons of carbon emissions and USD 1482.46 billion investment cost required for additional renewable energy capacity addition until 2050.
It is suggested that an almost 100% renewable energy supply could be achieved by GEP scenario. The government of Pakistan must give priority to the alternative and renewable energy policy of Pakistan, through which a 30% share must be incorporated by 2030, and this share ultimately increases to almost 100% by the year 2050. However, in the ESP scenario, demand-side measures focus on decreasing energy demands at the consumer level to minimize the need for energy supply by incorporating energy efficiency measures. This scenario is also helpful for Pakistan in saving energy units and producing less carbon, but the ONG scenario is not suitable for Pakistan because of a greater share of imported fossil fuels. It is concluded that optimal balances between energy savings and renewable energy output measures would lead Pakistan to achieve a 100% renewable energy supply.
Author Contributions
Conceptualization, M.A.R.; methodology, M.A.R.; software, M.A.R.; validation, M.A.R.; formal analysis, M.A.R.; investigation, M.A.R.; resources, M.A.R.; data curation, M.A.R.; writing—original draft preparation, M.A.R.; writing—review and editing, M.A.R.; visualization, M.A.R.; supervision, M.M.A.; project administration, M.M.A.; funding acquisition, A.H.R. and M.B.A.B.; formal analysis, T.A.J. All authors have read and agreed to the published version of the manuscript.
Funding
This research was funded by Deputyship for Research & Innovation, Ministry of Education in Saudi Arabia, grant number 375213500.
Institutional Review Board Statement
Not applicable.
Informed Consent Statement
Not applicable.
Data Availability Statement
Not applicable.
Acknowledgments
The authors extend their appreciation to the Deputyship for Research & Innovation, Ministry of Education in Saudi Arabia, for funding this work through the grant number “375213500”. The authors would like to extend their sincere appreciation to the central laboratory at Jouf University for the support of this study.
Conflicts of Interest
The authors declare no conflict of interest.
Appendix A

Figure A1.
GDP of the country.
Figure A1.
GDP of the country.


Figure A2.
Population of the country.
Figure A2.
Population of the country.


Figure A3.
Past electricity consumption data from 1970 to 2020.
Figure A3.
Past electricity consumption data from 1970 to 2020.


Figure A4.
Transmission and distribution losses.
Figure A4.
Transmission and distribution losses.


Figure A5.
Exogenous capacity under ONG scenario.
Figure A5.
Exogenous capacity under ONG scenario.


Figure A6.
Exogenous capacity under GEP scenario.
Figure A6.
Exogenous capacity under GEP scenario.


Figure A7.
Carbon emissions of energy sources.
Figure A7.
Carbon emissions of energy sources.


Figure A8.
Capital cost for implementing plant capacity.
Figure A8.
Capital cost for implementing plant capacity.

References
- Melnyk, L.H.; Sommer, H.; Kubatko, O.V.; Rabe, M.; Fedyna, S.M. The economic and social drivers of renewable energy development in OECD countries. Probl. Perspect. Manag. 2020, 18, 37–48. [Google Scholar] [CrossRef]
- Le, T.-H.; Nguyen, C.P.; Park, D. Financing renewable energy development: Insights from 55 countries. Energy Res. Soc. Sci. 2020, 68, 101537. [Google Scholar] [CrossRef]
- Lowitzsch, J.; Hoicka, C.E.; van Tulder, F.J. Renewable energy communities under the 2019 European Clean Energy Package—Governance model for the energy clusters of the future? Renew. Sustain. Energy Rev. 2020, 122, 109489. [Google Scholar] [CrossRef]
- Khan, S.A.R.; Yu, Z.; Belhadi, A.; Mardani, A. Investigating the effects of renewable energy on international trade and environmental quality. J. Environ. Manag. 2020, 272, 111089. [Google Scholar] [CrossRef] [PubMed]
- Potrč, S.; Čuček, L.; Martin, M.; Kravanja, Z. Sustainable renewable energy supply networks optimization—The gradual transition to a renewable energy system within the European Union by 2050. Renew. Sustain. Energy Rev. 2021, 146, 111186. [Google Scholar] [CrossRef]
- Simionescu, M.; Păuna, C.B.; Diaconescu, T. Renewable energy and economic performance in the context of the European Green Deal. Energies 2020, 13, 6440. [Google Scholar] [CrossRef]
- Raza, M.A.; Khatri, K.L.; Israr, A.; Haque, M.I.U.; Ahmed, M.; Rafique, K.; Saand, A.S. Energy demand and production forecasting in Pakistan. Energy Strat. Rev. 2022, 39, 100788. [Google Scholar] [CrossRef]
- Hafner, M.; Raimondi, P.P. Priorities and challenges of the EU energy transition: From the European Green Package to the new Green Deal. Russ. J. Econ. 2020, 6, 374. [Google Scholar] [CrossRef]
- Date, R.P.; Asia, N.O.; East, M. Global and Regional Coal Phase out Requirements of the Paris Agreement: Insights from the IPCC Special Report on 1.5 °C; Climate Analytics: Berlin, Germany, 2019. [Google Scholar]
- Asmelash, E.; Prakash, G.; Gorini, R.; Gielen, D. Role of IRENA for global transition to 100% renewable energy. In Accelerating the Transition to a 100% Renewable Energy Era; Springer: Berlin/Heidelberg, Germany, 2020; pp. 51–71. [Google Scholar]
- Wu, F.; Huang, N.; Zhang, F.; Niu, L.; Zhang, Y. Analysis of the carbon emission reduction potential of China’s key industries under the IPCC 2 °C and 1.5 °C limits. Technol. Forecast. Soc. Chang. 2020, 159, 120198. [Google Scholar] [CrossRef]
- Włodarczyk, B.; Firoiu, D.; Ionescu, G.H.; Ghiocel, F.; Szturo, M.; Markowski, L. Assessing the Sustainable Development and Renewable Energy Sources Relationship in EU Countries. Energies 2021, 14, 2323. [Google Scholar] [CrossRef]
- Şerban, A.C.; Lytras, M.D. Artificial intelligence for smart renewable energy sector in europe—Smart energy infrastructures for next generation smart cities. IEEE Access 2020, 8, 77364–77377. [Google Scholar] [CrossRef]
- Hansen, K.; Breyer, C.; Lund, H. Status and perspectives on 100% renewable energy systems. Energy 2019, 175, 471–480. [Google Scholar] [CrossRef]
- Korberg, A.D.; Skov, I.R.; Mathiesen, B.V. The role of biogas and biogas-derived fuels in a 100% renewable energy system in Denmark. Energy 2020, 199, 117426. [Google Scholar] [CrossRef]
- Raza, M.A.; Khatri, K.L.; Haque, M.I.U.; Shahid, M.; Rafique, K.; Waseer, T.A. Holistic and scientific approach to the development of sustainable energy policy framework for energy security in Pakistan. Energy Rep. 2022, 8, 4282–4302. [Google Scholar] [CrossRef]
- Raza, M.A.; Khatri, K.L.; Rafique, K.; Saand, A.S. Harnessing electrical power from hybrid biomass-solid waste energy resources for microgrids in underdeveloped and developing countries. Eng. Technol. Appl. Sci. Res. 2021, 11, 7257–7261. [Google Scholar] [CrossRef]
- Raza, M.A.; Khatri, K.L.; Hussain, A. Transition from fossilized to defossilized energy system in Pakistan. Renew. Energy 2022, 190, 19–29. [Google Scholar] [CrossRef]
- Raza, M.A.; Khatri, K.L.; Hussain, A.; Rehman, H.; Rubab, F.; Khan, A. Sector-Wise Optimal Energy Demand Forecasting for a Developing Country Using LEAP Software. Eng. Proc. 2022, 20, 6. [Google Scholar]
- Mathiesen, B.V.; Lund, H.; Karlsson, K. 100% Renewable energy systems, climate mitigation and economic growth. Appl. Energy 2011, 88, 488–501. [Google Scholar]
- Connolly, D.; Lund, H.; Mathiesen, B.V. Smart Energy Europe: The technical and economic impact of one potential 100% renewable energy scenario for the European Union. Renew. Sustain. Energy Rev. 2016, 60, 1634–1653. [Google Scholar] [CrossRef]
- Brown, T.W.; Bischof-Niemz, T.; Blok, K.; Breyer, C.; Lund, H.; Mathiesen, B.V. Response to ‘Burden of proof: A comprehensive review of the feasibility of 100% renewable-electricity systems’. Renew. Sustain. Energy Rev. 2018, 92, 834–847. [Google Scholar] [CrossRef]
- Heard, B.P.; Brook, B.W.; Wigley, T.M.; Bradshaw, C.J. Burden of proof: A comprehensive review of the feasibility of 100% renewable-electricity systems. Renew. Sustain. Energy Rev. 2017, 76, 1122–1133. [Google Scholar] [CrossRef]
- Lund, H.; Mathiesen, B.V. The role of carbon capture and storage in a future sustainable energy system. Energy 2012, 44, 469–476. [Google Scholar] [CrossRef]
- Child, M.; Kemfert, C.; Bogdanov, D.; Breyer, C. Flexible electricity generation, grid exchange and storage for the transition to a 100% renewable energy system in Europe. Renew. Energy 2019, 139, 80–101. [Google Scholar] [CrossRef]
- Al-Mulali, U.; Ozturk, I.; Lean, H.H. The influence of economic growth, urbanization, trade openness, financial development, and renewable energy on pollution in Europe. Nat. Hazards 2015, 79, 621–644. [Google Scholar] [CrossRef]
- Vakulchuk, R.; Overland, I.; Scholten, D. Renewable energy and geopolitics: A review. Renew. Sustain. Energy Rev. 2020, 122, 109547. [Google Scholar] [CrossRef]
- Mensah, T.N.O.; Oyewo, A.S.; Breyer, C. The role of biomass in sub-Saharan Africa’s fully renewable power sector—The case of Ghana. Renew. Energy 2021, 173, 297–317. [Google Scholar] [CrossRef]
- Bogdanov, D.; Ram, M.; Aghahosseini, A.; Gulagi, A.; Oyewo, A.S.; Child, M.; Caldera, U.; Sadovskaia, K.; Farfan, J.; Barbosa, L.D.S.N.S.; et al. Low-cost renewable electricity as the key driver of the global energy transition towards sustainability. Energy 2021, 227, 120467. [Google Scholar] [CrossRef]
- Ferreira, P.V.; Lopes, A.; Dranka, G.G.; Cunha, J. Planning for a 100% renewable energy system for the Santiago Island, Cape Verde. Int. J. Sustain. Energy Plan. Manag. 2020, 29, 25–40. [Google Scholar]
- Tambari, I.T.; Dioha, M.O.; Failler, P. Renewable energy scenarios for sustainable electricity supply in Nigeria. Energy Clim. Chang. 2020, 1, 100017. [Google Scholar] [CrossRef]
- Oyewo, A.S.; Aghahosseini, A.; Ram, M.; Breyer, C. Transition towards decarbonised power systems and its socio-economic impacts in West Africa. Renew. Energy 2020, 154, 1092–1112. [Google Scholar] [CrossRef]
- Jacobson, M.Z.; Cameron, M.A.; Hennessy, E.M.; Petkov, I.; Meyer, C.B.; Gambhir, T.K.; Maki, A.T.; Pfleeger, K.; Clonts, H.; McEvoy, A.L.; et al. 100% clean and renewable Wind, Water, and Sunlight (WWS) all-sector energy roadmaps for 53 towns and cities in North America. Sustain. Cities Soc. 2018, 42, 22–37. [Google Scholar] [CrossRef]
- Timmons, D.; Dhunny, A.; Elahee, K.; Havumaki, B.; Howells, M.; Khoodaruth, A.; Lema-Driscoll, A.; Lollchund, M.; Ramgolam, Y.; Rughooputh, S.; et al. Cost minimization for fully renewable electricity systems: A Mauritius case study. Energy Policy 2019, 133, 110895. [Google Scholar] [CrossRef]
- Bouckaert, S.; Wang, P.; Mazauric, V.; Maïzi, N. Expanding renewable energy by implementing dynamic support through storage technologies. Energy Procedia 2014, 61, 2000–2003. [Google Scholar] [CrossRef]
- Gulagi, A.; Choudhary, P.; Bogdanov, D.; Breyer, C. Electricity system based on 100% renewable energy for India and SAARC. PLoS ONE 2017, 12, e0180611. [Google Scholar] [CrossRef] [PubMed]
- Raza, M.A.; Khatri, K.L.; Memon, M.A.; Rafique, K.; Haque, M.I.U.; Mirjat, N.H. Exploitation of Thar coal field for power generation in Pakistan: A way forward to sustainable energy future. Energy Explor. Exploit. 2022, 40, 1173–1196. [Google Scholar] [CrossRef]
- Qudrat-Ullah, H. A review and analysis of renewable energy policies and CO2 emissions of Pakistan. Energy 2022, 238, 121849. [Google Scholar] [CrossRef]
- Kanwal, S.; Mehran, M.T.; Hassan, M.; Anwar, M.; Naqvi, S.R.; Khoja, A.H. An integrated future approach for the energy security of Pakistan: Replacement of fossil fuels with syngas for better environment and socio-economic development. Renew. Sustain. Energy Rev. 2022, 156, 111978. [Google Scholar] [CrossRef]
- Rehman, A.; Ma, H.; Radulescu, M.; Sinisi, C.I.; Paunescu, L.M.; Alam, M.S.; Alvarado, R. The energy mix dilemma and environmental sustainability: Interaction among greenhouse gas emissions, nuclear energy, urban agglomeration, and economic growth. Energies 2021, 14, 7703. [Google Scholar] [CrossRef]
- Raza, M.A.; Khatri, K.L.; Hussain, A.; Khan, M.H.A.; Shah, A.; Taj, H. Analysis and Proposed Remedies for Power System Blackouts around the Globe. Eng. Proc. 2022, 20, 5. [Google Scholar]
- Hashmi, A.; Bhatti, A.I.; Ahmed, S.; Tariq, M.A.U.R.; Savitsky, A. Revisiting the Indus Basin Model for an energy sustainable Pakistan. Water 2022, 14, 702. [Google Scholar] [CrossRef]
- Khan, S.; Nisar, A.; Wu, B.; Zhu, Q.-L.; Wang, Y.-W.; Hu, G.-Q.; He, M. Bioenergy production in Pakistan: Potential, progress, and prospect. Sci. Total Environ. 2022, 814, 152872. [Google Scholar] [CrossRef] [PubMed]
- Raza, M.A.; Aman, M.M.; Abro, A.G.; Tunio, M.A.; Khatri, K.L.; Shahid, M. Challenges and potentials of implementing a smart grid for Pakistan’s electric network. Energy Strat. Rev. 2022, 43, 100941. [Google Scholar] [CrossRef]
- Khalid, W.; Özdeşer, H.; Jalil, A. An empirical analysis of inter-factor and inter-fuel substitution in the energy sector of Pakistan. Renew. Energy 2021, 177, 953–966. [Google Scholar] [CrossRef]
- Ullah, K. Behavioural Determinants of Energy Transition Towards Renewable Energy Sources in Pakistan: Structural Equation Modelling Approach. Renew. Energy 2021, 9, 1332–1342. [Google Scholar]
- Ali, S.; Yan, Q.; Hussain, M.S.; Irfan, M.; Ahmad, M.; Razzaq, A.; Dagar, V.; Işık, C. Evaluating green technology strategies for the sustainable development of solar power projects: Evidence from Pakistan. Sustainability 2021, 13, 12997. [Google Scholar] [CrossRef]
- Shahid, I.A.; Ullah, K.; Miller, C.A.; Dawood, M.; Ahmed, M.I. Rooftop solar adoption among populations and markets outside the US and Europe—A case from Pakistan. Electr. J. 2022, 35, 107090. [Google Scholar] [CrossRef]
- Khatri, S.A.; Harijan, K.; Uqaili, M.A.; Shah, S.F.; Mirjat, N.H.; Kumar, L. Solar photovoltaic potential and diffusion assessment for Pakistan. Energy Sci. Eng. 2022, 10, 2452–2474. [Google Scholar] [CrossRef]
- Ilyas, S.Z.; Hassan, A.; Mufti, H. Review of the renewable energy status and prospects in Pakistan. Int. J. Smart Grid 2021, 5, 167–173. [Google Scholar]
- Khan, I.A.; Khan, W.R.; Ali, A.; Nazre, M. Assessment of above-ground biomass in pakistan forest ecosystem’s carbon pool: A review. Forests 2021, 12, 586. [Google Scholar] [CrossRef]
- Imran, M.; Zahid, A.; Mouneer, S.; Özçatalbaş, O.; Haq, S.U.; Shahbaz, P.; Muzammil, M.; Murtaza, M.R. Relationship between Household Dynamics, Biomass Consumption, and Carbon Emissions in Pakistan. Sustainability 2022, 14, 6762. [Google Scholar] [CrossRef]
- Mahmood, A.; Wang, X.; Shahzad, A.N.; Fiaz, S.; Ali, H.; Naqve, M.; Javaid, M.M.; Mumtaz, S.; Naseer, M.; Dong, R. Perspectives on Bioenergy Feedstock Development in Pakistan: Challenges and Opportunities. Sustainability 2021, 13, 8438. [Google Scholar] [CrossRef]
- Memon, T.A. Assessment of Rice Residues as Potential Energy Source in Pakistan. Sukkur IBA J. Emerg. Technol. 2022, 5, 41–53. [Google Scholar] [CrossRef]
- Khatri, K.L.; Muhammad, A.R.; Soomro, S.A.; Tunio, N.A.; Ali, M.M. Investigation of possible solid waste power potential for distributed generation development to overcome the power crises of Karachi city. Renew. Sustain. Energy Rev. 2021, 143, 110882. [Google Scholar] [CrossRef]
- Adnan, M.; Ahmad, J.; Ali, S.F.; Imran, M. A techno-economic analysis for power generation through wind energy: A case study of Pakistan. Energy Rep. 2021, 7, 1424–1443. [Google Scholar] [CrossRef]
- Khan, M.A.; Zhang, Y.; Wang, J.; Wei, J.; Raza, M.A.; Ahmad, A.; Yuan, Y. Determination of optimal parametric distribution and technical evaluation of wind resource characteristics for wind power potential at Jhimpir, Pakistan. IEEE Access 2021, 9, 70118–70141. [Google Scholar] [CrossRef]
- Hulio, Z.H. Assessment of wind characteristics and wind power potential of gharo, Pakistan. J. Renew. Energy 2021, 2021, 8960190. [Google Scholar] [CrossRef]
- Saeed, M.A.; Ahmed, Z.; Hussain, S.; Zhang, W. Wind resource assessment and economic analysis for wind energy development in Pakistan. Sustain. Energy Technol. Assess. 2021, 44, 101068. [Google Scholar] [CrossRef]
- Abid, M.; Isleem, H.F.; Shahzada, K.; Khan, A.U.; Shah, M.K.; Saeed, S.; Aslam, F. Seismic Hazard Assessment of Shigo Kas Hydro-Power Project (Khyber Pakhtunkhwa, Pakistan). Buildings 2021, 11, 349. [Google Scholar] [CrossRef]
- Bux, R.K.; Haider, S.I.; Batool, M.; Solangi, A.R.; Memon, S.Q.; Shah, Z.-U.; Moradi, O.; Vasseghian, Y. Natural and anthropogenic origin of metallic contamination and health risk assessment: A hydro-geochemical study of Sehwan Sharif, Pakistan. Chemosphere 2022, 300, 134611. [Google Scholar] [CrossRef]
- Raza, M.A.; Khatri, K.L.; Rafique, K.; Shahid, M.; Khoso, F.H.; Waseer, T.A. Long Term Optimal Energy Planning and Policy Formulation for Pakistan. Int. Energy J. 2022, 22, 123–134. [Google Scholar]
- Jamali, M.A.; Agheem, M.H.; Markhand, A.H.; Shaikh, S.A.; Arain, A.Y.W.; Khaskhely, M.U.R.; Sahito, A.G.; Memon, K.A.; Mujtaba, W.H. Exploration of Shallow Geothermal Energy Aquifers by Using Electrical Resistivity Survey in Laki Range Jamshoro district Sindh, Pakistan. Int. J. Econ. Environ. Geol. 2021, 12, 46–52. [Google Scholar] [CrossRef]
- Uddin, R.; Shaikh, A.J.; Khan, H.R.; Shirazi, M.A.; Rashid, A.; Qazi, S.A. Renewable energy perspectives of Pakistan and Turkey: Current analysis and policy recommendations. Sustainability 2021, 13, 3349. [Google Scholar] [CrossRef]
- Hamza, V.M.; Vieira, F.P.; Guimarães, S.N.P.; dos Santos Gomes, J.L. Geothermal Resources of the Asian Continent: A regional Assessment. Int. J. Terr. Heat Flow Appl. Geotherm. 2022, 5, 26–33. [Google Scholar] [CrossRef]
- Khan, M.I.; Teng, J.-Z.; Khan, M.K.; Jadoon, A.U.; Khan, M.F. The impact of oil prices on stock market development in Pakistan: Evidence with a novel dynamic simulated ARDL approach. Resour. Policy 2021, 70, 101899. [Google Scholar] [CrossRef]
- Khan, A.J.; Shah, S.Z.A.; Bashir, F.; Iqbal, J. Antecedents and Consequences of Green Human Resource Management in Oil and Gas Companies of Pakistan. Sustain. Bus. Soc. Emerg. Econ. 2021, 3, 339–351. [Google Scholar] [CrossRef]
- Raza, M.A.; Khatri, K.L.; Akbar, S.; Haque, M.I.U. Towards improving technical performance of a 747 MW thermal power plant. Quaid-E-Awam Univ. Res. J. Eng. Sci. Technol. Nawabshah. 2021, 19, 104–111. [Google Scholar] [CrossRef]
- Rehman, A.; Ma, H.; Radulescu, M.; Sinisi, C.I.; Yousaf, Z. Energy crisis in Pakistan and economic progress: Decoupling the impact of coal energy consumption in power and Brick Kilns. Mathematics 2021, 9, 2083. [Google Scholar] [CrossRef]
- Abbasi, S.A. Is coal power generation a sustainable solution for energy needs of Pakistan: A Delphi-SWOT paradigm? Digit. Arch. 2021, 11, 308–317. [Google Scholar] [CrossRef]
- Usman, M.; Jahanger, A.; Radulescu, M.; Balsalobre-Lorente, D. Do Nuclear Energy, Renewable Energy, and Environmental-Related Technologies Asymmetrically Reduce Ecological Footprint? Evidence from Pakistan. Energies 2022, 15, 3448. [Google Scholar] [CrossRef]
- Mirjat, N.H.; Uqaili, M.A.; Harijan, K.; Valasai, G.D.; Shaikh, F.; Waris, M. A review of energy and power planning and policies of Pakistan. Renew. Sustain. Energy Rev. 2017, 79, 110–127. [Google Scholar] [CrossRef]
- Mirjat, N.H.; Uqaili, M.A.; Harijan, K.; Walasai, G.D.; Mondal, M.A.H.; Sahin, H. Long-term electricity demand forecast and supply side scenarios for Pakistan (2015–2050): A LEAP model application for policy analysis. Energy 2018, 165, 512–526. [Google Scholar] [CrossRef]
- Mengal, A.; Harijan, K.; Uqaili, M.; Mirjat, N. Electricity demand and emissions under different policy scenarios for Pakistan. In Proceedings of the International Conference on Energy, Environment and Sustainable Development, Jamshoro, Pakistan, 22–24 October 2014. [Google Scholar]
- Valasai, G.D.; Uqaili, M.A.; Memon, H.R.; Samoo, S.R.; Mirjat, N.H.; Harijan, K. Overcoming electricity crisis in Pakistan: A review of sustainable electricity options. Renew. Sustain. Energy Rev. 2017, 72, 734–745. [Google Scholar] [CrossRef]
- Bogdanov, D.; Breyer, C. North-East Asian Super Grid for 100% renewable energy supply: Optimal mix of energy technologies for electricity, gas and heat supply options. Energy Convers. Manag. 2016, 112, 176–190. [Google Scholar] [CrossRef]
- Gernaat, D.E.; Bogaart, P.W.; Vuuren, D.P.V.; Biemans, H.; Niessink, R. High-resolution assessment of global technical and economic hydropower potential. Nat. Energy 2017, 2, 821–828. [Google Scholar] [CrossRef]
- Aghahosseini, A.; Bogdanov, D.; Breyer, C. A techno-economic study of an entirely renewable energy-based power supply for North America for 2030 conditions. Energies 2017, 10, 1171. [Google Scholar] [CrossRef]
- Mirjat, N.H.; Valasai, G.D.; Uqaili, M.A.; Harijan, K.; Shah, S.F.; Mengal, A. Ranking of Scenario Alternatives for Sustainable Power Generation in Pakistan. In Proceedings of the 6th Annual International Conference on Sustainable Energy and Environmental Sciences (SEES 2017), Singapore, 6–7 March 2017; Volume 10. [Google Scholar]


Publisher’s Note: MDPI stays neutral with regard to jurisdictional claims in published maps and institutional affiliations. |
© 2022 by the authors. Licensee MDPI, Basel, Switzerland. This article is an open access article distributed under the terms and conditions of the Creative Commons Attribution (CC BY) license (https://creativecommons.org/licenses/by/4.0/).