Abstract
According to the analysis of the World Health Organization (WHO), the diagnosis and treatment of heart diseases is the most difficult task. Several algorithms for the classification of arrhythmic heartbeats from electrocardiogram (ECG) signals have been developed over the past few decades, using computer-aided diagnosis systems. Deep learning architecture adaption is a recent effective advancement of deep learning techniques in the field of artificial intelligence. In this study, we developed a new deep convolutional neural network (CNN) and bidirectional long-term short-term memory network (BLSTM) model to automatically classify ECG heartbeats into five different groups based on the ANSI-AAMI standard. End-to-end learning (feature extraction and classification work together) is done in this hybrid model without extracting manual features. The experiment is performed on the publicly accessible PhysioNet MIT-BIH arrhythmia database, and the findings are compared with results from the other two hybrid deep learning models, which are a combination of CNN and LSTM and CNN and Gated Recurrent Unit (GRU). The performance of the model is also compared with existing works cited in the literature. Using the SMOTE approach, this database was artificially oversampled to address the class imbalance problem. This new hybrid model was trained on the oversampled ECG database and validated using tenfold cross-validation on the actual test dataset. According to experimental observations, the developed hybrid model outperforms in terms of recall, precision, accuracy and F-score performance of the hybrid model are 94.36%, 89.4%, 98.36% and 91.67%, respectively, which is better than the existing methods.
1. Introduction
Millions of people worldwide are affected by cardiovascular disease (CVD) [1]. According to a World Health Organization study [2], cardiovascular diseases account for 30% of all deaths worldwide. The most common cause of death from cardiovascular disease is cardiac arrest, which is primarily caused by heart arrhythmias. An irregular pulse could signify cardiac arrhythmias, which are heart-related illnesses [3,4]. Arrhythmias cause abnormal cardiac rhythms by causing the heart to beat too quickly, too slowly or too irregularly [5]. As a result of the heart’s failure to pump enough blood to all parts of the body, there is reduced blood flow to the heart, brain and other areas of the body. There are two types of arrhythmias: those that are not life-threatening and those that are. The majority of life-threatening arrhythmias involve the heart. As a result, it is critical to monitor heartbeat activity at regular intervals. As a result, determining the presence of CVD and identifying arrhythmia are required to provide appropriate medical therapy [6,7].
For this reason, an electrocardiogram is the gold standard for monitoring and diagnosing arrhythmias. Electrodes placed on the skin can be used to collect an electrocardiogram signal. Electrocardiogram signals can detect changes in electrical potential caused by the heart’s contraction and relaxation stages. Analyzing an ECG signal repeatedly over long periods is difficult and time-consuming for any clinician. Computer-aided diagnostic technologies are frequently used to analyze electrocardiogram data and identify arrhythmias due to their dependability and accuracy. There are 15 different types of beats present in ECG Signals, if there are significant ECG beats in the data, cardiac arrhythmia is most likely to present [8]. As a result, classifying the heartbeat signal is an essential step in detecting arrhythmias.
Many machine learning algorithms have been used in the available literature to identify arrhythmias using ECG data. Methods such as random forests [9], ANNs [10] and support vector machines [11] have been presented in various studies. Standard machine learning techniques [9,10], and [11] cannot be used without first performing a feature extraction strategy. Prior to applying traditional ML techniques, a feature extraction process is required, which extracts various handcrafted features to affect the classification results [12,13]. Manual feature extraction, on the other hand, takes a long time and effort and does not take advantage of the database’s underlying information. Over-fitting is a common problem in ML-based classification systems [14]. Because deep learning models can automatically construct sophisticated feature representations from input databases, deep learning approaches do not require handwritten feature representations. This deep learning-based solution may aid in addressing current shortages while also generating revenue from existing challenges.
In this paper [15], the authors present a Neural Network for expert knowledge that is modeled on the basis of variable projections. It used a Variable Projection (VP) layer as a general-purpose, trainable feature extractor or filtering approach which can be tailored to different 1D signal-processing issues by the selection of an application-specific function system. The result shows that the VPNet can match or outperform the classification accuracy for fully linked and CNN networks with less number of parameters. It has marginally better convergence than the CNN and FCNN. While the number of weights and biases for the FCNN and CNN increased linearly with the length of the input signals, the VP layer only needed two parameters for learning in all circumstances.
Deep Learning techniques have been rapidly used for image and signal processing research domains. Deep learning algorithms categorized electrocardiogram (ECG) data based on different input parameters. There are many methods for deep learning in biological signal processing that have had significant success. The DL model is used to examine ECG readings (arrhythmia detection). CNN [16], Deep belief network [17], Recurrent neural network (RNN) [18], Auto-encoder [19], and Deep neural network (DNN) [20] are some examples of these networks. Many examples of ECG research have explored employing neural networks, notably CNNs and RNNs, to classify arrhythmias. Acharya et al. [21] created an 11-layer CNN model that distinguishes four different heartbeats, including normal, ventricular fibrillation, atrial flutter and atrial fibrillation, utilizing three separate ECG signal datasets.
Similarly, [22] published a nine-layer deep CNN model for recognizing five different arrhythmias from the MIT-BIH database. The American National Criteria Institute standards were used to categorize these heart rates (ANSI-AAMI). They also developed a fictitious data set to compensate for the discrepancy in heartbeat classification. Li et al. [23] developed a generic CNN model that can be trained and fine-tuned on a large number of heartbeats to increase the accuracy of ECG signal categorization [24].
- A.
- Scope of paper
Furthermore, utilizing long-term ECG readings, our CAD model can assist cardiologists in identifying heartbeats and detecting arrhythmias. This kind of CAD system has several uses in the polyclinic, including reducing the burden on cardiologists and the cost of ECG data processing.
- B.
- Major contributions:
The significant contributions of this study are as below:
- The dataset comes from PhysioNet.org, an MIT-BIH AD that contains 48 patient records.
- This team created a novel hybrid deep learning model based on CNN, and BLSTM approaches to identify arrhythmias from ECG data.
- The dataset is normalized first using the Z score normalization approach, and then heartbeat segmentation is conducted using the annotation files given by the cardiologist along with the database.
- The dataset is split into two parts: training–testing. It then augments the training dataset for the imbalanced class with the synthetic minority oversampling strategy to generate a balanced one.
- This balanced dataset is used to train the newly deployed hybrid deep learning model. After training, the models were assessed on an unidentified dataset (test dataset) to quantify heartbeats in five groups. Metrics used to evaluate statistical performance include accuracy, precision, recall and F-score.
We compared our findings with numerous existing approaches recommended in the relevant study. Our model outperforms the traditional techniques offered in terms of analytical performance. This study employs a unique deep learning-based CNN and BLSTM model hybrid to identify and improve classification performance on unprocessed raw ECG data. The remainder of the paper is divided into the following groups: The theoretical foundation that served as the primary approach employed in the construction of this research is covered in Section 2, along with information about the ECG database. Section 3 contains the findings of the tests that were carried out utilizing the proposed hybrid model. Section 4 discusses the experiment outcomes and compares with previously published studies. Section 5 contains the last thoughts.
2. Literature Review
In this section, we have reviewed the existing work conducted by different authors and researchers using different approaches.
In their paper [24], Sellami and Hwang proposed a novel nine-layer deep CNN model for categorizing heartbeats into five major classes based on inter-patient and intra-patient comparisons. To address the issue of class imbalance, the author used a batch-weighted loss function with three input variants: a target heartbeat with class labels, the last heartbeat followed by a target heartbeat with a class labeled of target heartbeat, and neighboring heartbeats followed by a target heartbeat with a class labeled of target heartbeat. Furthermore, in the method in [25], Xia presents and employs CNNs and active learning models to classify the MIT-BIH AD automatically. The researchers completed this task. Active learning was combined with cutting-edge algorithms and updated versions to improve the system’s overall performance.
Lightnet [26] is the name given to the release by He et al. (CNN model). LightNet training was carried out on low-power PCs. This trained model was designed for mobile devices to detect anomalies in the ECG signal while consuming as few resources as possible. Multiple filter sizes were used in this model to generate alternative feature combinations in each convolutional layer, resulting in improved classification accuracy. The authors of [17] present a DL-based model for categorizing ECG heartbeats, including three classification phases. The first stage uses an unsupervised Gaussian–Bernoulli deep belief network to extract a feature representation from the dataset. The second classification stage is supervised training, which is used to train linear SVM classifiers for the problem at hand. In the third step, the system consults with an expert to examine potentially confused heartbeats and modify its recommendations accordingly.
In the MIT-BIH arrhythmia database, Mathews et al. [27] used deep learning to identify ventricular and supraventricular heartbeats. Despite the study’s small sample size, the authors achieved excellent results by employing a constrained Boltzmann machine and a deep belief network. Ozal Yildirim [28] created a wavelet sequence based on a deep LSTM model to classify ECG data into five distinct heartbeat groups.
Furthermore, Oh Shu Lih et al. [29] examined ECG data in conjunction with CNN and LSTM models, with variable lengths of ECG heartbeats used to train the model. Tan, Jen, Hong and colleagues [30] proposed a model that uses CNN and LSTM to differentiate between healthy and diseased coronary arteries.
Deep learning techniques outperformed previous approaches in biological signal processing for learning these properties from ECG data [31]. We developed a novel hybrid deep learning-based CNN and BLSTM model to improve automated arrhythmia classification performance by employing an oversampling strategy to build consistent data and assess the impact of class imbalance on training and testing data. Oversampling was used to achieve this result and provide reliable data.
Ojha, Manoj Kumar and colleagues [32] created a CNN-based autoencoder with an SVM classifier that divides the MIT-BIH AD into five categories. The model first encodes the features from the ECG signal before passing them to the SVM classifier. Li, Yuanlu et al. [33] proposed a deep residual CNN model to classify arrhythmic heartbeats automatically. This model extracts a heartbeat segment from a 5-s ECG signal and then denoises using the Discrete Wavelet Transform. In addition, the signal focal loss function’s imbalanced process is used.
Cui, Jianfeng et al. [34] created a model based on feature extraction and selection that extracts and selects optimized features from ECG signals to improve arrhythmia classification accuracy.
3. Material and Methodology
Figure 1 depicts the process diagram for the arrhythmia classification system. Following heartbeat segmentation, the dataset is split into two parts: training–testing. Data sample classes are balanced in the final phases of the training process by using unbalanced processing and input of the deep learning model. Finally, the performance will be reviewed.
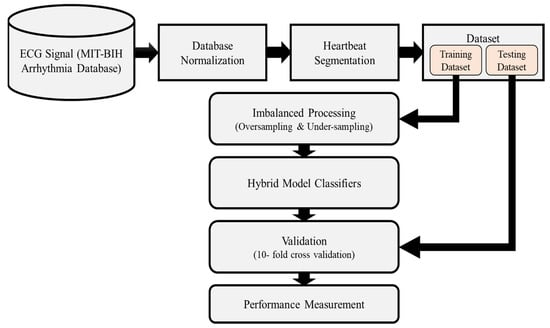
Figure 1.
Proposed work-flow diagram for Arrhythmia Classification system.
3.1. Database Used
This study used the ECG database from the Physio-Bank ATM MIT-BIH AD [35]. The AD was created using 48 ECG recordings from 47 people in this study. There were 25 male and 22 female subjects ranging in age from 32 to 89 years old in these 48 recordings. ANSI/AAMI-EC57 identifies paced beats, the standard method for recording cardiac rhythms, in subject files 102, 104, 107, 217. As a result, these tracks will no longer be included in the assessment database. Furthermore, following the ANSI/AAMI standard [36], the MIT-BIH AD initial classification of heartbeats, divided into 15 distinct classes, has been restructured into five distinct class categories. Table 1 depicts the relationship between the classes in the AAMI standard heartbeat database and the classes in the MIT-BIH AD.

Table 1.
Correlation analysis between AAMI Standard Heart Rate Classification and MIT-BIH AD Classification.
We used an intra-patient classification method used by the majority of the authors in this work, and a comparative analysis of their work is evaluated in Table 1 According to the ANSI-AAMI Protocols, 44 patient records were used in this dataset out of 48 totaling 102,179 heartbeats. These heartbeats are highly imbalanced and classified as one of five types of arrhythmia heartbeats. As shown in Table 2, 80% of the normal heartbeats are present in the dataset, causing the model to overfit. We used two strategies for balancing heartbeats to overcome the problem of over-fitting. In the first strategy, we performed oversampling on the training dataset and validated the actual dataset. The dataset is divided into 10 equal parts in this procedure, and then 90% of the dataset is oversampled using the SMOTE technique, as shown in Table 2. Finally, it was validated against the Test dataset.
Table 2.
Pre- and post-oversampling processing ECG beat counts in the training dataset.
In the second strategy, we used an undersealing procedure. In this procedure, only normal heartbeats are removed from the dataset, while the rest heartbeats remain. Following that, the entire dataset is divided into ten equal parts and 90% of the dataset is trained and validated on test datasets. These steps are repeated ten times for 10-fold classifications, and each time the model is validated on a new 10% dataset of the total dataset that is never used for training.
3.2. ECG Signal Normalization
To normalize a signal means to adjust its levels so that they are all the same. All ECG signal levels were standardized using Z-score normalization. The Z-score is a statistical metric that indicates how far a value is from the group average. Standard deviations from the mean are used to calculate the Z-score. Offset effects can be disregarded, potentially solving the problem of dimension scaling [37].
For computing the value of Z-score normalized signal value from the dataset. We have used the Equation (1) as
3.3. Segmentation of ECG Signals
The MIT-BIH AD stores the signals continuously. Cardiologists gave database information; the annotation file information is used to segment and store ECG signals to retrieve a specific heartbeat. During the segmentation process, the whole ECG signal is separated into segments by first finding all peaks in the data supplied in the annotation file. Each peak-clustering segment has 360 samples in total [38].
3.4. Imbalanced with Balanced Processing Using SMOTE (Synthetic Minority Oversampling Technique)
The introduction of Chawla in 2002 [39] has been the most used oversampling approach. This strategy creates fresh synthetic minority samples without sampling twice. Here is an equation that may be used to generate fake data.
where is a randomly selected instance from the minority instance’s K closest neighbors , stands for the minority class instance under consideration. To create a synthetic instance about two original instances, and commonly, respectively, referred to as the primary reference instance and the auxiliary reference instance. It consists of a vector whose elements are all random numbers between [0, 1]. Along the line connecting and and in the direction of the line joining toward , is produced. Overfitting is also less likely to occur. As a result, a simulated balancing set is produced in which there are an equal number of samples from each class. Normal, supraventricular, ventricular, fusion and unknown are the five categories into which the ECG signals database is categorized according to AAMI standards. With a large enough data pool, we avoid oversampling any one subgroup of class N. To ensure that each class (S, V, F and Q) receives the same number of samples as class N, we oversample them [40]. Table 2 below shows a difference in the total number of heartbeats before and after the training dataset’s synthetic data were generated.
3.5. The Architecture of the Proposed Deep CNN-BLSTM Model
The CNN-BLSTM model has thirteen layers. Figure 2 depicts the structure, which includes 4 convolutional layers, 4 max-pooling layers, 2 BLSTM layers, and 3 fully connected layers.
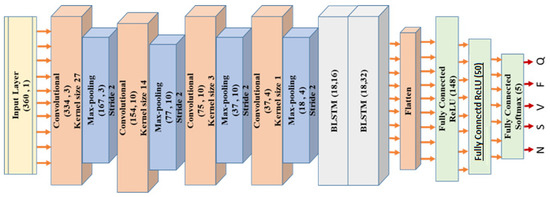
Figure 2.
Architecture of the proposed CNN-BLSTM model for classification of heartbeats.
By using convolutional processing, CNN can automatically identify and extract the most relevant and valuable aspects of the incoming data. More emphasis is placed on the surrounding environment and how other factors fit into the overall picture. When the weights of neurons in CNN for the same feature maps are the same, parallel network learning is achieved, dramatically reducing the learning time [41]. Equation (3) is used to convolve four convolution layers with corresponding filter sizes (Layer 1, Layer 3, Layer 5 and Layer 7). (27, 14, 3 and 1).
Equation (4) is as follows: Y = f(x), where y is layer, x represents the signal value, f(x) represents the filter and N represents the number of elements of segment size. The feature map size is reduced by adding a max-polling layer after each convolution layer. The filter (kernel) size attained in layers 1, 3 and 5 is determined using a brute-force technique in this study. The Rectifier Linear Unit activation function (ReLU) [42]. After that, we use the BLSTM layer to extract the time-related information embedded in the feature maps. The features obtained through the convolution and pooling method were first segmented and then componentized to facilitate temporal analysis. These were distributed to all other BLSTM units for further investigation [43]. Many layers of analysis are used to predict arrhythmias. The activation function used by the BLSTM layers is described in Equation (4).
The above equation makes use of the input sequence , the bias vector , and the weight vector W. represents the preceding LSTM memory, and represents the output of the LSTM memory block, respectively [28]. The first layer has 148 neurons the second 50, and the third 5, all coupled. Each output class is classified using the network’s final soft-max function (13). (N, S, V, F and Q). Back-propagation and the Adam optimizer were used to train the CNN-BLSTM in this model. In training, the learning rates of 1 × 10⁻³ are utilized, with a regularization value of 0.01. The CNN-BLSTM model makes use of 34 batch sizes. The definite cross-entropy function is used to compute the loss parameter. CNN-BLSTM has been trained and tested several times. The maximum number of repeats is 100. The iterative method usually includes a validation stage. It starts with partitions the dataset into 10 different subset datasets which contain about 10% of the information of the total dataset. We used an oversampled subset of the remaining data to train the CNN-BLSTM model. The second stage follows the same procedure as the first, except that before training the CNN-BLSTM model. There are 10 iterations of each procedure, which verifies a different subset of the actual data. When evaluating statistical performance, the last step is to calculate the mean of each 10-fold (Table 3).
Table 3.
The proposed CNN-BLSTM architecture summary for this work.
4. Experimental Results
A Dell workstation with two 2.4 GHz Intel Xeon E5-2600 processors and 64 GB of RAM is used for both the training and testing of the given CNN-BLSTM model. For a learning rate of 1 × 10⁻³, it takes an average of 358 s per epoch on the CPU to finish training and testing on the ECG dataset. The Python Keras package was used to develop the deep CNN-BLSTM model. The CNN-BLSTM model was evaluated using its overall accuracy (Acc), recall (Se), precision (P) and F-score. The dataset’s true positive (TP), false positive (FP), false negative (FN) and actual negative values are as follows: (TN):
To train and evaluate the CNN-BLSTM model, we employ two methods. In the first scheme, the models are trained on an oversampled database using the SMOTE technique and then tested on the unseen dataset. In contrast, in the second, models are trained and evaluated on an under-sampled database (it is used to adjust the distribution of the dataset to get the actual value).
4.1. Experiment One: Models Trained on the Oversampled Database Using SMOTE Method
The tenfold cross-validation findings on MIT-BIH AD are shown in Table 4. First, the model is trained on the oversampled dataset, then, it is used for cross-validation on the test dataset. The performance of the model is summarized based on the performance analysis on various parameters such as recall, precision, F-score and overall accuracy of the classification findings for each class. Regarding accuracy, precision, recall and F-score, the suggested CNN-BLSTM model-averaged 98.36%, 94.24% and 91.676%, respectively. Table 4 shows Q beats have the highest classification sensitivity, and F beats have the lowest since the real positive value is tiny and the actual negative value is significant.
Table 4.
CNN-BLSTM model performance on ECG heart rate data as measured by tenfold cross-validation.
We compare the results of the proposed CNN-BLSTM model with two other deep learning models CNN-GRU and CNN-LSTM, and we present a justification for our findings based on cutting-edge techniques. Table 5 and Table 6 illustrate the classification performance of the CNN-GRU and CNN-LSTM models on oversampled training datasets.
Table 5.
Average of all tenfold ECG heartbeat statistical performance results using CNN-GRU model.
Table 6.
Average of all tenfold ECG heartbeat statistical performance results using CNN-LSTM model.
Overall, the CNN-GRU model had a 96.63% success rate, with an average precision of 79.97%, recall of 95.59% and an F-score of 85.75%. Compared to other models, the CNN-LSTM model performed at a higher level overall, with 98.16% accuracy, 87.01% precision, 94.77% recall and 90.42% F-score on average.
Table 4, Table 5 and Table 6 show that the proposed CNN-BLSTM model outperforms the state-of-the-art methods in average F-score, precision and accuracy. Even so, the CNN-GRU model had the highest average sensitivity of all tested ones. On average, the CNN-LSTM model is more sensitive than its simpler cousin, the CNN-BLSTM.
4.2. Experiment Two: Model Trained with Under-Sampling Method of MIT-BIH Arrhythmia Database
Under-sampling is a technique where only one in every 12% of normal heartbeat (N) is used for model training and testing. Since most Normal heartbeats in the MIT-BIH AD (around 80%) are standard (N), the remaining classes of heartbeat datasets are discarded. To locate a pulse, we under-sample just class N, while all other classes are sampled without under-sampling. As a consequence, we used 25,019 heartbeat segments in Experiment 2; 10,382 are normal (N), 2726 are supraventricular ectopic (S), 7222 are ectopic (V), 802 are Fusion (F) and 3888 are unknown (Q). On an under-sampled database, Table 7 summarizes the average results of tenfold cross-validation of the CNN-BLSTM model.
Table 7.
Average of all tenfold ECG heartbeat statistical performance results using CNN-BLSTM model on under-sampled database.
Table 7 demonstrates that the proposed CNN-BLSTM model has a high level of accuracy (97.15%), high level of precision (96.50%), high level of recall (93%) and high level of F-score (94.55%). The same under-sampled data set is also used to test CNN-GRU and CNN-LSTM, two more models. Table 8 and Table 9 exhibit the classification results after 10-fold cross-validation.
Table 8.
Statistical performance of a tenfold ECG of the heart using the CNN-GRU model on an under-sampled database.
Table 9.
Statistical performance of a CNN-LSTM model on an under-sampled ECG heartbeat database averaged overall tenfold.
The overall accuracy obtained by the CNN-LSTM model is 97.17%, slightly better than the CNN-BLSTM model, but the average precision and average F-score are the highest of the CNN-BLSTM model. Figure 3 compares three different deep learning models with two schemes, oversampling and under-sampling, on the MIT-BIH AD. As shown in Figure 3, the highest classification accuracy obtained by the CNN-BLSTM model is 98.36% using the oversampling SMOTE method on the database. Hence, the CNN-BLSTM model is superior to this experiment’s other two deep learning models.
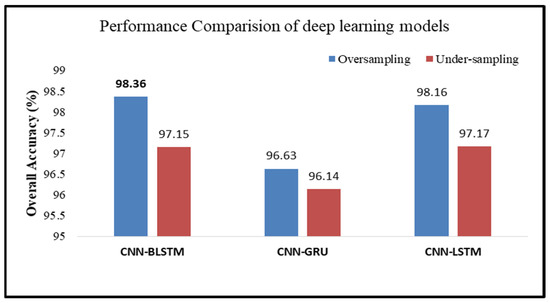
Figure 3.
Performance comparison of different deep learning models.
5. Result Discussion
Over the past two decades, researchers have extensively studied the MIT-BIH AD to develop better methods for classifying arrhythmias using machine learning and artificial neural networks. Various deep learning-based techniques have been used in recent years to categorize arrhythmias. The diversity of rhythms that arrhythmias may induce is categorized and listed in Table 10. To meet the standards set by ANSI-AAMI, Zubair et al. [44] trained a deep CNN model on a raw ECG database to categorize arrhythmia heartbeats into one of five categories. This CNN model combines the functions of two key modules used for recognizing ECG patterns. Feature extraction and heartbeat detection are two such parts. Insight into the possibility of automating feature representation and categorization on the raw ECG database without requiring human-created features has recently emerged. The overall accuracy of the gathered test set is 92.7%.
Table 10.
Performance comparisons obtained.
Meanwhile, Shadmand and Mashoufi [45] have divided the MIT-BIH AD into five groups using a Block-based neural network. The particle swarm optimization approach was applied in this study to optimize the neural network’s different parameters. A classification accuracy of 97% was achieved by extracting the input of network feature vectors from the ECG signal using the Hermit E function [52] coefficient and temporal feature techniques through extracting interpretable features automatically. In the research publication [22], to differentiate between five distinct heartbeats recorded in the MIT-BIH AD, Acharya and colleagues built a 9-layer deep CNN model. The CNN model used for training and testing was evaluated using an oversampled database version because the original database had unequal classes. Testing accuracy obtained by the supplemented database was 94.03%, whereas the testing accuracy when the oversampled database was not used declined to 89.07%.
Furthermore, Shadmand and Mashoufi [45] used a Block-based neural network to divide the MIT-BIH AD into five categories. The particle swarm optimization method was used to improve the neural network parameters. We recovered the input network feature vectors from the ECG signal using the Hermit E function coefficient and temporal feature approaches, resulting in a 97% increase in classification accuracy. Acharya et al. [22] used a 9-layer deep CNN model to classify heartbeats from the MIT-BIH AD. Because of the severely skewed class distributions in the initial database, the CNN model was trained and evaluated using an oversampled database. When the oversampled database was not used for training and testing, the accuracy fell to 89.07%. On the other hand, the upgraded database achieved a testing accuracy of 94.03%.
In addition, Xu et al. [53] developed deep learning approaches to automatically categorize raw ECG data into five categories. In this model, the input is in the form of raw electrocardiogram data, and the output provides a classification judgment for each pulse individually. Our model used an innovative preprocessing methodology to support a deep neural network. The model included the segmentation and alignment of heartbeats, and a deep neural network was utilized to categorize the different types of heartbeats. Armani et al. introduced a deep learning-based technique for categorizing heart disease detection that is applied automatically in article [48]. The architecture for deep learning that was just shown may be broken into two pieces. First, a deep autoencoder is an unsupervised form of feature learning, and second, a deep neural network working as a classifier can improve the outcomes of older machine-learning techniques. These older techniques consisted of several redundant feature extractions, selection and feature reduction steps. A deep autoencoder is an unsupervised form of feature learning. A deep neural network working as a classifier can improve the outcomes of older machine learning techniques. Deep learning assists with embedded feature extraction and selection during the pre-training phase of DAE and the fine-tuning phase of DNN. This, in turn, makes it possible to extract high-level features from both the training data and the data that has not yet been seen. Table 10 compares the accuracy of the classification results obtained using the proposed CNN-BLSTM model and the accuracy obtained using other methods that have been utilized in the past. The proposed model successfully recognizes heartbeat signals, and its accuracy is exceptional compared to past Work in this area.
This study classified the MIT-BIH AD using end-to-end computer-aided design (CAD) techniques rather than manual feature extraction. Overfitting has been observed in the majority of machine learning classifiers. As a result, the CNN-BLSM model, which uses regularization and dropout, aids in preventing the model from becoming overly accurate during training. We dropped out of the recurring connections at 20% of the model’s BLSTM layer total. As a result, in this hybrid model, CNN is in charge of selecting high-quality spatial features, while BLSTM layers are in charge of learning the temporal data more efficiently. As a result, the CNN-BLSTM model could recognize ECG data more accurately than before. Because the aforementioned deep learning model is developed for end-to-end systems on raw ECG data, noise filtering and feature extraction techniques are unnecessary.
The Following Conclusions May Be Drawn from the CNN-BLSTM Model’s Findings
The suggested CNN-BLSTM model’s strength in terms of overall accuracy, recall, precision and F-score is its ability to automatically identify ECG heartbeats in line with AAMI criteria. When testing on synthetic data and addressing the issue of class imbalance across minority groups, the CNN-BLSTM model was found to be superior at categorizing heartbeat types. The model’s autonomy means that ancillary tools, such as those used for feature extraction, feature selection, and classification are redundant. Improved average and total accuracy are the primary advantages of the model [54].
We compared the results of two separate experiments conducted with k-fold cross-validation with and without dropout regularization. The training procedure in experiment A did not employ dropout regularization. In this instance, we used every available metric in the learning procedure. In experiment B, however, we used dropout regularization with 0.5 dropouts, which means that half of the data was thrown away, and only the other half was used for training. The experimental outcomes of both methods are analyzed. The standard deviation from the 10-fold evaluation and overall accuracy was 98.36%, 98.16% and 97.17%.
CNN-BLSTM is more stable since it uses a cross-validation scheme with ten iterations. This CNN-BLSTM model requires specialized hardware (GPU) and a massive dataset for training, which is the model’s main drawback. Therefore, it appears that the computation time is longer than that needed for regular sorts. It helps to identify the pattern in ECG signal.
6. Conclusions
In this research, we created a model of a wholly automated classifier for ECG data. This model used ANSI-AAMI criteria to categorize the ECG signal into five groups. This study developed a deep learning classification model using the MIT-BIH ECG database for training and testing. Arrhythmia classification accuracy was significantly improved once the class imbalance problem was fixed. Through the use of the SMOTE method, we were able to generate artificial data that corrected the class imbalance. This virtual experiment shows that the CNN-BLSTM model is a viable option for identifying and labeling ECG arrhythmias. The categorization results were presented using four metrics (Recall, precision, F1-score and overall accuracy).
Our results were 94.24% for recall, 89.50% for accuracy and 91.67% for F1. When these findings were averaged across all 105 heartbeat categories, the CNN-BLSTM model had an overall accuracy of 98.36%. A CAD ECG system may use the CNN-BLSTM model to analyze and diagnose based on electrocardiograms. This model can aid cardiologists in interpreting electrocardiogram (ECG) readings. To reduce the cardiologist’s burden and expenses associated with analyzing ECG signals, such devices find widespread application in polyclinics.
In the future, we will use different deep learning methods to train the model like ReLU, Batch Normalization, Soft Max Function and Sigmoid Activation function with different layers to reduce the complexity and time.
Author Contributions
Conceptualization, S.K.P.; Data curation, A.K.; Formal analysis, S.B. and A.A.; Investigation, S.K.P.; Methodology, A.K. and S.B.; Project administration, S.B.; Visualization, A.A.; Writing—original draft, A.K. and S.K.P.; Writing—review and editing, S.B. and A.A. All authors have read and agreed to the published version of the manuscript.
Funding
This work was supported by the Deanship of Scientific Research, Vice Presidency for Graduate Studies and Scientific Research, King Faisal University, Saudi Arabia [Grant No. 1271].
Institutional Review Board Statement
Not applicable.
Informed Consent Statement
Not applicable.
Data Availability Statement
Not applicable.
Conflicts of Interest
The authors declare no conflict of interest.
References
- Mehra, R. Global public health problem of sudden cardiac death. J. Electrocardiol. 2007, 40, S118–S122. [Google Scholar] [CrossRef] [PubMed]
- World Health Organization. Noncommunicable Diseases: Progress Monitor 2017; World Health Organization: Geneva, Switzerland, 2017.
- Agarwal, R.; Jalal, A.S.; Arya, K.V. Enhanced Binary Hexagonal Extrema Pattern (EBHXEP) Descriptor for Iris Liveness Detection. Wirel. Pers. Commun. 2020, 115, 2627–2643. [Google Scholar] [CrossRef] [PubMed]
- Singh, S.; Pandey, S.K.; Pawar, U.; Janghel, R.R. Classification of ECG Arrhythmia using Recurrent Neural Networks. Procedia Comput. Sci. 2018, 132, 1290–1297. [Google Scholar] [CrossRef]
- Chazal, D.; Rathore, Y.K.; Janghel, R.R.; Pandey, S.K.; Kumar, A.; Singh, K.U.; Shah, M.A. A novel AI-based approach for better segmentation of the fungal and bacterial leaf diseases of rice plant. J. Sens. 2022, 2022, 1–12. [Google Scholar] [CrossRef]
- Alonso-Atienza, F.; Morgado, E.; Fernandez-Martinez, L.; Garcia-Alberola, A.; Rojo-Alvarez, J.L. Detection of Life-Threatening Arrhythmias Using Feature Selection and Support Vector Machines. IEEE Trans. Biomed. Eng. 2014, 61, 832–840. [Google Scholar] [CrossRef] [PubMed]
- Khadra, L.; Al-Fahoum, A.S.; Al-Nashash, H. Detection of life-threatening cardiac arrhythmias using the wavelet transformation. Med Biol. Eng. Comput. 1997, 35, 626–632. [Google Scholar] [CrossRef]
- Kuila, S.; Dhanda, N.; Joardar, S. ECG signal classification and arrhythmia detection using ELM-RNN. Multimed. Tools Appl. 2022, 81, 25233–25249. [Google Scholar] [CrossRef]
- Reddy, G.T.; Reddy, K.; Lakshmanna, K.; Rajput, D.S.; Kaluri, R.; Srivastava, G. Hybrid genetic algorithm and a fuzzy logic classifier for heart disease diagnosis. Evol. Intell. 2020, 13, 185–196. [Google Scholar] [CrossRef]
- Gadekallu, T.R.; Khare, N.; Bhattacharya, S.; Singh, S.; Maddikunta, P.K.R.; Ra, I.-H.; Alazab, M. Early Detection of Diabetic Retinopathy Using PCA-Firefly Based Deep Learning Model. Electronics 2020, 9, 274. [Google Scholar] [CrossRef]
- Basheer, S.; Bhatia, S.; Sakri, S.B. Computational Modeling of Dementia Prediction Using Deep Neural Network: Analysis on OASIS Dataset. IEEE Access 2021, 9, 42449–42462. [Google Scholar] [CrossRef]
- Dev, K.; Khowaja, S.A.; Bist, A.S.; Saini, V.; Bhatia, S. Triage of potential COVID-19 patients from chest X-ray images using hierarchical convolutional networks. Neural Comput. Appl. 2021, 1, 1–16. [Google Scholar] [CrossRef] [PubMed]
- Abouyoussef, M.; Bhatia, S.; Chaudhary, P.; Sharma, S.; Ismail, M. Blockchain-Enabled Online Diagnostic Platform of Suspected Patients of COVID-19 Like Pandemics. IEEE Internet Things Mag. 2021, 4, 94–99. [Google Scholar] [CrossRef]
- Pandey, S.K.; Janghel, R.R. Recent Deep Learning Techniques, Challenges and Its Applications for Medical Healthcare System: A Review. Neural Process. Lett. 2019, 1, 1–29. [Google Scholar] [CrossRef]
- Baloglu, U.B.; Talo, M.; Yildirim, O.; Tan, R.S.; Acharya, U.R. Classification of myocardial infarction with multi-lead ECG signals and deep CNN. Pattern Recognit. Lett. 2019, 122, 23–30. [Google Scholar] [CrossRef]
- Acharya, U.R.; Fujita, H.; Oh, S.L.; Hagiwara, Y.; Tan, J.H.; Adam, M.; Tan, R.S. Deep convolutional neural network for the automated diagnosis of congestive heart failure using ECG signals. Appl. Intell. 2019, 49, 16–27. [Google Scholar] [CrossRef]
- Sayantan, G.; Kien, P.T.; Kadambari, K.V. Classification of ECG beats using deep belief network and active learning. Med. Biol. Eng. Comput. 2018, 56, 1887–1898. [Google Scholar]
- Feng, K.; Pi, X.; Liu, H.; Sun, K. Myocardial Infarction Classification Based on Convolutional Neural Network and Recurrent Neural Net-work. Appl. Sci. 2019, 9, 1879. [Google Scholar] [CrossRef]
- Yang, J.; Bai, Y.; Lin, F.; Liu, M.; Hou, Z.; Liu, X. A novel electrocardiogram arrhythmia classification method based on stacked sparse auto-encoders and softmax regression. Int. J. Mach. Learn. Cybern. 2018, 9, 1733–1740. [Google Scholar] [CrossRef]
- Sannino, G.; De Pietro, G. A deep learning approach for ECG-based heartbeat classification for arrhythmia detection. Future Gener. Comput. Syst. 2018, 86, 446–455. [Google Scholar] [CrossRef]
- Agrawal, R.; Jalal, A.S.; Arya, K.V. Fake fingerprint liveness detection based on micro and macro features. Int. J. Biom. 2019, 11, 177. [Google Scholar] [CrossRef]
- Acharya, U.R.; Oh, S.L.; Hagiwara, Y.; Tan, J.H.; Adam, M.; Gertych, A.; San Tan, R. A deep convolutional neural network model to classify heartbeats. Comput. Biol. Med. 2017, 89, 389–396. [Google Scholar] [CrossRef] [PubMed]
- Li, Y.; Pang, Y.; Wang, J.; Li, X. Patient-specific ECG classification by deeper CNN from generic to dedicated. Neurocomputing 2018, 314, 336–346. [Google Scholar] [CrossRef]
- Sellami, A.; Hwang, H. A robust deep convolutional neural network with batch-weighted loss for heartbeat classification. Expert Syst. Appl. 2019, 122, 75–84. [Google Scholar] [CrossRef]
- Xia, Y.; Xie, Y. A Novel Wearable Electrocardiogram Classification System Using Convolutional Neural Net-works and Active Learning. IEEE Access 2019, 7, 7989–8001. [Google Scholar] [CrossRef]
- He, Z.; Zhang, X.; Cao, Y.; Liu, Z.; Zhang, B.; Wang, X. LiteNet: Lightweight Neural Network for Detecting Arrhythmias at Resource-Constrained Mobile Devices. Sensors 2018, 18, 1229. [Google Scholar] [CrossRef]
- Mathews, S.M.; Kambhamettu, C.; Barner, K.E. A novel application of deep learning for single-lead ECG classification. Comput. Biol. Med. 2018, 99, 53–62. [Google Scholar] [CrossRef]
- Yildirim, Ö. A novel wavelet sequence based on deep bidirectional LSTM network model for ECG signal classification. Comput. Biol. Med. 2018, 96, 189–202. [Google Scholar] [CrossRef]
- Oh, S.L.; Ng, E.Y.K.; SanTan, R.; Acharya, U.R. Automated diagnosis of arrhythmia using a combination of CNN and LSTM techniques with variable length heartbeats. Comput. Biol. Med. 2018, 102, 278–287. [Google Scholar] [CrossRef]
- Tan, J.H.; Hagiwara, Y.; Pang, W.; Lim, I.; Oh, S.L.; Adam, M.; Tan, R.S.; Chen, M.; Acharya, U.R. Application of stacked convolutional and long short-term memory network for accurate identification of CAD ECG signals. Comput. Biol. Med. 2018, 94, 19–26. [Google Scholar] [CrossRef]
- Litjens, G.; Kooi, T.; Bejnordi, B.E.; Setio, A.A.A.; Ciompi, F.; Ghafoorian, M.; van der Laak, J.A.W.M.; van Ginneken, B.; Sánchez, C.I. A survey on deep learning in medical image analysis. Med. Image Anal. 2017, 42, 60–88. [Google Scholar] [CrossRef]
- Ojha, M.K.; Wadhwani, S.; Wadhwani, A.K.; Shukla, A. Automatic detection of arrhythmias from an ECG signal using an auto-encoder and SVM classifier. Phys. Eng. Sci. Med. 2022, 45, 665–674. [Google Scholar] [CrossRef] [PubMed]
- Li, Y.; Qian, R.; Li, K. Inter-patient arrhythmia classification with improved deep residual convolutional neural network. Comput. Methods Programs Biomed. 2022, 214, 106582. [Google Scholar] [CrossRef] [PubMed]
- Cui, J.; Wang, L.; He, X.; De Albuquerque, V.H.C.; AlQahtani, S.A.; Hassan, M.M. Deep learning-based multidimensional feature fusion for classification of ECG arrhythmia. Neural Comput. Appl. 2021, 1–15. [Google Scholar] [CrossRef]
- Goldberger, A.L.; Amaral, L.A.; Glass, L.; Hausdorff, J.M.; Ivanov, P.C.; Mark, R.G.; Mietus, J.E.; Moody, G.B.; Peng, C.K.; Stanley, H.E. PhysioBank, PhysioToolkit, and PhysioNet: Components of a new research resource for complex physiologic signals. Circulation 2000, 101, e215–e220. [Google Scholar] [CrossRef]
- Luz, E.J.D.S.; Schwartz, W.R.; Cámara-Chávez, G.; Menotti, D. ECG-based heartbeat classification for arrhythmia detection: A survey. Comput. Methods Programs Biomed. 2016, 127, 144–164. [Google Scholar] [CrossRef]
- Wikipedia Contributors. Feature Scaling. Wikipedia, The Free Encyclopedia. Wikipedia, the Free Encyclopedia, 24 June 2018. Available online: https://en.wikipedia.org/w/index.php?title=Feature_scaling&oldid=847274325 (accessed on 29 November 2022).
- Chen, S.; Hua, W.; Li, Z.; Li, J.; Gao, X. Heartbeat classification using projected and dynamic features of ECG signal. Biomed. Signal Process. Control 2017, 31, 165–173. [Google Scholar] [CrossRef]
- Dias, F.M.; Monteiro, H.L.; Cabral, T.W.; Naji, R.; Kuehni, M.; Luz, E.J.D.S. Arrhythmia classification from single-lead ECG signals using the inter-patient paradigm. Comput. Methods Programs Biomed. 2021, 202, 105948. [Google Scholar] [CrossRef]
- Caesarendra, W.; Hishamuddin, T.A.; Lai, D.T.C.; Husaini, A.; Nurhasanah, L.; Glowacz, A.; Alfarisy, G.A.F. An embedded system using convolutional neural network model for online and real-time ECG signal classification and prediction. Diagnostics 2022, 12, 795. [Google Scholar] [CrossRef]
- Hu, R.; Chen, J.; Zhou, L. A transformer-based deep neural network for arrhythmia detection using continuous ECG signals. Comput. Biol. Med. 2022, 144, 105325. [Google Scholar] [CrossRef]
- Mishra, A.; Agrawal, R.; Khan, M.A.; Jalal, A.S. A robust approach for palmprint biometric recognition. Int. J. Biom. 2019, 11, 389. [Google Scholar] [CrossRef]
- Mostayed, A.; Luo, J.; Shu, X.; Wee, W. Classification of 12-Lead ECG Signals with Bi-directional LSTM Network. arXiv 2018, arXiv:1811.02090. [Google Scholar]
- Zubair, M.; Kim, J.; Yoon, C. An Automated ECG Beat Classification System Using Convolutional Neural Networks. In Proceedings of the 2016 6th International Conference on IT Convergence and Security (ICITCS), Prague, Czech Republic, 26 September 2016. [Google Scholar]
- Shade, S.; Mashoufi, B. A new personalized ECG signal classification algorithm using block-based neural network and particle swarm optimization. Biomed. Signal Process. Control. 2016, 25, 12–23. [Google Scholar]
- Jun, T.J.; Nguyen, H.M.; Kang, D.; Kim, D.; Kim, D.; Kim, Y. ECG arrhythmia classification using a 2-D convolutional neural network. arXiv 2018, arXiv:1804.06812. [Google Scholar]
- Yang, W.; Si, Y.; Wang, D.; Guo, B. Automatic recognition of arrhythmia based on principal component analysis network and linear support vector machine. Comput. Biol. Med. 2018, 101, 22–32. [Google Scholar] [CrossRef] [PubMed]
- Nurmaini, S.; Umi Partan, R.; Caesarendra, W.; Dewi, T.; Naufal Rahmatullah, M.; Darmawahyuni, A.; Bhayyu, V.; Firdaus, F. An Automated ECG Beat Classification System Using Deep Neural Networks with an Unsupervised Feature Extraction Technique. Appl. Sci. 2019, 9, 2921. [Google Scholar] [CrossRef]
- Wu, M.; Lu, Y.; Yang, W.; Wong, S.Y. A Study on Arrhythmia via ECG Signal Classification Using the Convolutional Neural Network. Front. Comput. Neurosci. 2021, 14, 564015. [Google Scholar] [CrossRef]
- Shi, H.; Qin, C.; Xiao, D.; Zhao, L.; Liu, C. Automated heartbeat classification based on deep neural network with multiple input layers. Knowl. -Based Syst. 2020, 188, 105036. [Google Scholar] [CrossRef]
- Xiaolin, L.; Xiang, F.; Panicker, R.C.; Cardiff, B.; John, D. Classification of ECG based on Hybrid Features using CNNs for Wearable Applications. arXiv 2022, arXiv:2206.07648. [Google Scholar]
- Kovács, P.; Bognár, G.; Huber, C.; Huemer, M. VPNET: Variable Projection Networks. Int. J. Neural Syst. (IJNS) 2021, 32, 2150054. [Google Scholar] [CrossRef]
- Xu, S.; Mak, M.; Cheung, C. Towards end-to-end ECG classification with raw signal ex-traction and deep neural networks. IEEE J. Biomed. Health Inform. 2019, 23, 1574–1584. [Google Scholar] [CrossRef]
- de Chazal, P.; O’Dwyer, M.; Reilly, B.R. Automatic Classification of Heartbeats Using ECG Morphology and Heartbeat Interval Features. IEEE Trans. Biomed. Eng. 2004, 51, 1196–1206. [Google Scholar] [CrossRef] [PubMed]


Publisher’s Note: MDPI stays neutral with regard to jurisdictional claims in published maps and institutional affiliations. |
© 2022 by the authors. Licensee MDPI, Basel, Switzerland. This article is an open access article distributed under the terms and conditions of the Creative Commons Attribution (CC BY) license (https://creativecommons.org/licenses/by/4.0/).