Article

Remediation of the Alluvial Aquifer of the Sardas Landfill (Sabiñánigo, Huesca) by Surfactant Application

1
EMGRISA-Empresa para la Gestión de Residuos Industriales, S.A., S.M.E., M.P., 28040 Madrid, Spain
2
Dirección General de Cambio Climático y Educación Ambiental, Gobierno de Aragón, 50071 Zaragoza, Spain
3
Chemical Engineering and Materials Department, Facultad de Ciencias Químicas, Universidad Complutense de Madrid, Ciudad Universitaria s/n, 28040 Madrid, Spain
*
Author to whom correspondence should be addressed.
Sustainability 2022, 14(24), 16576; https://doi.org/10.3390/su142416576
Submission received: 2 November 2022 / Revised: 7 December 2022 / Accepted: 8 December 2022 / Published: 10 December 2022
(This article belongs to the Special Issue Sustainable Management and Remediation of Contaminated Sites)

Abstract

:
Sardas Landfill at Sabiñánigo Huesca is polluted with Dense Non-Aqueous Liquid Phases (DNAPLs) composed of a complex mixture of chlorinated organic compounds (COCs). This DNAPL was produced as liquid waste from lindane production being dumped decades ago in the unlined landfills close to the lindane factory. This DNAPL migrated by gravity through the subsurface and accumulated in the contact between the alluvial and marls layers (about 15 m b.g.l.). Seven injections of an aqueous emulsion of a biodegradable non-ionic surfactant (E-Mulse 3®) were carried out at the most polluted areas of the Sardas alluvial. Injections were carried out between April and November 2021 using different surfactant concentrations (6.7, 20, 25 and 50 g/L), injection volumes (0.2 to 7 m3) and injection flow rates (0.08–0.85 m3/h). Injected fluids were extracted in the same well or surrounding wells, and the time elapsed between surfactant injection and extraction varied between 24 and 72 h. A total of 22 m3 were injected into the alluvial, and more than double this injected volume was extracted. Injection and extraction points were in the contact between the marls and the alluvial layer. Extracted fluid accumulated in tanks, and phases separated. DNAPL recovered here was mobilized rather than solubilized and managed as toxic waste. The aqueous supernatant was treated in a wastewater treatment plant with physicochemical treatment (including adsorption in activated carbon) before being discharged into the environment. The transport of the injected fluids was monitored by conductivity profiles using bromide (260–538 mg·L−1) as a conservative tracer. High radial dispersion of the injected fluid was found. Surfactant losses by adsorption in the alluvial and absorption in DNAPL were noticed, and both surfactant and contamination did not escape from the capture zone. Monitoring since 2018 of the COCS in groundwater and the DNAPL presence in the contact between alluvial and marls layers showed a significant reduction of COCs in the treated zone with the surfactant injections.

1. Introduction

Removing mixtures of hydrophobic organic contaminants (HOCs) is a great challenge for soil and groundwater remediation [1]. The low solubility of HOCs in water limits the application of traditional treatments such as “pump and treat” or “In Situ Chemical Oxidation” (ISCO). The latter would require high times to remove the contamination from heavily contaminated soils with HOCs [2,3,4]. The presence of HOCs is often due to the accidental release or intentional dumping of organic liquid phases into the environment, forming NonAqueous Phase Liquids (NAPLs) that persist in the subsurface [5]. NAPLs can be classified into two different groups depending on their density: light NAPLs (LNAPLs), with a density lower than water, and dense NAPLs (DNAPLs), with a higher density than water [6].
DNAPLs are typically composed of volatile industrial solvents (trichloroethylene, perchloroethylene, carbon tetrachloride, dichloromethane), other chlorinated compounds (such as chlorobenzenes, pesticides), creosote, PAHs, etc. These compounds present a low biodegradability, high toxicity, and, in some cases, are carcinogenic. DNAPLs can migrate by density through the vadose and saturated zones and accumulate in layers with low permeability. DNAPLs in the subsurface, as organic liquid phases or trapped in the soil pores or fractures, cause continuous groundwater contamination [7].
Soil Flushing treatment has been gaining attention recently because it improves the solubilization and mobilization of DNAPLs in the subsurface [8,9,10,11,12]. An aqueous solution containing the surfactant (cosolvents and salts are optional) is injected into the subsurface and then extracted and treated on-site. This technology is called SEAR (Surfactant Enhancement Aquifer Remediation) or SER (Surfactant Enhancement Remediation). When a surfactant is added to the aqueous phase, interfacial tension decreases, enhancing the solubilization and mobilization of DNAPLs [13,14].
The surfactant injected distributes between the organic, aqueous and soil phases [15]. The absorption of surfactant into the organic phase has been described in the literature [13,16]. A decrease in the viscosity and interfacial tension of DNAPLs is expected due to the surfactant absorption, enhancing their mobilization. In addition, surfactant adsorption in the soil [17], caused mainly by clays and fines, must be considered because this phenomenon causes a decrease in the solubilization of the contaminants [9].
The SEAR technology should confine the injected fluids in the contaminated area, avoiding the dispersion of pollutants out of the treated zone. Solubilized and mobilized contaminants must be contained and recaptured [10,11,18]. The transport of the injected fluid must be known for this purpose. However, most of the soil flushing works reported in the literature have been carried out in batches or columns with spiked soils, and very few studies have been conducted in real contaminated sites [19,20,21,22,23,24,25,26].
In this work, SEAR technology is applied to remediate a real landfill polluted with DNAPL. The site is located at Sabiñanigo, Huesca, Spain. This DNAPL contains about thirty chlorinated organic compounds (COCs), from chlorobenzene to heptachlorocyclohexane [27], with a density of about 1.5 cm3 g−1. DNAPL resulted from distillation tails and failed reactions in the lindane production by the company INQUINOSA. This dense phase was dumped in the Sardas unlined landfill and migrated through the subsurface, affecting the alluvial deposits hydraulically linked to the Gállego River [28]. This alluvium consists of a gravel layer with some interbedded clay. The alluvial has high permeability (K about 100 m/day) but a low hydraulic gradient [28] and is placed between two low-permeability layers (lime and marl). The alluvial was highly contaminated at some points with DNAPL trapped in the soil pores and DNAPL residual pools between the alluvial and the altered marl. This DNAPL is a viscous phase, difficult to extract by pumping.
A non-ionic and biodegradable commercial surfactant, E-Mulse 3®, produced by EthicalChem has been selected based on previous remediation studies of DNAPL-polluted soil from the Sardas alluvial at lab scale [29,30,31,32]. E-Mulse3® showed the highest mass solubility ratio (MSR). Higher COC s amounts were solubilized with E-Mulse3® than with the anionic surfactant sodium dodecyl sulfate (SDS) at a wide range of pHs. Similar MSRs were obtained using Tween 80 and E-Mulse3® [32] when DNAPL was in contact with the aqueous surfactant emulsion as an organic liquid phase. On the contrary, a lower COCs desorption from alluvial soil was obtained with Tween 80 than with E-Mulse3® [30]. SDS showed lower solubilization values in all cases.
Furthermore, E-Mulse3® was more stable in the simultaneous application of oxidants and surfactants (S-ISCO) [31]. Previous works at lab scale with the addition of Tween 80, E-Mulse3® and SDS in the aqueous phase resulted in the solubilization of COCs (from the alluvial soil or liquid organic phases), the surfactant absorption in DNAPL [32] and the surfactant adsorption in the alluvial soil [30]. The presence of surfactant in aqueous, organic and soil phases decreases the Interfacial Tension among phases, promoting both COCs solubilization and DNAPL mobilization [26].
The first injection of an aqueous emulsion of E-Mulse3® surfactant was carried out at the Sardas Alluvium in a pilot test cell of about 3 × 3 m (alluvial depth about 3 m). The surfactant injection took place in July 2018 [23]. A volume of 5.8 m3 of tap water with 13 g L−1 of surfactant and 130 mg L−1 of a conservative tracer (bromide) was injected in an alluvial well (PS14B) at 0.6 m3 h−1 (75 kg of surfactant were injected). The pilot test area was selected considering the high concentration of COCs in the groundwater in well PS14, suggesting the presence of DNAPL nearby. The injected fluid transport was monitored in three surrounding wells (PS14D, PS14C and PS14) located about three meters from PS14B. The results are shown elsewhere [23]. A high radial dispersion of the injected fluid was found [33]. In addition, a significant decrease of the surfactant in the solution was noticed during the time elapsed between injection and extraction due to surfactant adsorption in soil and surfactant absorption in DNAPL (extraction was carried out 16 h after the injections stopped), in agreement with laboratory findings [30]. The lower the surfactant in the aqueous phase, the lower the solubilized COCs.
The second injection of surfactant in the Sardas alluvial occurred in November 2020 [34]. In this case, a total of 9 m3 of an aqueous solution containing 20 g L−1 of surfactant and 250 mg L−1 of bromide (conservative tracer) were injected in three alluvial wells (PS14B, PS14D and PS14E located in a triangle about 3 m side). A volume of 3 m3 was injected at each well at a flow rate of 0.3 m3 h−1 for 10 h. The total mass of the surfactant injected was 180 kg. Injected fluid was monitored in 13 surrounding wells. Extraction of the injected fluid was carried out 48 h after the injection. More details can be found elsewhere [34]. Extracted fluid in wells PS14B, PS14C, PS14D and PS14E had a high concentration of solubilized contaminants (about 2000 mg L−1), much higher than the corresponding for water saturated in DNAPL (about 70 mg L). This polluted solution was treated in 2020 with NaOH to promote the dehydrochlorination of all cyclic non-aromatic COCs (NAC) to Tri and Tetra ChloroBenzenes and the emulsion breakage with time. In the SEAR tests carried out in 2018 [23] and 2020 [34], the fluids were injected and extracted in the middle of the alluvial layer, solubilizing the COCs adsorbed in this layer. No relevant recovery of DNAPL as an immiscible organic phase was found. This fact can be explained as DNAPL is mainly located in the contact between the alluvial and the marls (about 16 m b.g.l.) and the fluids were injected and extracted at the middle of the alluvial depth (about 14.5 m b.g.l.). DNAPL recovered in 2018 and 2020 was less than 10 kg, mainly as solubilized COCs. Furthermore, the presence of surfactant in the aqueous phase required the breakage of the emulsion to recover the COCs. A new strategy was planned in 2021 to improve the recovery of DNAPL for an injected surfactant mass. Injection of the aqueous surfactant emulsion and extraction of the injected fluids is located close to the contact between the alluvial and marls layers to improve DNAPL recovery by mobilization. To do this, seven injections of an aqueous emulsion of a biodegradable non-ionic surfactant (E-Mulse 3®) previously selected in lab test were carried out in a cell test of about 9 × 9 m (alluvial depth 3 m) between April and November 2021. The influence of variables such as surfactant concentration, injection volume, injection and extraction flow rates, number of injection wells and time elapsed between injection and extraction on DNAPL recovery, solubilized or as organic phase, has been analysed.

2. Materials & Methods

2.1. Site Description

SEAR tests have been carried out at Sardas landfill (Sabiñánigo, Spain). The conceptual model of the site is described elsewhere [23,28] and summarized in Figure S1. From groundwater analysis up to 2018, HCH concentration in well PS14 was about 14 mg/L, suggesting the presence of DNAPL nearby. From 2018 to 2021, new wells were drilled surrounding well PS14 in an area of about 20 × 20 m (Figure 1). Wells PS14B, PS14C and PS14D were built in 2018 [23], wells PS14f, PS14G, PS14H, PS14I, PS14J, PS14K, PS14L, PS14M were built in 2019 and wells PS5D and PS19D were built in 2020. The complete set of wells available in the landfill to monitor groundwater contamination is shown in Figure S2. DNAPL was found in the contact between alluvial and fractured marls.
The site stratigraphy is shown in Figure 2. An anthropic fill is found between 0 to 4.8 m b.g.l. A homogeneous silt layer (4.40 to 12.50 m b.g.l.) is under this fill. The alluvial is found from 12.50 to 15.50 m b.g.l. The altered marl layer is below the alluvial (>16 m b.g.l). The gravel-sand layer has high permeability, while the lime and marl layers had low permeability. The alluvial is composed of a mixture of gravel and sand with interbedded clay and high hydraulic conductivity Kh = 100 m day−1 [23]. A hydraulic gradient of about 0.001, an average Darcy velocity of about 0.02 m day−1, soil density = 2.5 kg L−1 and average effective soil porosity εL = 0.12 in the alluvial were obtained elsewhere [23]. Wells PS14x were screened 1 m in the silt layer, in the whole alluvial (about 3 m) and about 1 m in the altered marls. More details about the stratigraphy of each piezometer are summarized in Table S1. The DNAPL presence in the contact between graves and marls was confirmed by measuring the height of accumulated DNAPL in each piezometer.

2.2. Surfactant Injections in the Alluvial

The surfactant used for SEAR treatment was E-Mulse 3®, a commercial surfactant manufactured by EthicalChem, composed of non-ionic surfactants (60–90%) and citrus terpenes (10–40%), specifically, limonene (CAS: 94266-47-4). This surfactant has been selected considering the results of our previous works [23]. It is a biodegradable and non-toxic surfactant. Further information about this product can be found at www.ethicalchem.com (accessed on 2 October 2022). Critical micellar concentration was previously determined as 80 mg L−1 [32].
Surfactant injections carried out between April and October 2021 are summarized in Table 1, and the extraction of fluids injected is summarized in Table 2. A conservative tracer (bromide) was added during injection events 1 and 6, to study the flow of the injected fluids. The conductivity profile with the alluvial height was also determined during the injection event 6.
As can be seen in Table 1, different injection strategies have been applied. In events 1 and 6, the surfactant is injected into three wells. In both events, a conservative tracer (bromide) has been added to evaluate the flow dispersion. In event 1, the emulsion was injected into wells PS14B, PS14E and PS14I. Pumping was carried out in two septs after the end of surfactant injection: a first extraction was carried out at 31 h after the injection in the 10 wells indicated in Table 2, and the second extraction was carried out at 391 h (details in Table 2). Injected and extracted volumes in event 1 had similar values. In event 6, the surfactant was injected in wells PS14BM, PS14J, and PS14M with simultaneous extraction in well PS14I (located at the centre of the triangle of injection wells). GW was extracted in PS14I at 48 h, and in PS14I, PS14M and PS14J at 53 h after the surfactant injection finished. Details are shown in Table 2. The extraction flow rate used in event 1 was much lower than in event 6.
In events 2–5 and 7, the surfactant was injected in one well (PS5D, PS14E, PS14E, PS14I and PS14D, respectively). PS14E, PS14I and PS5D were selected because higher DNAPL accumulation at the contact between alluvial and marls was found. In event 3, a lower surfactant concentration was injected than in event 4 (same well, PS14E). A lower injection flow rate in well PS14D was used in event 7, compared to event 2. Moreover, a much lower emulsion volume and higher surfactant concentration were used in event 7.
GW extraction in events 2–7 was carried out at flow rates ranging from 2 to 4.5 m3/h and about 18–70 h after the surfactant was injected. Volume extracted and other operation details are summarized in Table 2.
The conductivity of the injected aqueous solution with surfactant was 510 μS cm−1, with a chloride concentration of 125 mg L−1 and interfacial tension of 33 mN m−1. The conductivity of the injected fluid was 900–1000 μS cm−1 in events 1 and 6 due to the bromide presence. This solution was injected in the corresponding wells at the depth indicated in Table 1 using a flexible 1-inch PVC hose (Tiger Flex) and an electric transfer pump. The injected fluids were extracted using the same tube and electric pump at the depth and flow rates indicated in Table 2.
The fluid extracted was sent to sedimentation tanks (2 m3 volume each). After settling for 72 h, a supernatant sample was taken and analysed. Supernatant with COCs concentrations lower than 200 mg/L was stored in a nearby pond and sent to a wastewater treatment plant (WWTP) with physicochemical treatment and activated carbon adsorption. Higher COCs concentrations in the supernatant (caused by the surfactant presence) would require additional treatment before being sent to the pond. In this case, NaOH is added to reach a concentration of 4 g/L in the aqueous phase. Alkaline conditions (pH > 12) promote dehydrochlorination of non-aromatic COCs and cause the breakage of the emulsion with time. Precipitated phases after one week were discarded by the bottom of the tank and sent for management as toxic waste.
Excluding the surfactant injection in PS5D, the test cell was about 9 × 9 m. The alluvial depth was 3 m with a porosity of about 0.12, and the corresponding Pore Volume is close to 30 m3. The surfactant concentration used in events 1 to 7 is in the range of the range applied at the field scale [19,20,21,22,23,24,25,26].

2.3. Analytical Methods

Protocol for COCs analysis in the aqueous phase depends on the surfactant presence. In the surfactant absence, 16 mL of the aqueous phase was added to 4 mL of hexane in a 20 mL vial and sonicated for 10 min. Then, the supernatant organic phase was analysed in triplicate by GC/MS and GC/FID/ECD. In the surfactant presence, a volume of 0.1 mL was added to 0.9 mL of MeOH and analysed in triplicate by GC/FID/ECD. Differences between the composition of analysed samples were lower than 15%.
DNAPL from the site was obtained in well PS14D, at the contact between the alluvial and marls. Its aspect and composition can be seen in Supplementary Materials (Table S2). A mass of this DNAPL was diluted in MeOH to get a concentration of about 15,000 mg/kgMeOH. Three DNAPL samples were diluted in MeOH and analysed, and differences in DNAPL composition were lower than 15%.

2.3.1. COC Analysis

Identification of COCs in DNAPL and GW was carried out by GC/MSD, using a gas chromatograph (Agilent 6890N) coupled to a mass spectrometry detector (Agilent MSD 5975B) with an HP-5MS (30 m × 0.25 mm ID × 0.25 μm) GC column. Details can be found elsewhere [27]. COCs were quantified using an Agilent 6890 GC with a flame ionization detector (FID) and an electron capture detector (ECD). Further details of the analytical method can be found elsewhere [27,30].

2.3.2. Bromide (Tracer) and Conductivity Analysis

The concentration of the conservative tracer (bromide anion) was determined using ionic chromatography (Metrohm 761 Compact IC) with anionic chemical suppression and a conductivity detector. Each sample was analysed in triplicate, with differences lower than 10%. A Metrosep A SUPP5 5–250 column (25 cm length, 4 mm diameter) as a stationary phase was used, and 250 µL of the sample was injected. The mobile phase was an aqueous solution of 3.2 mM Na2CO3 and 1 mM NaHCO3 at a flow rate of 0.7 mL/min. The sample injection system included a filtering device (0.45 µm). If necessary, the GW samples were diluted with Milli-Q water before their analysis. Standard solutions of sodium chloride (NaCl, Sigma-Aldrich, St. Louis, MO, USA) and sodium bromide (NaBr, Honeywell Fluka, Charlotte, NC, USA) were used for calibration.
The conductivity of the samples was also measured in the field with a portable pH/conductivity unit (Model 914 pH/Conductometer, Metrohm, Herisau, Switzerland). The conductivity profiles in the alluvial were also determined during event 6 using a multiparameter electrode placed at the end of a tape measure.

2.3.3. Surfactant Concentration

The surfactant concentration in the GW sample was calculated through the concentration of limonene, the co-solvent in the commercial Surfactant E-Mulse 3. Limonene mass percentage in E-Mulse 3 was about 15%, determined by GC/FID. The surfactant in the aqueous phase was calibrated at concentrations from 0.1 to 1.5 g surfactant/ KgMeOH. All samples were measured in triplicate with differences lower than 7%.

3. Results and Discussion

3.1. DNAPL Composition

DNAPL found at the piezometer bottom PS14D in September 2021 was analysed, and its composition is shown in Table S2. As can be seen, it is composed of ChloroBenzene (CB), DiChloroBenzene isomers (DCBs), TriChloroBenzene isomers (TCBs), Tetra ChloroBenzene isomers (TetraCBs) and Non-Aromatics Chlorinated cyclic compounds (NACs). NACs are defined in Equation (1) as the sum of PentaChlorocycloHexene (PentaCXs), HexaChlorocycloHexane (HCHs), HexaChlorocycloHexene (HexaCX) and HeptaChlorocycloHexane (HeptaCX) isomers.
N A C s = P e n t a C X s + H C H s + H e x a C X s + H e p t a C X s

3.2. Results Obtained in the Injection Events

Event 1. GW was monitored during fluid injection and at the end of the surfactant injection. A GW volume of 6.52 m3 was extracted 31 h after the surfactant injection began and was collected in the sedimentation tanks. After two weeks, a second GW extraction (2.21 m3) was carried out. Details are shown in Table 2.
The COCs, surfactant and tracer concentration in groundwater before the injection begins (t = 0), at the end of the surfactant injection (t = 8 h), and at 16 h after the surfactant injection finished are given in Table S3 (Supplementary Information). The dimensionless surfactant and tracer concentration (F) have been calculated by Equation (2):
F = C C o = C s u r f C s u r f i n j e c t e d = C B r C B r i n j e c t e d
As shown in Table S3, the fluid injected (7.20 m3) shows a high radial dispersion during the injection, as reported elsewhere [23,33]. Surfactant dimensionless concentration is always lower than dimensionless bromide concentration. This finding is explained because bromide is a conservative tracer, but surfactant is adsorbed in the alluvial clays or absorbed in DNAPL during its transport through the subsurface [23,30]. Laboratory studies confirmed surfactant adsorption of up to 12 g E-Mulse/kg soil in the small particles of the alluvial soil (dp < 0.025 mm) [30]. Likewise, Abriola et al. [19] found that the adsorption of Tween 80 in the medium sand soil of the treated site reaches a maximum sorption capacity of 17 g of Tween 80/kg soil. Remarkable surfactant adsorption has also been described in Soil Flushing applications at the lab [35,36,37,38,39] and field scale [17,19,20,25,26]. Partition of surfactant between aqueous and organic phases reaches an equilibrium value of 50 g surfactant/kg DNAPL at a final surfactant concentration of about 1 g/L in the aqueous phase [32]. The absorption of surfactant in DNAPL can decrease the interfacial tension between aqueous and liquid phases and increase the DNAPL extraction by mobilization [26]. Measured values of F at 24 h showed higher differences between dimensionless tracer and surfactant concentration. This observation confirms the importance of the surfactant losses in the alluvial with time. Surfactant measured at 24 h is always lower than surfactant at the end of the injection (8 h). As can be seen in Table S3, the surfactant presence considerably increases the solubilized COCs. The time elapsed between surfactant injection and extraction is a key parameter in the surfactant losses by adsorption [23].
On the contrary, differences in bromide concentration between 8 and 24 h are positive or negative, depending on the monitored well. This difference is caused by the dispersion of the fluid injected with the natural groundwater flow of the site.
About 5 and 15 L litres of DNAPL as an organic phase were extracted during the first 10 min at wells PS14E and PS14M, respectively. No significant phase settling was observed in the GW extracted below. However, emulsion phase droplets were detected, requiring longer times for sedimentation as a dense organic phase. In the extraction carried out 2 weeks after the surfactant injection, emulsion phase droplets were still observed (Figure S3 of the Supplementary Information).
The average COCs concentration in the sum of pumped GW was about 80 mg/L, and the surfactant concentration was lower than 0.03 g/L, confirming the surfactant losses by adsorption/absorption with time after the surfactant injection stopped. Only a mass of 2 kg of the surfactant injected was recovered in the extracted fluids. About 35 L of DNAPL (50 kg) was recovered as an organic phase after sedimentation.
Event 6 (Table 1 and Table 2). In this event, the surfactant was injected in PS14B, PS14J and PS14M and simultaneously extracted in PS14I. Prior to surfactant injection (t = 0), GW has monitored in the wells indicated in Table 2. In addition, it was also monitored at 40 min after the injection stopped (t = 5.7 h). Results are shown in Table S4 (Supplementary Information).
Conductivity profiles were measured in the alluvial depth during the injection time. The conductivity of the fluid injected (900 µS) was remarkably lower than GW conductivity, being the dimensionless conductivity values defined by Equation (3):
F k = k x , t k x , t = 0
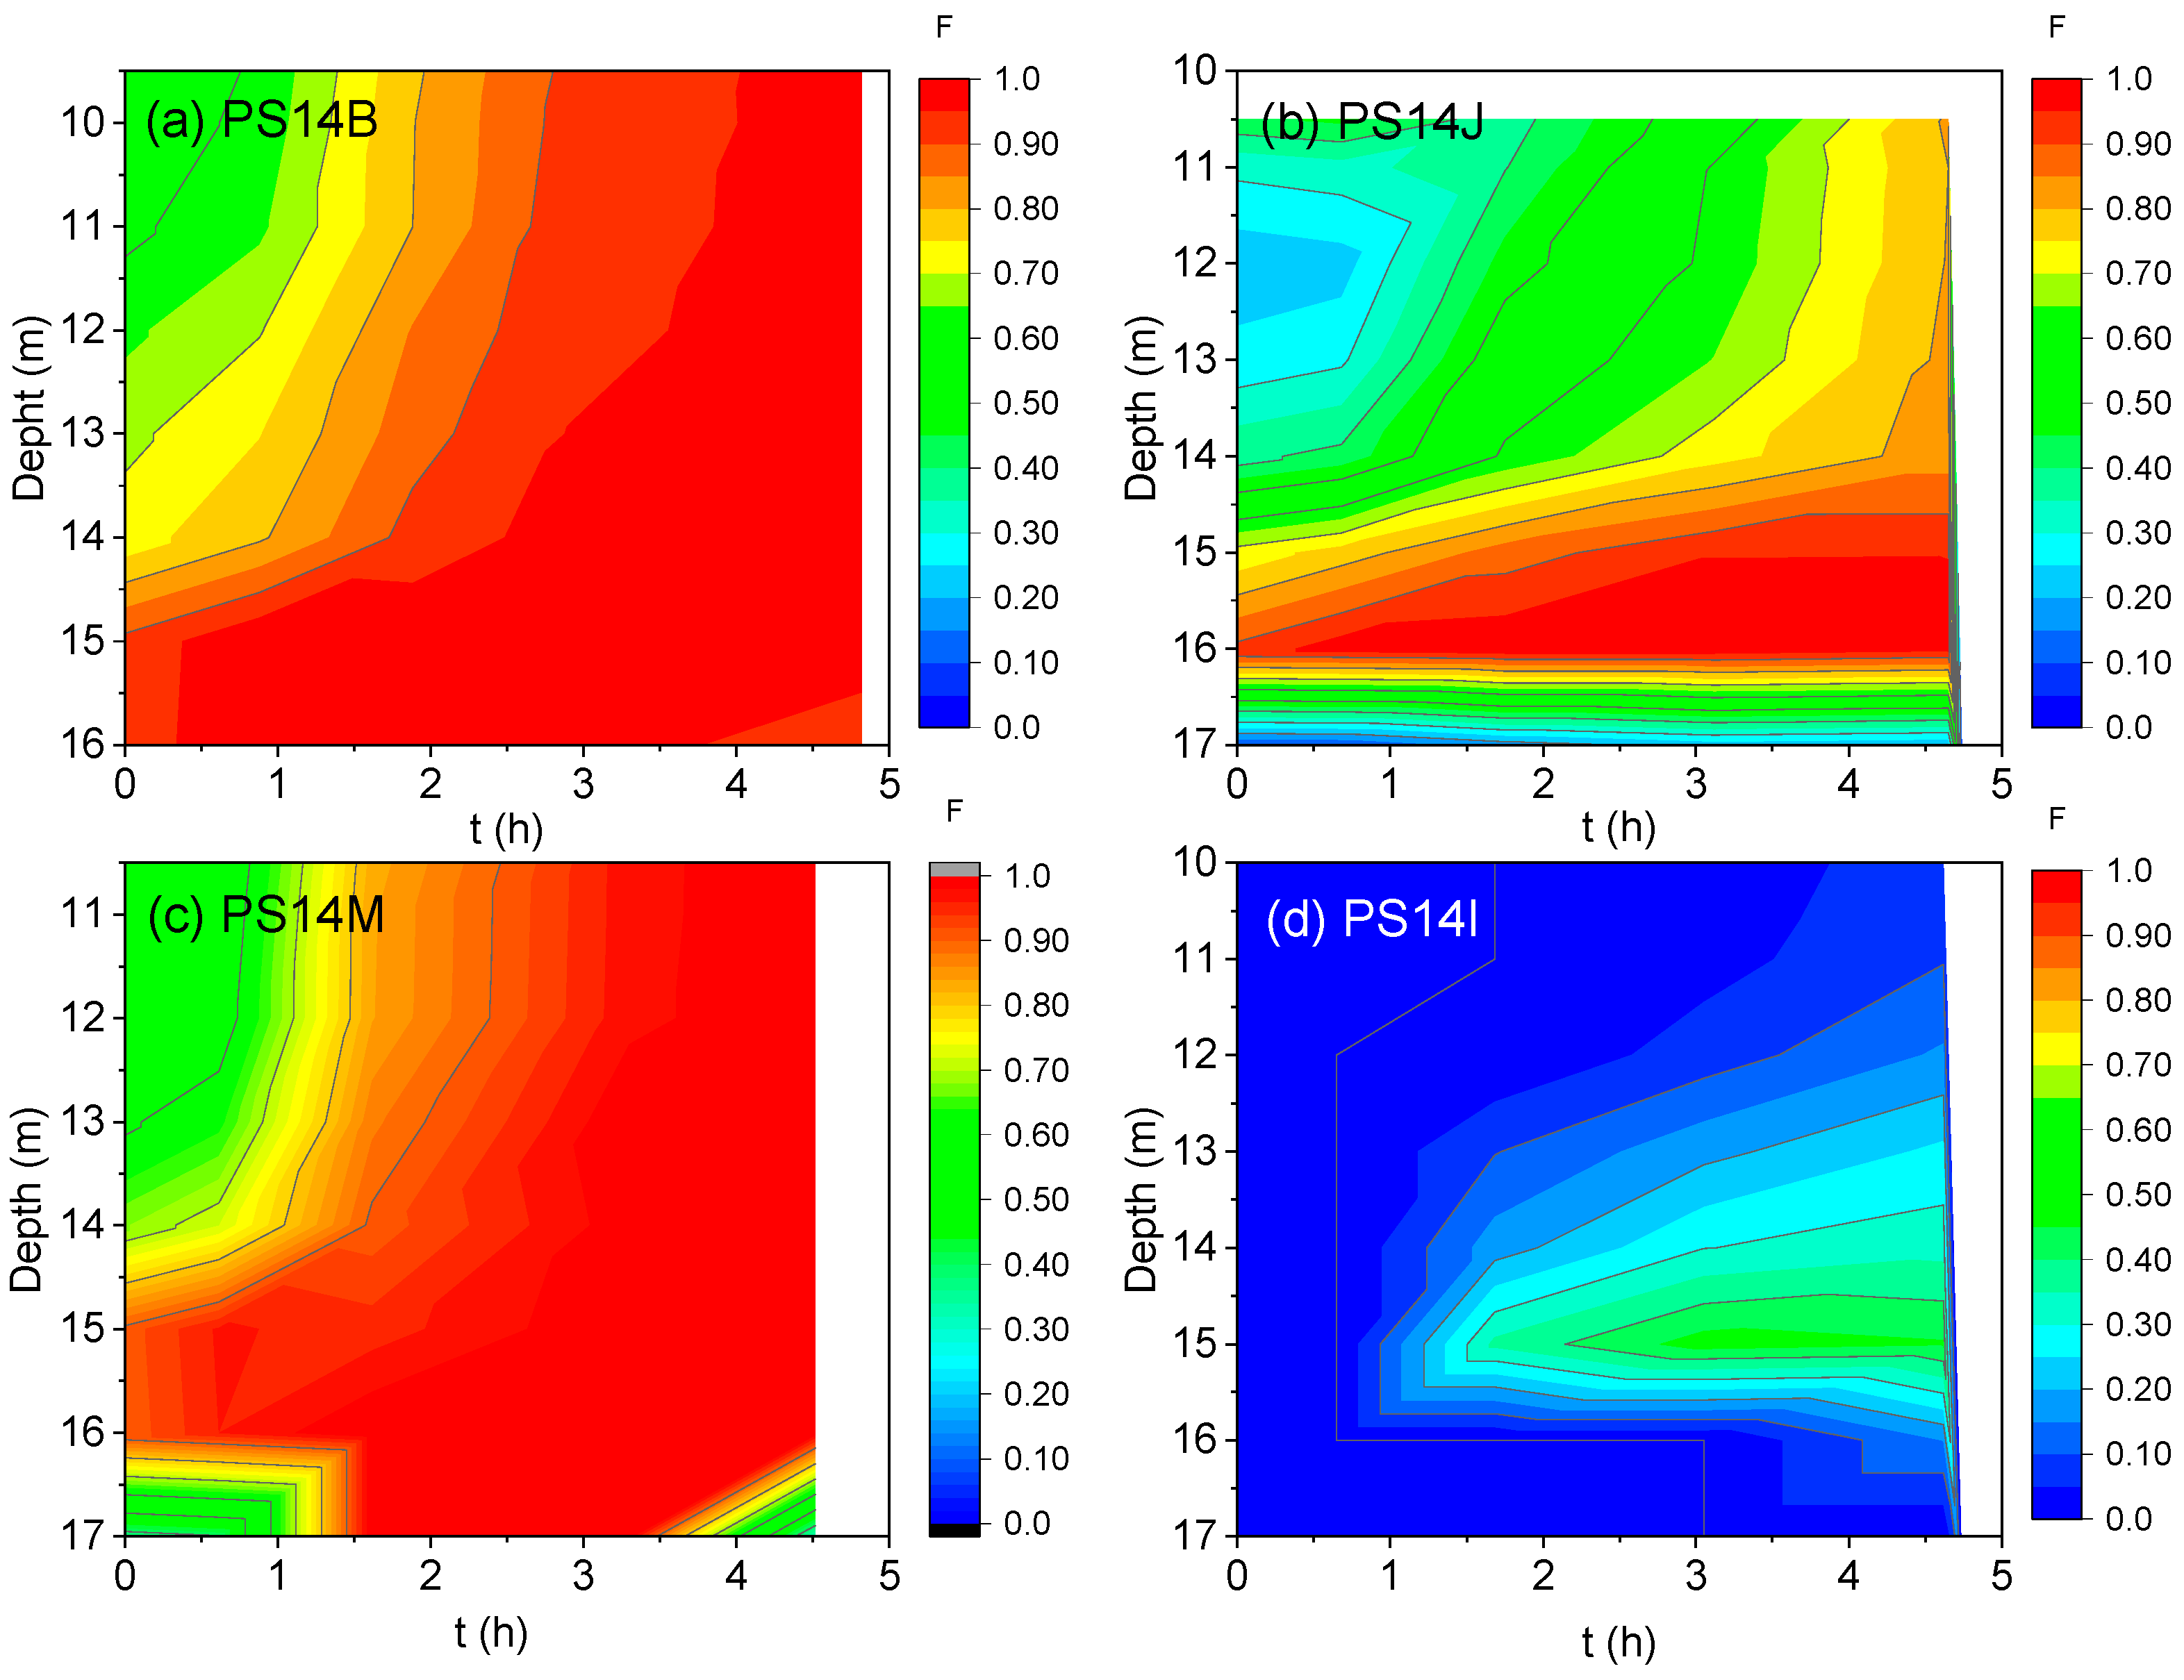
k x , t and k x , t = 0 are the conductivities measured at the depth x, at the time t and before the surfactant injection begins (t = 0). Values of F k obtained in the injection wells (PS14B, PS14J and PS14M) and the extraction well (PS14I) are shown in Figure 3. Conductivity profiles were also measured in other wells (S14, PS14C, and PS14E. PS14E and PS14J). Results are plotted in the Figure S4 of the Supplementary Information.
It was noticed that the fluid injected into PS14B, PS14J and PS14M was not homogeneously distributed throughout the piezometer height, and mixing requires at least 3 h for the flow rates used. In PS14B, the fluid is well distributed over the entire height of the piezometer, even below the alluvial-marl contact. In well PS14M, anomalous k measurements are observed at some points below the alluvial-marl contact. The injected fluid distribution was observed in a narrow height of the alluvium in well PS14J. It does not appear that the injected fluid is distributed below the alluvial-marl contact. In addition, the distribution of injected fluid in this piezometer is more impeded than in piezometers PS14B and PS14M. This is likely due to a defect in the construction and development of the piezometer PS14J.
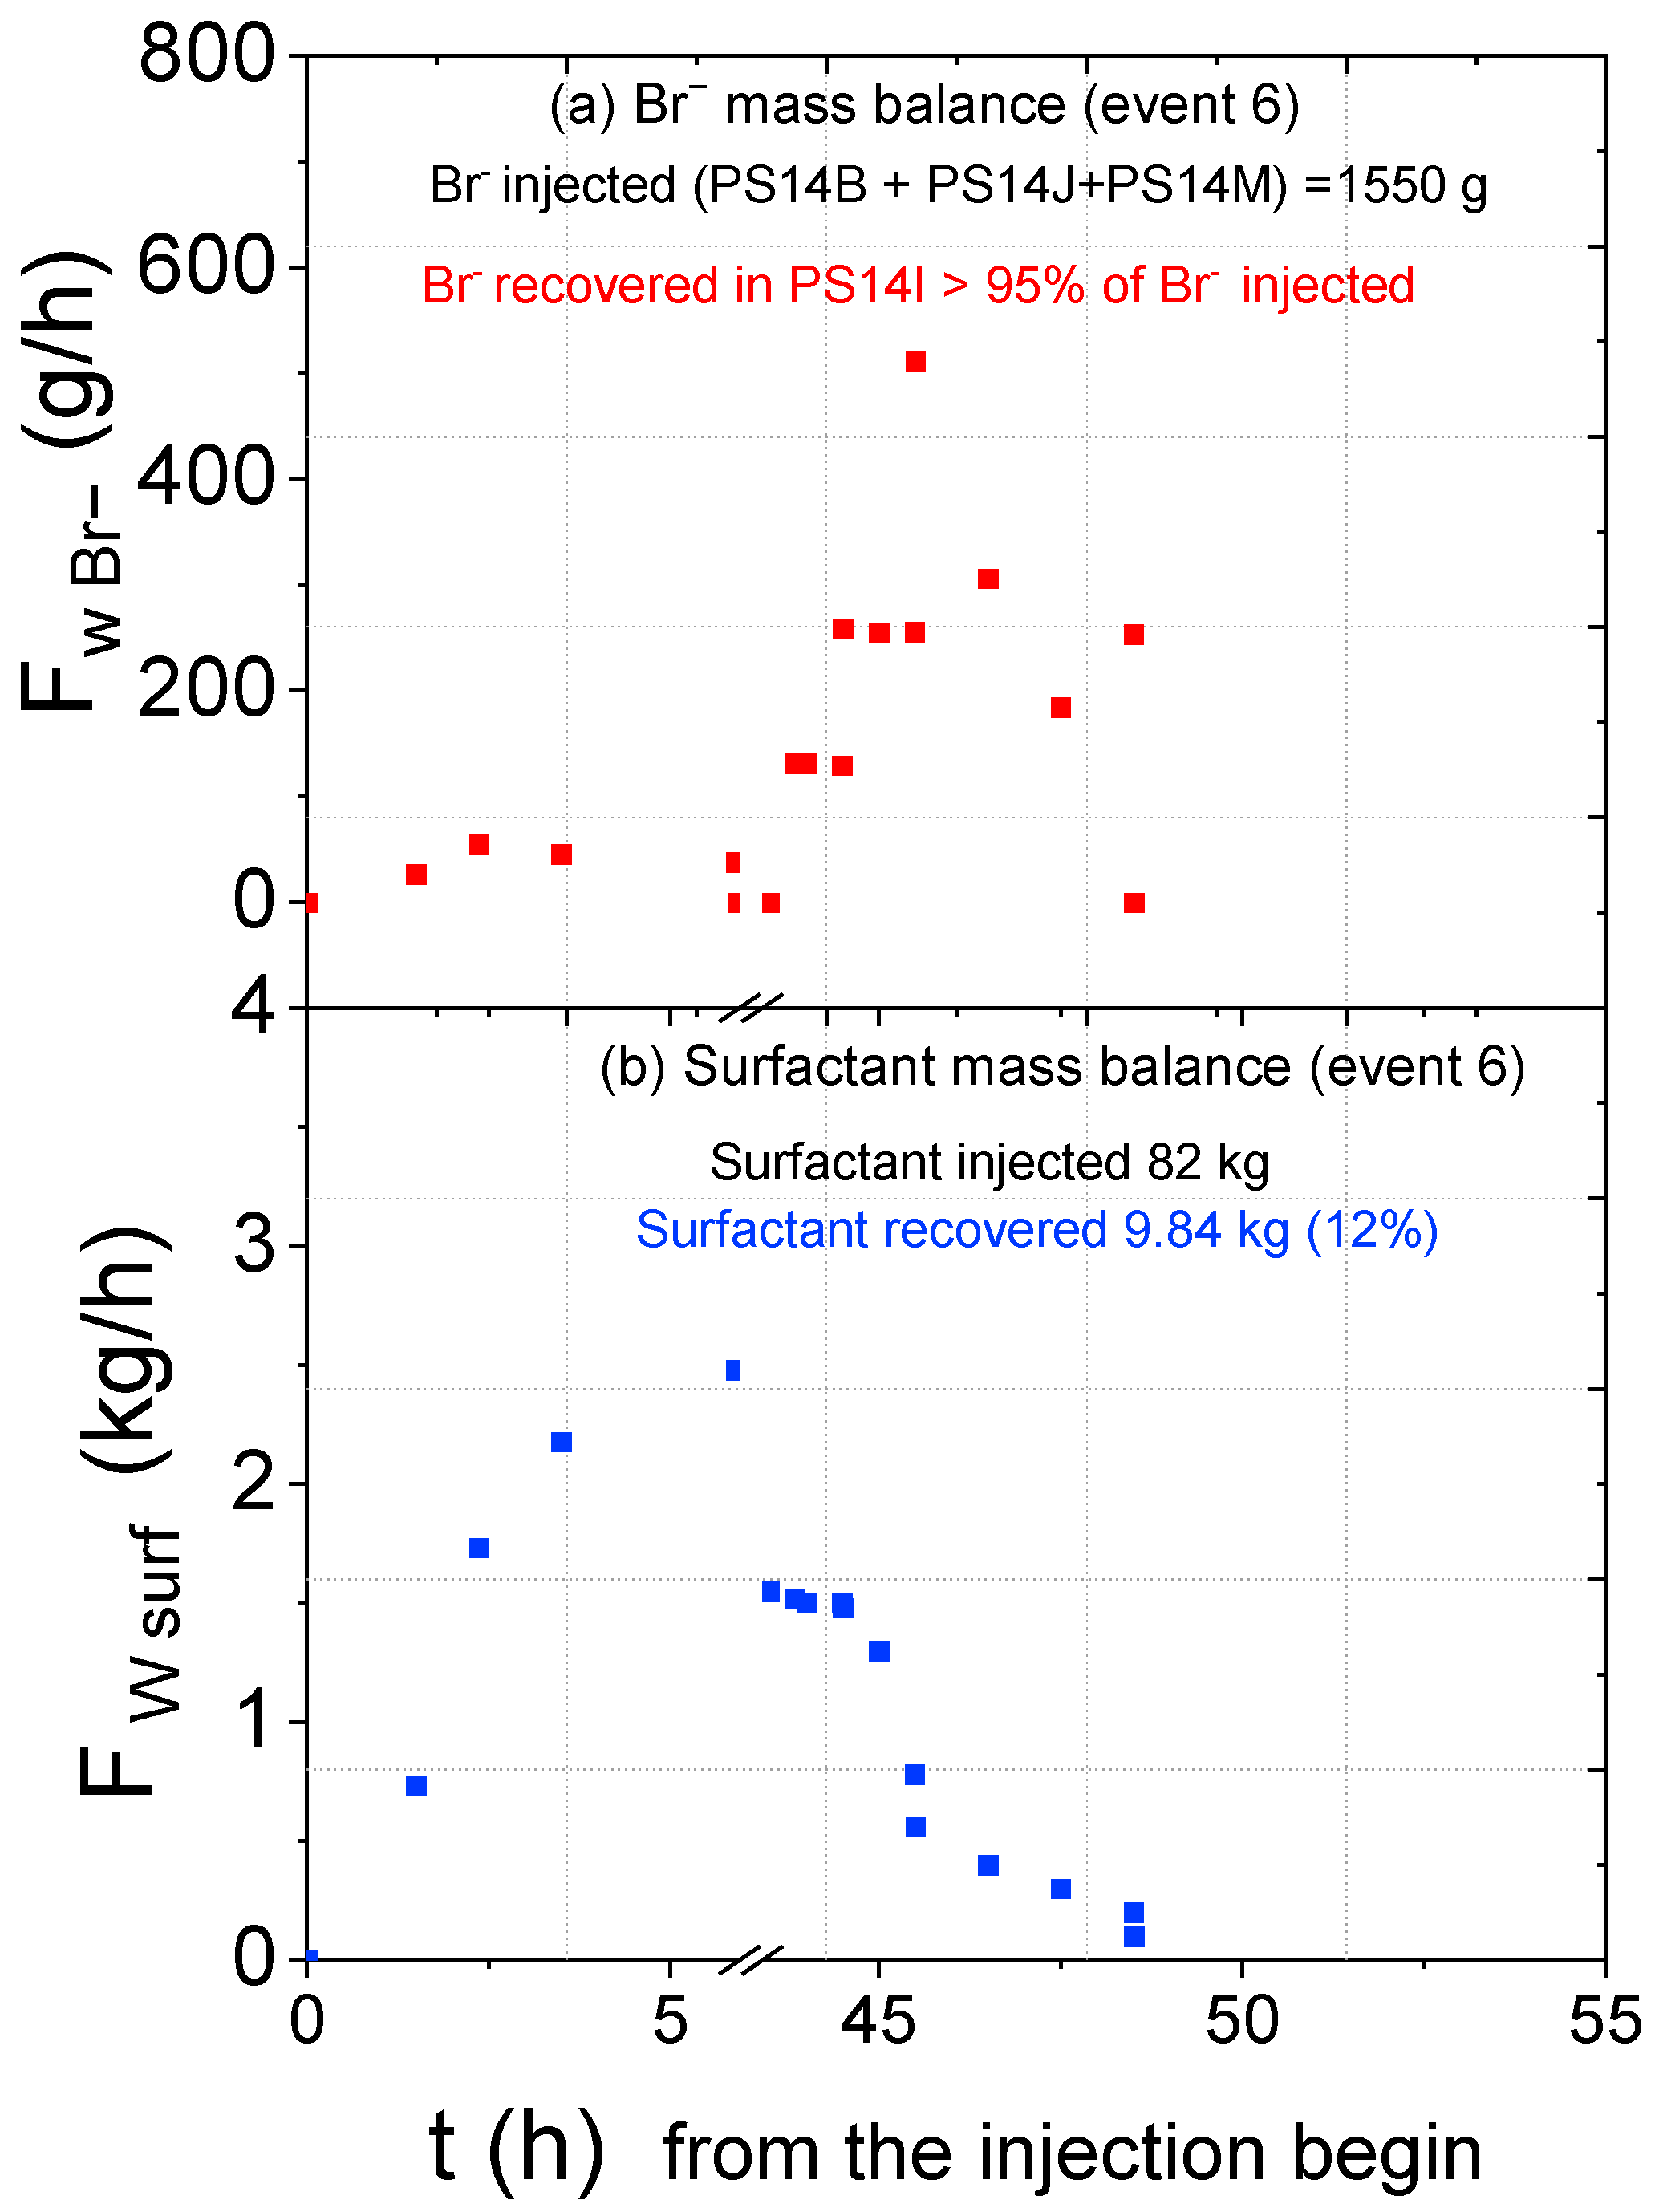
A significant fraction of the injected fluid reaches piezometers PS14C and PS14I. In well PS14I, preferential flow is found at a certain depth (15.5 to 14.5 m). This depth is one meter over the marls-alluvial contact and is consistent with the pumping point used in this event. PS14C is the only well (apart from the injection and extraction wells) with a significant surfactant arrival. Surfactant reaches first the 15.2 m depth (at time 1.5 h), and the dispersion plume widens with time (height between 15.8 and 13 at time of 5 h). Differences between dimensionless surfactant and bromide concentration are noticed again. Surfactant dimensionless concentration is always lower than the dimensionless bromide concentration. Table S4 shows that these differences are more remarkable after the surfactant injection stops. A mass balance of species in the injected (PS14B, PS14J and PS14M) and extracted (PS14I) fluid has been accomplished. The mass flow rate of bromide ( F W B r ) and surfactant ( F W s u r f ) extracted with time at well PS14I are shown in Figure 4. The area under the curve corresponds to the bromide (a) or surfactant (b) recovery mass in well PS14I. About 95% of the bromide injected is recovered. On the contrary, only 12% of injected surfactant was recovered after extraction of 16 m3 of fluid in PS14I (a volume of 2.8 m3 of aqueous surfactant solution was injected). This confirms the surfactant adsorption in the clay and the surfactant absorption in the DNAPL phase. In the sedimentation tanks, about 150 L (225 kg) of DNAPL was recovered as an organic phase in the total GW extracted in event 6. The organic phase obtained during extraction was partially in the form of small emulsion droplets that settled with time.
Events 2–5 and 7. In these events, the extracted GW were analysed. DNAPL recovered was mainly found as droplets that sediment with time. The mass of DNAPL recovered as an organic phase is summarized in Table 3. Average COCs and surfactant concentration solubilized in the final extracted GW volume at each event are summarized in Table 3. The surfactant injected and recovered (in the GW extracted) is also given in this table. The corresponding values obtained in events 1 and 6 have also been included.
About 375 kg of DNAPL has been extracted as an organic phase in events 1 to 7 (as shown in Table 3). The events contributing to this recovery are 1 and 6. An average value of 0.85 kg of Surfactant is used for each kg of DNAPL recovered, which is much lower in events 1 and 6. The mobilization of the organic phase at the contact between the alluvial and marls was enhanced by lowering the interfacial tension of this phase when surfactant was present in aqueous or organic phases, facilitating its extraction. DNAPL recovered with the extraction of GW without previous surfactant injection was negligible (data not shown).
Surfactant concentration decreases in the aqueous phase due to (a) higher GW volumes extracted compared with injected volumes of the surfactant emulsion, (b) surfactant adsorption in alluvial clays, marls, and (c) surfactant absorption in DNAPL. The low remanent surfactant concentration decreases the solubilized COCs in GW and avoids the surfactant and pollution dispersion in the alluvial out of the treated zone.
As shown in Table 3, the average solubilized COCs reach a value than can be managed in the WWTP at the landfill. The DNAPL was recovered as an organic phase from the bottom of the sedimentation tanks. DNAPL was managed as toxic waste (sent to incineration in an incinerator of toxic residues in France).
More than 6000 m3 of aqueous phase should be extracted in a typical pump and treat treatment to recover the same mass of DNAPL extracted in the sum of events 1 to 7. This volume is calculated considering an aqueous phase saturation in COCs of about 60 mg/L, and it is underestimated while saturation is not reached in GW. In addition, the less soluble compounds (NAC, TetraCBs and TCBs) will remain longer in the alluvial due to the lower relative solubility in GW.
Regarding the strategies followed, event 6 was the most productive, considering the mass of surfactant injected and DNAPL recovered. In this injection event, a low flow rate was injected (as in the case of event 1) but with simultaneous extraction in the well located inside the ring formed with the injection wells. Furthermore, higher extraction flow rates were used than in event 1, and GW extracted was about 10 times the fluid injected (in event 1 the GW volume extracted was only about the volume injected).
These results can be compared with those previously obtained in the SEAR application at pilot o full scale. Lee et al. [22] applied in-situ flushing in a pilot-scale site (4 m × 4 m × 4 m) contaminated with diesel, kerosene, and lubricating oil at Pusan, Korea. About 3 Pore Volumes (39 m3) of an aqueous emulsion of 2% in nonionic surfactant sorbitan monooleate (POE 20) mixed with alcohol (0.07% of isopropyl alcohol) were injected in four wells at a low flow rate (0.012–0.060 m3/h), 8 h per day, for 44 days. Most of the TPHs recovered were solubilized, reaching concentrations of up to 1761 ppm. The total mass of TPHs recovered was 48 kg. This value supposes a ratio of mass ratio surfactant: TPHs about 2:1. In addition, the fluid extracted was sent to a complex posttreatment to break the emulsion and recover the LNAPL. Abriola et al. [19] and Ramsburg et al. [40] injected 68.4 m3 of an aqueous solution of 6% (wt) of Tween 80 in a pilot-scale test to remediate an aquifer contaminated with PCE-DNAPL at the Bachman road site (Oscoda, MI, USA). Fluid (about 2 Pore Volumes) was injected in three wells at 0.114 m3/h for 5 days and extracted at 1.18 m3/h in one well for 47 days. The fluid extracted (more than 900 m3) was treated to recover PCE and surfactant from the emulsion. A volume of 19 L of PCE (about 30 kg) and 95% of the surfactant was recovered. The mass ratio of surfactant: PCE applied was about 14:1. High mass ratios of surfactant injected to organic compounds recovered are also reported by Robert et al. [41]. They used a mass ratio of 10:1 of surfactant:TCE. Childs et al. [42] recovered PCE at Dover National Test Site by injecting 10 PV of a surfactant formulation (AerosolMAR or AMA), isopropanol and calcium chloride. This mixture produces a high concentration of PCE in swollen micelles (supersolubilization) without vertical PCE migration. The mass ratio of surfactant-cosolvents to PCE was 20:1.
NAPL recovering by mobilization rather than solubilization avoids the management of high volumes of polluted aqueous emulsions and usually requires lower ratios of surfactant injected to the pollutant recovered. Sharma et al. [25] injected 3 PV of an aqueous solution with a mixture of surfactants (4%), cosolvent (4%) and salinity (2.2%) to remediate an aquifer contaminated with oil. The test cell was about 1000 m2. About 50 kg of surfactant and 25 kg of sec-butanol were injected in eight stages and applied for 8 months -each stage lasting 10 days-. About 33 kg of oil was recovered, mainly as an organic phase (mobilized NAPL contributes remarkably more than solubilized NAPL to the NAPL recovery). Mobilization and further solubilization of oil trapped in a porous media were also achieved by Bettahar et al. [43] by injecting an aqueous emulsion of a mixture of 1% of anionic-nonionic surfactant (1.5% salinity) to remediate a pilot test site 25 m × 12 m × 3 m spiked with 476 L of oil. A volume of 3 PV (unsaturated zone) was injected (23 m3), and extraction was carried out at about two times higher than the injection rate to recover the surfactant. A volume of 60 L of oils was recovered, corresponding to a mass ratio of about 0.4 kg surfactant/kg oil recovered. These authors also injected the surfactant in depth (saturated zone) and obtained lower efficiencies.
The comparison of data from SEAR application at the field or pilot scale is not evident because each site has different lithologies, hydraulic conductivities and pollutants. Recovering DNAPL requires surfactant injection in the saturated zone and uses a higher mass ratio of the surfactant injected to the pollutant recovered than recovering LNAPL (surfactant injection is mainly applied in the unsaturated zone). NAPL recovery by mobilization is preferred to NAPL recovery by solubilization. The recovery of the surfactant injected needs higher volumes of extracted fluids compared with the volumes of the aqueous solution of the surfactant injected.
In this work, about 1 PV of the surfactant emulsion was injected in the test cell, and the mass of COCs extracted was close to the surfactant mass injected. Considering the complex lithology of the site, the DNAPL location (at the bottom of the alluvial, trapped in the contact between the alluvial and the marls) and the high toxicity of this organic phase, this DNAPL amount can be considered a high recovery. The surfactant adsorbed could be recovered if high volumes of GW are extracted after the recovery of DNAPL. However, the surfactant concentration in the aqueous phase will be lower than required for further surfactant injections. The surfactant desorption from the alluvial soil has a KD value of about 50 L/kg [30]. Nonetheless, the non-ionic surfactant used was biodegradable, and surfactant adsorbed does not constitute a subsoil risk [44].

3.3. Groundwater Monitoring in 2021

The concentration of COCs in GW was measured before the surfactant injections. The values obtained before injections 1 and 6 are shown in Table 4. A small effect of injection events during 2021 was noticed in the COCs concentration monitored in GW at wells PS14x. This fact can be explained by considering the two previous soil flushing experiments: the first in July 2018 [23] and the second in November 2020 [34], as explained in the introduction section. The values of COCs in GW before the surfactant injections in April 2018 and November 2020 are also shown in Table 4. Only data in GW from wells PS14, PS14B, PC14C and PS14D are offered in April 2018 because no other PS14x wells were built at this date. As shown, COCs concentration in GW in wells PS14, PS14B, PC14C, and PS14D were higher in 2018 than in 2020. After the surfactant injection in 2020, a remarkable COCs decrease in GW was noticed in 2021. This drop can be explained by considering that soil flushing carried out in 2018 and 2020 achieved a high removal of COCs adsorbed in the alluvial. In soil flushing carried out in 2018 and 2020, the surfactant was injected at the middle height of the alluvial, with a better distribution in the alluvial depth. On the contrary, surfactant was injected in 2021 close to the contact between marls and graves (DNAPL is located as an organic phase near this contact). Soil obtained when PS14B and PS14D wells were drilled in 2018 was analysed [23], finding a COCs concentration in the alluvial range of 130–5670, depending on the alluvial depth.

3.4. DNAPL Accumulation in PS14x Wells

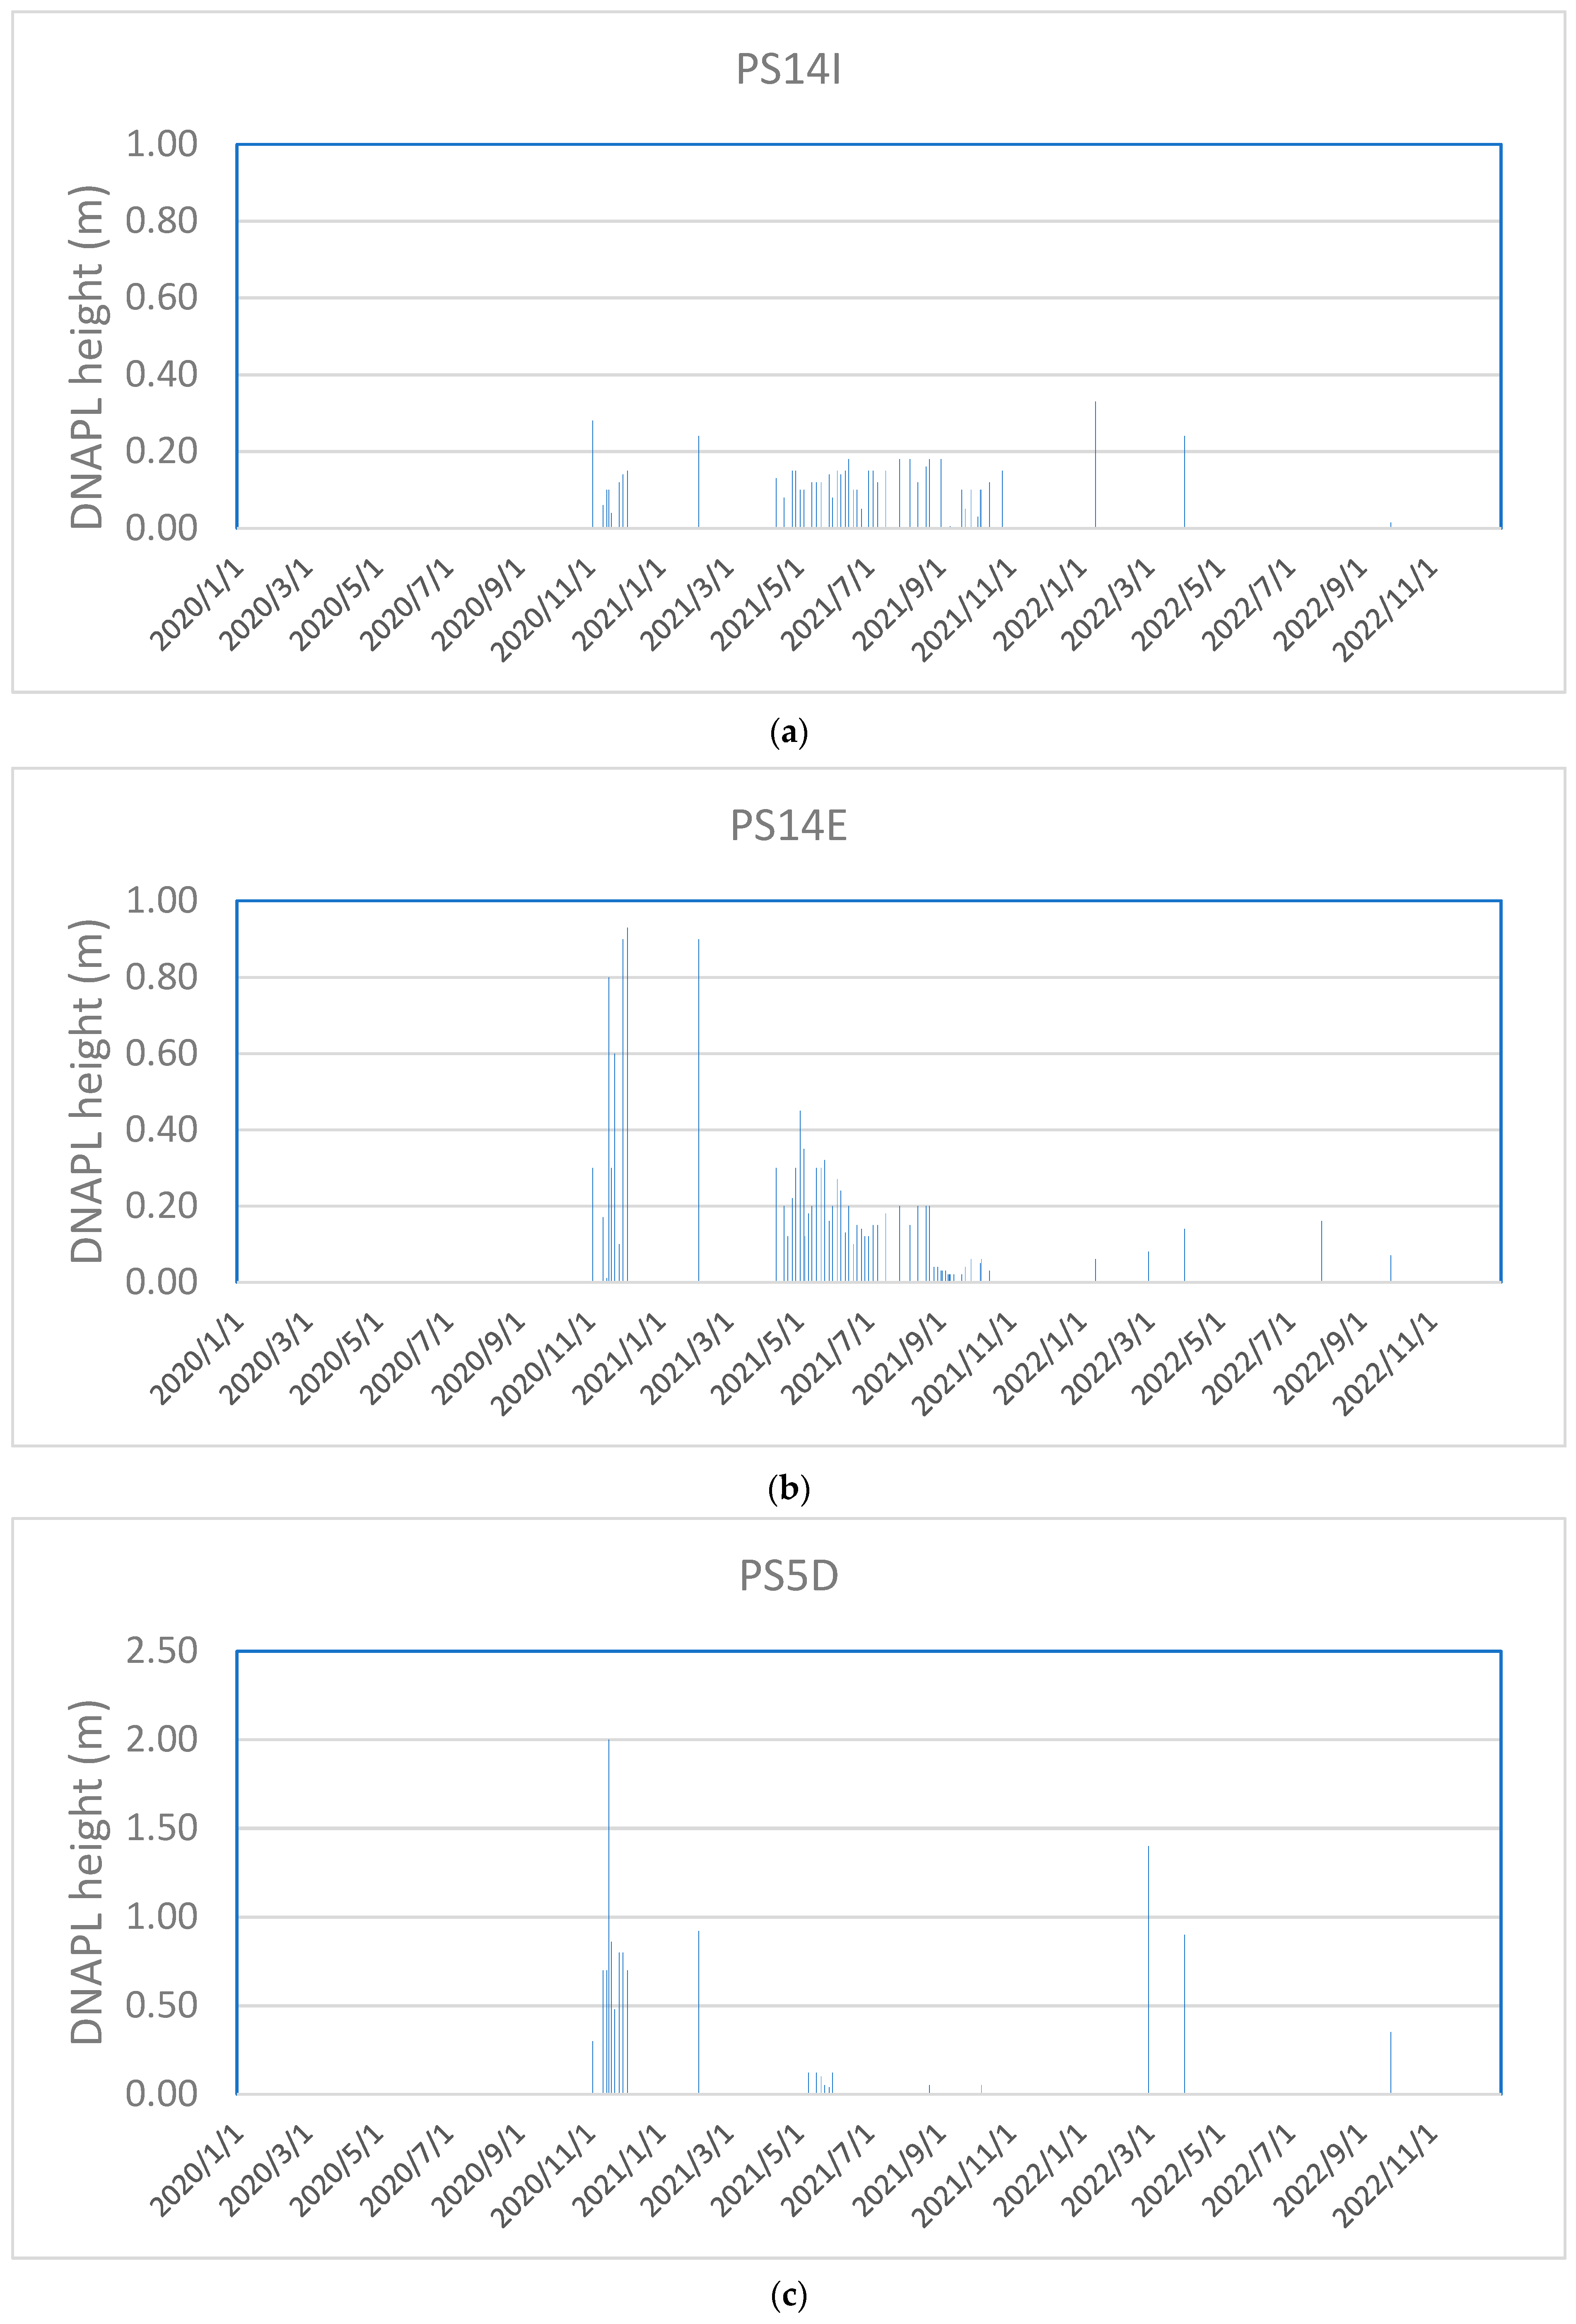
The presence of DNAPL was mainly noticed at piezometers PS14E, PS5D and PS14I. When DNAPL height in the piezometer increased by more than 40 cm, DNAPL was extracted by pneumatic pumping. The evolution of DNAPL height at the bottom of the piezometer PS14I, PS14E and PS5D are shown in Figure 5a–c, respectively. In well PS14E, DNAPL accumulation was always lower with time. In 2021 no extraction of DNAPL was accomplished by pneumatic pumping. In well PS14E, a surfactant solution was also injected in November 2020 (as explained in the introduction section). This decrease in DNAPL accumulation in PS14E confirms that DNAPL has been notably reduced in this area near PS14E by surfactant injections in 2020 and 2021. DNAPL accumulation is still significant in PS5D. In these wells, fewer SEAR events have been carried out (only event 2 in 2021), with low efficiency. In the wells PS14, PS14B, PS14C, PS14D, PS14J, PS14. PS14K, PS14L, and PS14M accumulation of DNAPL were low (lower than 20 cm and not measurable in many of them).

4. Conclusions

DNAPL produced as a liquid residue in the lindane production caused soil and groundwater contamination in the alluvial of the Sardas landfill. This liquid residue has migrated from the landfill surface or through fractures in the marls, contaminating the groundwater that flows through the alluvium (the permeable layer). The concentration of contaminants in groundwater is explained by the solubilization of DNAPL adsorbed in the alluvial soil as an organic phase in the contact between alluvial and marls. Among the chlorinated contaminants that compose DNAPL are HCHs, including lindane, and other highly chlorinated and non-aromatic cyclic compounds such as HeptaCHs and PentaCXs, which pose a significant risk to surface waters near the alluvial. Since 2018, the surfactant injections to remediate a highly contaminated area of this alluvial have led to a decrease in groundwater contamination from 14 to 4 mg/L (approximately) of HCHs. This decrease is mainly explained by the solubilization of DNAPL adsorbed in the soil alluvium during the successive surfactant injections. On the other hand, the surfactant injections have allowed a greater recovery by mobilization of the DNAPL found in contact with the marl. The flow rates of surfactant injection and injected fluid extraction and the time elapsed between the injection and extraction stages have significantly influenced this recovery. Higher DNAPL masses have been extracted by injecting low flow rates of the surfactant solution (less than 0.3 m3/h) and higher extraction flow rates of the injected fluid (>3 m3/h). The higher the time between injection and extraction, the higher the surfactant adsorption in the alluvium and the absorption of surfactant in the residual organic DNAPL. The absorption of surfactant in DNAPL can decrease the interfacial tension between aqueous and liquid phases and increase the DNAPL extraction by mobilization. These surfactant losses caused the drop of dissolved concentration in the aqueous phase over time, controlling the dispersion of contamination. The strong adsorption observed is due to the clay presence in the alluvial. In the future, if washing actions of the alluvial soil are needed, this contact time should be reduced, being carried out almost immediately after injection. However, for the extraction of DNAPL in contact with the marl, elapsing time higher than 24 h may be necessary to decrease the interfacial tension of this phase and improve its mobilization, obtaining two immiscible phases in the extraction, aqueous and organic, easy to separate and manage. The location of the injection point of the surfactant is a key parameter to achieving DNAPL recovery by solubilization or mobilization. This last mechanism is favoured when fluids are injected and extracted close to the location of the residual trapped DNAPL. The SEAR treatment is a better choice until the residual contamination drops to a sufficient value and other methods, such as ISCO or bioremediation, could be applied.

Supplementary Materials

The following supporting information can be downloaded at: https://www.mdpi.com/article/10.3390/su142416576/s1. Figure S1. Conceptual model of the subsoil at Sardas landfill. Figure S2. Complete map of wells in the Sardas Landfill. Figure S3. Appearance of GW samples taken at the end of the extraction in the injection event 1 and view of sedimentation tanks. Figure S4. Dimensionless conductivity profiles (Fk, Equation (3)) with time and and depth (m.s.n.s) in wells (a) PS14A, (b) PS14C, (c) PS14D, (d) PS14E and (e) PS14J. Table S1. Characteristics of the piezometers in the PS14s area. Reference elevations (m.s.n.s) and depths (m). Table S2. DNAPL Composition. Table S3. Groundwater monitoring during injection (event 1). Table S4. Groundwater monitoring in injection event 6.

Author Contributions

Conceptualization, J.G. (Joaquin Guadaño), J.G. (Jorge Gomez) and D.L.; Methodology, D.L., C.M.D., S.C. and R.G.-C.; Investigation, J.G. (Joaquin Guadaño), J.G. (Jorge Gomez), J.F., D.L., C.M.D., S.C. and R.G.-C.; Resources, J.G. (Joaquin Guadaño); Writing—original draft, J.G. (Jorge Gomez), J.F., D.L., C.M.D., S.C., R.G.-C. and A.S.; Supervision, A.S.; Project administration, J.G., J.F. and A.S.; Funding acquisition, J.F. All authors have read and agreed to the published version of the manuscript.

Funding

Supported by the project UCM-EMGRISA (ref 434-2020) “Aplicación de tratamientos fisicoquímicos en el vertedero de Sardas” under contract with Gobierno de Aragon (Exp. 1404-4422-2019/19).

Acknowledgments

This work was supported by the project UCM-EMGRISA (ref 434-2020) “Aplicación de tratamientos fisicoquímicos en el vertedero de Sardas” under contract with Gobierno de Aragon (Exp. 1404-4422-2019/19).

Conflicts of Interest

The authors declare no conflict of interest.

References

  1. Trellu, C.; Mousset, E.; Pechaud, Y.; Huguenot, D.; van Hullebusch, E.D.; Esposito, G.; Oturan, M.A. Removal of hydrophobic organic pollutants from soil washing/flushing solutions: A critical review. J. Hazard. Mater. 2016, 306, 149–174. [Google Scholar] [CrossRef] [PubMed]
  2. Siegrist, R.L.; Crimi, M.; Simpkin, T.J. In Situ Chemical Oxidation for Groundwater Remediation; Springer Science & Business Media: Berlin/Heidelberg, Germany, 2011; Volume 3. [Google Scholar]
  3. Stroo, H.F.; Leeson, A.; Marqusee, J.A.; Johnson, P.C.; Ward, C.H.; Kavanaugh, M.C.; Sale, T.C.; Newell, C.J.; Pennell, K.D.; Lebrón, C.A. Chlorinated ethene source remediation: Lessons learned. Environ. Sci. Technol. 2012, 46, 6438–6447. [Google Scholar] [CrossRef]
  4. Tressler, A.; Uchrin, C. Mathematical simulation of chlorinated ethene concentration rebound after in situ chemical oxidation. J. Environ. Sci. Health Part A-Toxic/Hazard. Subst. Environ. Eng. 2014, 49, 869–881. [Google Scholar] [CrossRef]
  5. Tomlinson, D.W.; Rivett, M.O.; Wealthall, G.P.; Sweeney, R.E.H. Understanding complex LNAPL sites: Illustrated handbook of LNAPL transport and fate in the subsurface. J. Environ. Manag. 2017, 204, 748–756. [Google Scholar] [CrossRef] [PubMed] [Green Version]
  6. CLU-IN. Dense Nonaqueous Phase Liquids (Dnapls). Available online: https://clu-in.org/contaminantfocus/default.focus/sec/dense_nonaqueous_phase_liquids_(dnapls)/cat/Treatment_Technologies/ (accessed on 7 March 2019).
  7. Kavanaugh, M.C.; Suresh, P.; Rao, C. The DNAPL Remediation Challenge: Is there a Case for Source Depletion? Environmental Protection Agency: Washington, DC, USA, 2003. [Google Scholar]
  8. Maire, J.; Joubert, A.; Kaifas, D.; Invernizzi, T.; Marduel, J.; Colombano, S.; Cazaux, D.; Marion, C.; Klein, P.Y.; Dumestre, A.; et al. Assessment of flushing methods for the removal of heavy chlorinated compounds DNAPL in an alluvial aquifer. Sci. Total Environ. 2018, 612, 1149–1158. [Google Scholar] [CrossRef] [PubMed] [Green Version]
  9. Huo, L.; Liu, G.; Yang, X.; Ahmad, Z.; Zhong, H. Surfactant-enhanced aquifer remediation: Mechanisms, influences, limitations and the countermeasures. Chemosphere 2020, 252, 126620. [Google Scholar] [CrossRef] [PubMed]
  10. Abriola, L.M.; Christ, J.A.; Pennell, K.D.; Ramsburg, C.A. Source remediation challenges. In Delivery and Mixing in the Subsurface: Processes and Design Principles for In Situ Remediation; Kitanidis, P.K., McCarty, P.L., Eds.; Springer: Berlin/Heidelberg, Germany, 2012; pp. 239–276. [Google Scholar] [CrossRef]
  11. Cheng, M.; Zeng, G.; Huang, D.; Yang, C.; Lai, C.; Zhang, C.; Liu, Y. Advantages and challenges of Tween 80 surfactant-enhanced technologies for the remediation of soils contaminated with hydrophobic organic compounds. Chem. Eng. J. 2017, 314, 98–113. [Google Scholar] [CrossRef]
  12. McCray, J.E.; Tick, G.R.; Jawitz, J.W.; Gierke, J.S.; Brusseau, M.L.; Falta, R.W.; Knox, R.C.; Sabatini, D.A.; Annable, M.D.; Harwell, J.H.; et al. Remediation of NAPL Source Zones: Lessons Learned from Field Studies at Hill and Dover AFB. Ground. Water 2011, 49, 727–744. [Google Scholar] [CrossRef] [Green Version]
  13. Kang, S.; Lim, H.S.; Gao, Y.; Kang, J.; Jeong, H.Y. Evaluation of ethoxylated nonionic surfactants for solubilization of chlorinated organic phases: Effects of partitioning loss and macroemulsion formation. J. Contam. Hydrol. 2019, 223, 103475. [Google Scholar] [CrossRef]
  14. Pennell, K.D.; Capiro, N.L.; Walker, D.I. Surfactant and cosolvent flushing. In Chlorinated Solvent Source Zone Remediation; Kueper, B.H., Stroo, H.F., Vogel, C.M., Ward, C.H., Eds.; Springer: Berlin/Heidelberg, Germany, 2014; Volume 7, pp. 353–394. [Google Scholar]
  15. Yang, J.S.; Yang, J.W. Partitioning effects of nonionic surfactants on the solubilization of single or binary chlorinated solvents: Batch and column experiments. J. Ind. Eng. Chem. 2018, 58, 140–147. [Google Scholar] [CrossRef]
  16. Zimmerman, J.B.; Kibbey, T.C.G.; Cowell, M.A.; Hayes, K.F. Partitioning of ethoxylated nonionic surfactants into nonaqueous-phase organic liquids: Influence on solubilization behavior. Environ. Sci. Technol. 1999, 33, 169–176. [Google Scholar] [CrossRef]
  17. Paria, S. Surfactant-enhanced remediation of organic contaminated soil and water. Adv. Colloid Interface Sci. 2008, 138, 24–58. [Google Scholar] [CrossRef] [PubMed]
  18. Londergan, J.; Yeh, L. Surfactant-Enhanced Aquifer Remediation (SEAR) Implementation Manual; Intera Inc.: Austin, TX, USA, 2003. [Google Scholar]
  19. Abriola, L.M.; Drummond, C.D.; Hahn, E.J.; Hayes, K.F.; Kibbey, T.C.; Lemke, L.D.; Pennell, K.D.; Petrovskis, E.A.; Ramsburg, C.A.; Rathfelder, K.M. Pilot-scale demonstration of surfactant-enhanced PCE solubilization at the Bachman road site. 1. Site characterization and test design. Environ. Sci. Technol. 2005, 39, 1778–1790. [Google Scholar] [CrossRef]
  20. Atteia, O.; Estrada, E.D.; Bertin, H. Soil flushing: A review of the origin of efficiency variability. Rev. Environ. Sci. Bio-Technol. 2013, 12, 379–389. [Google Scholar] [CrossRef]
  21. Kostarelos, K.; Lenschow, S.R.; Stylianou, M.A.; de Blanc, P.C.; Mygind, M.M.; Christensen, A.G. Jet A fuel recovery using micellar flooding: Design and implementation. Sci. Total Environ. 2016, 563, 890–898. [Google Scholar] [CrossRef] [PubMed]
  22. Lee, M.; Kang, H.; Do, W. Application of nonionic surfactant-enhanced in situ flushing to a diesel contaminated site. Water Res. 2005, 39, 139–146. [Google Scholar] [CrossRef] [PubMed]
  23. Santos, A.; Domínguez, C.M.; Lorenzo, D.; García-Cervilla, R.; Lominchar, M.A.; Fernández, J.; Gómez, J.; Guadaño, J. Soil flushing pilot test in a landfill polluted with liquid organic wastes from lindane production. Heliyon 2019, 5, e02875. [Google Scholar] [CrossRef] [Green Version]
  24. Svab, M.; Kubala, M.; Muellerova, M.; Raschman, R. Soil flushing by surfactant solution: Pilot-scale demonstration of complete technology. J. Hazard. Mater. 2009, 163, 410–417. [Google Scholar] [CrossRef]
  25. Sharma, P.; Kostarelos, K.; Lenschow, S.; Christensen, A.; de Blanc, P.C. Surfactant flooding makes a comeback: Results of a full-scale, field implementation to recover mobilized NAPL. J. Contam. Hydrol. 2020, 230, 103602. [Google Scholar] [CrossRef]
  26. Liu, J.-W.; Wei, K.-H.; Xu, S.-W.; Cui, J.; Ma, J.; Xiao, X.-L.; Xi, B.-D.; He, X.-S. Surfactant-enhanced remediation of oil-contaminated soil and groundwater: A review. Sci. Total Environ. 2021, 756, 144142. [Google Scholar] [CrossRef]
  27. Santos, A.; Fernandez, J.; Guadaño, J.; Lorenzo, D.; Romero, A. Chlorinated organic compounds in liquid wastes (DNAPL) from lindane production dumped in landfills in Sabiñanigo (Spain). Environ. Pollut. 2018, 242, 1616–1624. [Google Scholar] [CrossRef] [PubMed]
  28. Fernández, J.; Arjol, M.; Cacho, C. POP-contaminated sites from HCH production in Sabiñánigo, Spain. Environ. Sci. Pollut. Res. 2013, 20, 1937–1950. [Google Scholar] [CrossRef] [PubMed]
  29. Garcia-Cervilla, R.; Santos, A.; Romero, A.; Lorenzo, D. Simultaneous addition of surfactant and oxidant to remediate a polluted soil with chlorinated organic compounds: Slurry and column experiments. J. Environ. Chem. Eng. 2022, 10, 107625. [Google Scholar] [CrossRef]
  30. Garcia-Cervilla, R.; Santos, A.; Romero, A.; Lorenzo, D. Partition of a mixture of chlorinated organic compounds in real contaminated soils between soil and aqueous phase using surfactants: Influence of pH and surfactant type. J. Environ. Chem. Eng. 2021, 9, 105908. [Google Scholar] [CrossRef]
  31. Garcia-Cervilla, R.; Santos, A.; Romero, A.; Lorenzo, D. Compatibility of nonionic and anionic surfactants with persulfate activated by alkali in the abatement of chlorinated organic compounds in aqueous phase. Sci. Total Environ. 2021, 751, 141782. [Google Scholar] [CrossRef]
  32. Garcia-Cervilla, R.; Romero, A.; Santos, A.; Lorenzo, D. Surfactant-Enhanced Solubilization of Chlorinated Organic Compounds Contained in DNAPL from Lindane Waste: Effect of Surfactant Type and pH. Int. J. Environ. Res. Public Health 2020, 17, 4494. [Google Scholar] [CrossRef]
  33. Lorenzo, D.; Santos, A.; Domínguez, C.M.; Guadaño, J.; Gómez, J.; Fernández, J. Transport Model of Fluids Injected in a Landfill Polluted with Lindane Wastes. Comput. Aided Chem. Eng. 2020, 48, 613–618. [Google Scholar]
  34. StopLindano. Memoria Anual 2020. Servicio de Seguimiento Hidrogeológico de Sardas, 2020–2022. Available online: http://www.stoplindano.es/app/uploads/2021/07/Memoria%20anual%20Sardas%202020%20completo%20red.pdf (accessed on 1 November 2022).
  35. Laha, S.; Tansel, B.; Ussawarujikulchai, A. Surfactant-soil interactions during surfactant-amended remediation of contaminated soils by hydrophobic organic compounds: A review. J. Environ. Manag. 2009, 90, 95–100. [Google Scholar] [CrossRef]
  36. Ussawarujikulchai, A.; Laha, S.; Tansel, B. Synergistic Effects of Organic Contaminants and Soil Organic Matter on the Soil-Water Partitioning and Effectiveness of a Nonionic Surfactant (Triton X-100). Bioremediat. J. 2008, 12, 88–97. [Google Scholar] [CrossRef]
  37. Fytianos, K.; Voudrias, E.; Papamichali, A. Behavior and fate of linear alkylbenzene sulfonate in different soils. Chemosphere 1998, 36, 2741–2746. [Google Scholar] [CrossRef]
  38. Kang, S.; Jeong, H.Y. Sorption of a nonionic surfactant Tween 80 by minerals and soils. J. Hazard. Mater. 2015, 284, 143–150. [Google Scholar] [CrossRef] [PubMed]
  39. Rodriguez-Cruz, M.S.; Sanchez-Martin, M.J.; Sanchez-Camazano, M. A comparative study of adsorption of an anionic and a non-ionic surfactant by soils based on physicochemical and mineralogical properties of soils. Chemosphere 2005, 61, 56–64. [Google Scholar] [CrossRef]
  40. Ramsburg, C.A.; Pennell, K.D.; Abriola, L.M.; Daniels, G.; Drummond, C.D.; Gamache, M.; Hsu, H.-l.; Petrovskis, E.A.; Rathfelder, K.M.; Ryder, J.L.; et al. Pilot-Scale Demonstration of Surfactant-Enhanced PCE Solubilization at the Bachman Road Site. 2. System Operation and Evaluation. Environ. Sci. Technol. 2005, 39, 1791–1801. [Google Scholar] [CrossRef] [PubMed]
  41. Robert, T.; Martel, R.; Conrad, S.H.; Lefebvre, R.; Gabriel, U. Visualization of TCE recovery mechanisms using surfactant–polymer solutions in a two-dimensional heterogeneous sand model. J. Contam. Hydrol. 2006, 86, 3–31. [Google Scholar] [CrossRef] [PubMed]
  42. Childs, J.; Acosta, E.; Annable, M.D.; Brooks, M.C.; Enfield, C.G.; Harwell, J.H.; Hasegawa, M.; Knox, R.C.; Rao, P.S.C.; Sabatini, D.A.; et al. Field demonstration of surfactant-enhanced solubilization of DNAPL at Dover Air Force Base, Delaware. J. Contam. Hydrol. 2006, 82, 1–22. [Google Scholar] [CrossRef]
  43. Bettahar, M.; Ducreux, J.; Schäfer, G.; Van Dorpe, F. Surfactant enhanced in situ remediation of LNAPL contaminated aquifers: Large scale studies on a controlled experimental site. Transp. Porous Media 1999, 37, 255–276. [Google Scholar] [CrossRef]
  44. Besha, A.T.; Bekele, D.N.; Naidu, R.; Chadalavada, S. Recent advances in surfactant-enhanced In-Situ Chemical Oxidation for the remediation of non-aqueous phase liquid contaminated soils and aquifers. Environ. Technol. Innov. 2018, 9, 303–322. [Google Scholar] [CrossRef]
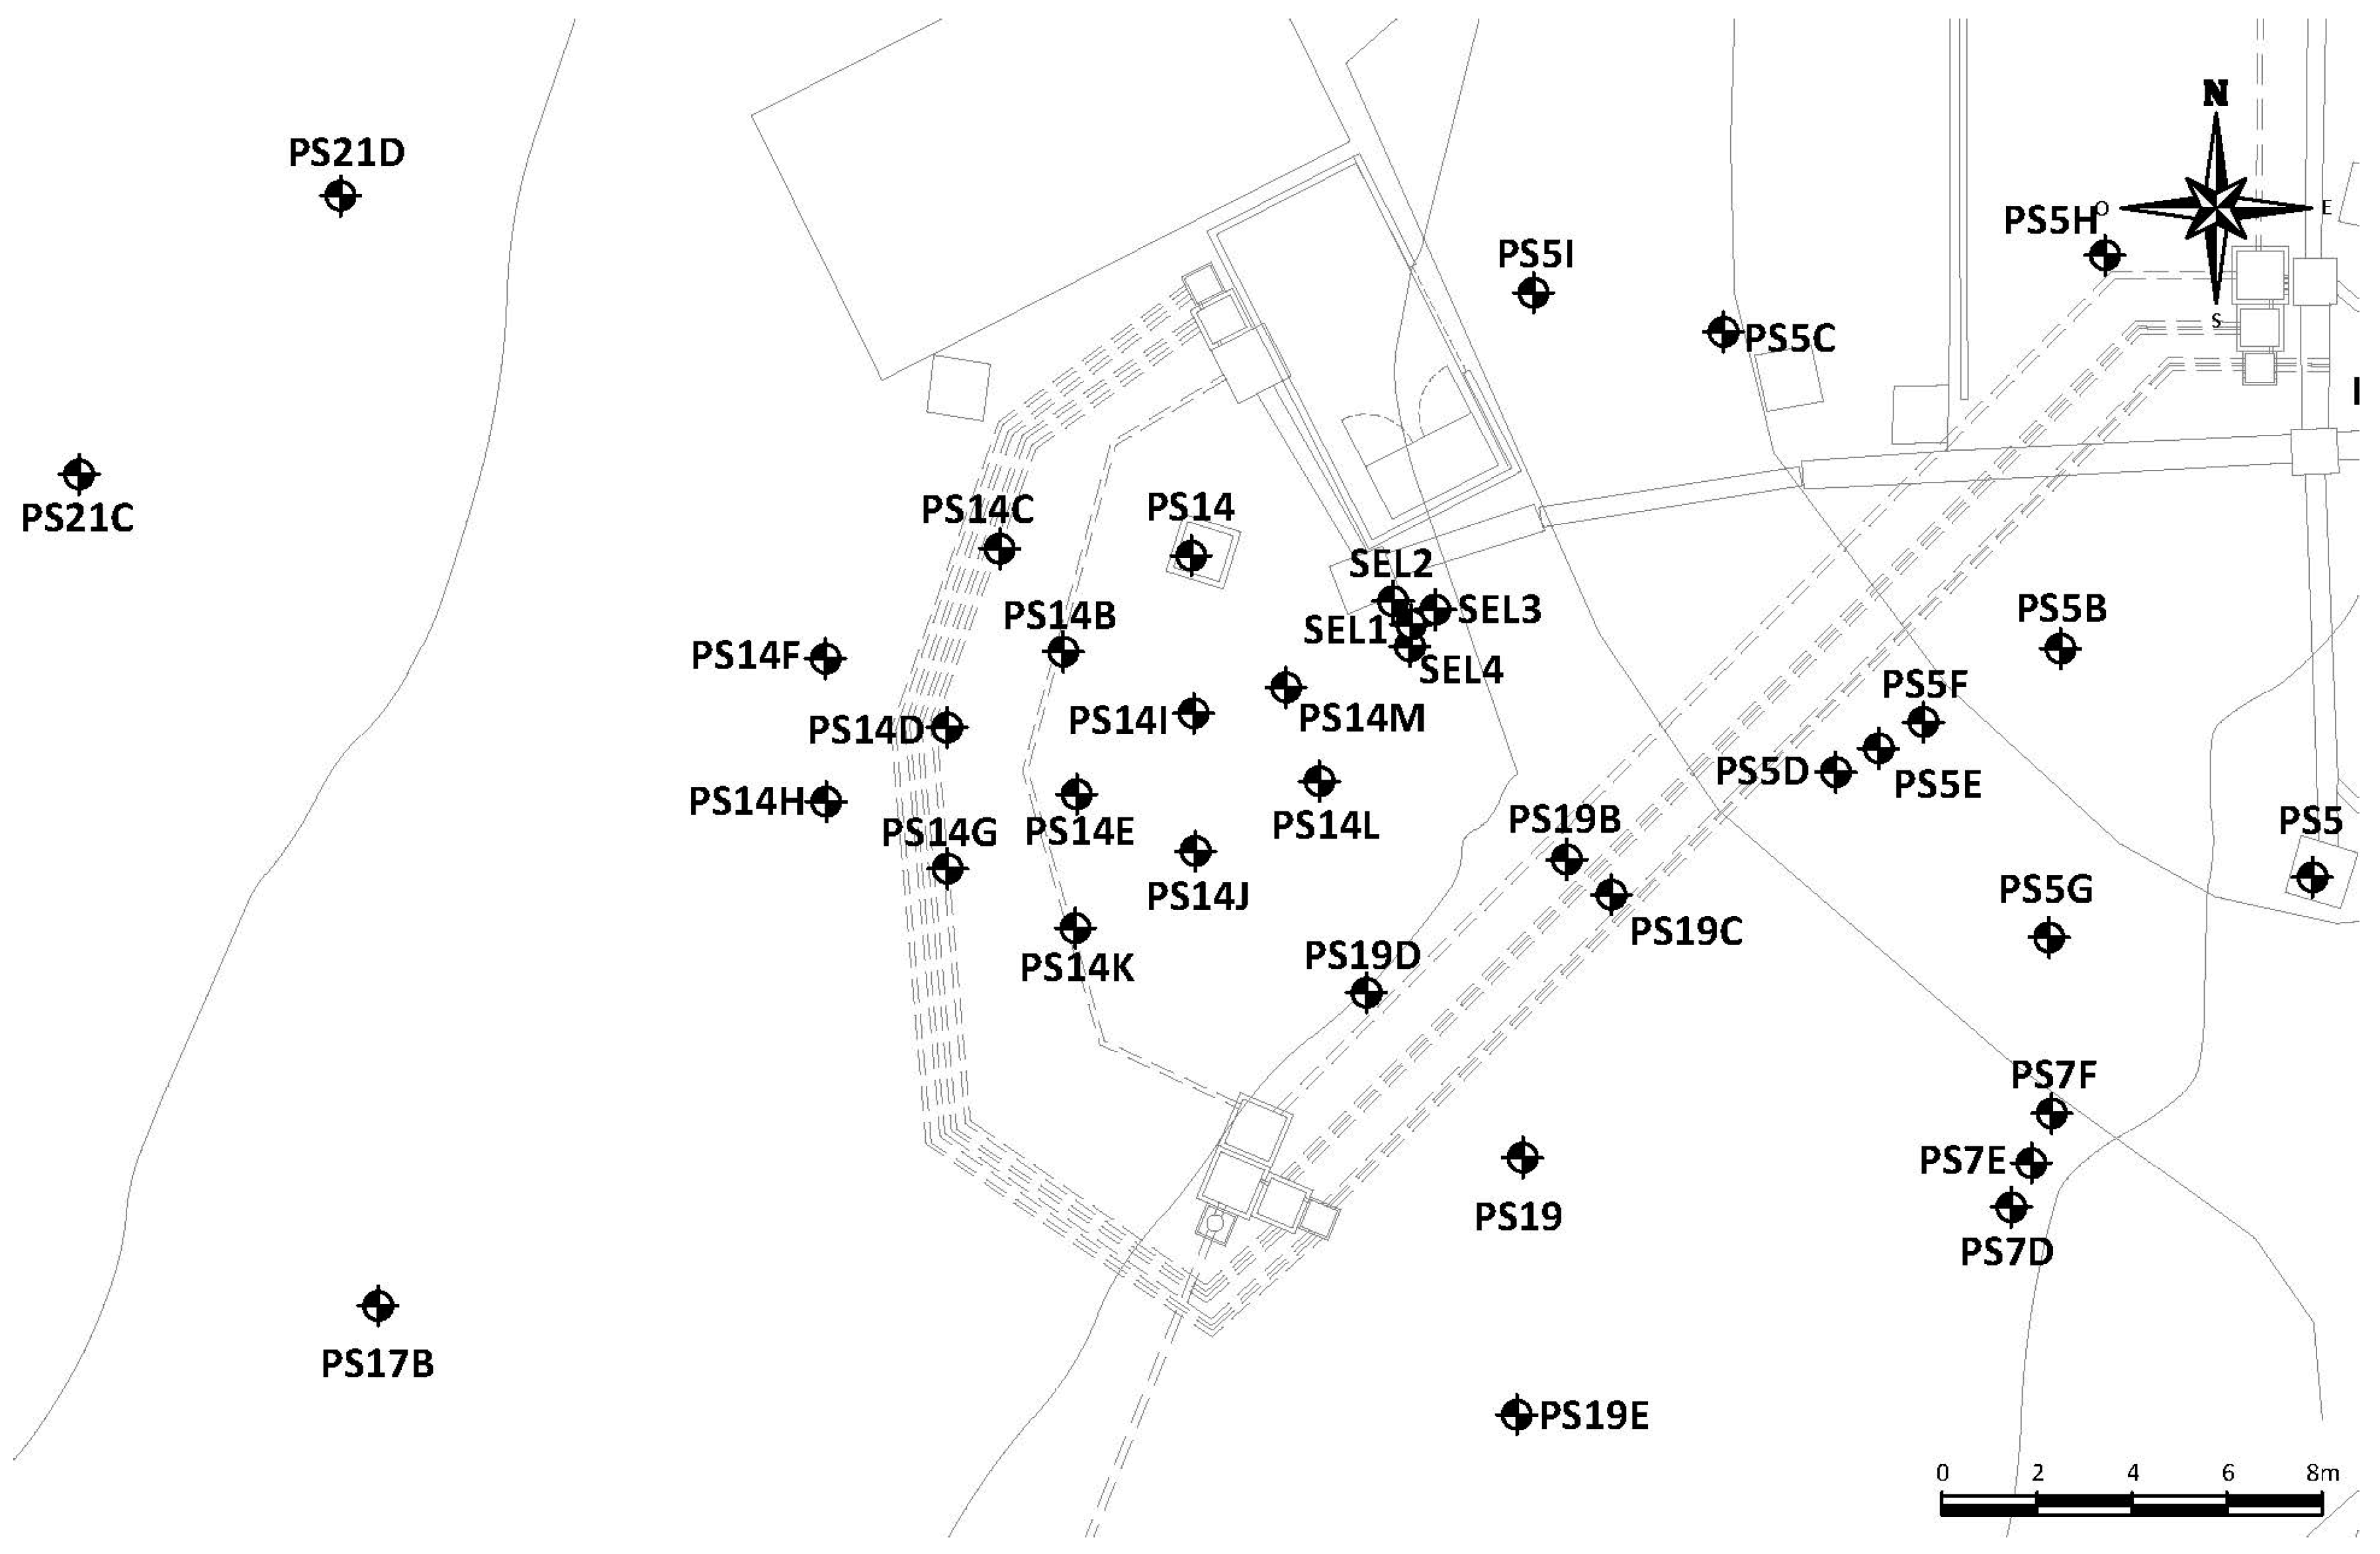
Figure 1. Wells used for surfactant injection, extraction, and monitoring.
Sustainability 14 16576 g001
Figure 2. Conceptual model of the alluvial in the PS14x wells.
Sustainability 14 16576 g002
Figure 3. Dimensionless conductivity profiles (Fk, Equation (3)) with time and depth (m.s.n.s) in wells (a) PS14B, (b) PS14J, (c) PS14M and (d) PS14I.
Sustainability 14 16576 g003
Figure 4. Mass flow rate of (a) bromide and (b) surfactant with time in the extraction well PS14I in the injection event 6. (Area corresponds to the bromide or surfactant recovery mass in well PS14I).
Sustainability 14 16576 g004
Figure 5. Height of DNAPL accumulated at the bottom of piezometers in (a) PS14I, (b) PS14E, and (c) PS5D.
Sustainability 14 16576 g005
Table 1. Surfactant injection events between April and October 2021 in the PS14x wells.
Injections
Event1234567
Injection wellsPS14B, PS14E, PS14IPS5DPS14EPS14EPS14IPS14B, PS14J, PS14MPS14D
Date/time injection20 April 2021 8:0011 May 2021 10:3024 May 2021 13:307 June 2021 10:3514 June 2021 11:5020 September 2021 12:075 October 2021 13:30
Surfactant (g/L)20255.425253053
Bromide (Y/N)Yes (260 mg/L)NoNoNoNoYes (538 mg/L)N
Q injection (m3/h)0.300.650.680.850.710.20Approx. 0.08
Injection Depth (m)0.5 above contact with marls0.5 above contact with marls0.5 above contact with marls0.5 above contact with marls0.5 above contact with marlsAlluvial-marls contactAlluvial-marls contact
Injection duration (h)8.04.03.53.03.55.02.5
Total volume injected (m3)7.203.002.802.603.002.800.20
Monitoring wells during injectionPS14, PS14B, PS14C, PS14D, PS14E, PS14F, PS14G, PS14H, PS14I, PS14J, PS14K PS14L, PS14M and PS21CPS5DPS14E PS14, PS14B, PS14C, PS14D, PS14E, PS14I, PS14J, PS14K, PS14L, PS14M
Monitoring time (GW samples) (h)0, 8 and 240, 8, 24 0, 5.8, 24
Remarks Simultaneous extraction in PS14I at approx. 0.18 m3/h. (total volume extracted 1.3 m3)
Table 2. Extraction events of fluids injected between April and October 2021 in the PS14x wells.
Extractions
Event1234567
Date/time extraction 121 April 2021 15:0013 May 2021 9:0027 May 2021 7:0010 June 2021 11:3017 June 2021 6:4022 September 2021 7:206 October 2021 7:00
Extraction wellsPS14, PS14B, PS14C, PS14D, PS14E, PS14G, PS14H, PS14I, PS14K, PS14MPS5DPS14EPS14EPS14IPS14IPS14D
Pumping depthBottom of piezometer0.5 m above alluvial-marl contactBottom of piezometerBottom of piezometerBottom of piezometerBottom of piezometerBottom of piezometer
Q extraction (m3/h)0.302 m33.003.003.00–4.501 m3/h (0–1 h)4.50
2 m3/h (1–2 h)
3 m3/h (2–3 h)
4 m3/h (3–4 h)
5 m3/h (4–5 h)
Total volume extracted (m3)6.526.009.0024.0037.0015.2638.38
Date/time extraction 26 May 2021 10:4514 May 2021 7:00 22 September 2021 12:30
Extraction point(s)PS14B, PS14E, PS14IPS5D PS14B, PS14M, PS14J
Suction depthBottom of piezometer0.5 m above alluvial-marls contact Bottom of piezometer
Q extraction (m3/h)0.30Staggered 2 m3 4.50
Total volume extracted (m3)2.216.00 12.88
Time elapsed between injection and extraction (h)1st: 31; 2nd 3911st: 47; 2nd 7165.570671st 48; 2nd 5318
Table 3. Surfactant, DNAPL (as organic phase) and solubilized COCs in the fluids extracted in surfactant injection events 1 to 7 (Table 1 and Table 2).
EventSurfactant Injected (kg)V Injected (m3)V Extracted
(m3)
kg of DNAPL Recovered as Organic PhaseMass of Surfactant in Extracted Fluids (kg)kg COCs Solubilized in Extracted FluidsAverage Surfactant Concentration in Extracted Fluid (g/L)Average COCs Concentration Solubilized in Extracted Fluid (mg/L)
11447.26.525320.520.3179.75
275361090.751.50125.00
3182.894.500.810.0090.00
4602.624150.0610.0041.67
5603371210.190.035.14
6842.816.06280100.540.6233.62
7100.238.4061.80.1646.88
SUM451.0021.60136.98374.528.065.61
Table 4. COCs concentration in GW before the surfactant injections in the alluvial were applied (April 2018, November 2020), and in events 1 and 6 in 2021.
EventWellC Surf
(g/L)
COCs Tot
(mg/L)
CBs + DCBS
(mg/L)
TCBs + TetraCBS
(mg/L)
NACs (mg/L)
April 2018PS14071.1750.965.6514.57
November 2020PS14051.031.04.016.0
1 (April 2021)PS14026.5016.455.484.57
6 (September 2021)PS14026.6816.615.584.49
April 2018PS14B089.2167.686.3415.19
November 2020PS14B050.032.02.016.0
1 (April 2021)PS14B017.3211.13.23.02
6 (September 2021)PS14B023.4116.663.313.44
April 2018PS14C077.9257.255.0815.60
November 2020PS14C063.037.03.023.0
1 (Apr 2021)PS14C021.26125.14.16
6 (Sept 2021)PS14C029.2520.724.084.45
Apr 2018PS14D0108.4783.736.5818.16
Nov 2020PS14D052.032.03.018.0
1 (April 2021)PS14D019.5133.43.1
6 (September 2021)PS14D037.2127.014.815.39
November 2020PS14E059.043.03.013.0
1 (April 2021)PS14E0211254
6 (September 2021)PS14E023.7818.413.092.28
November 2020PS14I041.2632.02.016.0
1 (April 2021)PS14I020.212.93.83.5
6 (September 2021)PS14I025.116.583.814.71
1 (April 2021)PS14J021.2143.83.4
6 (September 2021)PS14J026.0815.54.46.18
November 2020PS14K020.315.50.84.0
1 (April 2021)PS14K013.792.42.3
6 (September 2021)PS14K07.646.770.570.3
November 2020PS14L03.542.830.150.56
1 (April 2021)PS14L09.862.11.7
6 (September 2021)PS14L017.9812.72.32.98
November 2020PS14M032.123.81.46.9
1 (April 2021)PS14M017.510.23.93.4
6 (September 2021)PS14M018.8314.852.371.61
Publisher’s Note: MDPI stays neutral with regard to jurisdictional claims in published maps and institutional affiliations.