

Parametrization Study for Optimal Pre-Combustion Integration of Membrane Processes in BIGCC


Abstract
:1. Introduction
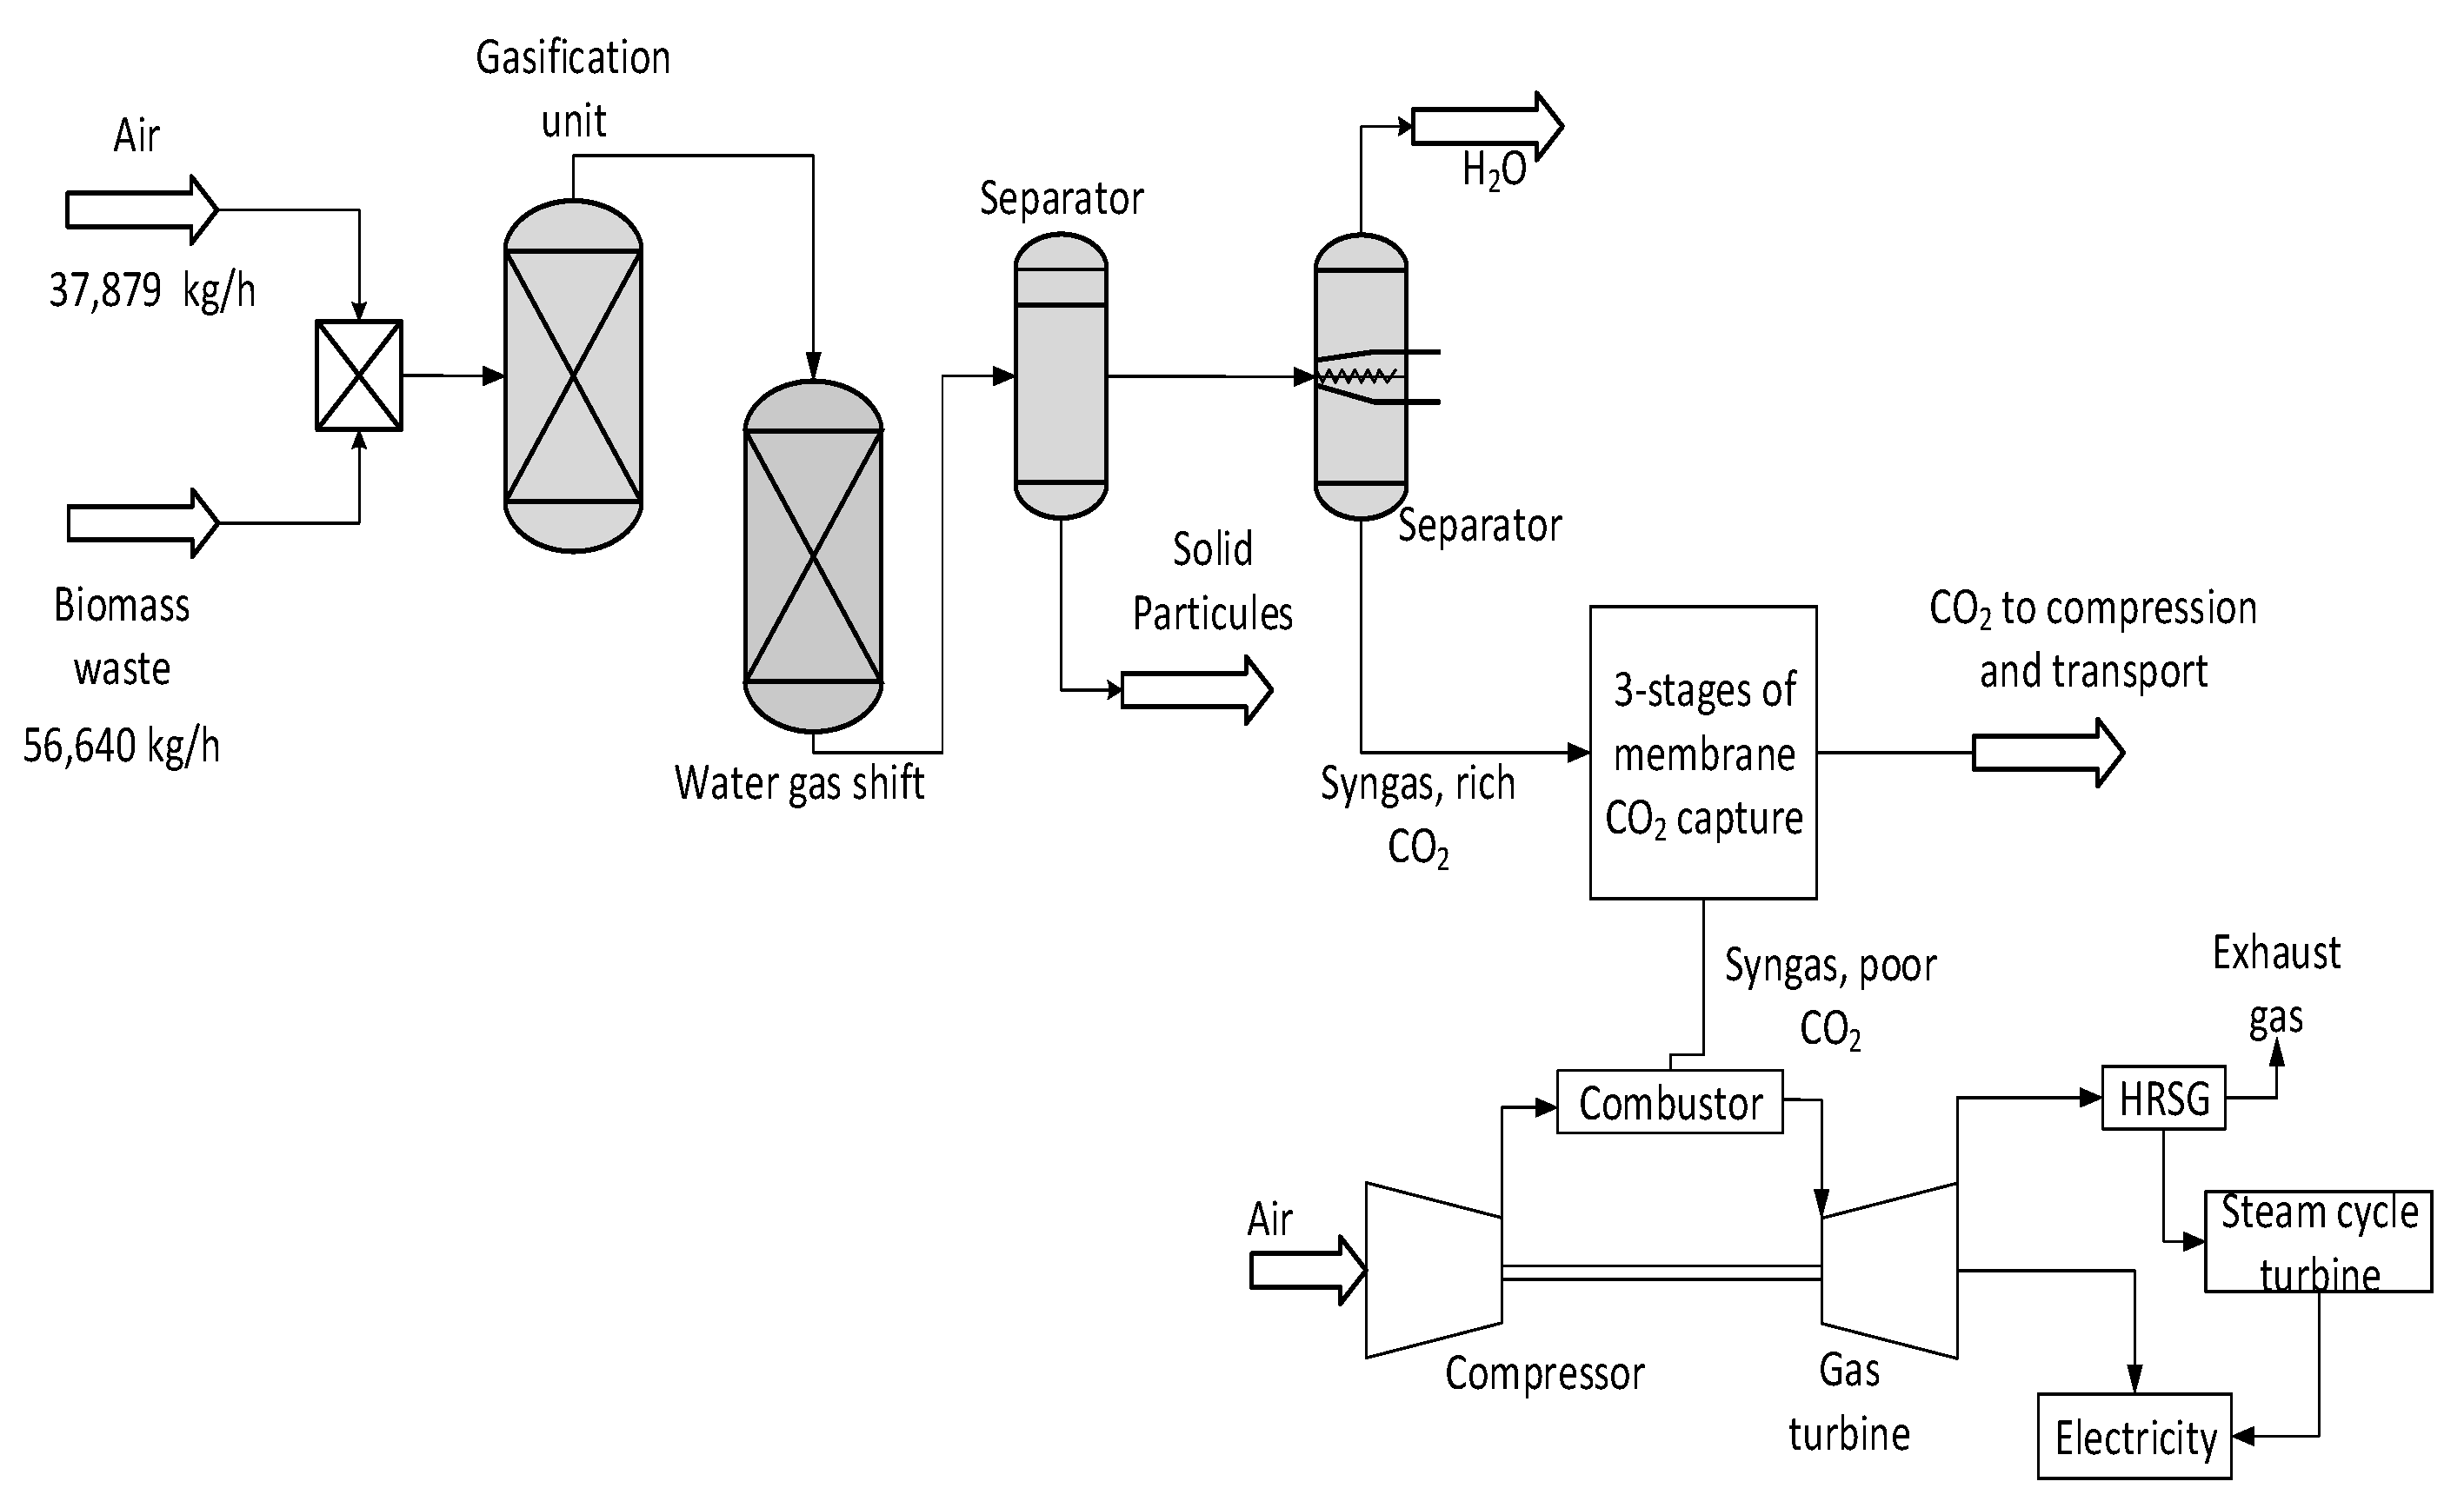
2. Gasification of Biomass Power Plant
2.1. Gasification of Biomass without CCS
2.2. Integration of Membrane CO2 Capture Process
3. Technical and Economical Assessments
- -
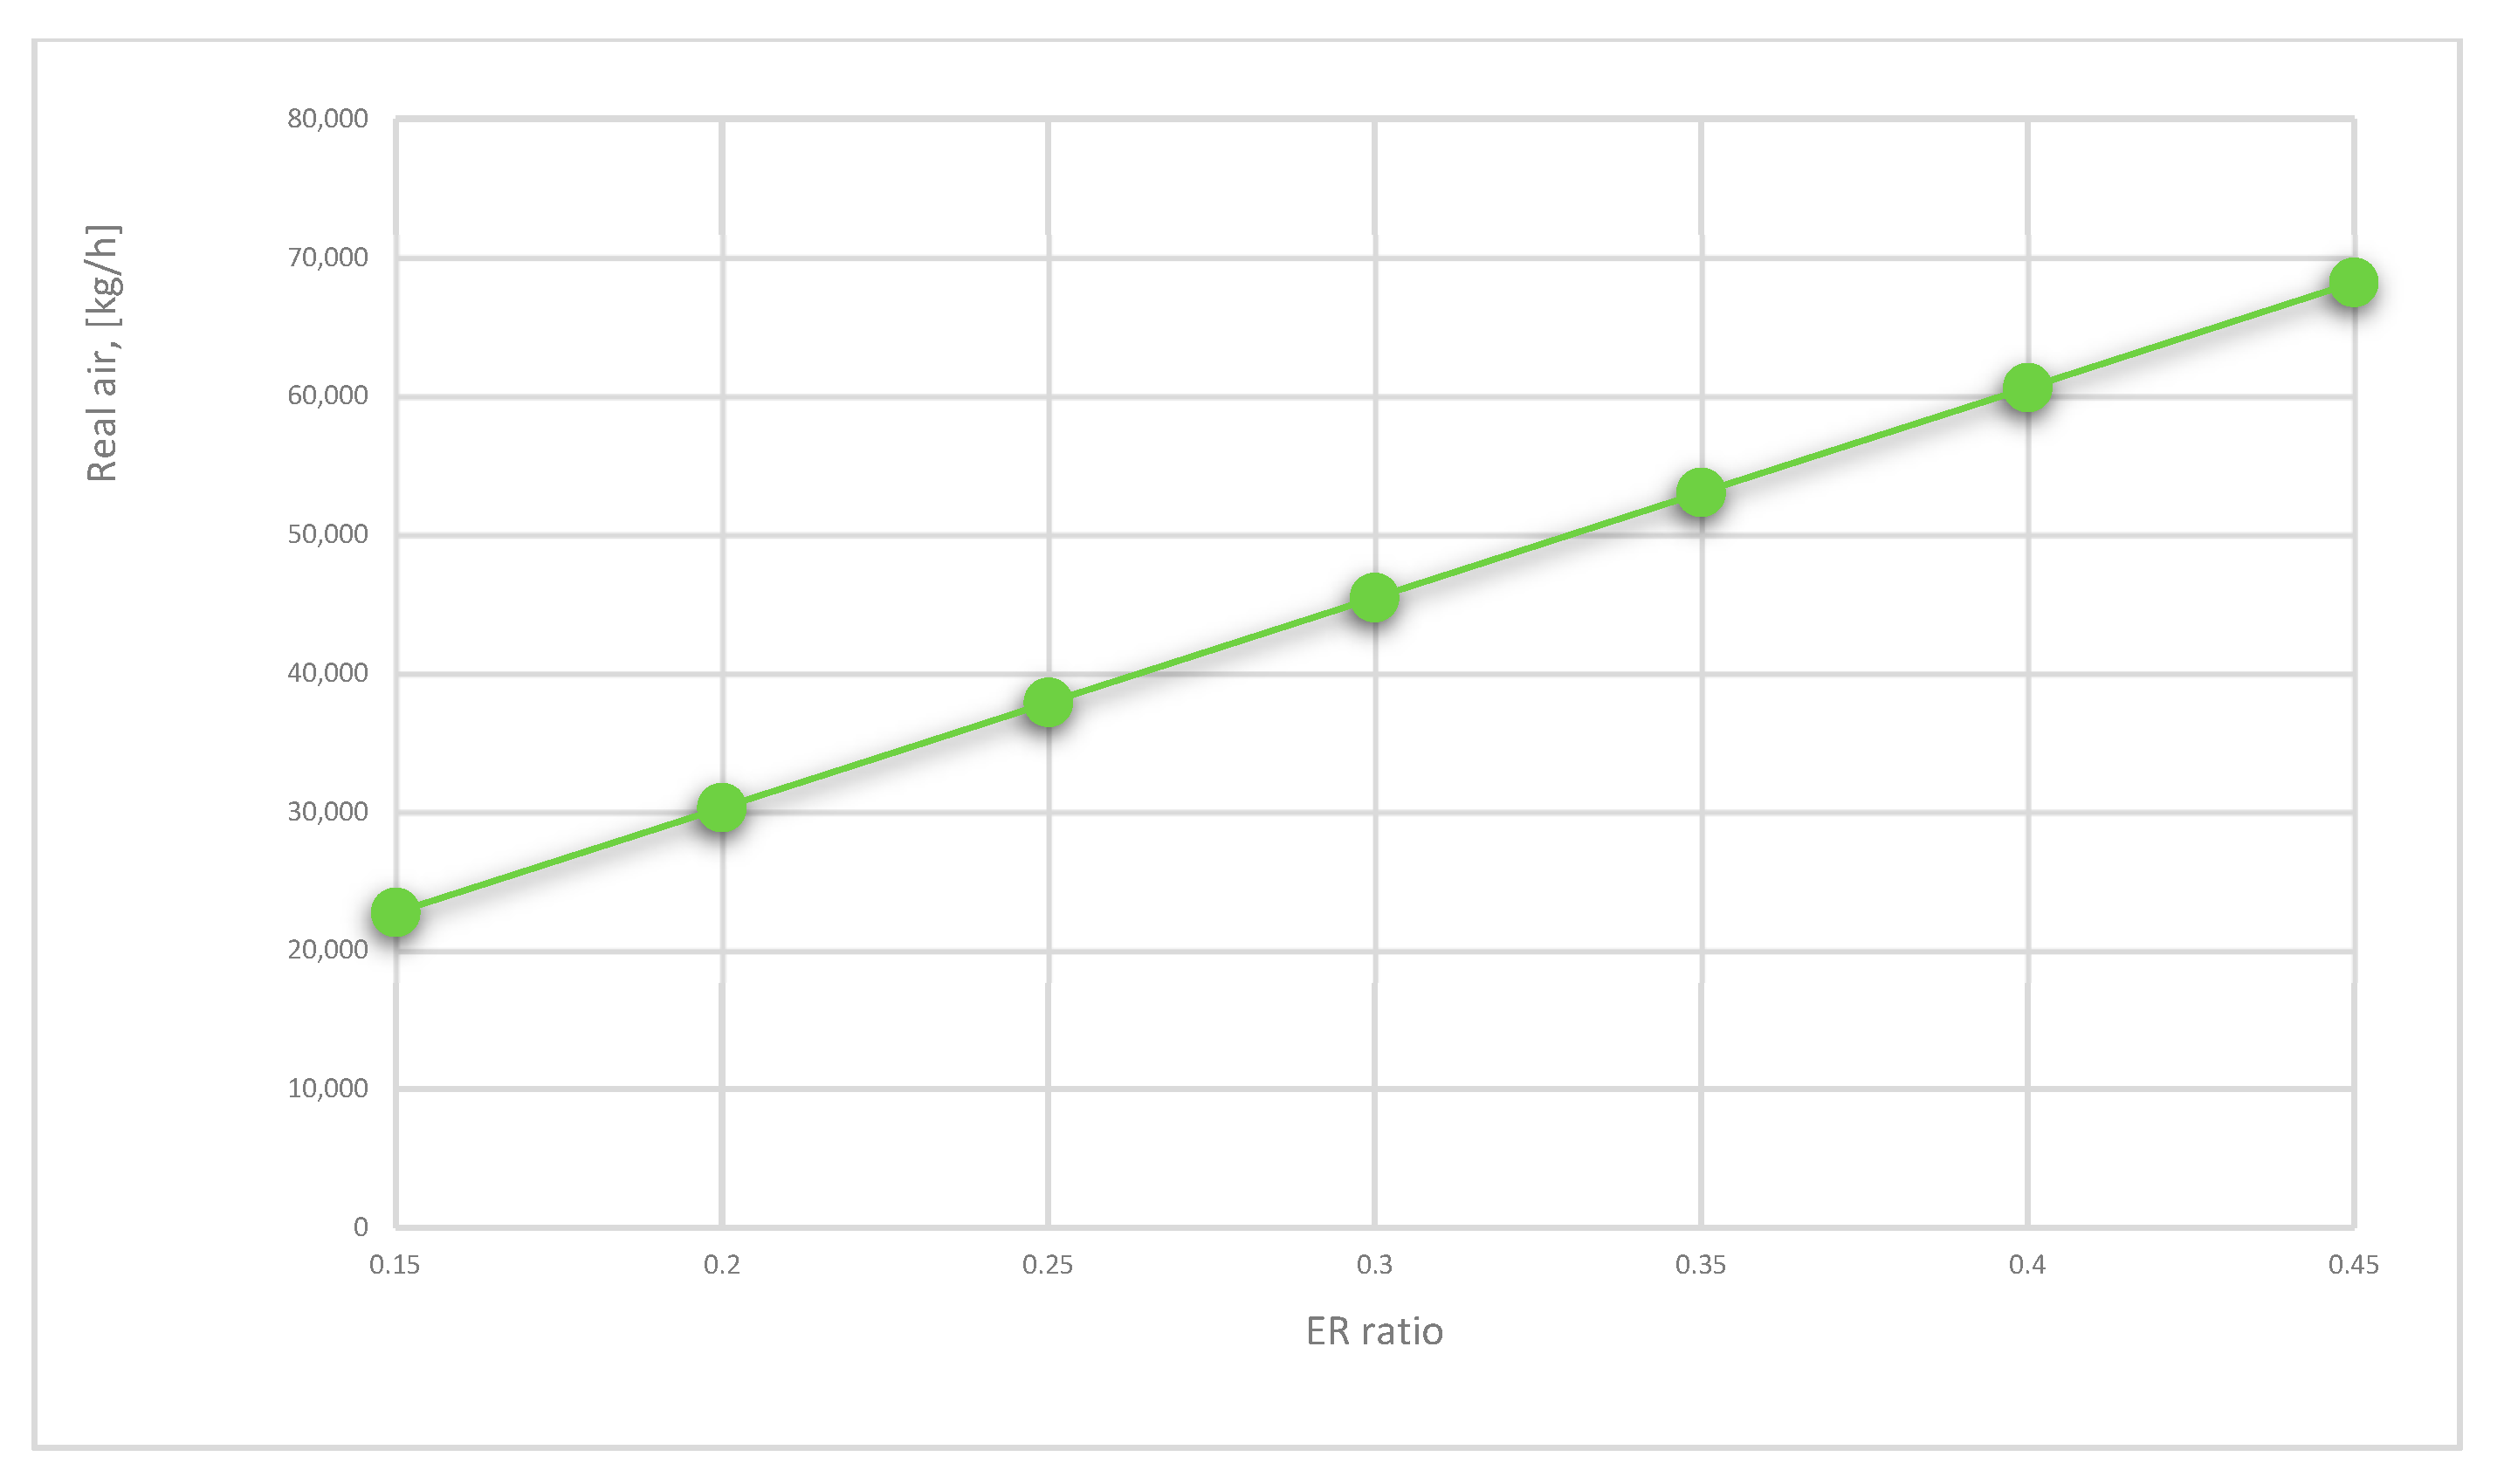
- Real air introduced in the gasifier shows the amount of equivalent ratio times the stoichiometric air introduced in the gasifier, and it is computed respecting the form [55]:
- -
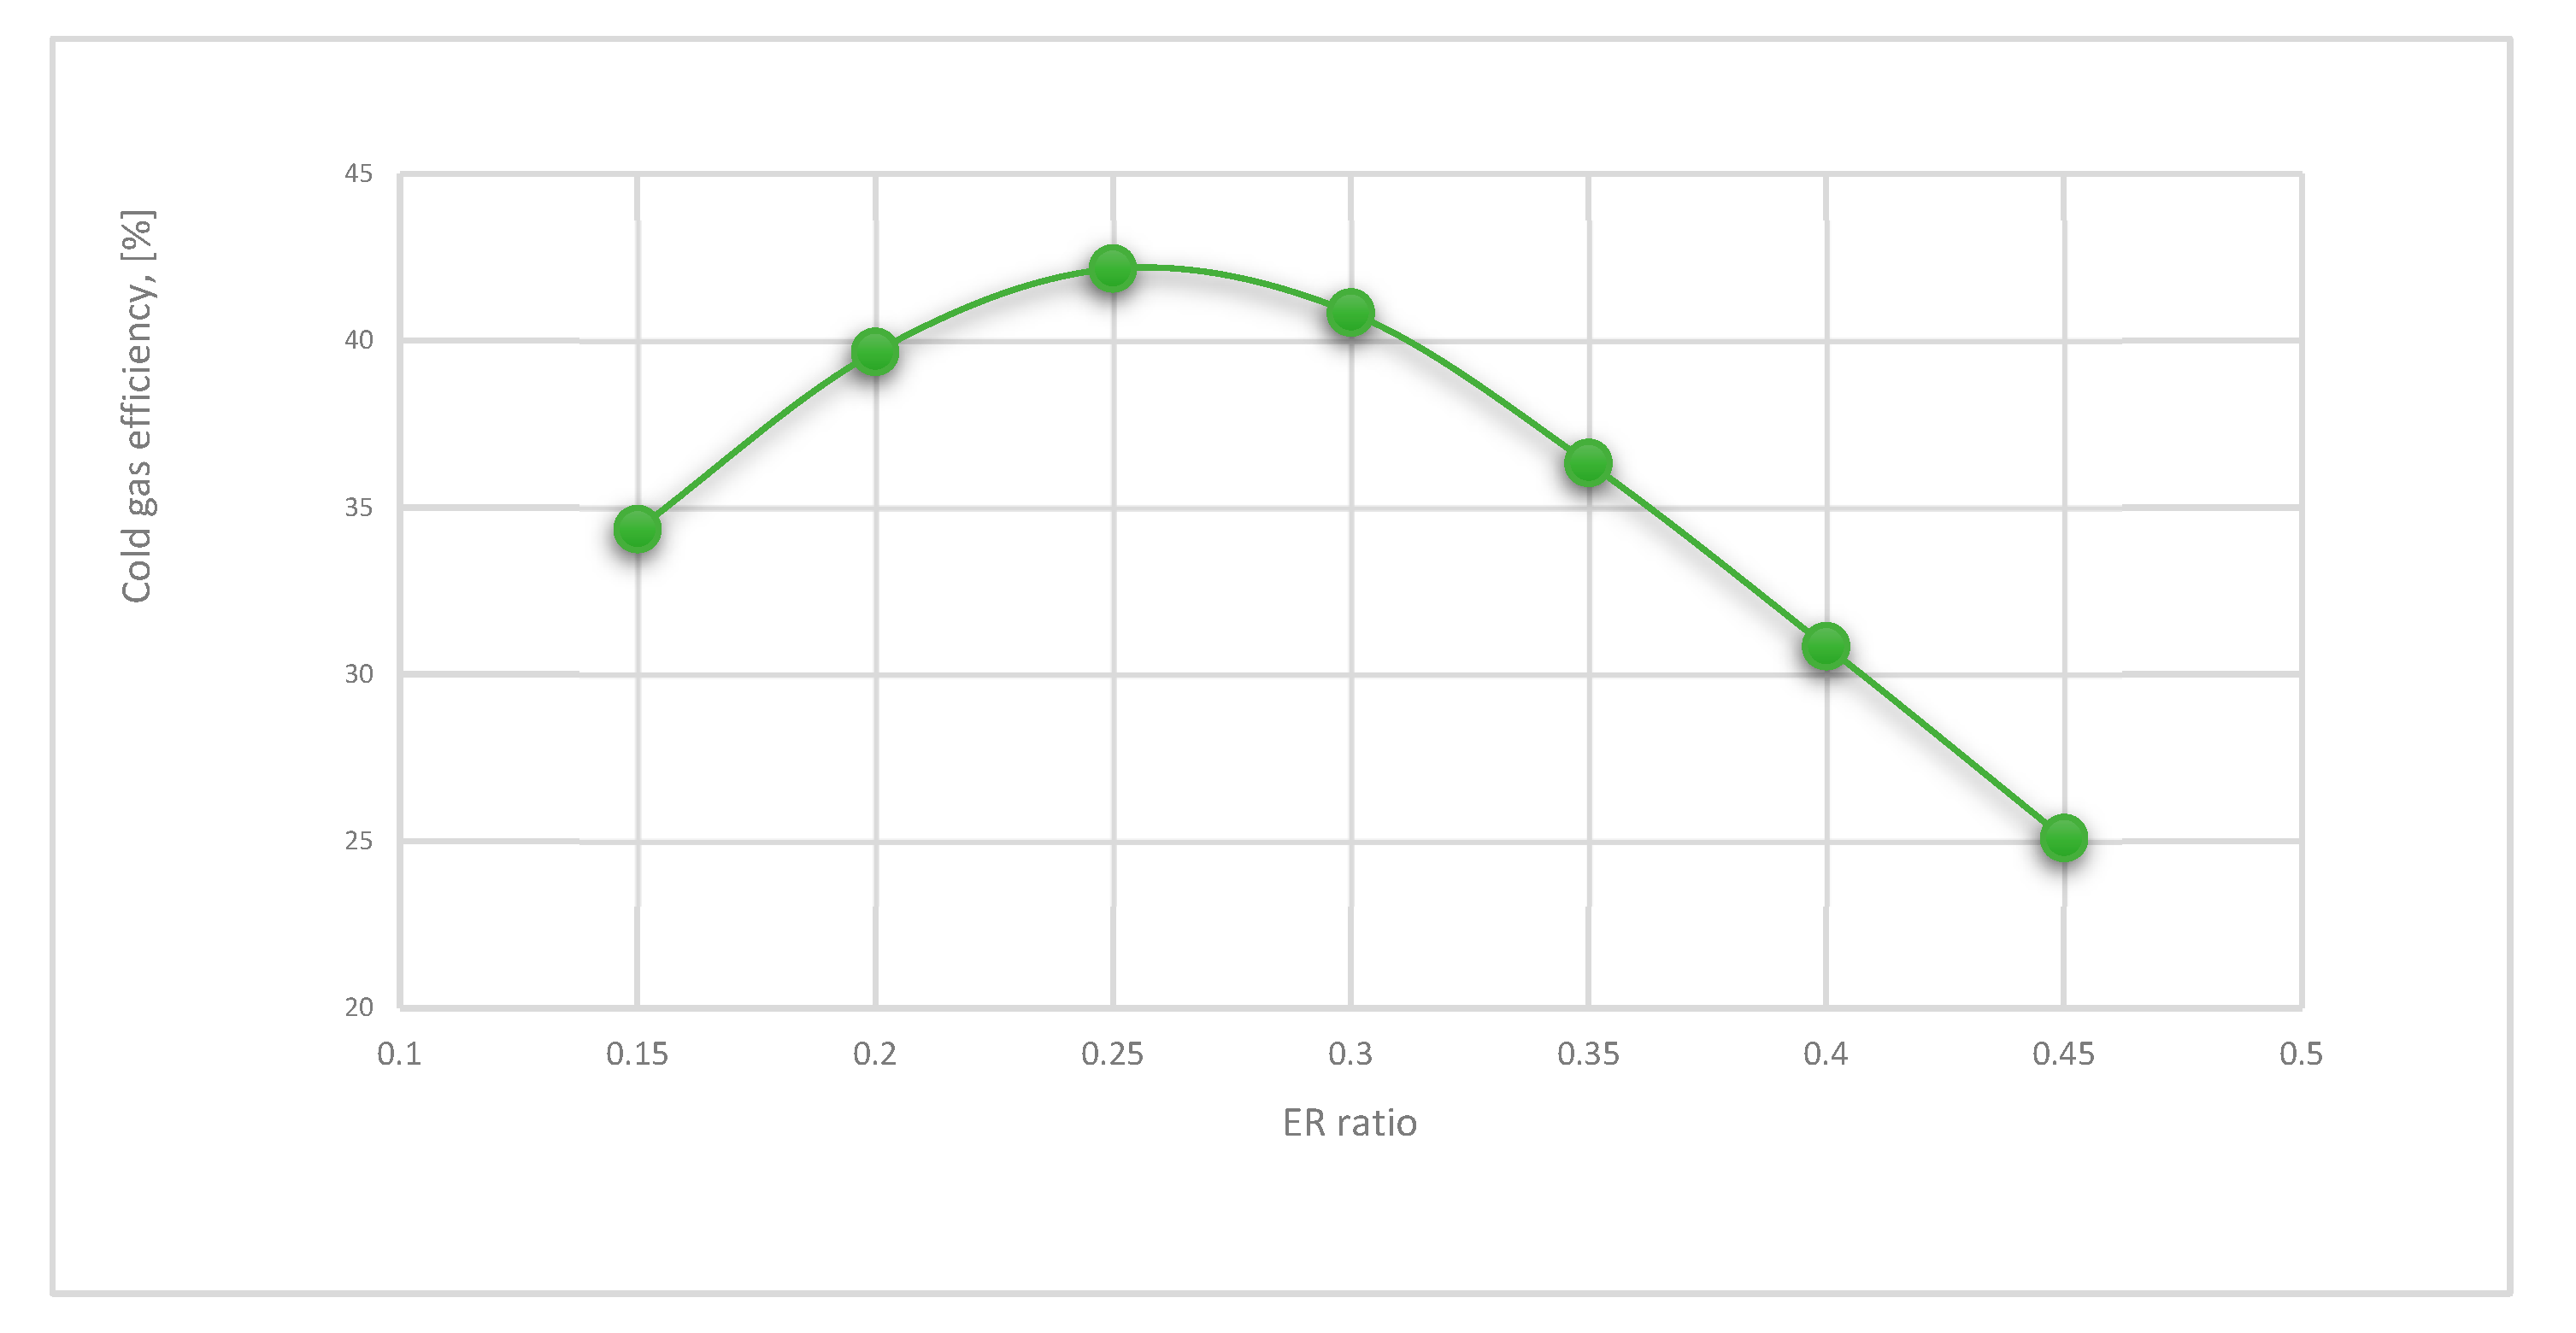
- Cold gas efficiency (CGE) represents the total gasification operation efficiency, which can be calculated as follows [55]:
- -
- Required power for the membrane process can be computed through the total electric energy consumed by the auxiliary membrane components.
- -
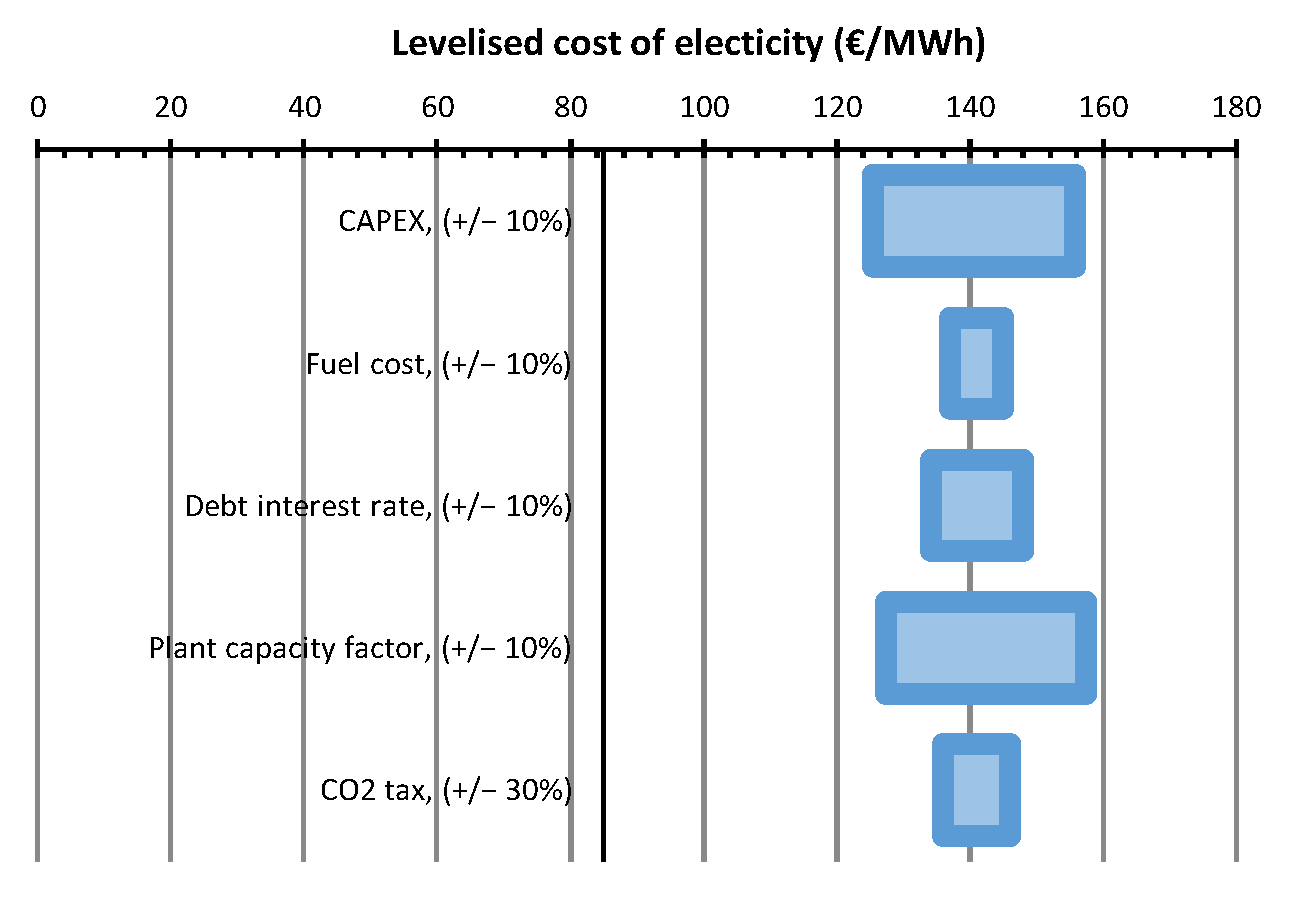
- Levelized cost of electricity (LCOE), in EUR/kWh, can be determined by Equation (4) below:
- -
- , utilized for the membrane process, in MJ/kg, can be calculated regarding the next formula [56]:
- -
- Carbon dioxide capture cost () can be defined as the ratio of the plant electricity price difference with and without membrane usage per amount of CO2 captured, in EUR/t, regarding the next formula:
- -
- On the other hand, carbon dioxide avoided cost () is determined basically through the electricity price difference divided by CO2 emissions variations with and without CO2 capture use, in EUR/t, and the following formula presents that ratio:
- -
- Net present value (), in EUR, was computed regarding the formula:
- the amount of money required for maintenance for one year;
- the value of a payback loan (if exists) for one year;
- the actual investment for one year;
- the rate of deduction.
- -
- Internal rate of return () was computed by respecting the next equation:
- -
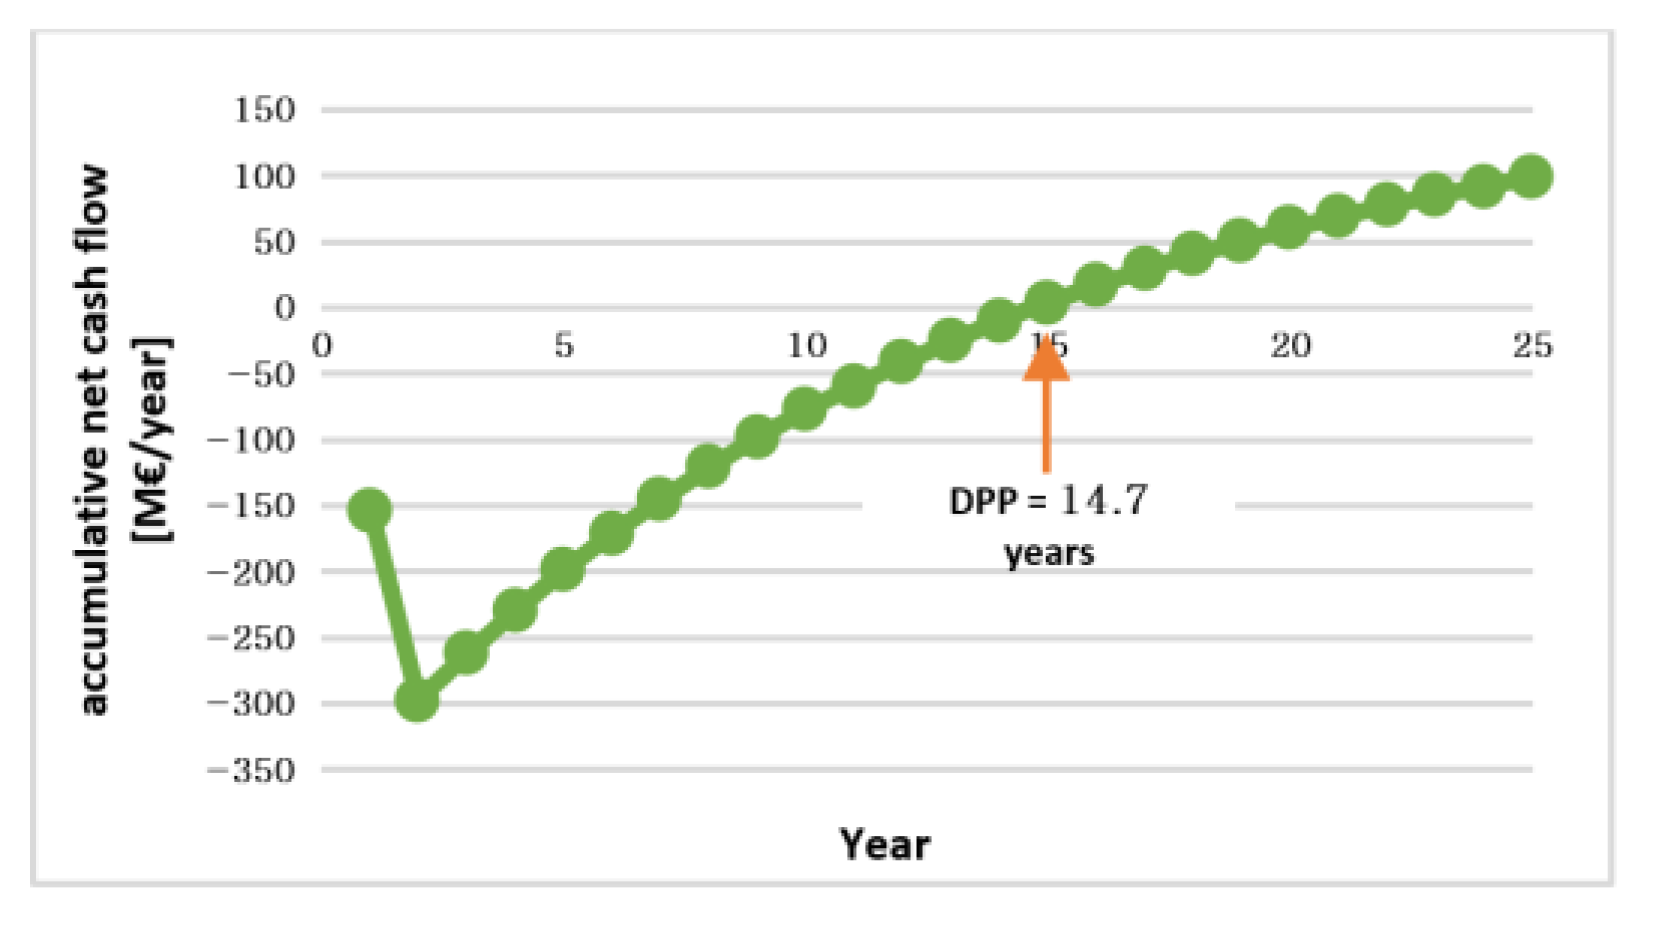
- Equation (10) represents the formula to calculate the Discount payback period (), in years:
- -
- For a decision on considering whether the project is financially well-planned, the profitability index () is determined as the ratio of summation and deduction of investment () per deduct investment as follows:
4. Results and Discussion
- The gasification process
- 2.
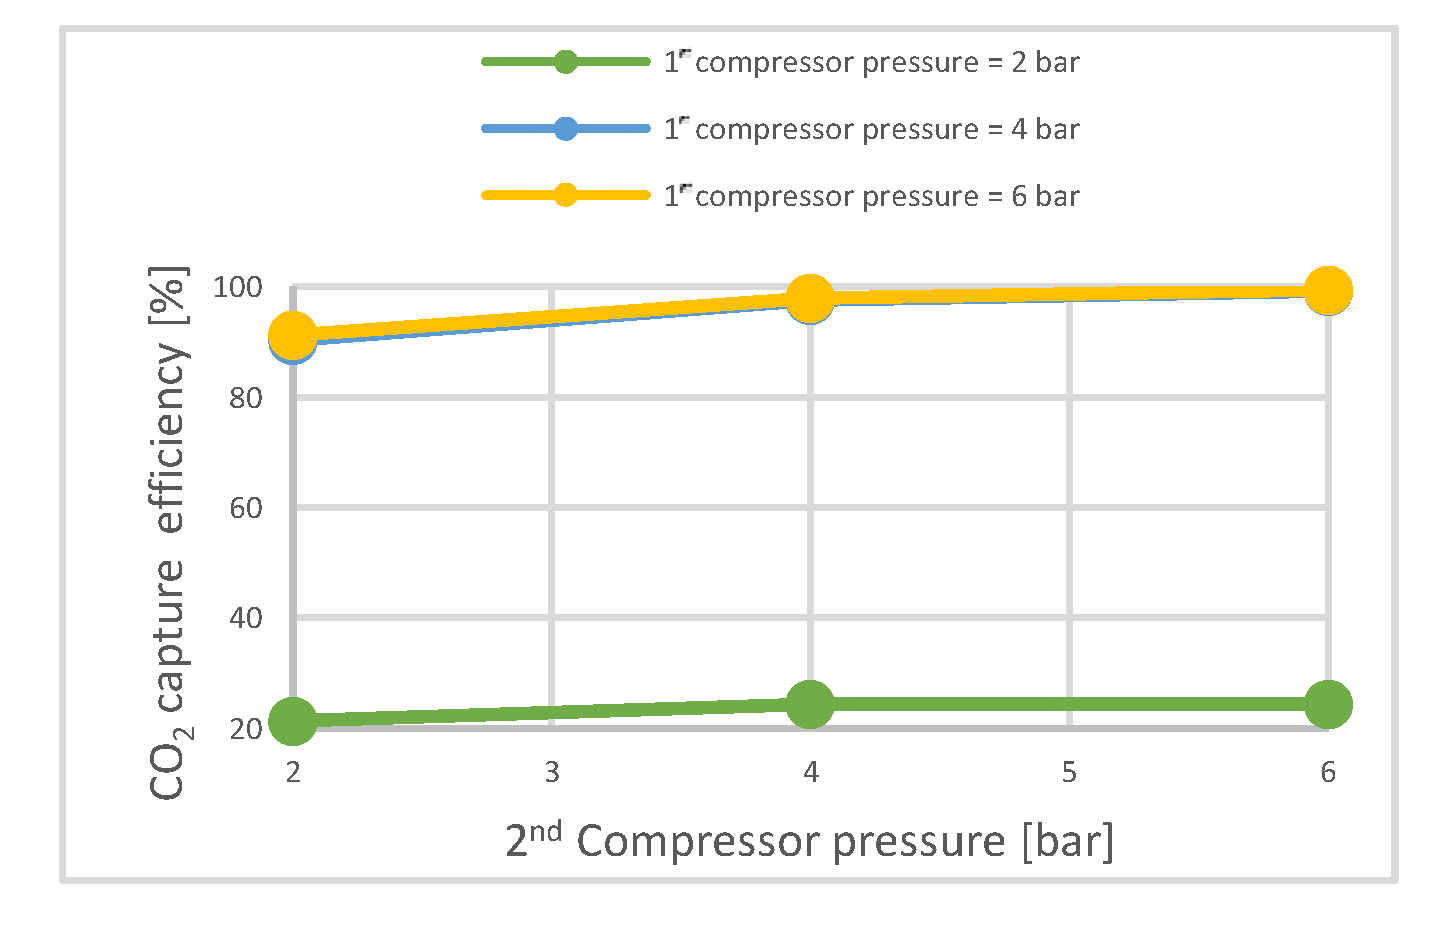
- The membrane CO2 capture process
5. Conclusions
Author Contributions
Funding
Institutional Review Board Statement
Informed Consent Statement
Data Availability Statement
Conflicts of Interest
Nomenclature
| BIGCC | Biomass Integrated Gasification Combined Cycle |
| HRSG | Heat Recovery Steam Generator |
| WGS | Water Gas Shift Reactor |
| CCS | Carbon Capture and Storage |
| ER | Equivalent Ratio |
| CGE | Cold Gas Efficiency |
| LHV | Lowest heating value |
| CP1 | 1st Compressor Pressure |
| CP2 | 2nd Compressor Pressure |
| CP3 | 3rd Compressor Pressure |
| Pax | Energy required for auxiliaries |
| MSA1 | First membrane Surface Area |
| LCOE | Levelized Cost of Electricity |
| Wnet | Net electric energy generation |
| ENo capture | CO2 emissions without CCS |
| Ewith capture | CO2 emissions with CCS |
| SPECCA | Specific primary energy consumption for CO2 avoided |
| CO2,CC | CO2 Capture Cost |
| CO2,AC | CO2 Avoided Cost |
| NPV | Net Present Value |
| INi | Actual bonus of the year i |
| Ci | Amount of money required for maintenance for a year |
| Ai | Value of a payback for a year |
| Ii | Actual investment for a year |
| r | Rate of deduction |
| IRR | Internal Rate of Return |
| DPP | Discount Payback Period |
| PI | Profitability Index |
References
- Gaye, A. Human development report, fighting climate change: Human solidarity in a divided world. In Access to Energy and Human Development 2007/2008; Springer: New York, NY, USA, 2008. [Google Scholar]
- IEA. World Energy Outlook; International Energy Agency: Paris, France, 2020.
- Slavu, N.; Badea, A.; Dinca, C. Technical and Economical Assessment of CO2 Capture-Based Ammonia Aqueous. Processes 2022, 10, 859. [Google Scholar] [CrossRef]
- Pérez-Rodríguez, C.P.; Ríos, L.A.; González, C.S.D.; Montaña, A.; García-Marroquín, C. Harnessing Residual Biomass as a Renewable Energy Source in Colombia: A Potential Gasification Scenario. Sustainability 2022, 14, 12537. [Google Scholar] [CrossRef]
- IEA. IEA Statistics 2011 Edition: CO2 Emissions from Fuel Combustion Highlights; International Energy Agency: Paris, France, 2011.
- Sima, S.; Racoviţă, R.C.; Dincă, C.; Feroiu, V.; Secuianu, C. Phase equilibria calculations for carbon dioxide+ 2-propanol system. UPB Sci. Bull. Ser. B 2017, 79, 11–24. [Google Scholar]
- Alabid, M.; Cormos, C.-C.; Dinca, C. Critical Assessment of Membrane Technology Integration in a Coal-Fired Power Plant. Membranes 2022, 12, 904. [Google Scholar] [CrossRef] [PubMed]
- Peng, Y.; Zhao, B.; Li, L. Advance in post-combustion CO2 capture with alkaline solution: A brief review. Energy Procedia 2012, 14, 1515–1522. [Google Scholar] [CrossRef] [Green Version]
- Kheirinik, M.; Ahmed, S.; Rahmanian, N. Comparative techno-economic analysis of carbon capture processes: Pre-combustion, post-combustion, and oxy-fuel combustion operations. Sustainability 2021, 13, 13567. [Google Scholar] [CrossRef]
- Scheffknecht, G.; Al-Makhadmeh, L.; Schnell, U.; Maier, J. Oxy-fuel coal combustion—A review of the current state-of-the-art. Int. J. Greenh. Gas Control. 2011, 5, S16–S35. [Google Scholar] [CrossRef]
- Pérez-Fortes, M.; Bocin-Dumitriu, A.; Tzimas, E. CO2 utilization pathways: Techno-economic assessment and market opportunities. Energy Procedia 2014, 63, 7968–7975. [Google Scholar] [CrossRef]
- Cormos, C.-C.; Dinca, C. Techno-economic and environmental implications of decarbonization process applied for Romanian fossil-based power generation sector. Energy 2021, 220, 119734. [Google Scholar] [CrossRef]
- Cormos, C.-C.; Petrescu, L.; Cormos, A.-M.; Dinca, C. Assessment of Hybrid Solvent—Membrane Configurations for Post-Combustion CO2 Capture for Super-Critical Power Plants. Energies 2021, 14, 5017. [Google Scholar] [CrossRef]
- Tramošljika, B.; Blecich, P.; Bonefačić, I.; Glažar, V. Advanced ultra-supercritical coal-fired power plant with post-combustion carbon capture: Analysis of electricity penalty and CO2 emission reduction. Sustainability 2021, 13, 801. [Google Scholar] [CrossRef]
- Pascu, A.; Stoica, L.; Dinca, C.; Badea, A. The package type influence on the performance of the CO2 capture process by chemical absorption. UPB Sci. Bull. Ser. C 2016, 78, 259–270. [Google Scholar]
- Chang, P.T.; Ng, Q.H.; Ahmad, A.L.; Low, S.C. A critical review on the techno-economic analysis of membrane gas absorption for CO2 capture. Chem. Eng. Commun. 2022, 209, 1553–1569. [Google Scholar] [CrossRef]
- Jang, M.-G.; Yun, S.; Kim, J.-K. Process design and economic analysis of membrane-integrated absorption processes for CO2 capture. J. Clean. Prod. 2022, 368, 133180. [Google Scholar] [CrossRef]
- He, X.; Hägg, M.-B. Energy efficient process for CO2 capture from flue gas with novel fixed-site-carrier membranes. Energy Procedia 2014, 63, 174–185. [Google Scholar] [CrossRef] [Green Version]
- Badea, A.A.; Vodă, I.; Dincă, C.F. Comparative analysis of coal, natural gas and nuclear fuel life cycles by chains of electrical energy production. Nat. Gas 2010, 9, 9–95. [Google Scholar]
- Yang, D.; Wang, Z.; Wang, J.; Wang, S. Potential of two-stage membrane system with recycle stream for CO2 capture from postcombustion gas. Energy Fuels 2009, 23, 4755–4762. [Google Scholar] [CrossRef]
- Brunetti, A.; Scura, F.; Barbieri, G.; Drioli, E. Membrane technologies for CO2 separation. J. Membr. Sci. 2010, 359, 115–125. [Google Scholar] [CrossRef]
- Zhang, X.; He, X.; Gundersen, T. Post-combustion carbon capture with a gas separation membrane: Parametric study, capture cost, and exergy analysis. Energy Fuels 2013, 27, 4137–4149. [Google Scholar] [CrossRef]
- Korberg, A.D.; Mathiesen, B.V.; Clausen, L.R.; Skov, I.R. The role of biomass gasification in low-carbon energy and transport systems. Smart Energy 2021, 1, 100006. [Google Scholar] [CrossRef]
- Oreggioni, G.D.; Friedrich, D.; Brandani, S.; Ahn, H. Techno-economic study of adsorption processes for pre-combustion carbon capture at a biomass CHP plant. Energy Procedia 2014, 63, 6738–6744. [Google Scholar] [CrossRef] [Green Version]
- Tezer, Ö.; Karabağ, N.; Öngen, A.; Çolpan, C.Ö.; Ayol, A. Biomass gasification for sustainable energy production: A review. Int. J. Hydrogen Energy 2022, 47, 15419–15433. [Google Scholar] [CrossRef]
- Cormos, A.-M.; Dinca, C.; Petrescu, L.; Chisalita, D.A.; Szima, S.; Cormos, C.-C. Carbon capture and utilisation technologies applied to energy conversion systems and other energy-intensive industrial applications. Fuel 2018, 211, 883–890. [Google Scholar] [CrossRef]
- Rhodes, J.S.; Keith, D.W. Engineering economic analysis of biomass IGCC with carbon capture and storage. Biomass Bioenergy 2005, 29, 440–450. [Google Scholar] [CrossRef]
- PaláSingh, A. Sorption isotherms of methane, ethane, ethene and carbon dioxide on NaX, NaY and Na-mordenite zeolites. J. Chem. Soc. Faraday Trans. 1995, 91, 2935–2944. [Google Scholar]
- Olabi, A.; Obaideen, K.; Elsaid, K.; Wilberforce, T.; Sayed, E.T.; Maghrabie, H.M.; Abdelkareem, M.A. Assessment of the pre-combustion carbon capture contribution into sustainable development goals SDGs using novel indicators. Renew. Sustain. Energy Rev. 2022, 153, 111710. [Google Scholar] [CrossRef]
- Madejski, P.; Chmiel, K.; Subramanian, N.; Kuś, T. Methods and techniques for CO2 capture: Review of potential solutions and applications in modern energy technologies. Energies 2022, 15, 887. [Google Scholar] [CrossRef]
- Padurean, A.; Cormos, C.-C.; Agachi, P.-S. Pre-combustion carbon dioxide capture by gas–liquid absorption for Integrated Gasification Combined Cycle power plants. Int. J. Greenh. Gas Control. 2012, 7, 1–11. [Google Scholar] [CrossRef]
- del Pozo, C.A.; Cloete, S.; Álvaro, Á.J. Carbon-negative hydrogen: Exploring the techno-economic potential of biomass co-gasification with CO2 capture. Energy Convers. Manag. 2021, 247, 114712. [Google Scholar] [CrossRef]
- U.S. Department of Energy National Energy Technology Laboratory. Current World Wide Synthesis Gas Production. Available online: http://www.netl.doe.gov/research/coal/energy-systems/gasification/gasification-plant-databases/current-world (accessed on 8 October 2022).
- Abdoulmoumine, N.; Adhikari, S.; Kulkarni, A.; Chattanathan, S. A review on biomass gasification syngas cleanup. Appl. Energy 2015, 155, 294–307. [Google Scholar] [CrossRef]
- Molino, A.; Chianese, S.; Musmarra, D. Biomass gasification technology: The state of the art overview. J. Energy Chem. 2016, 25, 10–25. [Google Scholar] [CrossRef]
- De Filippis, P.; Scarsella, M.; De Caprariis, B.; Uccellari, R. Biomass gasification plant and syngas clean-up system. Energy Procedia 2015, 75, 240–245. [Google Scholar] [CrossRef] [Green Version]
- Peres, A.P.; Lunelli, B.H.; Maciel FIlho, R. Application of biomass to hydrogen and syngas production. Chem. Eng. Trans. 2013, 32, 589–594. [Google Scholar]
- Miles, T.R.; Miles, T.R., Jr.; Baxter, L.L.; Bryers, R.W.; Jenkins, B.M.; Oden, L.L. Alkali deposits found in biomass power plants: A preliminary investigation of their extent and nature. Volume 1. National Renewable Energy Lab.(NREL), Golden, CO (United States); Miles (Thomas R.), Portland, OR (United States); Sandia National Lab.(SNL-CA), Livermore, CA (United States); Foster Wheeler Development Corp., Livingston, NJ (United States); California Univ., Davis, CA (United States); Bureau of Mines, Albany, OR (United States). Albany Research Center; April 15. 1995. Available online: https://www.osti.gov/biblio/251288 (accessed on 1 December 2022).
- Qian, K.; Kumar, A.; Patil, K.N.; Bellmer, D.D.; Wang, D.; Yuan, W.; Huhnke, R.L. Effects of biomass feedstocks and gasification conditions on the physiochemical properties of char. Energies 2013, 6, 3972–3986. [Google Scholar] [CrossRef]
- Abdolahi-Mansoorkhani, H.; Seddighi, S. CO2 capture by modified hollow fiber membrane contactor: Numerical study on membrane structure and membrane wettability. Fuel Process. Technol. 2020, 209, 106530. [Google Scholar] [CrossRef]
- Dindore, V.; Brilman, D.; Versteeg, G. Modelling of cross-flow membrane contactors: Mass transfer with chemical reactions. J. Membr. Sci. 2005, 255, 275–289. [Google Scholar] [CrossRef] [Green Version]
- Wijmans, J.G.; Baker, R.W. The solution-diffusion model: A review. J. Membr. Sci. 1995, 107, 1–21. [Google Scholar] [CrossRef]
- Nakhjiri, A.T.; Heydarinasab, A.; Bakhtiari, O.; Mohammadi, T. Experimental investigation and mathematical modeling of CO2 sequestration from CO2/CH4 gaseous mixture using MEA and TEA aqueous absorbents through polypropylene hollow fiber membrane contactor. J. Membr. Sci. 2018, 565, 1–3. [Google Scholar] [CrossRef]
- Sandru, M.; Haukebø, S.H.; Hägg, M.-B. Composite hollow fiber membranes for CO2 capture. J. Membr. Sci. 2010, 346, 172–186. [Google Scholar] [CrossRef]
- Freeman, B.; Hao, P.; Baker, R.; Kniep, J.; Chen, E.; Ding, J.; Zhang, Y.; Rochelle, G.T. Hybrid membrane-absorption CO2 capture process. Energy Procedia 2014, 63, 605–613. [Google Scholar] [CrossRef] [Green Version]
- Ji, G.; Zhao, M. Membrane separation technology in carbon capture. In Recent Advances in Carbon Capture and Storage; InTech Janeza Trdine 9: Rijeca, Croatia, 2017; pp. 59–90. [Google Scholar]
- Vega, F.; Baena-Moreno, F.; Fernández, L.M.G.; Portillo, E.; Navarrete, B.; Zhang, Z. Current status of CO2 chemical absorption research applied to CCS: Towards full deployment at industrial scale. Appl. Energy 2020, 260, 114313. [Google Scholar] [CrossRef]
- Chen, Y.; Wang, B.; Zhao, L.; Dutta, P.; Ho, W.W. New Pebax®/zeolite Y composite membranes for CO2 capture from flue gas. J. Membr. Sci. 2015, 495, 415–423. [Google Scholar] [CrossRef] [Green Version]
- Khojasteh-Salkuyeh, Y.; Ashrafi, O.; Mostafavi, E.; Navarri, P. CO2 utilization for methanol production; Part I: Process design and life cycle GHG assessment of different pathways. J. CO2 Util. 2021, 50, 101608. [Google Scholar] [CrossRef]
- Zhang, M.; Deng, L.; Xiang, D.; Cao, B.; Hosseini, S.S.; Li, P. Approaches to suppress CO2-induced plasticization of polyimide membranes in gas separation applications. Processes 2019, 7, 51. [Google Scholar] [CrossRef] [Green Version]
- Mohd Pauzi, M.M.; Azmi, N.; Lau, K.K. Emerging Solvent Regeneration Technologies for CO2 Capture through Offshore Natural Gas Purification Processes. Sustainability 2022, 14, 4350. [Google Scholar] [CrossRef]
- Han, Y.; Yang, Y.; Ho, W.S. Recent progress in the engineering of polymeric membranes for CO2 capture from flue gas. Membranes 2020, 10, 365. [Google Scholar] [CrossRef]
- Sandru, M.; Sandru, E.M.; Ingram, W.F.; Deng, J.; Stenstad, P.M.; Deng, L.; Spontak, R.J. An integrated materials approach to ultrapermeable and ultraselective CO2 polymer membranes. Science 2022, 376, 90–94. [Google Scholar] [CrossRef]
- Wu, F.; Dellenback, P.A.; Fan, M. Highly efficient and stable calcium looping based pre-combustion CO2 capture for high-purity H2 production. Mater. Today Energy 2019, 13, 233–238. [Google Scholar] [CrossRef]
- Dinca, C.; Badea, A.-A.; Apostol, T.; Lazaroiu, G. GHG emissions evaluation from fossil fuel with CCS. Environ. Eng. Manag. J. 2009, 8, 81–89. [Google Scholar] [CrossRef]
- Astolfi, M.; De Lena, E.; Romano, M.C. Improved flexibility and economics of Calcium Looping power plants by thermochemical energy storage. Int. J. Greenh. Gas Control 2019, 83, 140–155. [Google Scholar] [CrossRef]
- Chemengonline. 2022. Available online: https://www.chemengonline.com/pci-home (accessed on 1 June 2022).
- Anantharaman, R.; Bolland, O.; Booth, N.; van Dorst, E.; Fernandez, E.S.; Franco, F.; Macchi, E.; Manzolini, G.; Nikolic, D.; Pfeffer, A. Cesar Deliverable D2. 4.3. European Best Practice Guidelines for Assessment of CO2 Capture Technologies. Energy 2018. [CrossRef]
- Trading Economics. Available online: https://tradingeconomics.com/commodity/carbon (accessed on 12 October 2022).
- Van Der Sluijs, J.P.; Hendriks, C.A.; Blok, K. Feasibility of polymer membranes for carbon dioxide recovery from flue gases. Energy Convers. Manag. 1992, 33, 429–436. [Google Scholar] [CrossRef]
- He, X.; Hägg, M.-B. Hollow fiber carbon membranes: From material to application. Chem. Eng. J. 2013, 215, 440–448. [Google Scholar] [CrossRef]


| Biomass Waste Component | Value (%) |
|---|---|
| Carbon | 49.21 |
| Oxygen | 41.81 |
| Hydrogen | 6.61 |
| Ash | 1.4 |
| Nitrogen | 0.89 |
| Sulfur | 0.08 |
| LHV | 18,939.1 kJ/kg |
| Component | Unit | Value |
|---|---|---|
| N2 | %mole | 43.66 |
| H2 | %mole | 30.73 |
| CO2 | %mole | 23.03 |
| CO | %mole | 2.58 |
| Syngas flow | kmol/h | 3109 (ER = 25%) |
| LHV | kJ/kg | 3441 |
| Temperature | °C | 40 |
| Pressure | bar | 1.013 |
| Parameter | Unit | Value |
|---|---|---|
| Membrane type | - | Spiral wound |
| Flow pattern | - | Counter-current |
| CO2 permeability | GPU | 1000 |
| N2 permeability | GPU | 20 |
| CO2/N2 selectivity | - | 50 |
| Efficiency of compressors | % | 90 |
| Efficiency of pumps | % | 90 |
| Water pumps pressure | bar | 3 |
| Heat exchanger temperature out (All) | °C | 50 |
| First compressor pressure (CP1) | bar | 2–6 |
| First membrane surface area (MSA1) | m2 | 400,000–1,200,000 |
| Second compressor pressure (CP2) | bar | 2–6 |
| Second membrane surface area | m2 | 80,000 |
| Third compressor pressure (CP3) | bar | 2–6 |
| Third membrane surface area | m2 | 23,000 |
| Power plant main parameters The temperature of super-critical vapor The pressure of super-critical vapor LHV of the steam The net efficiency of the power plant (LHV biomass) | °C bar kJ/kg % | 585 290 17,139 29.8 |
| Item | Unit | Value |
|---|---|---|
| Project lifetime | years | 25 |
| Price of electric energy | EUR/MWh | 160 [57] |
| The price of gas turbine | MEUR | 93 [57] |
| The price of steam turbine | MEUR | 52 [58] |
| The price of Condenser | MEUR | 39 [58] |
| The price of HRSG | MEUR | 34 [58] |
| The price of Gasification unit | MEUR | 162 [58] |
| The reactor of water–gas shift | MEUR | 21.12 [58] |
| The price of separator | MEUR | 58 [58] |
| The price of ash treatment | MEUR | 16 [58] |
| CO2 emissions fees | EUR /t | 66 [59] |
| Period of working | hour/year | 75% of 8760 |
| Indicator of Availability | % | 85 [58] |
| Rate of deduct | % | 8 [12] |
| Membrane process | ||
| Membrane unit particular price | EUR/m2 | 50 [58] |
| The lifetime of membrane modules | years | 5 [52] |
| The price of pumps | EUR/kW | 1350 [58] |
| The price of compressors | EUR/kW | 1800 [58] |
| The price of a membrane alteration | EUR/m2 | 10 [7] |
| Employments payment | EUR/hour | 15 [58] |
| Carbon dioxide compression stage | ||
| The price of CO2 compressor unit | MEUR | 11.7 [58] |
| The price of cooling compressors | MEUR | 0.87 [58] |
| First Membrane Area | m2 | 400,000 | 800,000 | 1,200,000 | ||||||
|---|---|---|---|---|---|---|---|---|---|---|
| First compressor pressure | bar | 2 | 4 | 6 | 2 | 4 | 6 | 2 | 4 | 6 |
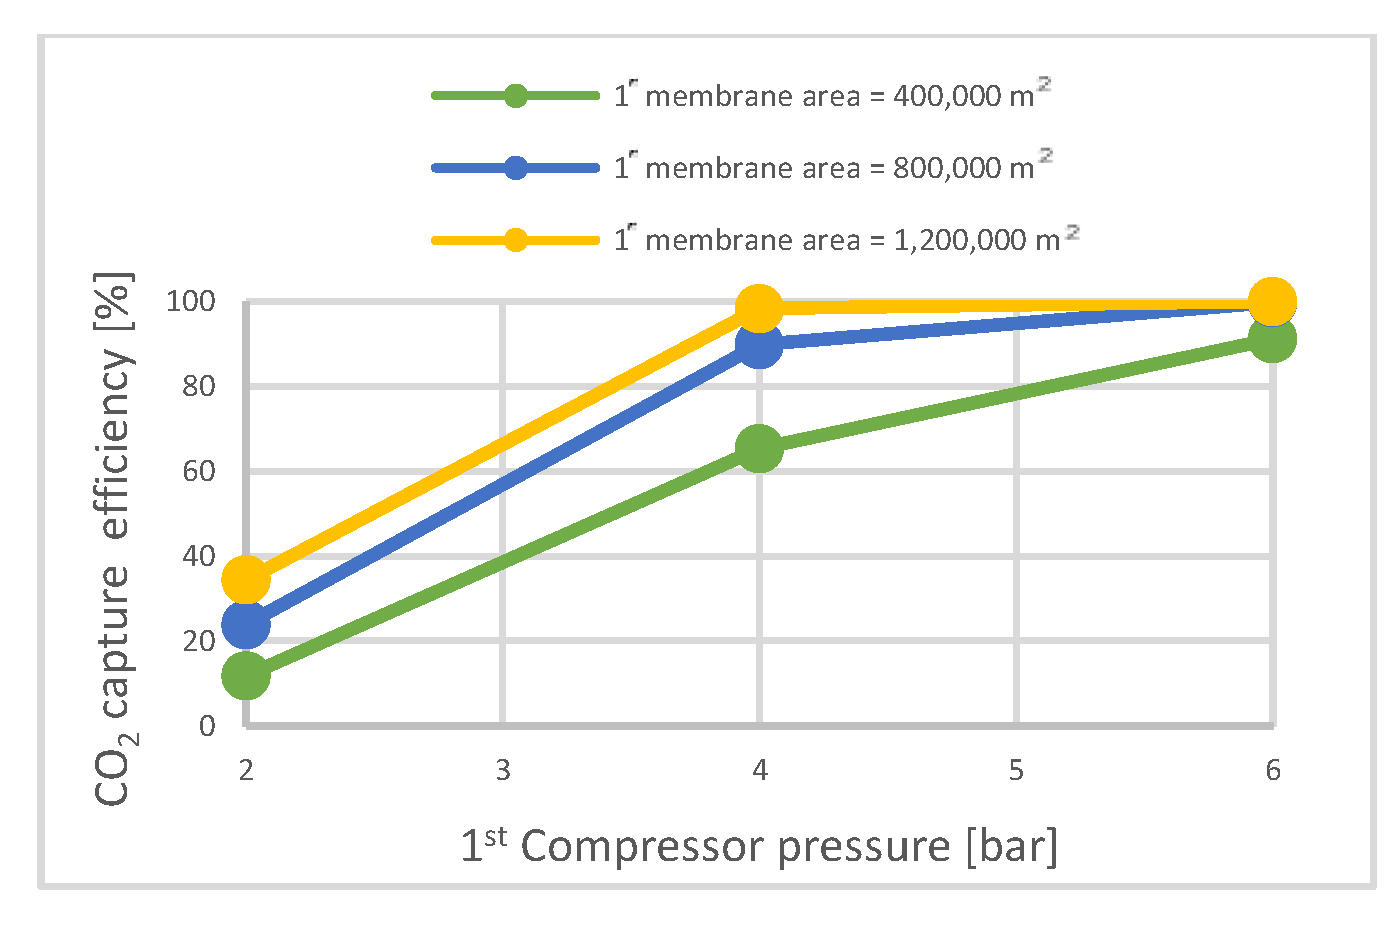
| CO2 capture rate | % | 12.1 | 88.7 | 89.7 | 21.3 | 90.3 | 90.15 | 28.4 | 90.3 | 90.6 |
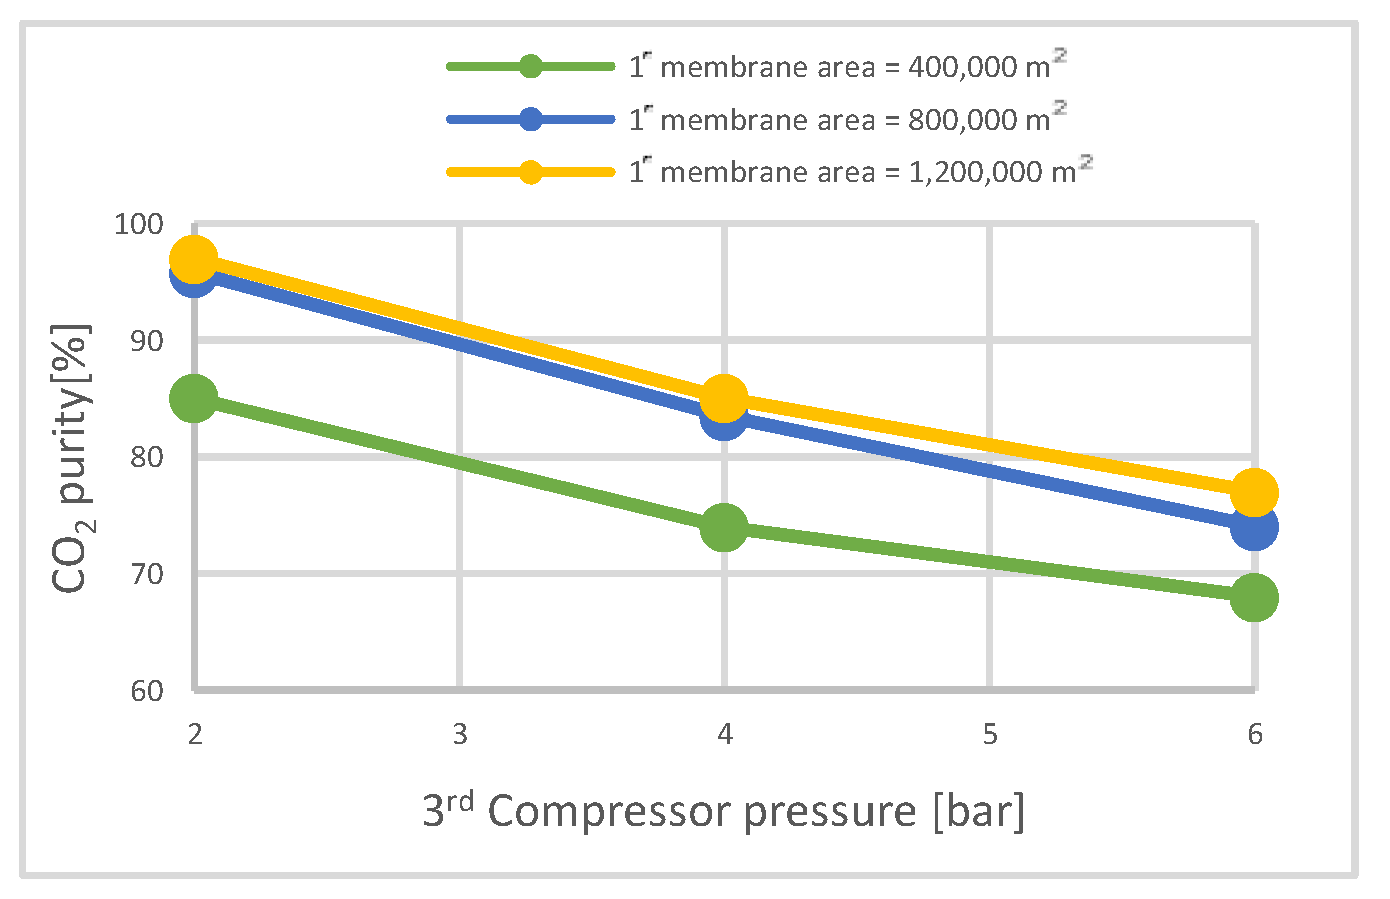
| CO2 purity | % | 68.7 | 95.7 | 95.7 | 79.9 | 95.8 | 95.7 | 84.5 | 95.8 | 95.7 |
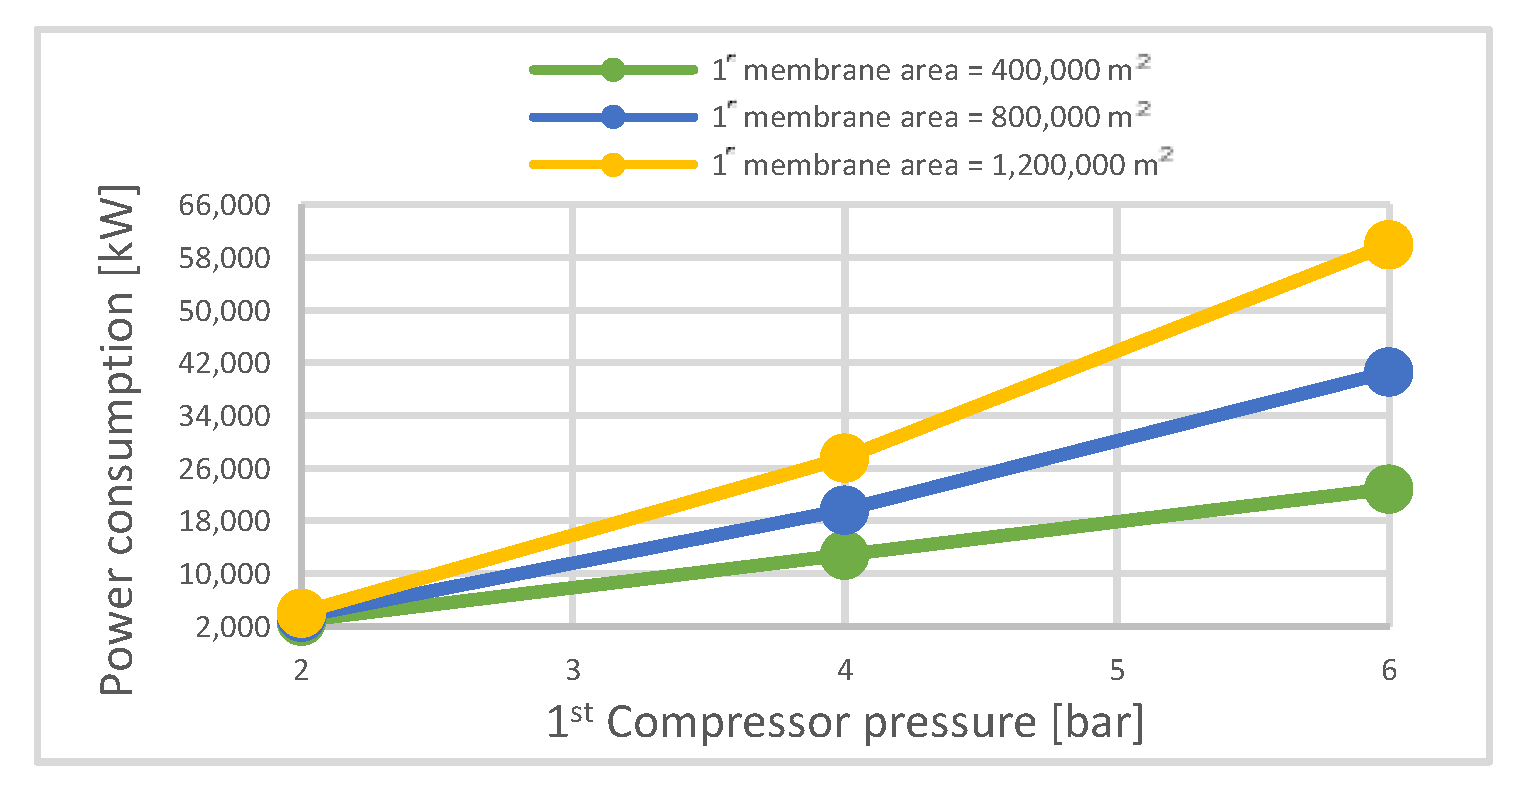
| Electrical energy needed | MW | 2.9 | 12.9 | 22.9 | 3.5 | 19.7 | 40.66 | 4.1 | 27.6 | 60 |
| CO2 recovered/ membrane surface | kg/m2·h | 0.009 | 0.07 | 0.07 | 0.008 | 0.035 | 0.035 | 0.007 | 0.022 | 0.023 |
| Parameter | Unit | BIGCC Single | BIGCC with Membrane |
|---|---|---|---|
| Introduced biomass | t/h | 31.86 | 31.86 |
| Global efficiency (LHV syngas) | % | 62.20 | 37.60 |
| Global efficiency (LHV biomass) | % | 29.80 | 18.04 |
| Net power produced | kW | 50,000 | 30,245 |
| CO2 recovery factor | kg/MWh | 0.00 | −822.63 |
| CO2 recovered | kg/MWh | n.a. | 939.11 |
| Electricity needed for membrane process | kWe | n.a. | 19,700 |
| Membrane power consumption | kWh/tCO2 | n.a. | 694 |
| LCOE_rate | EUR/kWh | 0.0974 | 0.1410 |
| SPECCA | MJth/kg | n.a. | 4.60 |
| SEPCCA | MJel/kg | n.a. | 2.86 |
| CO2 avoided price | EUR/t | n.a. | 52.94 |
| CO2 captured price | EUR/t | n.a. | 46.37 |
| Indicator | Unit | Value |
|---|---|---|
| NPV | MEUR | 98.32 |
| IRR | % | 11.6 |
| DPP | year | 14.7 |
| PI | - | 1.32 |
| Parameters | Optimum Results for the Current Study | Research from Literatures | ||
|---|---|---|---|---|
| [22] | [60] | [61] | ||
| Number of stages | 3 | 2 | 2 | 2 |
| CO2 capture efficiency, [%] | 90.3 | 90.0 | 79.0 | 84.2 |
| CO2 purity, [%] | 95.8 | 95.0 | 68.0 | 93.6 |
| Total membrane surface, [m2] | 9 × 10⁵ | n.a. | 6.1 × 10⁵ | 71 × 105 |
| CO2 permeance, [GPU] | 1000 | 2000 | 100 | 270 |
| CO2/N2 selectivity | 50 | 70 | 43 | 41 |
| Flue gas, [kmol/h] | n.a. | 118,694.3 | 52,929 | 65,486 |
| Syngas flow, [kmol/h] | 3109 | n.a. | n.a. | n.a. |
| CO2 content in the stream before membrane, [kmol/h] | 716.29 | 16,296.73 | 6880.77 | 9823 |
| Power consumption of membrane plant, [kWe] | 19,700 | 261,100 | n.a. | n.a. |
| LCOE_tax, [EUR /kWh] | 0.1410 | n.a. | n.a. | n.a. |
| SPECCA, [MJth/kg] | 4.60 | n.a. | n.a. | n.a. |
| SEPCCA, [MJel/kg] | 2.86 | 1.66 (calculated) | n.a. | n.a. |
| CO2 avoided cost [EUR/t] | 52.94 | n.a. | n.a. | 46.0 |
| CO2 captured cost [EUR/t] | 46.37 | 45.10 | 48.01 | n.a. |
Publisher’s Note: MDPI stays neutral with regard to jurisdictional claims in published maps and institutional affiliations. |
© 2022 by the authors. Licensee MDPI, Basel, Switzerland. This article is an open access article distributed under the terms and conditions of the Creative Commons Attribution (CC BY) license (https://creativecommons.org/licenses/by/4.0/).
Share and Cite
Alabid, M.; Dinca, C. Parametrization Study for Optimal Pre-Combustion Integration of Membrane Processes in BIGCC. Sustainability 2022, 14, 16604. https://doi.org/10.3390/su142416604
Alabid M, Dinca C. Parametrization Study for Optimal Pre-Combustion Integration of Membrane Processes in BIGCC. Sustainability. 2022; 14(24):16604. https://doi.org/10.3390/su142416604
Chicago/Turabian StyleAlabid, Maytham, and Cristian Dinca. 2022. "Parametrization Study for Optimal Pre-Combustion Integration of Membrane Processes in BIGCC" Sustainability 14, no. 24: 16604. https://doi.org/10.3390/su142416604
APA StyleAlabid, M., & Dinca, C. (2022). Parametrization Study for Optimal Pre-Combustion Integration of Membrane Processes in BIGCC. Sustainability, 14(24), 16604. https://doi.org/10.3390/su142416604