Article

An Improved Social Force Model of Pedestrian Twice–Crossing Based on Spatial–Temporal Trajectory Characteristics

1
School of Transportation and Vehicle Engineering, Shandong University of Technology, Zibo 255000, China
2
Center for Urban Transportation Research, University of South Florida, Tampa, FL 33620, USA
*
Author to whom correspondence should be addressed.
Sustainability 2022, 14(24), 16615; https://doi.org/10.3390/su142416615
Submission received: 9 November 2022 / Revised: 4 December 2022 / Accepted: 6 December 2022 / Published: 12 December 2022

Abstract

:
Pedestrian two-stage crossing, as one of the key elements of the urban roadway network, affects not only vehicle flow at signalized interactions, but also road capacities in the transport system. Therefore, it is vital to deeply understand the behavioral characteristics of pedestrian twice-crossing in order to improve the safety and efficiency of the road transport network. Based on our previous study, this study continues to improve the social force model by classifying the trajectory type of pedestrian twice crossing. In the interactive aggregation, the pedestrian trajectory line was divided into two types: straight path and curved path. The Work–Energy Principle and Impulse–Momentum Principle were used to identify the spatial and temporal characteristics of pedestrian twice-crossing behaviors. It was found that when pedestrians on the two sides are facing very close in a congested section, the maximum repulsive force appears to be a dramatic increase and remains for a period of time. This result provides us with direction for updating the social force model, focusing on the repulsive force generated by the opposite flow. The improved model can achieve high precision in predicting pedestrian twice-crossing behaviors. The findings of this study have great implications for designing pedestrian facilities and optimizing pedestrian signal timings, thus helping to increase the mobility and safety of pedestrian twice-crossing.

1. Introduction

The pedestrian mode is one of the most important components of urban transport systems [1]. Pedestrian crossing considerably influences vehicle flows in urban areas [2]. At large signalized intersections with multiple lanes in each approach, pedestrian twice-crossing is widely applied in the road traffic network, because it can provide safe crossing, decreased waiting time and reduced conflicts with vehicle flow. Pedestrians often present unique behavioral features during the twice-crossing process. Hence, it is extremely important to deeply understand the behavioral characteristics of pedestrian two-stage crossing in order to improve its safety and efficiency as well as the safety and efficiency of the road transport network.
In recent years, traffic researchers have paid attention to exploring pedestrian behaviors during the twice-crossing process, such as pedestrian delay [3] and pedestrian violation [4]. Comparisons of pedestrian twice-crossing with single-stage crossing on signal-controlled roadways were conducted in terms of the time required for pedestrians waiting to cross the traffic way [5], pedestrian delay due to the change of the signal phase duration [6], and the time–space characteristics of pedestrian crossing [7]. Yang et al. designed a signal scheme and built a delay model for the second crossing by understanding use of time and space by pedestrians [8]. Wang et al. developed a multi-objective optimization model to improve the signal phase sequence of pedestrian twice-crossing to reduce the loss time [9]. Li et al. developed a game–theoretical model based on pedestrian delay and crossing risk in order to analyze pedestrian movements during two-stage crossings [10]. Liu et al. studied the expected speed, relative speed and influence of pedestrian position in two-stage crossings by improving the pedestrian–obstacle interaction model and social force model [11].
A series of pedestrian flow models have been widely used in determining pedestrian walking characteristics, including gas dynamics models, meta-cellular automata models and social force models [12]. Through the construction of pedestrian dynamics models, pedestrian motion features can be recognized from a microscopic perspective in order to promote safety and optimize the efficient operation of signalized intersections. Among the various models, application of the social force model to pedestrian movement has received the most attention since it was first proposed by Helbing et al. [13]. This model measures the intrinsic motivations of humans to drive movement by using the concept of force. It explores psychological issues from the mechanical aspect. The forces acting upon pedestrians are divided into the three types: the self-driven force, the human interaction force, and the forces generated by obstacles on people. As one of the important microscopic pedestrian flow simulation models, social force is also extensively applied in the field of rescue escape [14], in such instances as shipwreck escape [15] and subway crowd evacuation [16]. Zeng et al. proposed a general calibration method based on maximum log-likelihood estimation to improve the social force model and enhance its adaptability for pedestrian crossing [17]. Guo et al. improved the social force model based on game theory in order to make it more adaptable to pedestrian twice-crossing [18]. Liu et al. extracted the pedestrian trajectory to identify the locations of pedestrians using the social force model [19]. Yang et al. proposed a microscopic SFM obstacle avoidance method based on an ant colony optimization algorithm and pedestrian dynamic characteristics in order to provide technical support for evacuation decisions in a multi-obstacle environment [20].
Dynamic motion analysis has a wide range of applications in a variety of fields as it describes the motions of objects while considering forces [21]. Alessandro et al. proposed a Bayesian probabilistic approach to estimate the parameters in a pedestrian dynamics model based on the use of experimental data [22]. Wang et al. viewed pedestrian flow as a stable fluid and used Bernoulli’s equation to explain the energy transformation of the self-driven forces [23]. Qin et al. introduced the theories of momentum conservation and energy conservation to establish a pedestrian crossing assessment model at intersections based on traffic conflict techniques [24]. Li et al. analyzed the kinetic and kinematic features of pedestrians’ active behaviors to quantify the pedestrian–vehicle interaction processes [25]. Liang et al. used Newton’s law of momentum conservation to explore the crowd pressure on pedestrian dynamics and recognize pedestrians’ movement characteristics under various conditions [26]. Wei et al. used a momentum equation to improve the social force model in order to determine the changes of pedestrian flow under the influence of disturbance fluctuation [27].
Based upon the above analysis, it was found that combining the social force model with the principles of dynamics provides an effective method for exploring pedestrian movement from a microscopic point of view. However, few studies have reported on analyzing pedestrian twice-crossing behaviors with this approach. This study will use the work–energy principle and impulse–momentum principle to analyze pedestrian behavioral spatial–temporal characteristics in order to improve the social force model and increase its adaptation to pedestrian two-stage crossing.

2. Research Method

2.1. Descriptions of Pedestrian Twice-Crossing

Pedestrian twice-crossing is typically applied at busy and wide signalized intersections where a pedestrian crosswalk crosses a high-volume or high-speed street, and the crosswalk has high pedestrian volumes. A two-stage crossing is designed to allow pedestrians to cross the road in two separate movements by waiting for a gap in the traffic at a refuge island. A refuge island is placed in the center of the road, providing a protected space to pause in the middle of crossing. Figure 1 shows examples of pedestrian crosswalk design and signal timings for two-stage crossing. It can be seen that a pedestrian crossing has to be completed in two stages with bidirectional asymmetrical signaling. This creates some distinct physical, physiological, and behavioral features.

2.2. Social Force Model and Improvement

2.2.1. Classical Social Force Model

Classical social force is one of the most popular models to describe the motion of pedestrians. The social force   F α ( t ) consists of three components: F α 0   represents the inner drive of pedestrian α in the ideal state; F α β and F α i represent the interaction between pedestrian α and other pedestrians β and i; and F α B is the resistance of obstacle B to the pedestrian. It is mainly used to express the physical quantity externalized by the specific inner activity of a person in performing a behavior, which is given by Equation (1).
F α ( t ) : = F α 0 ( υ α , υ α 0 e α ) + B F α B ( e α , r α r B α ) + β F α β ( e α , r α r β ) + i F α i ( e α , r α r i , t )
where v α is the actual speed of pedestrian α and e α refers to his/her desired direction of motion. r B α denotes the distance of pedestrian α to obstacle B. r α denotes the range of force acting on pedestrian α.

2.2.2. Improved Social Force Model

In our previous study (Guo et al., 2022 [18]), the social force model was improved based upon the behavioral characteristics of pedestrian twice-crossing. The three main components of the model were expanded to four by adding the effect of the green signal countdown. Due to limited space, only the main changes of the improved social force model were introduced in this Section. Please refer to Guo et al., 2022 [18] for further details about the improved model.
The improved social force model includes four main parts: (a) self-driving force F i ; (b) force   F ij generated by the surrounding pedestrians on the target individual; (c) repulsive force F iw of the longitudinal boundary lines of the crosswalk; and (d) force F s produced by the green signal countdown. The improved social force   F   of the pedestrian α is expressed by:
F = F i + F i j + F i w + F s

2.2.3. Self-Driving Force

The element of self-driving force is improved mainly by adding direction coefficient a to convert the speeds in different directions, in order to adapt pedestrian flow at a signalized intersection. When crossing the street, the trajectory of the pedestrian is often curved, which can be considered approximately as a sequence of short straight lines r 1 , r 2 , , r r , in various directions. The self-driving force can be obtained by Equations (3) and (4).
  F i = 1 τ i { [ v i 0 e i 0 ( t ) ] av i }
e i   ( t ) = r i k r i   ( t ) r i k r i   ( t )
where e i   ( t ) represents the direction vector of the desired velocity at time t; τ is the relaxation time.

2.2.4. Attraction and Repulsion Generated by Other Pedestrians

The interactive force means that pedestrians are affected by the surrounding pedestrians during the twice-crossing process. In the congested interactive section, a pedestrian is more likely to follow the pedestrian ahead with the same walking direction. They travel through almost the same path, and the pedestrian crossing ahead exerts an attractive force on the follower. Meanwhile, to avoid the bidirectional conflict, pedestrians traveling in the two directions attempt to repulse each other. The magnitude of the interactive force is related to the distance and walking direction between pedestrians, which directly affects their crossing speeds. On the basis of the original model, a sign function is constructed as shown in Equation (5). It is used to distinguish the forces generated by pedestrians in the same direction and in the opposite one. Considering the difference of time perception for pedestrians in the two directions under uneven signal conditions, the attraction/repulsion is defined with a time coefficient C, which is given by Equation (6).
sign ( x ) =   {       1                 x > 0       0                 x = 0       1                 x < 0
F ij = j ( i ) f ij = sign ( x ) j ( i ) A i Cexp [ ( r ij d j ) / B i ] n ij
where r ij is the radius of pedestrians’ field of view. A i denotes the strength coefficient of interactive force. B i denotes the range of attraction to the traffic signals.

2.2.5. Influence of Green Signal Countdown

Under the uneven signal timing in the two approaches, pedestrians in the two directions might have a different sense of the remaining green time. Therefore, the impact of the green signal countdown is distinguished according to the direction, and the impact of the green light countdown on pedestrians is mainly presented in terms of acceleration, which can be measured by Equation (7).
F s = c [ 1 + ah ( Δ t ij ) + bg Δ v ij ] × t s / [ exp ( r i d s ) ] n s
where r i denotes the radius of the force field of pedestrian i, and d s denotes the radius of the green countdown force. c refers to the force coefficient. The weight coefficients a and b refer to the desire ratio of the walking goals (time and distance) for side A and side B, respectively. g ( Δ v ij ) reflects the speed difference and h ( Δ v ij ) reflects the time difference, given by:
g ( Δ v ij ) = Δ v ij × u
h ( Δ v ij ) = Δ t ij / d

2.3. Principle of Impulse and Momentum

The impulse–momentum principle describes the change of the motion state for an object. It states that the change in momentum of an object is equal to the impulse I applied over time, given by Equation (10).
t 1 t 2 F i dt = I i = mv 2 mv 1
where I i   is the sum of the impulses of all external forces at the ith pedestrian particle.   F i   denotes the combined external force, and mv 1 and mv 2 are the momentums at times t 1 and t 2 , respectively.
Therefore, the average resultant force acting on an individual pedestrian during a period of time t can be obtained according to the change in momentum per unit time, given by Equation (11).
F = mv 2 mv 1 t

2.4. Principle of Work and Energy

The work–energy principle is also used to precisely describe the motion of an object. It states that the work done by the resultant force on a particle is equal to the change in the particle’s kinetic energy over a distance, given by:
t 1 t 2 F i ds = W i = 1 2 mv 2 2 1 2 mv 1 2
where W i is the work done by all the external forces at the ith pedestrian particle; 1 2 m v 1 2   and 1 2 m v 2 2 are the kinetic energy at distances s 1   and s 2   , respectively.
Thereby, the average resultant force acting on an individual pedestrian over a distance s can be obtained according to the change in energy per unit distance, given by Equation (13).
F = mv 2 2 mv 1 2 2 S

3. Data Collection and Processing
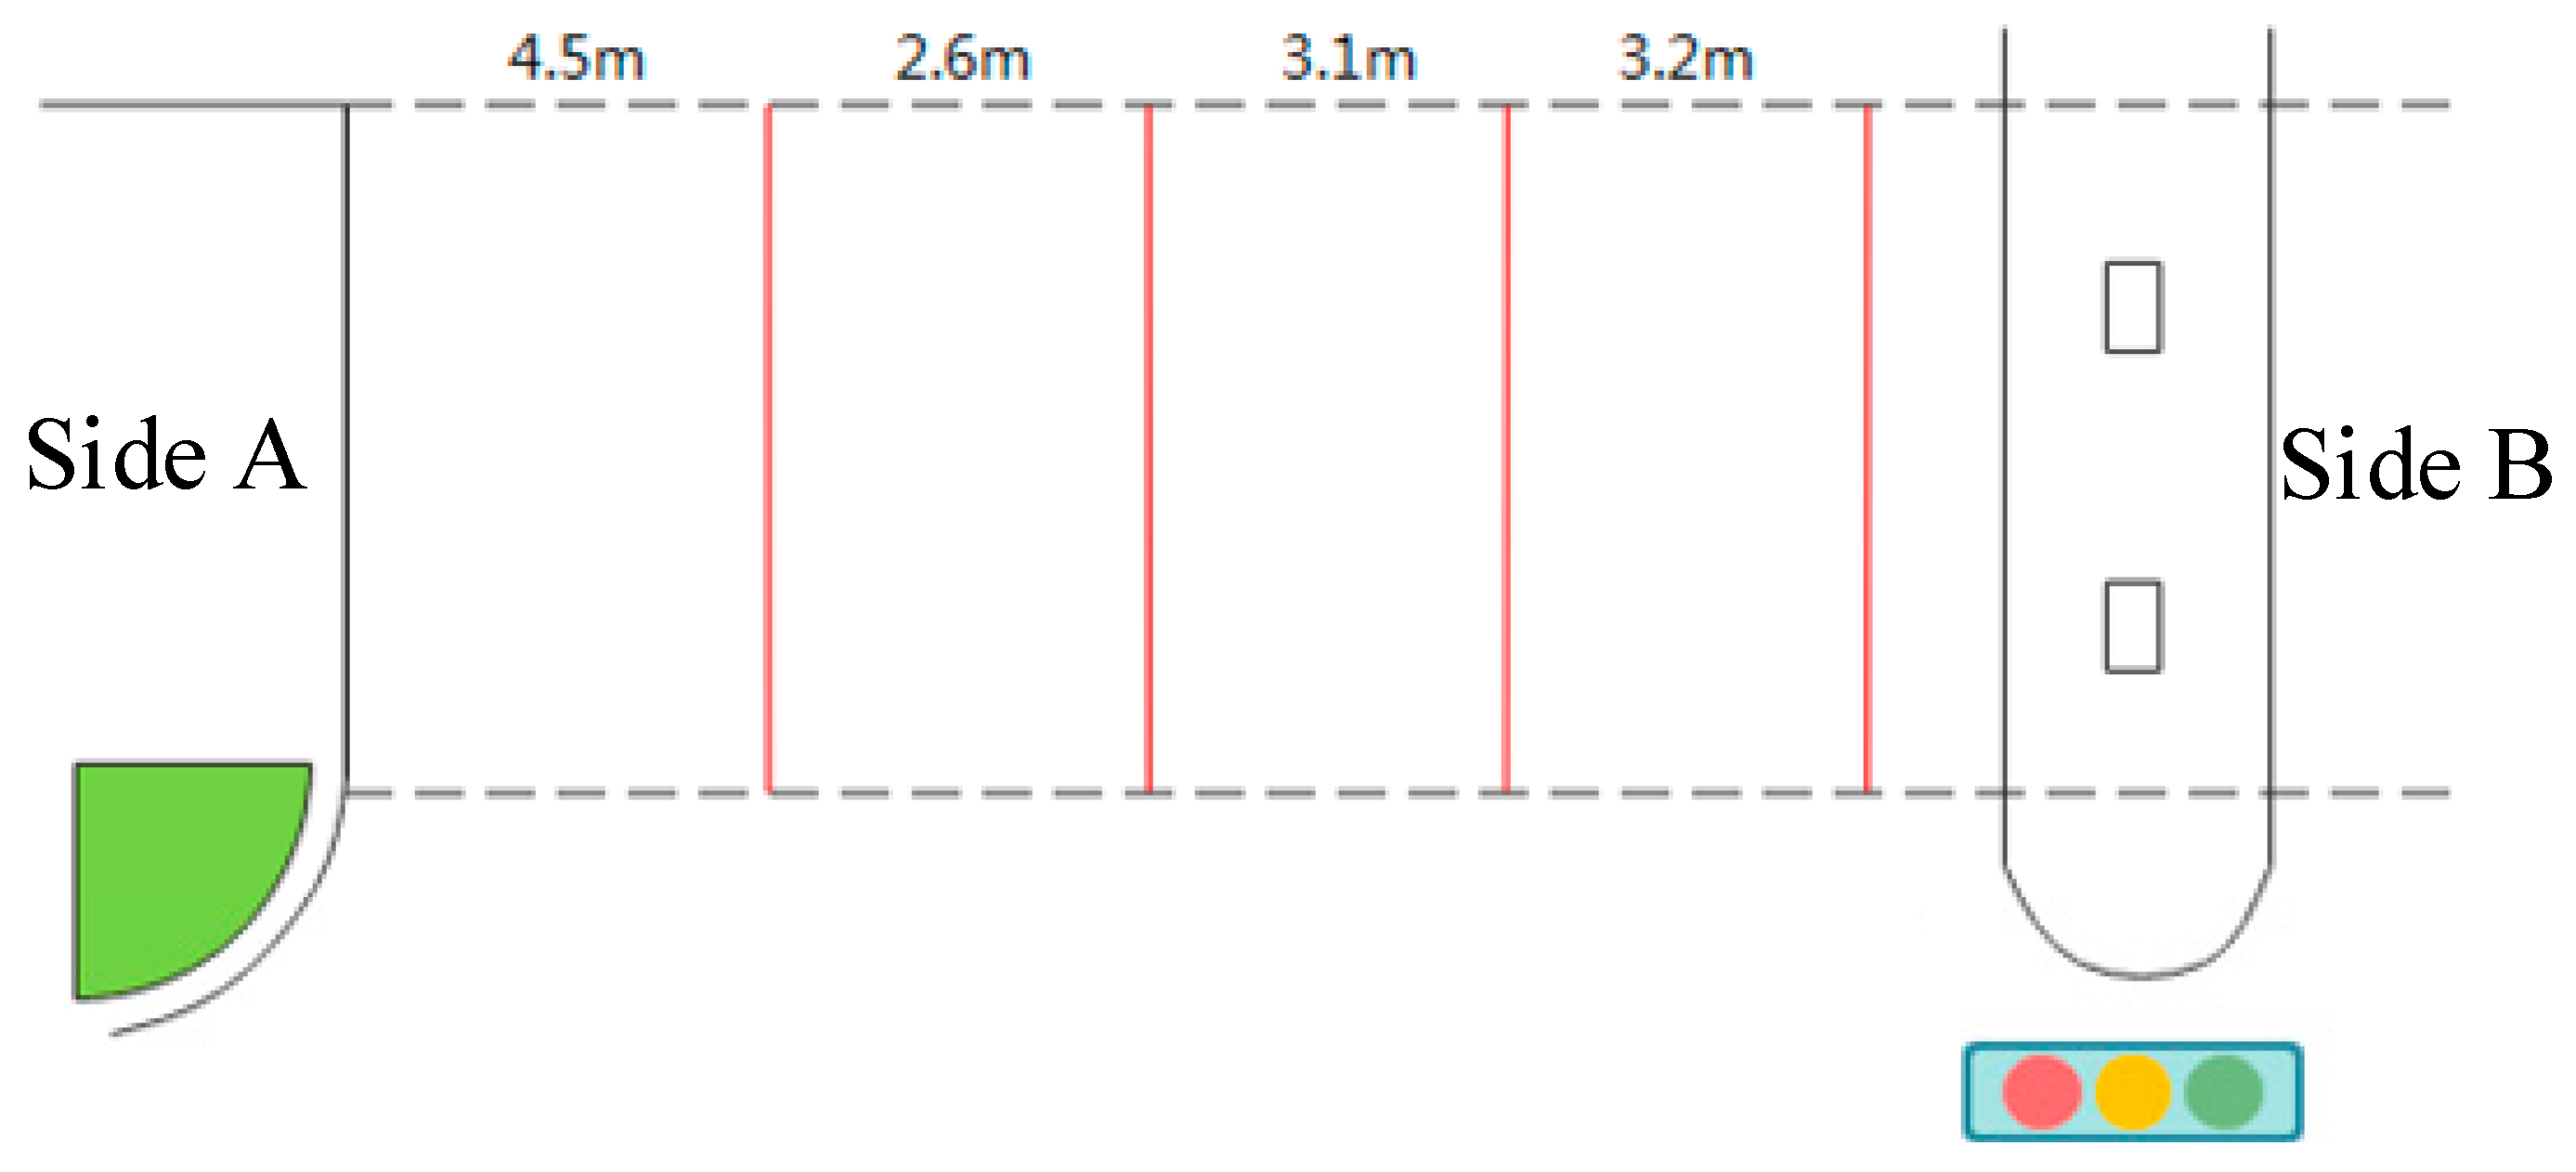
In this study, a video recording method was used to conduct a collection of pedestrian characteristics data in a real-world traffic situation. The experimental site we selected is the intersection of Nanjing Road and Gong Qing Tuan West Road in Zibo, China, focusing on the pedestrian twice-crossing area in the east–west direction, as shown in Figure 2. The full length of the crosswalk is 32 m, along with a safety island in the middle with a width of 4 m. For the sake of analysis, the crosswalk was roughly divided into two segments, section ab and section bc. This study emphasizes analyzing pedestrians’ interactive characteristics in stage ab, which is the first crossing of pedestrians from side A and the second crossing of pedestrians from side B.
The signal phase and timing of the pedestrian twice-crossing are illustrated in Figure 3. The cycle length of this signal is 169 s. This pedestrian signal for twice-crossing presents bidirectional asymmetrical distribution. Specifically, the green light first starts from side B in stage bc, and after a certain time, the green lights are illuminated in both directions in stage ab. Such signal timing allows pedestrians in side B to cross the median and then wait there for a while to continue. Inversely, prior to the second stage of crossing, pedestrians on side A do not need to wait at the refuge island.
This study used a drone to collect and record pedestrian crossing behaviors for analysis. The data were videoed in the rush hours on the weekdays for two weeks. In total, 276 signal cycles were extracted from the videos, consisting of 4178 pedestrians on side A and 3745 pedestrians on side B. The video files were analyzed with Kinovea 0.9.5 software by measuring pedestrians’ velocities and positions. Among them, a total of 4309 extracted trajectory lines of pedestrian crossing for the two directions were obtained. In accordance with pedestrian walking characteristics in the congested interactive condition, stage ab was divided into five segments with four cross-sectional lines, shown in Figure 4. Breaking down the whole stage can help us understand pedestrian crossing behavior in detail.
Kinovea software can track multiple pedestrians in congested situations simultaneously in order to provide us with accurate pedestrian trajectories. During the tracking process, three types of pedestrians were paid more attention on, that is, the first pedestrian crossing the stopline, the last pedestrian crossing the stopline, and the pedestrians with one or more companions. To ensure that the target objects remained on track on the congested situations, only 5–7 pedestrians were selected for each operation. During the tracking process, pedestrian movements in different directions can be followed through the colored path shown in Figure 5.
To understand pedestrian group behavior more precisely, the directions in which they are facing are analyzed when they are passing through the cross-sections. Figure 6 shows pedestrians’ walking directions and the interactive behavior of both sides in the four crossing sections. It was observed that compared to pedestrians on side B, pedestrians on side A change their walking directions over a greater range of angles while crossing the street. Pedestrians on side B show a strong tendency to maintain the forward direction. The distributions of pedestrian walking direction in the cross sections are discussed below.
(1)
On cross section S1, pedestrians in the first row of direction A arrive here when pedestrians in the first row of direction B have just passed the boundary of the refuge island. Most pedestrians in both directions face straight forward and maintain a relatively consistent orientation.
(2)
On cross section S2, pedestrians on both sides begin their bidirectional aggregation. From this location, pedestrians on side A begin to decrease their speeds and increase their changes in walking direction, chiefly owing to the effects of pedestrians on side B.
(3)
On cross section S3, both sides are engaged in the longest interaction. At this location, pedestrians on side A tend to change their directions, extending over the widest range of angles. From here, pedestrians start increasing their crossing speeds with the increased influence of the green signal countdown.
(4)
On cross section S4, both sides completely split up following in the aggregation. Pedestrians on side A gradually go back to the previous state, that is, they face directly forward.
Additionally, pedestrians’ crossing time on each cross section was collected in order to deeply analyze their crossing trajectories. Table 1 shows the instant time points of pedestrians crossing cross sections.
The velocity distributions of pedestrians crossing the cross-sections are demonstrated in Figure 7. It was noted that the distribution of the cross-sectional speed is characterized by a sharp peak around its average. The peak for each cross-section is sharp, which simply means that pedestrian group behaviors are largely consistent in cycles. When the four cross-sections were placed in sequence, it was found that pedestrians on side A tend to speed up first, then slow down in the aggregation process, and then finally step up after dissipation during crossing stage ab.

4. Analysis and Results

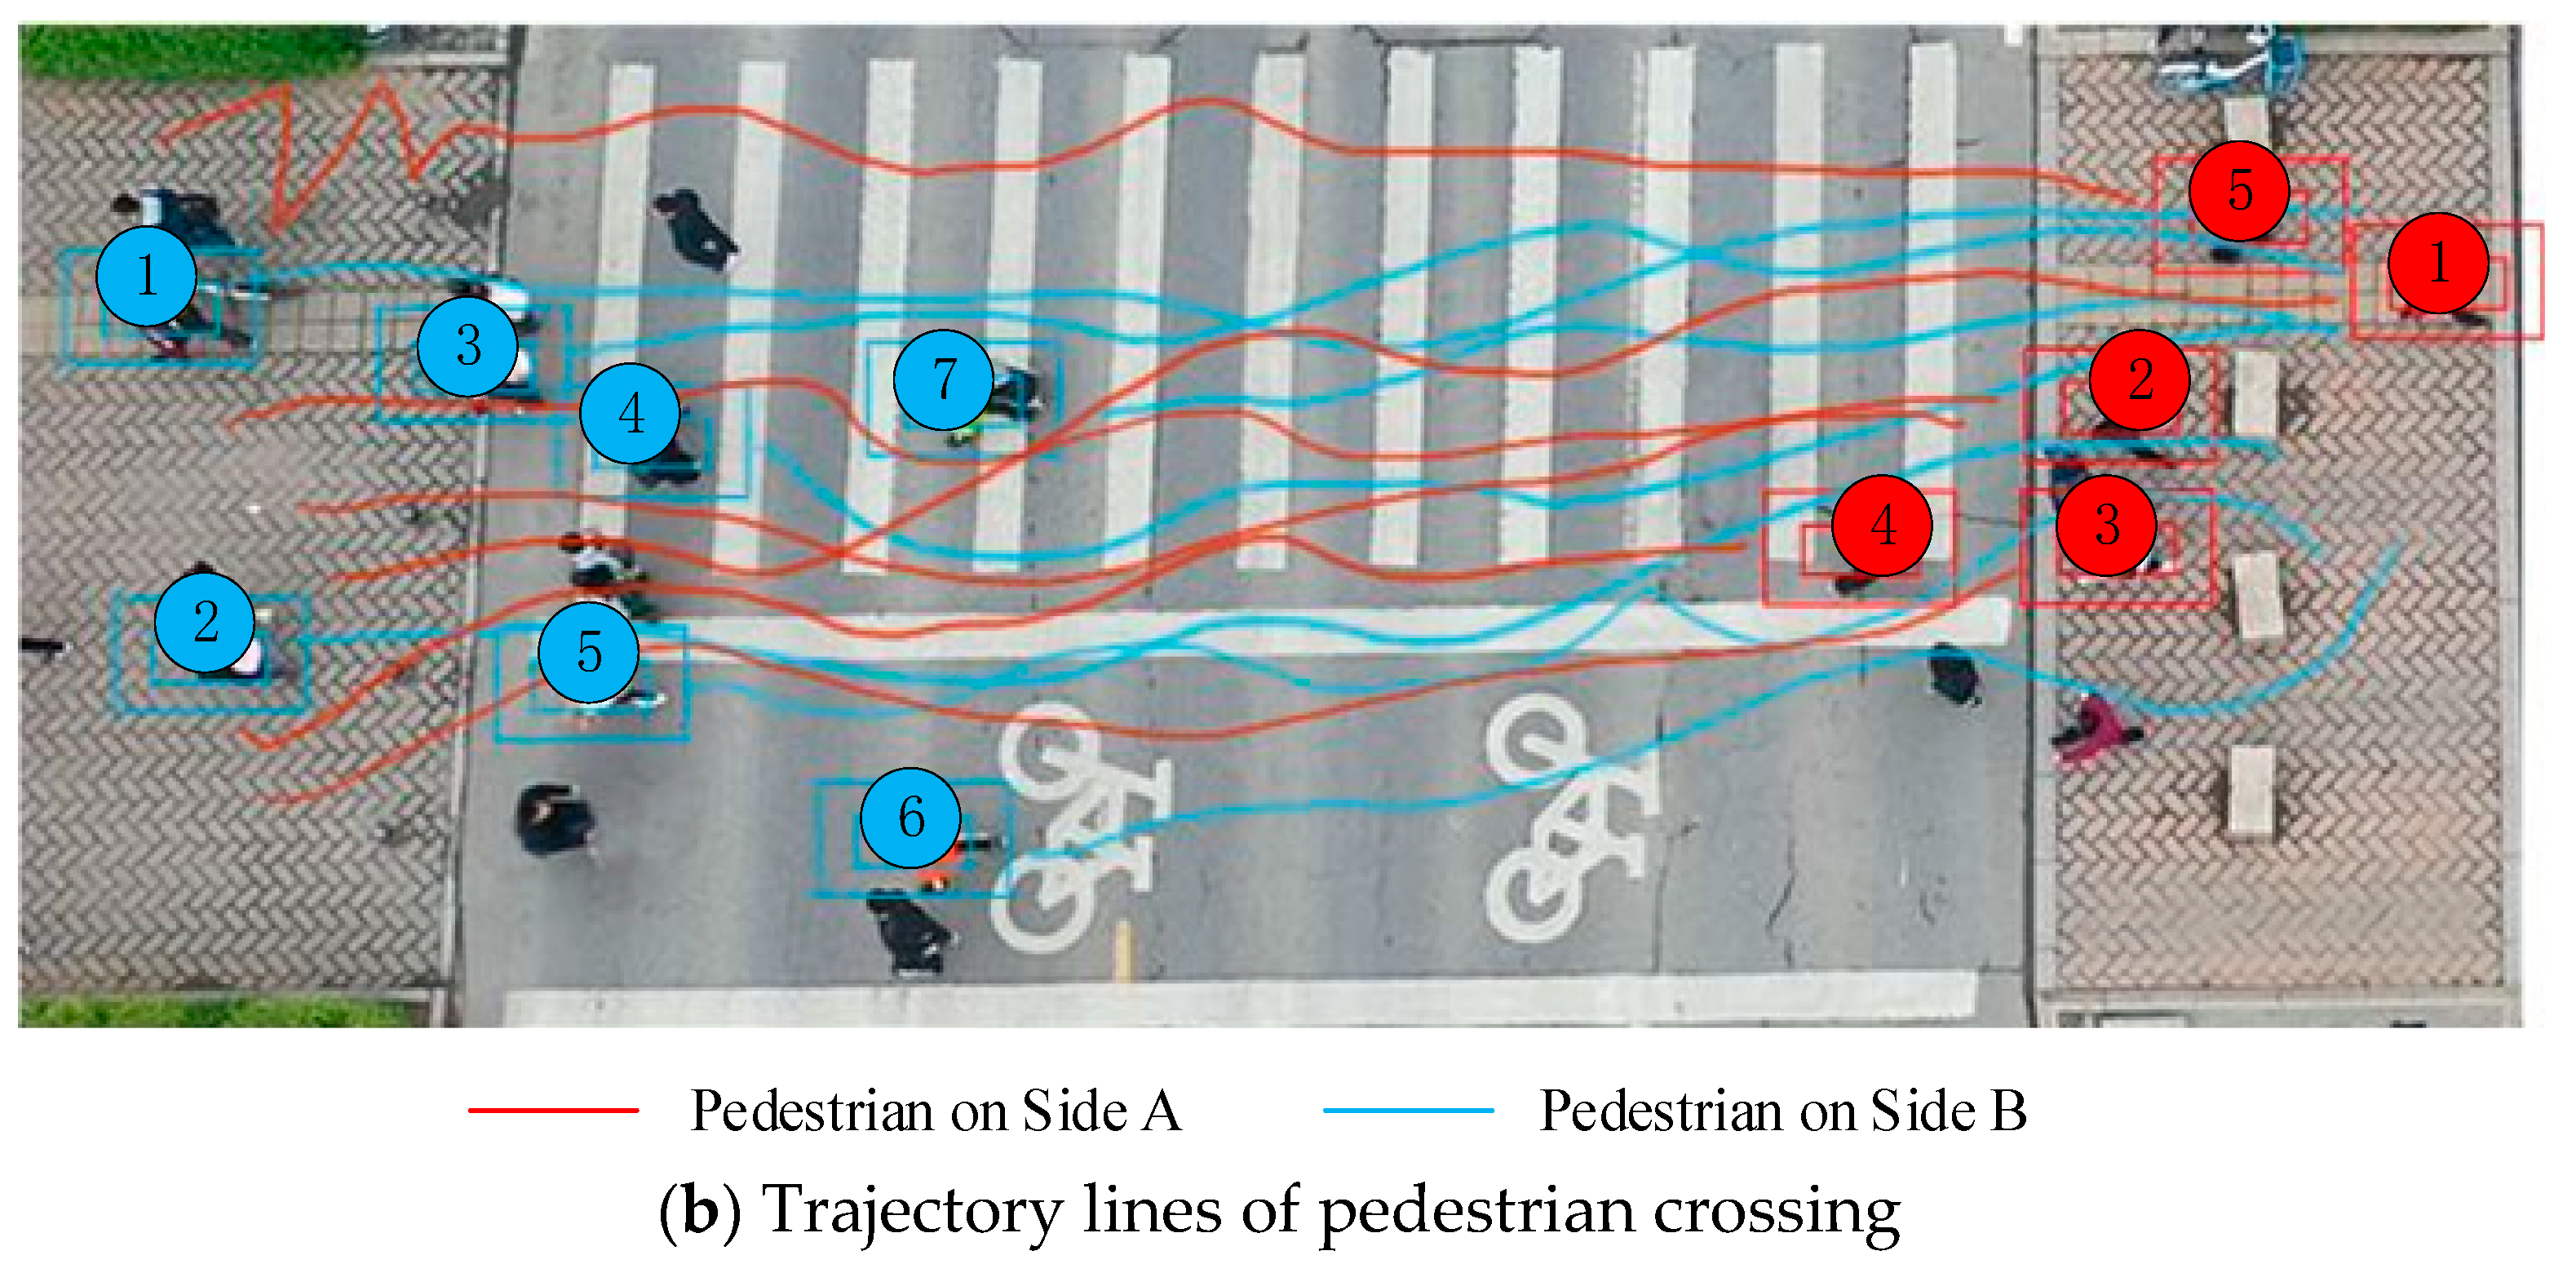
4.1. Trajectory Analysis

This study focuses on analyzing the trajectory characteristics of pedestrians on side A during the interactive aggregation. The whole crossing process could be divided into three parts according to pedestrians’ behavioral features, mainly including their velocities and trajectories. The three parts consist of pre-aggregation, the aggregation process, and post-aggregation.
  • In the pre-aggregation process, pedestrians have a strong tendency to face directly forward and maintain acceleration.
  • In the interactive aggregation process, pedestrians are more likely to frequently change their walking directions with the purpose of finding space to weave in and get out of the congested situation. It reflects that pedestrians’ crossing strategy over the aggregation is to “spend a shorter time through extending the path length”. Moreover, pedestrians have to slow down under the impact of pedestrians approaching from the opposite direction. This indicates that the repulsion generated by the counterstream presents the growing impact on pedestrian walking behavior during the aggregation process. We will explore the impact below by classifying the type of movement trajectory.
  • In the post-aggregation process, pedestrians have a high inclination to return to the state of facing straight ahead and speeding up at a high rate.
By analyzing the behavioral characteristics of pedestrians during a congested interaction, their trajectories are divided into two types, straight path and curved path. Data show that 68% of trajectory lines are curved, and 32% of them are straight. Figure 8 shows two examples of the path types. It was noticed that the straight path is an approximate straight line. This indicates that for this type, pedestrians mostly keep moving forward, and they are less likely to yield to pedestrians approaching from the opposite direction. If the conflict occurs in the interaction, pedestrians are highly likely to choose to slow down to wait for the opposite side to give up the way. Moreover, it was observed that the curved path presents one or two curves. This reflects that pedestrians of this type have a high inclination to yield to the opposite side and change walking direction actively to seek space to pass.
The interactive stage is approximately located within the areas 7–12 m from the stopline of side A. Table 2 shows the pedestrian behavioral attributes of the two path types. Comparing the two path types, it was observed that their upstream velocities are similar ( v 1 v 1 ) and the downstream velocity is higher for straight rather than curved paths ( v 2 < v 2 ). The length path is longer for the curved rather than the straight path ( s 1 < s 2 ), but the duration of time spent is shorter for the curved rather than the straight path ( t 1 > t 2 ).

4.2. Spatial-Temporal Analysis of Pedestrian Movement

The principle of work and energy can be used to analyze pedestrian moving behavior in terms of force and energy. The work–energy principle states that the kinetic energy is transferred through the application of force along a displacement, therefore, the change in kinetic energy is equal to the work done by the force. By measuring the changes in kinetic energy, the sum of the forces working on pedestrians can be obtained. The distributions of the resultant force for the two path types during aggregation are demonstrated in Figure 9. Figure 9a shows the forces calculated using the work–energy principle. It reflects the effect of the net force on pedestrians’ motion over a distance. It was noticed that the straight path (−2.8 N) has a larger magnitude of maximum negative force than the curved one (−1.2 N). This indicates that in a congested interaction, the force generated from the opposite direction acting on pedestrians on side A along a straight path increases dramatically. This might be attributed to the fact that pedestrians along a straight path do not yield to the opposite, resulting in a highly increased repulsion with a reduced distance between the two sides. In the dissipation stage, the two path types present no obvious difference in the net force exerting on pedestrians.
The principle of impulse and momentum can be used to analyze pedestrian movement behavior from the perspectives of force and momentum. The impulse and momentum principle describes that the momentum is transferred by the forces being exerted over a period of time, and the change in momentum equals the impulse applied to the object. By measuring the changes in momentum, the sum of the forces acting on pedestrians can be obtained. Figure 9b shows the forces calculated using the impulse and momentum principle. It reflects the effect of the net force on pedestrians’ motion over a period of time. It was also observed that the straight path has a larger magnitude of maximum negative force than the curved one, and the maximum negative force remains for a while (about 2 s). This indicates that in aggregation, pedestrians are more likely to keep walking along a straight line built on the sacrifice of time (stop or slow step) than to wait for the opposite side to yield the way.
In summary, because pedestrians on a straight path do not yield the way to the opposite side in the interactive aggregation, they have to slow down or stop in order to keep the way. The two sides are more likely to face each other, leading to a strong repulsion from the opposite side. This force might be the largest one among the four kinds of forces acting on pedestrians. Moreover, the strong repulsion force usually lasts for a certain period of time.

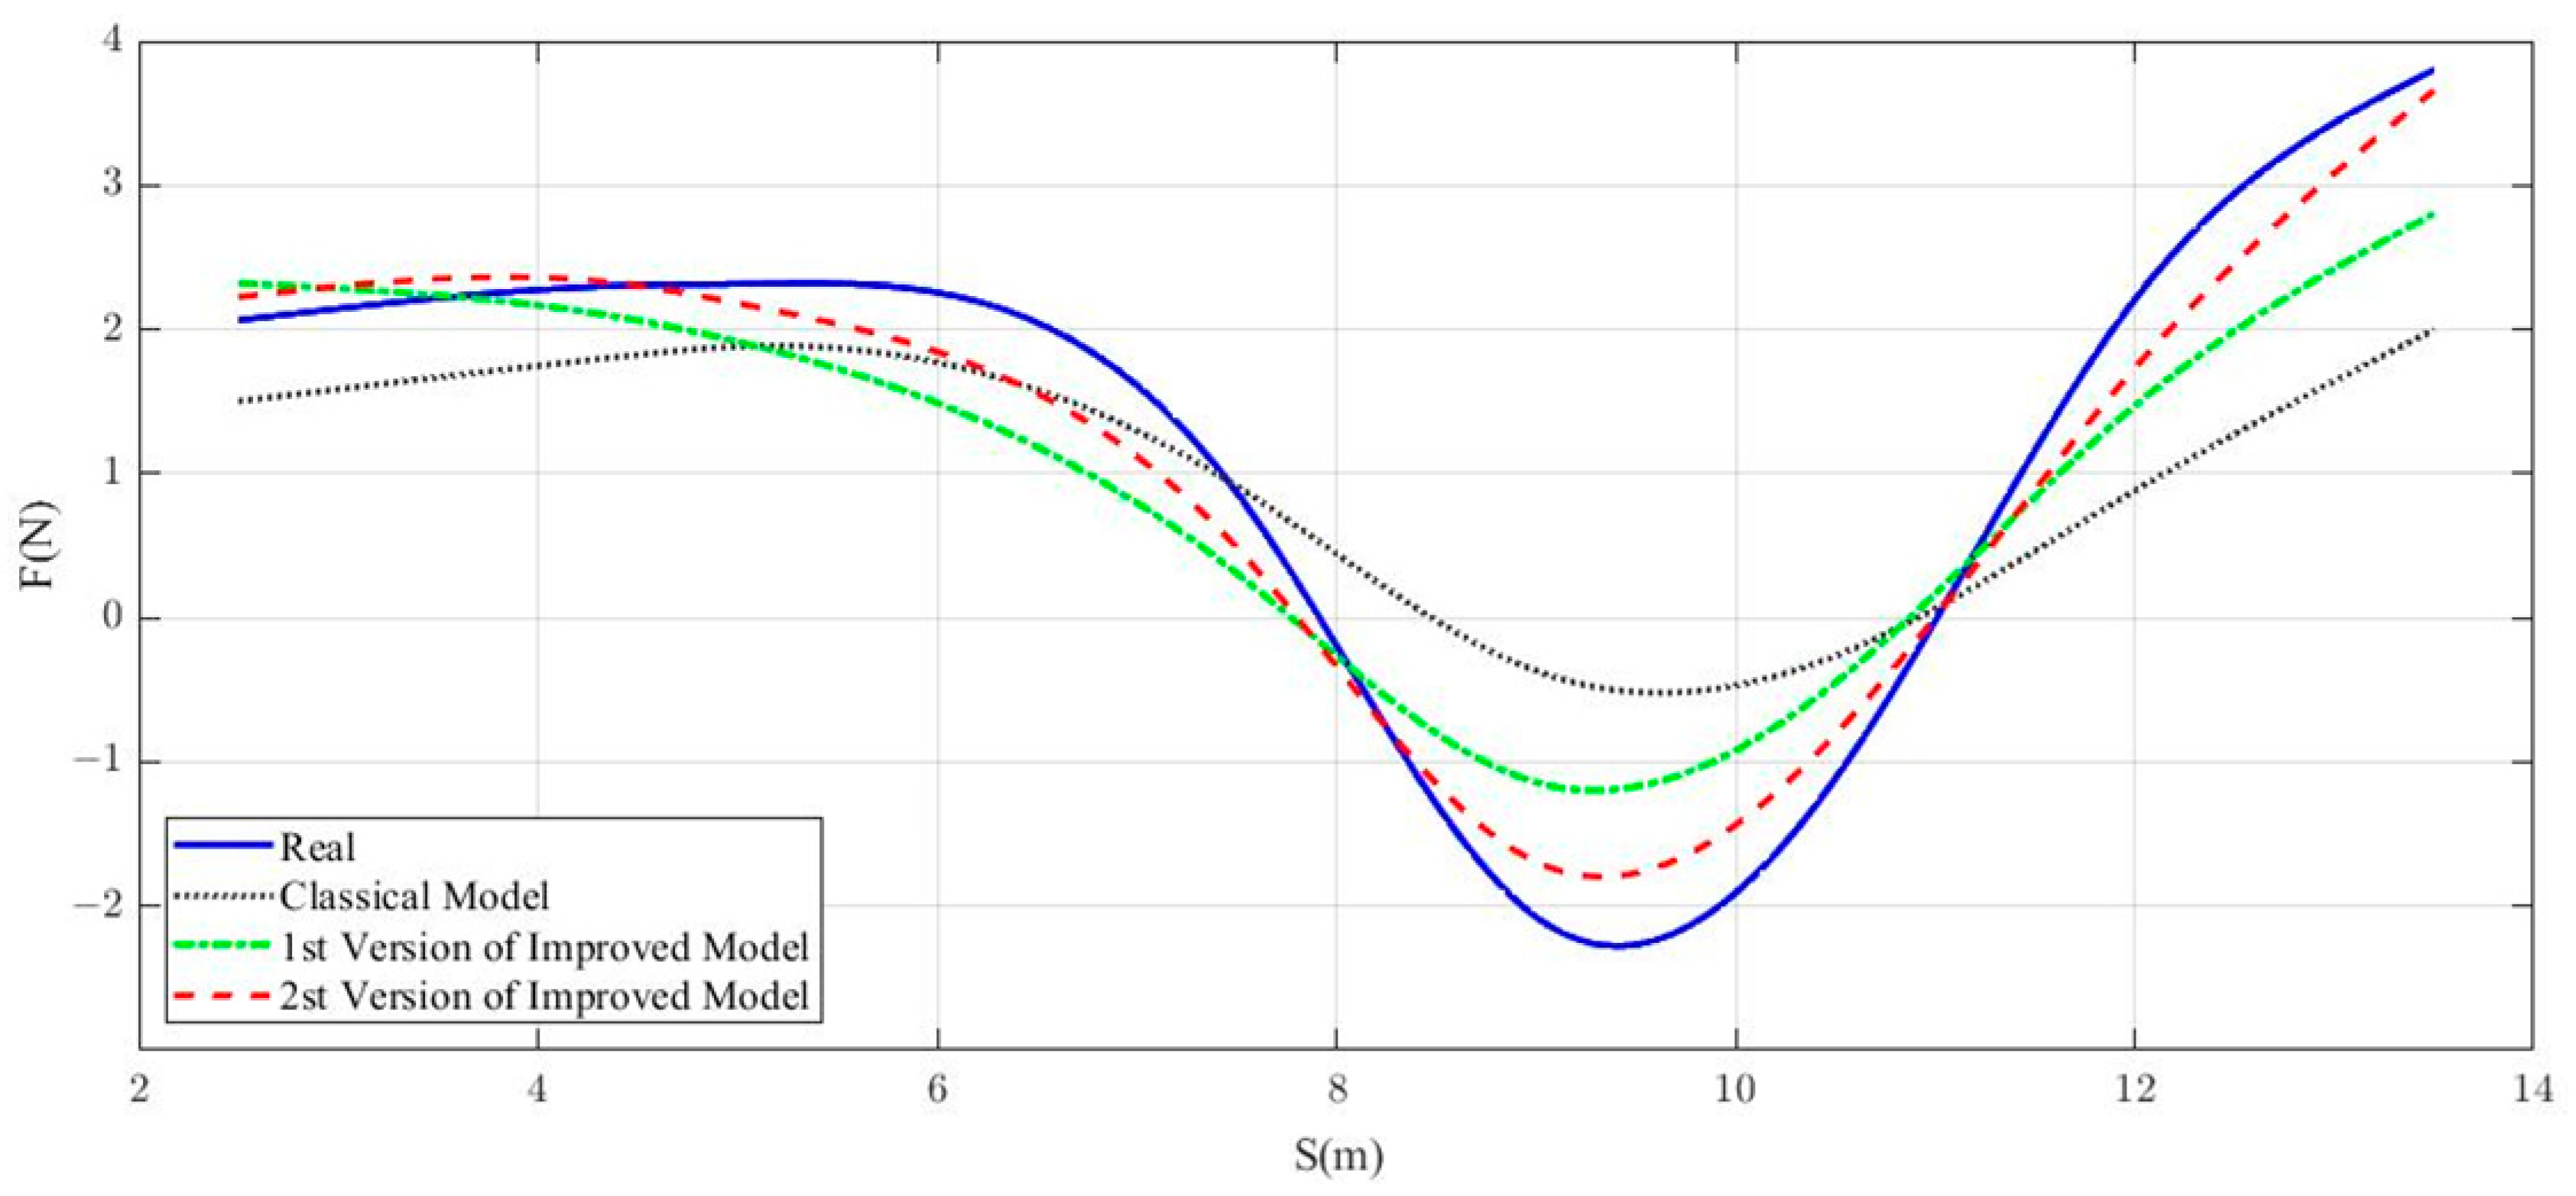
4.3. Improvements of Social Force Model

In our previous study, the results showed that there is a large difference between the actual value and the predicted one (1st version of the improved model) in the crowded interactive stage. Specifically, the predicted value is higher than the actual one. Based upon the time–space analysis of pedestrian crossing behaviors mentioned above, the social force model will be improved to increase the accuracy in measuring the forces acting on pedestrians.
In this study, the model was enhanced by focusing on the component of the repulsive forces generated by pedestrians approaching from the opposite direction. The spatial–temporal behavioral characteristics of pedestrians crossing the aggregation show that when the two sides are very close, the maximum repulsion force appears to be a dramatic increase and remains for a while. This provides us with a direction to update the equations of the repulsive force, as shown in the following.
F ij = j ( i ) f ij = sign ( x ) j ( i ) A i C 2.8 a exp [ ( r ij d j ) / B i ] n ij
a = 1 / [ 1 + exp [ ( d j 0.5 ) ]
It should be noticed that the time coefficient was changed from C to C 2.8 a to reflect the sharp increase of the repulsion in the aggregation. The maximum likelihood estimation method was used for determining the parameters of the time coefficient. a refers to the distance coefficient obtained by applying a Sigmoid function to normalize the distances between the target pedestrian and the opposite flow. To demonstrate the differences, comparisons between the equations of the three social force models are given in Table 3.
Next, the predicted resultant force, generated from the 2nd version of the improved model, was compared with the real value as well as the predicted values from the original social force model and the 1st version of the improved model. The comparisons among the models are shown in Figure 10. It should be noted that the actual resultant force was determined based on the combined values obtained using the principle of work and energy and the principle of impulse and momentum.
It was observed that the original model performs ineffectively in the aggregation stage and the dissipation stage. The predicted values from the 1st version of the improved model have high bias only in the aggregation stage. The predictions from the 2nd version of the improved model are closer to the actual values during the whole crossing. The differences between the predicted values and the actual values are less than 0.5 N. Compared to the original model and the 1st version of the improved model, the substantial improvements of the 2nd version appear to be in the aggregation stage, the pre-phase, and the post-phase. This reflects the range of the repulsive force of pedestrian–pedestrian interaction. Overall, the results indicate that the improved model based on the trajectory classification can achieve high accuracy in estimating forces exerted on pedestrians during twice-crossing.

5. Conclusions

In this study, we used the work–energy principle and the impulse–momentum principle to investigate the spatial and temporal characteristics of pedestrian twice-crossing behaviors. The social force model was improved according to the unique spatial and temporal behavioral characteristics through updating the repulsive force created by the opposite flow. The improved model (2nd version) can achieve high precision in predicting pedestrian twice-crossing behaviors. The main findings are summarized as follows:
(1)
The straight path (−2.8 N) has a larger magnitude of maximum negative force than the curved one (−1.2 N) during congested interactions. In the dissipation stage, the two path types present no obvious difference in the net force exerted on pedestrians.
(2)
In terms of temporal distribution, the maximum negative force of the straight path tends to remain for a period of time (about 2 s).
(3)
Compared to the original model and the 1st version of the improved model, the 2nd version of the improved model can achieve a higher accuracy in estimating the forces exerted on pedestrians during twice-crossing, especially in the aggregation stage.
This study can help us to more deeply understand the spatial and temporal characteristics of pedestrian twice-crossing behaviors. The findings will contribute to optimizing pedestrian signal timing and upgrading pedestrian facilities at signalized intersections, helping to improve mobility and safety for pedestrians. Further studies are required to investigate the spatial–temporal characteristics of pedestrian twice-crossing behaviors during the whole crossing process.

Author Contributions

Conceptualization, Y.G. and F.W.; methodology, S.M. and Y.G.; software, S.M.; validation, F.W. and Z.W.; formal analysis, S.M. and Y.G.; investigation, S.M. and Q.L.; resources, S.M.; data curation, S.M. and Q.L.; writing—original draft preparation, S.M.; writing—review and editing, Y.G. and Z.W.; visualization, S.M. and Q.L.; supervision, Y.G. and F.W.; project administration, Y.G.; funding acquisition, Y.G. and F.W. All authors have read and agreed to the published version of the manuscript.

Funding

This research was funded by the National Natural Science Foundation of China (Grant No. 71901134).

Institutional Review Board Statement

Ethical review and approval were waived for this study, because the data collected were not linked to the individual participants based on the field video of pedestrian crossing.

Informed Consent Statement

Informed consent was waived, because the data collected were not linked to the individual participants based on the field video of pedestrian crossing.

Data Availability Statement

The data used to support the findings of this study are available from the corresponding author upon request.

Acknowledgments

We thank the Center for Accident Research in Zibo (CARZ) for assistance in collecting field data.

Conflicts of Interest

The authors declare that there are no conflicts of interest regarding the publication of this paper.

References

  1. Pan, H.; Chen, P.; Ma, J. Pedestrians′ Group Psychology about Violating Traffic Laws to Cross Road at Signalized Crossing. Transp. Eng. Saf. 2010, 23, 150–156. [Google Scholar]
  2. Huang, L.Q. Study on Optimization of Pedestrian Signal for Two-stage Crossing with Minimum Delay. Master’s Thesis, Southeast University, Nanjing, China, 2019. [Google Scholar]
  3. Zhao, L.; Ren, G.F.; Gao, Z.W.; Hao, J.M.; Zhai, W.J.; Yuan, X.R. Research on Signal Control Downlink Pedestrian Crossing the Street Twice Based on VISSIM Simulation. Comput. Prod. Circ. 2019, 9, 104–105. [Google Scholar]
  4. Cong, R.; Li, Y.; Li, K.; Hou, C. Game dynamics of sentiment contagion in pedestrian crossing. Results Control Optim. 2022, 8, 100159. [Google Scholar] [CrossRef]
  5. Zhou, F. Research on Pedestrian’s Second Crossing Behavior Based on Game Theory. J. Luoyang Inst. Sci. Technol. 2018, 28, 21–24. [Google Scholar]
  6. Song, C.; Kim, I.; Xiang, Q. Evaluation of Large Signalized Intersection with New Pedestrians Twice Crossing. Procedia Comput. Sci. 2017, 109, 132–139. [Google Scholar] [CrossRef]
  7. King, M.R.; Carnegie, J.A.; Ewing, R. Pedestrian Safety Through a Raised Median and Redesigned Intersections. Transp. Res. Rec. 2003, 1828, 56–66. [Google Scholar] [CrossRef]
  8. Yang, R. The Study of Pedestrian Delay Based on Setting Method of Pedestrian Twice Crossing at Signalized Intersection. Master’s Thesis, Southwest Jiaotong University, Chengdu, China, 2017. [Google Scholar]
  9. Wang, Y.L.; Lu, J.T.; Wu, B. Multi-objective Optimization of Signal Phase Sequence at Isolated Intersections with Pedestrian Two-stage Crossing. Res. Explor. Lab. 2019, 38, 27–32. [Google Scholar]
  10. Li, C. Pedestrians’ Second-Passage Traffic Organization Method and Case Study. Master’s Thesis, Southwest Jiaotong University, Chengdu, China, 2011. [Google Scholar]
  11. Li, J.; Liu, A.Y. Research on pedestrian crossing behavior based on improved social force model. J. Transp. Eng. Inf. 2017, 15, 6–13. [Google Scholar]
  12. Cao, Y.; Ni, Y.; Li, K. Simulating pedestrian signal violation at signalized intersections with pedestrian two-stage crossing. Transportation Research Board. In Proceedings of the 96th Annual Meeting, Washington, DC, USA, 8–12 January 2017. [Google Scholar]
  13. Helbing, D.; Molnár, P. Social force model for pedestrian dynamics. Phys. Rev. E 1995, 51, 4282. [Google Scholar] [CrossRef] [PubMed] [Green Version]
  14. Jiang, Y.; Chen, B.; Li, X.; Ding, Z. Dynamic navigation field in the social force model for pedestrian evacuation. Appl. Math. Model. 2020, 80, 815–826. [Google Scholar] [CrossRef]
  15. Kang, Z.; Zhang, L.; Li, K. An improved social force model for pedestrian dynamics in shipwrecks. Appl. Math. Comput. 2019, 348, 355–362. [Google Scholar] [CrossRef]
  16. Zhou, R.; Cui, Y.; Wang, Y.; Jiang, J. A modified social force model with different categories of pedestrians for subway station evacuation. Tunn. Undergr. Space Technol. 2021, 110, 103837. [Google Scholar] [CrossRef]
  17. Zeng, W.; Nakamura, H.; Chen, P. A Modified Social Force Model for Pedestrian Behavior Simulation at Signalized Crosswalks. Procedia -Soc. Behav. Sci. 2014, 138, 521–530. [Google Scholar] [CrossRef] [Green Version]
  18. Guo, Y.; Ma, S.; Wei, F.; Lu, L.; Sun, F.; Wang, J. Analysis of Behavior Characteristics for Pedestrian Twice-Crossing at Signalized Intersections Based on an Improved Social Force Model. Sustainability 2022, 14, 2003. [Google Scholar] [CrossRef]
  19. Liu, B.; Liu, H.; Zhang, H.; Qin, X. A social force evacuation model driven by video data. Simul. Model. Pract. Theory 2018, 84, 190–203. [Google Scholar] [CrossRef]
  20. Yang, X.; Yang, X.; Li, Y.; Zhang, J.; Kang, Y. Obstacle avoidance in the improved social force model based on ant colony optimization during pedestrian evacuation. Phys. A Stat. Mech. Its Appl. 2021, 583, 126256. [Google Scholar] [CrossRef]
  21. Tao, J.N. The Momentum Theorem and the Momentum of Money: A Philosophical Reflection on the Velocity of Money. SSRN Electron. J. 2002. [Google Scholar] [CrossRef]
  22. Corbetta, A.; Muntean, A.; Vafayi, K. Parameter estimation of social forces in pedestrian dynamics models via a probabilistic method. Math. Biosci. Eng. 2015, 12, 337–356. [Google Scholar] [CrossRef] [PubMed]
  23. Wang, P. Understanding Social-Force Model in Psychological Principles of Collective Behavior. arXiv 2016, arXiv:1605.05146. [Google Scholar]
  24. Qin, P.; Zhao, Z.J. Intersection Safety Evaluation Model Based on Dynamic Energy Conversion Principle. Urban Transp. ChinaV 2019, 17, 102–113. [Google Scholar]
  25. Li, Q.; Shang, S.; Pei, X.; Wang, Q.; Zhou, Q.; Nie, B. Kinetic and Kinematic Features of Pedestrian Avoidance Behavior in Motor Vehicle Conflicts. Front. Bioeng. Biotechnol. 2021, 9, 783003. [Google Scholar] [CrossRef] [PubMed]
  26. Liang, H.; Du, J.; Wong, S. A Continuum model for pedestrian flow with explicit consideration of crowd force and panic effects. Transp. Res. Part B Methodol. 2021, 149, 100–117. [Google Scholar] [CrossRef]
  27. Wei, J.; Fan, W.; Guo, Y.; Hu, J.; Fang, Y. An extended social force model for pedestrian evacuation under disturbance fluctuation force. Int. J. Mod. Phys. C 2020, 31, 7. [Google Scholar] [CrossRef]
Figure 1. Examples of pedestrian crosswalk design and signal timings for two-stage crossing.
Sustainability 14 16615 g001
Figure 2. Pedestrian twice-crossing layout of the selected intersection.
Sustainability 14 16615 g002
Figure 3. Signal phase and timing of pedestrian twice-crossing at the selected intersection.
Sustainability 14 16615 g003
Figure 4. Locations of the four selected cross-sections.
Sustainability 14 16615 g004
Figure 5. Schematic diagram for tracking pedestrians.
Sustainability 14 16615 g005aSustainability 14 16615 g005b
Figure 6. Walking directions and interactive behavior of both sides in the four crossing sections.
Sustainability 14 16615 g006
Figure 7. The crossing speed distributions of the four cross sections.
Sustainability 14 16615 g007
Figure 8. Examples of pedestrian trajectory types on side A.
Sustainability 14 16615 g008
Figure 9. Distributions of the resultant force for the two path types.
Sustainability 14 16615 g009
Figure 10. Comparisons of different social force models.
Sustainability 14 16615 g010
Table 1. Timetable of pedestrians crossing cross sections.
Starting TimeSide A
S1S2S3S4AVG.
First31/35/…/5136/43/…/5640/48/…/0142/52/…/0744/53/…/0913
Middle32/54/…/3137/59/…/3640/02/…/4043/06/…/4246/09/…/4714
Last35/27/…/4341/33/…/5042/35/…/5143/36/…/3245/39/…/3412
Starting TimeSide B
S4S3S2S1AVG.
First31/43/…/2334/46/…/3640/52/…4142/53/…/4345/56/…/4614
Middle12/30/…/1117/35/…/1620/38/…/1924/42/…/2127/45/…/2618
Last12/43/…/5518/47/…/0121/50/…/0525/54/…/0927/56/…/1219
All the time units are second. First represents the first pedestrian crossing the stopline in a cycle. Middle refers to one middle pedestrian (selected randomly) crossing the stopline in a cycle. Last refers to the last pedestrian crossing the stopline in a cycle.
Table 2. Comparison of the attributes of the two trajectories.
Straight PathCurved PathRelationship
VelocityBegin v 1 v 2 v 1 v 1
End v 1 v 2 v 2 < v 2
Time t 1 t 2 t 1 > t 2
Distance s 1 s 2 s 1 < s 2
Table 3. Comparisons between the equations of the three social force models.
EquationClassic Model1st Version of Improved Model2st Version of Improved Model
Full F = F i + F i j + F i B F = F i + F ij + F iB + F s
Self-driving Force 1 τ α ( v α 0 e α v α ) 1 τ i { [ v i 0 e i 0 ( t ) ] av i }
Force from
surrounding pedestrians
r α β V α β [ b ( r α β ) ] r α i W α i ( | | r α i | | , t ) s i g n ( x ) j ( i ) A i C e x p [ ( r i j d j ) / B i ] n i j s i g n ( x ) j ( 1 ) A i C 2.8 a e x p [ r i j d j B i ] n i j
Force from
crosswalk boundary
r α β U α β ( | | r α β | | ) U B exp ( | | r B | | R )
Force from
Green signal Countdown
~ c [ 1 + ah ( Δ t ij ) + bg ( Δ v ij ) ] × t s / [ exp ( r i d s ) ] n s
Publisher’s Note: MDPI stays neutral with regard to jurisdictional claims in published maps and institutional affiliations.

