Abstract
With the need for a green economy and the introduction of low-carbon policies, more and more old buildings are being transformed to improve the thermal performance of buildings and reduce energy consumption. However, people ignore the village buildings and the old public buildings. Based on the investigation of a typical health center in Linyi City, this paper proposed improvement measures using EnergyPlus simulation software and JePlus parameter chemical tools. The various factors analyze the various parts of the enclosure, and the energy-saving effect of the roof is better than that of the exterior wall: When the thickness of the insulation layer gradually increases from 0 cm to 30 cm, the unit energy consumption of the building gradually decreases from 57 kW·h/m2 to 42.8 kW·h/m2, while that of the roof is gradually reduced to 24.41 kW·h/m2. Double exterior windows effectively reduce the energy consumption of the building in all renovation schemes. The optimal scheme is selected through the parameterized design of all the overall enclosure reconstruction schemes and the initial investments. The results showed that the investment recovery of the selected scheme was between 1.36–5.28 years. Plan 5 (12 cm XPS is used as insulation material for the exterior wall and roof, and the exterior window is replaced with 6 mm medium transmittance Low-e + 12 mm air + 6 mm clear) had the highest energy efficiency (91.11%). Plan 2 (6 cm XPS is used as insulation material for the exterior wall and roof, and the exterior window is replaced with 12 mm single medium transmittance heat-reflecting glass) had the shortest investment recovery period (2.04 years).
1. Introduction
In 2018, China revised relevant laws [1], incorporating energy conservation into legal provisions to supply relevant fields and strictly restrict energy use. Industry and buildings consume most of the energy. In particular, buildings consume a large amount of power and emit approximately 30% of greenhouse gas ions [2]. Through the “China Building Energy Consumption and Carbon Emission Research in 2021”, which was published online by the China Building Energy Efficiency Association and Chongqing University [3], it is shown that the energy consumption of buildings in the operation stage is 1.03 × 10⁹ tons of standard coal equivalent (TCE), and approximately one-fifth of the total energy consumption in China. With the development of building energy conservation, the concepts of energy conservation, green, zero energy consumption, and sustainable buildings have attracted more and more attention. In the evaluation standard for energy-saving buildings, GB/T 50668-2011, energy-saving buildings refer to the buildings designed and constructed in accordance with the local geographical environment and basic methods of energy conservation that meet or are better than the relevant national standards for energy conservation [4]. However, China’s energy conservation work is mainly concentrated in cities, and the progress of building energy conservation in rural areas is slower [5]. As time goes by, the performance of buildings’ envelope components declines due to environmental conditions, and it becomes urgent to transform or replace new envelope components to keep the building’s energy consumption within a reasonable range [6,7,8,9].
As typical public buildings in rural areas, township health centers generally have problems with long operation periods and high building energy consumption. The hospital has to pay excess energy consumption expenses instead of investing in medical treatment. Therefore, energy-saving measures are urgently needed. Building energy-saving measures mainly focus on envelope design, the layout of plane and space, orientation, and types of insulation materials [10,11,12]. Dominguez et al. [13] evaluated the potential of improving the envelope’s thermal performance to affect the energy demand of residential buildings. Astor et al. [14] believe that the primary way to reduce building energy consumption is to control and improve the thermal physical characteristics of the building envelope. Feng [15] studied the influence mode and effect of the heat transfer coefficient and building envelope thermal inertia index on building energy consumption. Yang et al. [16] found that under the condition of constant heat transfer coefficient, the increase in the heat storage coefficient would reduce the cooling load and increase the heat load of the building. Computer simulation technology, such as EnergyPlus, DOE2, EQuest, TRNSYS, and other energy simulation software and methods, have been developed and can determine the renovation methods and their effects on buildings. Some studies introduced the differences and characteristics of different simulation tools [17,18]. EnergyPlus is based on the heat balance method to calculate indoor air temperature and indoor load, where the heat transfer calculation of the envelope adopts the unsteady heat transfer method to calculate the building load more accurately. Hay Hau et al. [19] conducted a simulation study on the energy use of a single building, and the results showed that the heat transfer between the roof and the exterior wall is a leading cause of building load.
With the development of energy conservation research, the goal is to meet energy conservation standards and pay attention to the cost of energy conservation projects. Since the European Union put forward the concept of “cost optimization” in the building energy efficiency directive issued in 2010, scholars in most EU member states have combined energy-saving projects with the economy [20]. Chidiak et al. [21] used the discounted payback period to evaluate the profitability of energy efficiency measures. Kumbaroglu and Madlener [22] used a new NPV calculation method to assess the highest economic benefits of energy-saving renovation measures. Teng Shao and Wuxing Zheng [23] used Energy Plus and MOBO optimization engines to explore the influence of various factors on building energy consumption. Xinyi Hu and Hong Zhang [24] established a framework of active and passive energy-saving technologies to select the best economic transformation strategy for existing rural buildings. Kaynak [25] proposed to optimize the thickness of the insulation layer of the exterior wall, considering the costs and the payback period of the optimal insulation layer thickness. In reality, it is not easy to rely on a measure or technology to reduce building energy consumption effectively.
In this paper, a health center in the cold area of Linyi, Shandong Province, is taken as the research object. Energy-saving schemes are explored in the following steps: (1) assess the influence of renovation of the envelope structure on building energy consumption; (2) analyze the energy-saving effect of single and multiple renovations of external walls, roofs, and windows; and (3) select the best overall renovation program through economic analysis.
2. Research Area
2.1. Field Investigation and Model Selection
As shown in Figure 1, this survey is located in Linyi City in the southwest of Shandong Province, which is in a cold climate zone with short spring and autumn seasons and long winter and summer seasons; the average annual temperature is 14 °C, the average daily temperature is 27.1 °C in summer and 3.7 °C in winter, and the average monthly temperature and humidity of Linyi City are shown in Figure 2.
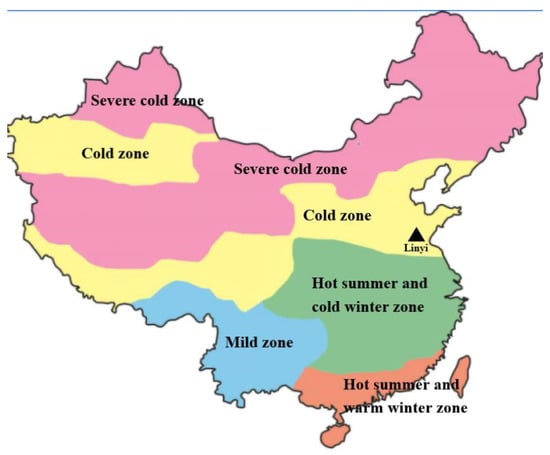
Figure 1.
The location of Linyi in China.
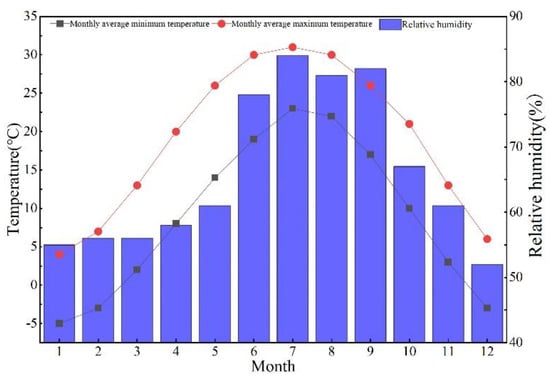
Figure 2.
The average monthly temperature and humidity of Linyi City.
The field survey of many township hospitals in Linyi city shows that most hospitals were built before this century, with the earliest one being built in the late 1970s. Most buildings are brick and concrete structures with three or four floors. The envelope’s thermal performance is poor, and there are generally no insulation measures for the exterior walls and roofs. After entering the twenty-first century, the vast majority of hospitals only repainted the external walls and replaced parts of the external windows and doors without any substantial energy-saving measures.
2.2. Model Selection
As shown in Figure 3, the selected building is a three-story brick and concrete structure built in the 1980s. This building is the outpatient building of a hospital. Figure 4 shows the three-floor plan of the building. The first floor and the second floor are designed to provide medical services, and the third floor is the office area. According to the hospital construction drawings, the external wall of the outpatient building is composed of sintered porous shale brick, while the floor and roof are mainly composed of precast concrete panels; they both do not have insulation measures. The exterior window has an aluminum frame and a single glass exterior window. Table 1 shows the composition of the building envelope.
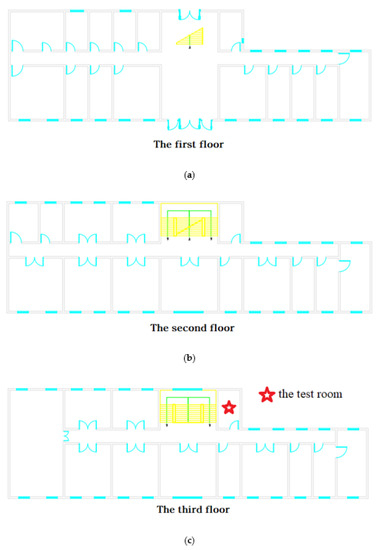
Figure 3.
Architectural plan of outpatient building; (a) the first floor; (b) the second floor; (c) the third floor. (the room marked in red is the test room).
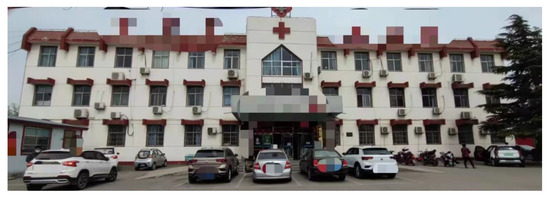
Figure 4.
The appearance of the hospital. (The facade is on the south side of the building).

Table 1.
The building envelope composition and heat transfer coefficient k value.
According to the environmental protection policy requirements, the hospital is not allowed to use coal-fired boilers for winter heating any more, and has therefore adopted split air conditioning for cooling in summer and heating in winter. According to the questionnaire given to hospital staff, a few rooms on the first floor are round-the-clock shops, while the rest are closed on national holidays. Table 2 shows the working hours and baseline temperatures of most rooms in the hospital on weekdays. Except for the energy consumption caused by heating and refrigeration, other energy consumption, such as lighting and medical equipment energy consumption, are not within the scope of this study.
Table 2.
The air conditioning schedule on weekdays.
2.3. Model Establishment and Validation
As shown in Figure 5, SketchUp is used to establish a model of the outpatient building of a township hospital. Field survey data provide the parameters for the model. Thermal properties are assigned through Open Studio, and thermal performance parameters are entered in EnergyPlus based on the actual practice of the building envelope.
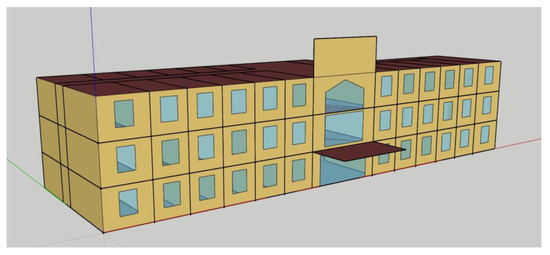
Figure 5.
The model of the hospital in SketchUp.
To verify the accuracy of the model and minimize the thermal disturbance of personnel, lighting, and equipment, the unused room on the third floor was selected for the thermal environment test (the room marked in red in Figure 4 is the test room, and Figure 6 is the actual photo of the test room), while the influence of indoor thermal disturbance was not considered in the simulation. The test was divided into outdoor and indoor parts, and the test parameters are indoor and outdoor air-dry bulb temperatures and relative humidity. The test was conducted from 13 February to 27 February 2022, with a frequency of one hour. The test instrument was the temperature and humidity recorder. Table 3 shows the information on the test instrument.
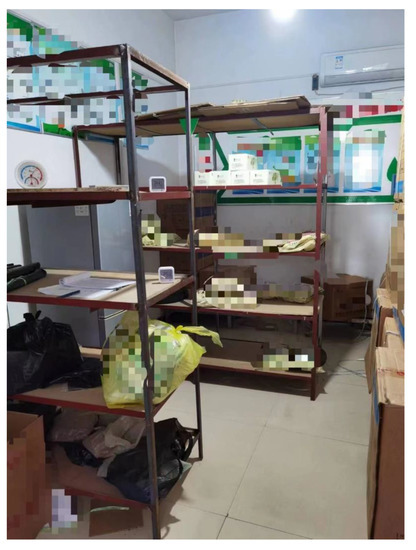
Figure 6.
The picture of the test room.
Table 3.
The picture and parameter of the test instrument.
During the simulation, the outdoor meteorological data, such as dry bulb temperature and relative humidity, replaced the corresponding data in the original meteorological files. Based on the multiple influences of air temperature on buildings, the simulated indoor temperature from 20 February to 27 February was selected to compare with the measured indoor temperature in the same period.
Figure 7 shows a comparison between the simulated and the measured indoor air temperatures. The simulated indoor air temperature in the room is consistent with the measured value, which is higher than the simulated value. The difference between the measured and the simulated temperatures is significant in the daytime. Since the selected test room was located in the office area, it was impossible to avoid the thermal disturbance of other rooms and personnel actions in the test room.
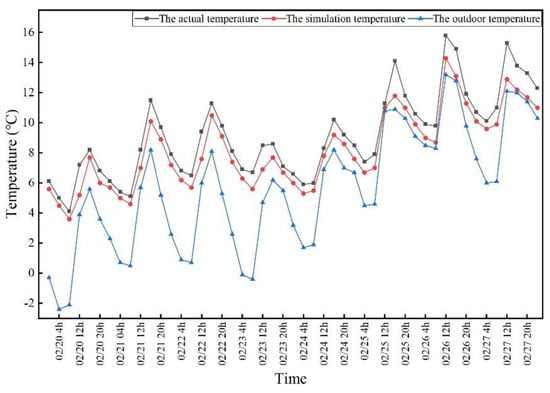
Figure 7.
A comparison between simulated and measured indoor air temperature.
The method to verify the accuracy of the model refers to the two evaluation indexes in the ASHRAE Guideline 14-2014 25: the standard mean deviation (NMBE) and the coefficient of variation of root mean square error (CVRMSE). NMBE is less than 10% and CVRMSE is less than 15%, indicating that the established model is consistent with the actual construction.
The calculation formula is as follows:
where represent the actual temperature, the simulation temperature, and the average actual temperature, respectively.
By putting the obtained temperature data into the formula, the calculated results of NMBE and CVRMSE were 9.9% and 11.1%, respectively, which were within the range required by the ASHRAE14-2014 specification; so it can be shown that the established model is consistent with the actual building.
3. Methods and Methodology
3.1. Building Energy Retrofit Strategies
In 1986, the outpatient building was composed of sintered porous rock tiles. There was no air-conditioning system, ceiling fans were used to assist cooling in summer, and water radiators were used to provide heating from coal-fired boilers in winter. The split-type air conditioner was subsequently installed for summer refrigeration, and the split-type air conditioner was also used for winter heating after removing coal-fired boilers. However, the lack of insulation on exterior components leads to significant energy losses.
Improving the thermal performance of the building envelope is one of the most important ways to reduce building energy consumption. Using simulation software and an optimization algorithm to optimize variables make it easier to realize the best energy-saving effect and economic benefit. However, the interaction between variables cannot be ignored in the study. Some studies show interactions between energy efficiency measures, and most existing studies focus on comparing the effects of individual energy-saving measures. The interaction between these measures may lead to the sum of the energy-saving potential of a single strategy being greater than that of the overall strategy. This paper uses EnergyPlus software and JePlus [26] parametric design tool to explore the impact of each part of the envelope on building energy consumption and the energy-saving effect of the overall transformation, and to calculate the best investment payback period of the overall transformation scheme through economic analysis.
The building has an external wall area of 1365 square meters and a roof area of 629 square meters; the exterior window area is 238.5 square meters, and the window-wall ratio of the building is 0.17. Their poor thermal properties require a large amount of capacity from the air-conditioning system to maintain the thermal environment of the rooms. In order to reduce the impact of the renovation project on the outpatient building, the existing window-wall ratio was not changed, and the external wall and roof were chosen as the form of external insulation. Based on local market research, Table 4 and Table 5 show the thermal performances of commonly used insulation materials and exterior window types.
Table 4.
The insulation material types and parameters.
Table 5.
The external window types and parameters.
3.2. Target
This paper simulates the building energy consumption value of different building renovation schemes through parametric design, and further calculates its energy saving rate. Finally, economic analysis is carried out to calculate the initial investment and payback period of each scheme.
3.2.1. Energy Saving Efficiency
The simulated value of parametric design is used as a reference for building energy saving transformation, and the energy saving efficiency, , after building transformation is calculated according to the following formula:
where is the unit energy consumption value of the building without reconstruction (kW·h/m2), and is the unit energy consumption value of the building after reconstruction (kW·h/m2).
3.2.2. Economic Indicators
Due to the limited economic conditions of township hospitals, the initial investment value of the renovation program is an important index. The initial investment, , of the program can be calculated as follows:
where is the price of thermal insulation material per cubic meter (CNY/m3), is the thickness of thermal insulation material, and is the area of the reconstructed nontransparent enclosure structure (m2). is the price per square meter of the exterior window (CNY/m2), and is the area of the renovated exterior window (m2).
After the initial investment in the renovation scheme is obtained, the payback period, , of the scheme can be further calculated according to the formula below:
where is the total area of the building (m2), a is the local electricity price (0.55 CNY/kW·h), i is the discount rate (10%), n is the number of years (years), NPV is the net present value, and is the number of years in which the present value of cumulative net cash flow is positive ().
4. Results and Discussion
4.1. Nontransparent Envelope Structure
The nontransparent enclosure structure occupies the highest proportion of the surface of the building, and the insulation material of the exterior wall and the roof is used to reduce the heat exchange between indoor and outdoor buildings [27]. External heat preservation is better than internal protection temperature [28], and the internal thermal insulation construction of the building will seriously affect the normal use of the building, while the external thermal insulation construction has little impact on the normal use of the building. Therefore, the transformation of the nontransparent envelope structure in this paper chooses the form of external insulation. Building energy consumption varies with the type and thickness of the insulation layer of the nontransparent envelope. This section analyzes the relationship between insulation layer thickness and building energy consumption per unit area through a parametric design of insulation layer thickness of nontransparent envelope structure. The thickness of each insulation material ranges from 1 cm to 30 cm with an interval of 1 cm.
4.1.1. External Walls and Roofs
The total energy consumption of the building decreases with the increase in exterior wall and roof insulation thickness. As shown in Figure 8, with the rise of the thickness of each type of insulation material, the energy consumption curve decreases significantly in the initial stage, then slows down, and then finally flattens out. The thermal performance of various thermal insulation materials is different, and the influence of the types of thermal insulation materials is also different. The better the thermal performance of fabrics (PUR > XPS > EPS ≈ SWB > PER), the better the building energy-saving effect is. For exterior walls and roofs, under the condition of the same material, the increase in roof insulation thickness has a significantly more substantial impact on unit energy consumption than that of the exterior wall. Taking PUR material, which has the best thermal performance, as an example, when the PUR thickness of the external wall increases from 0 to 8 cm, the energy consumption per unit area decreases from 57 kW·h/m2 to 44.6 kW·h/m2, decreasing by approximately 22%. When the PUR thickness of the roof increases from 0 to 8 cm, the energy consumption per unit area decreases from 57 kW·h/m2 to 26.5 kW·h/m2, decreasing by approximately 54%.
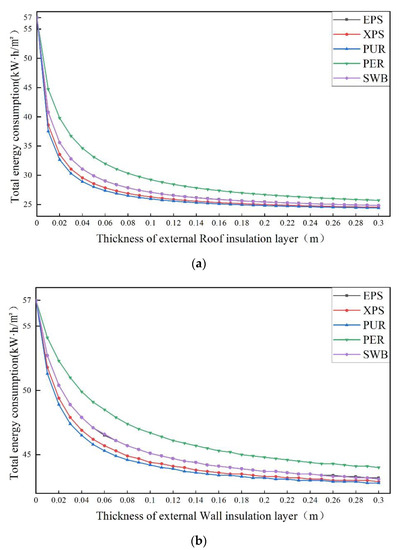
Figure 8.
The relationship between the thickness of insulation materials and total energy consumption of buildings: (a) roof; (b) wall.
In Figure 8, the SWB curve and EPS curve almost overlap, indicating that these two materials have a similar effect on the energy consumption of the building. So, when choosing insulation materials to reduce energy consumption, EPS and SWB can be equivalent.
4.1.2. Different Orientations of Exterior Walls
This section explores the influences of external walls with different orientations on building energy consumption. PUR thermal insulation material was selected to simulate the building’s south wall, north wall, and side wall (due to the small area of the east and west walls of the selected building, the side wall was considered uniformly). As shown in Figure 9, under the same thickness of insulation materials, the energy-saving effect of the north wall is the most significant, followed by the side wall, and then the south wall. When the north wall uses an 8 cm thick PUR insulation board, the building unit energy consumption decreased from 57 kW·h/m2 to 51.89 kW·h/m2, decreasing by approximately 9%, while the energy consumption decreased to 53.05 kW·h/m2 and 53.29 kW·h/m2, decreasing by approximately 6.9% and 6.5% for the side wall and south wall, respectively, under the same conditions.
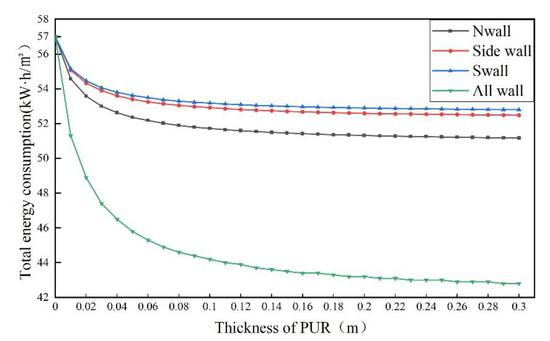
Figure 9.
The relationship between total energy consumption and the thermal insulation thickness of the exterior wall with different orientations.
Next, we set up five cases to explore the differences in heat loss through external walls under different conditions: case 1 is the heat loss through external walls throughout the year without taking any insulation measures, that is, when the building is in its initial state; case 2 covers the outer surface of the north wall with 8 cm PUR material; case 3 covers the outer surface of the south wall with 8 cm PUR material; case 4 covers the outer surface of the side wall with 8 cm PUR material; case 5 covers the entire exterior wall of the building with 8 cm of PUR material. The annual heat loss through the exterior wall of the five case is shown in the Figure 10. It can be seen that when a single modification is made to an external wall in one direction, the heat loss through the external wall in that direction will decrease, while the heat loss in other directions will increase. In the three cases of single reconstruction, the reconstruction of the north wall is better than that of the south wall and the side wall, because the reconstruction of the north wall can more effectively reduce the heat loss through the entire outer wall. When the external walls of all directions are reconstructed, the heat loss through the external walls of all directions is slightly greater than that of when the external walls of all directions are reconstructed separately.
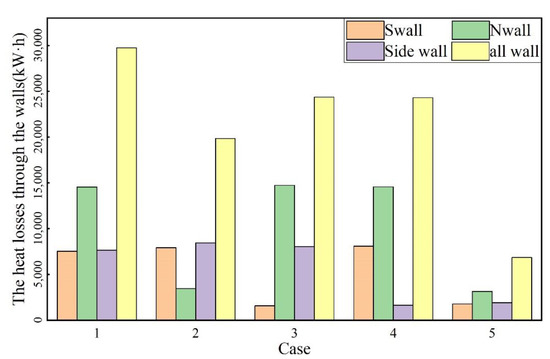
Figure 10.
The annual heat loss through the exterior wall.
4.1.3. The Overall External Walls and Roofs
As seen from Figure 11, when both the exterior wall and roof are reconstructed simultaneously with the increase in insulation layer thickness, the decrease in building energy consumption is more significant than that of a single renovation of the roof or exterior wall. Taking PUR material as an example, when the thickness of PUR material increases from 0 cm to 8 cm, the unit energy consumption of the building decreases from 57 kW·h/m2 to 11.69 kW·h/m2, decreasing by approximately 79.5%, while that of a single renovation roof and the exterior wall is 54% and 22%, respectively, indicating that the energy-saving effect of overall renovation exterior wall and roof is better.
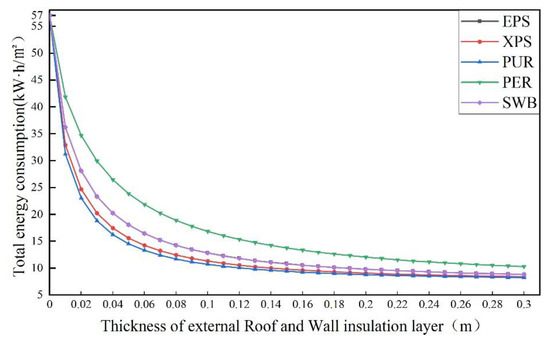
Figure 11.
The relationship between total energy consumption and nontransparent envelope insulation thickness.
4.2. Transparent Envelope Structure
The great thermal performance of external windows will reduce indoor and outdoor heat exchange and absorb solar radiation heat. As can be seen from Figure 12, compared with the poor thermal performance of a nontransparent building envelope, the effect of exterior windows on building unit energy consumption is more insignificant, and building energy consumption remains high. According to types 1, 2, and 3, increasing the thickness of outer window glass will increase the total energy consumption of the building. Types 4/5/6/7 indicate that using thermally reflective glass does not effectively reduce indoor load, and the lower the light transmittance, the higher the building’s energy consumption. Types 8/9 show that low-E glass exterior windows can reduce building energy consumption to a certain extent. According to type 1020, replacing double-layer glass can reduce energy consumption, but the average energy-saving efficiency is only 6%.
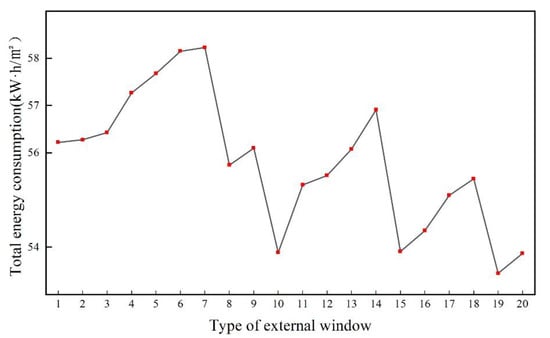
Figure 12.
The relationship between total energy consumption and thermal performance of exterior windows.
As shown in Figure 13, by comparing the month with the maximum cooling load (July) with the month with the total heat load (January), it can be found that the decrease in the heat transfer coefficient of the outer window will weaken the heat exchange between the indoor and outdoor environments. The increase in solar heat gain coefficient will increase the heat gain through the window in winter and decrease the heat load, but also increase the cooling load in summer. By comparing exterior windows with the same heat transfer coefficient, such as types 2/4, types 6/7, types 10/11/12, and types 16/17/18, it can be seen that under the same heat transfer coefficient, the increase in solar heat gain coefficient will reduce the unit energy consumption of the building; it can also reduce the cooling load in July and heat load in January for window types 15/16/19/20.
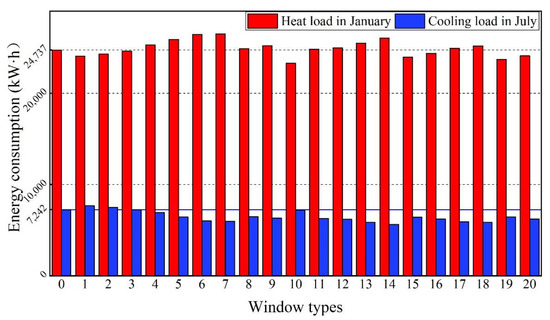
Figure 13.
The different types of exterior Windows after modification in January and July load.
4.3. Integral Envelope Structure in Different Orientations
This section, respectively, simulates the renovation of exterior walls and windows with the same and different orientations to analyze their influence on building energy consumption. The PUR thermal insulation material with good thermal performance is selected as an example. The common PUR thickness is 5–15 cm, and the step length is 1 cm. A typical type of exterior window is selected, and the material type and information are shown in Table 6.
Table 6.
The material type and information.
The building has no external windows from east to west, so only the influence of the north and south insulation layer thickness and the type of outer window on energy consumption was analyzed. As shown in Figure 14, for the north, with the increase in insulation material thickness, the building unit energy consumption still decreases and gradually slows down. Under the condition of the same thickness of insulation materials, the influence of all types of exterior windows on building energy consumption is 16 > 13 > 10 > 9 > 5 > 4 > 3. For the south, the building energy consumption of type 5 external windows is higher than that of the single reconstructed external walls, indicating that the reduction of solar heat from the south window will increase building energy consumption. Type 13 can save energy only when the PUR thickness exceeds 9 cm. Under the condition of the same thickness of insulation materials, the influence degree of all types of exterior windows on building energy consumption is 9 > 10 > 16 > 3 > 4 > 13 > 5.
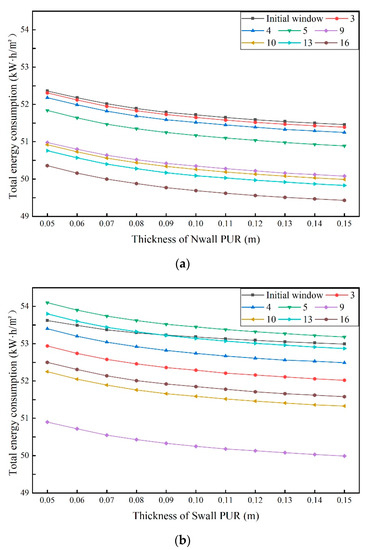
Figure 14.
The relationship between the thickness of the insulation layer in different directions and different types of windows and energy consumption: (a) north; (b) south.
For all of the building’s external walls and windows, their transformation of simulation results are shown in Figure 15. It can be seen that compared to only transforming the exterior wall, window transformation can further reduce the energy consumption of buildings, and the energy consumption reduction of the selected type of windows is ranked as 16 > 13 > 10 > 9 > 5 > 3 > 4. Double-glazed exterior windows still show better performance.
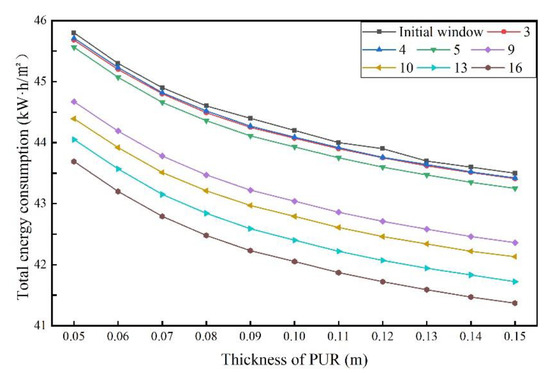
Figure 15.
The relationship between total energy consumption and the thermal performance of exterior windows.
4.4. All Types of Envelope Structures
For the building envelope renovation, insulation materials with the same type and thickness should be used for the roof and external wall. The thickness of insulation materials and exterior windows should be the same as Section 4.3. Table 7 shows the material type and information.
Table 7.
The material type and information.
Figure 16 shows the impact of the overall renovation of the envelope on building energy consumption. All the renovation schemes have significantly reduced the energy consumption of the building. When using EPS, PUR, and XPS, the energy consumption is 5.33–17.75 kW·h/m2, 3.48–14.35 kW h/m2 and 4.35–15.3 kW h/m2, respectively. Moreover, all kinds of exterior windows have different performances under the different thicknesses of thermal insulation materials: when the thickness of EPS, PUR, and XPS is, respectively, greater than 10 cm, 7 cm, and 7 cm, the influence of all types of exterior windows on building energy consumption is ranked as 16 > 13 > 10 > 9 > 5 > 4 > 3. The energy efficiency of external windows of types 3–5 is similar when the thickness is 5–7 cm. With the increase in thickness, the energy efficiency of external windows of type 5 is more evident than that of types 3/4; that is to say, with the improvement of the thermal performance of the nontransparent envelope, the heat gain of external windows has no energy-saving effect on the building. Compared with type 13 and type 16, the trend of energy savings for type 10 becomes slower with the increase in insulation material thickness. The curves of type 9 and type 16 have the same trend, showing the excellent energy-saving effect of low-E glass.
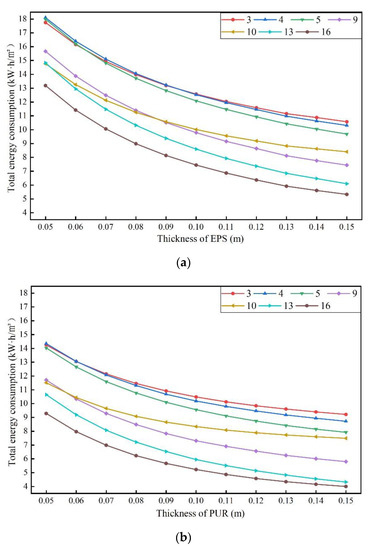
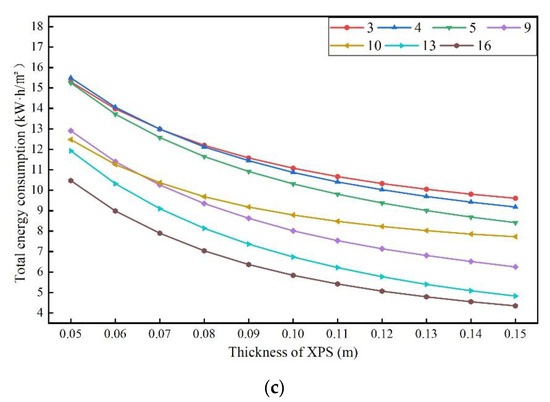
Figure 16.
The relationship between total energy consumption and thermal performance of exterior windows: (a) EPS; (b) PUR; and (c) XPS.
The choice of building energy-saving and renovation plan requires the analysis of energy consumption and cost [29,30]. The above initial investment amounts of the overall reconstruction scheme show all the initial investment amounts are between 50,000 and 375,000; the increase in the initial investment will not necessarily lower energy consumption. Then, by setting the initial minimum investment amount as the standard, early investment screening increased the energy loss scheme, namely the red point in Figure 17. The schemes represented by the red dots are more valuable for investment, and the payback period of all schemes represented by red dots is calculated.
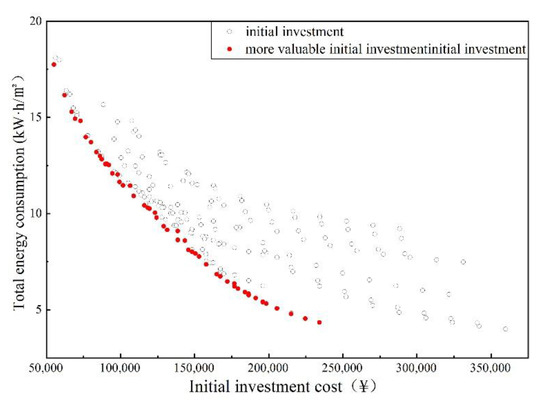
Figure 17.
Initial investment of all renovation schemes.
As shown in Figure 18, the payback period of the scheme with an initial investment between 50,000 and 80,000 is between 1 and 1.7 years; the payback period of the scheme with an initial investment between 80,000 and 12000 is between 2 and 2.6 years; the payback period of the initial investment between 120,000 and 165,000 is between 3 and 3.5 years; the payback period of the initial investment between 165,000 and 200,000 is between 4 and 4.4 years; the payback period for projects with an initial investment between 200,000 and 235,000 is between 5–5.5 years.
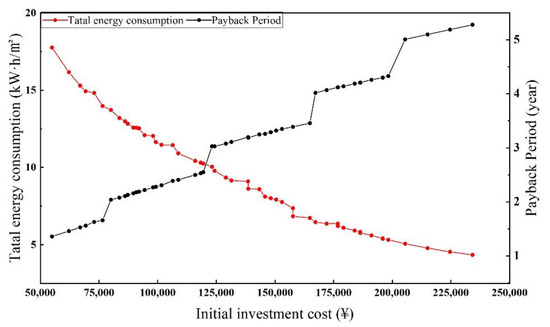
Figure 18.
The payback period of the more investment-worthy scheme.
With the same interval, the investment recovery of the case presenting the relationship between the line and the initial points between the districts is more likely to be chosen. Table 8 shows the information about the transformation plan for the initial value between the various districts. From the aspects of investment recovery and initial investment, Plan 1 has the lowest initial investment and the shortest investment recovery period. In terms of energy efficiency, Plan 5 has the highest energy-saving rate (91.11%).
Table 8.
Parameters of the energy-saving transformation scheme.
According to the requirements of the public building energy-saving design standard GB50189 [31], the thermal performance of the nontransparent building envelope is calculated using the thickness of different types of insulation materials required to retrofit the roof and exterior walls, as shown in Table 9.
Table 9.
Thickness of insulation required to retrofit roof and exterior walls.
When the insulation material of the same thickness is used for the roof and exterior wall in the renovation scheme, the required thickness of the roof should be satisfied. So, Plan 1 does not meet the requirements of energy saving standards.
5. Conclusions
Currently, public buildings in rural areas in China have long construction times, serious aging of envelope structures, and high building energy consumption, which curb the development of rural areas and environmental protection. The effective way to solve the problem is to formulate the appropriate building energy-saving scheme through building energy consumption simulations. Taking a village health center in Linyi city as an example, this paper carried out the optimization simulation of single and multiple parts of the envelope structure and determined the energy-saving renovation scheme. According to the research results, the following conclusions can be drawn:
1. For the transformation of the nontransparent envelope structure, the better the thermal performance of the insulation material, the more significant the energy-saving effect; the building energy consumption decreases with the increase in the thickness of the insulation material, but the reduction trend of the building energy consumption will be smaller and smaller. In terms of the influence of a nontransparent envelope on building energy consumption, using materials with the same type and thickness, the energy-saving benefit of a single roof renovation is better than that of a single renovation of the exterior wall. The energy-saving efficiency of the north wall is better than that of the side wall, and the energy-saving efficiency of the south wall is the worst.
2. For the transformation of the transparent envelope, the influence of the nontransparent envelope on building energy consumption is shown in two aspects: First, the heat transfer coefficient of the outer window, where the smaller the heat transfer coefficient, the better the energy-saving effect. The second is the solar heat gain coefficient of the outer window, where the solar heat gain will increase the cooling load in the summer and reduce the heating load in the winter. In the case of poor thermal performance of nontransparent envelopes, using the exterior window of the thermal reflection class will increase the energy consumption of the building.
3. For the renovation of each orientation envelope structure, in the case of single orientation renovation with the same measures, the energy-saving effect of the renovation of the north orientation envelope structure is better than that of the south orientation envelope structure; the south-facing envelope is suitable for the use of low light transmittance type of external windows.
4. The overall building envelope transformation can effectively reduce the building’s energy consumption, and the energy consumption of the renovated buildings is between 3.48 and 17.75, and the initial investment in the case is between 50,000 and 375,000. To select the plan for the more worthwhile investment, the case with a recovery period of between 2.04 and 5.5 years is calculated and determined: the initial investment recovery period of Plan 2 is the shortest; Plan 5 has the highest energy efficiency (91.11%).
Author Contributions
Funding acquisition, W.W.; Investigation, S.G.; Methodology, S.G.; Resources, W.W.; Software, S.G. and Y.Z.; Visualization, Y.Z.; Writing—original draft, S.G.; Writing—review—editing, W.W. All authors have read and agreed to the published version of the manuscript.
Funding
This work was supported by the National Natural Science Foundation of China Study on Thermal Protection Mechanism and Tectonic System of Buildings in Turpan Area (Grant No. XJEDU2019I006).
Institutional Review Board Statement
Not applicable.
Informed Consent Statement
Informed consent was obtained from all subjects involved in the study.
Data Availability Statement
The data used to support the findings of this study are included within the article.
Conflicts of Interest
The authors declare no conflict of interest.
References
- Li, Y. Study of the effect of environmental education on environmental awareness and environmental attitude based on environmental protection law of the People’s Republic of China. Eurasia J. Math. Sci. Technol. Educ. 2018, 14, 2277–2285. [Google Scholar] [CrossRef] [PubMed]
- Tang, Q.; Chen, Y.; Jia, R.; Guo, W.; Chen, W.; Li, X.; Gao, H.; Zhou, Y. Effect of clay type and content on the mechanical properties of clayey silt. J. Pet. Sci. Eng. 2023, 220, 111203. [Google Scholar] [CrossRef]
- Hu, S.; Jiang, Y.; Yan, D. Energy Consumption and Carbon Emission from Buildings in China in 2021; Springer: Berlin/Heidelberg, Germany, 2022. [Google Scholar]
- Wu, Y.; Wang, J.-Y.; Monteiro, P.J.; Zhang, M.-H. Development of ultra-lightweight cement composites with low thermal conductivity and high specific strength for energy efficient buildings. Constr. Build. Mater. 2015, 87, 100–112. [Google Scholar] [CrossRef]
- Zou, Y.; Song, B.; Liu, J. An interpretation of the national standards for energy efficiency design of rural residential buildings. Heat. Vent. Air Cond 2013, 43, 77–81. [Google Scholar]
- Wang, B.; Xia, X.; Zhang, J. A multi-objective optimization model for the life-cycle cost analysis and retrofitting planning of buildings. Energy Build. 2014, 77, 227–235. [Google Scholar] [CrossRef]
- Zhou, W.; Xia, X.; Wang, B. Improving building energy efficiency by multi-objective neighborhood field optimization. Energy Build. 2015, 87, 45–56. [Google Scholar]
- Zhou, W.; Wang, B.; Xia, X. Large-scale building energy efficiency retrofit: Concept, model and control. Energy 2016, 109, 456–465. [Google Scholar]
- Wang, B.; Xia, X. Optimal maintenance planning for building energy efficiency retrofitting from optimization and control system perspectives. Energy Build. 2015, 96, 299–308. [Google Scholar] [CrossRef]
- Rijal, H.B.; Yoshida, K.; Humphreys, M.A.; Nicol, J.F. Development of an adaptive thermal comfort model for energy-saving building design in Japan. Archit. Sci. Rev. 2021, 64, 109–122. [Google Scholar] [CrossRef]
- Gou, S.; Nik, V.M.; Scartezzini, J.L.; Zhao, Q.; Li, Z. Passive design optimization of newly-built residential buildings in Shanghai for improving indoor thermal comfort while reducing building energy demand. Energy Build. 2018, 169, 484–506. [Google Scholar] [CrossRef]
- Fang, Z.; Li, N.; Li, B.; Luo, G.; Huang, Y. The effect of building envelope insulation on cooling energy consumption in summer. Energy Build. 2014, 77, 197–205. [Google Scholar] [CrossRef]
- Domínguez, S.; Sendra, J.J.; León, A.L.; Esquivias, P.M. Towards energy demand reduction in social housing buildings: Envelope system optimization strategies. Energies 2012, 5, 2263–2287. [Google Scholar] [CrossRef]
- Niccolò, A.; Angelotti, A.; Buzzetti, M. The influence of the external walls thermal inertia on the energy performance of well-insulated buildings. Energy Build. 2009, 41, 1181–1187. [Google Scholar]
- Ya, F. Thermal design standards for energy efficiency of residential buildings in hot summer/cold winter zones. Energy Build. 2004, 36, 1309–1312. [Google Scholar]
- Yang, L.; Hou, L.; Liu, J.; Qiao, Y.; Liu, Y. Analysis of influence of heat storage performance of envelope structure on building load. J. Sol. Energy 2018, 39, 9. [Google Scholar]
- Sola, A.; Corchero, C.; Salom, J.; Sanmarti, M. Simulation tools to build urban-scale energy models: A review. Energies 2018, 11, 3269. [Google Scholar] [CrossRef]
- Li, X.; Wang, Y.; Hu, Y.; Zhou, C.; Zhang, H. Numerical Investigation on Stratum and Surface Deformation in Underground Phosphorite Mining Under Different Mining Methods. Front. Earth Sci. 2022, 10, 831856. [Google Scholar] [CrossRef]
- Huo, H.; Shao, J.; Huo, H. Contributions of energy-saving technologies to building energy saving in different climatic regions of China. Appl. Therm. Eng. 2017, 124, 1159–1168. [Google Scholar] [CrossRef]
- Ballarini, I.; Corgnati, S.P.; Corrado, V. Use of reference buildings to assess the energy-saving potentials of the residential building stock: The experience of TABULA project. Energy Policy 2014, 68, 273–284. [Google Scholar] [CrossRef]
- Chidiac, S.; Catania, E.; Morofsky, E.; Foo, S. A screening methodology for implementing cost-effective energy retrofit measures in Canadian office buildings. Energy Build. 2011, 43, 614–620. [Google Scholar] [CrossRef]
- Kumbaroğlu, G.; Madlener, R. Evaluation of economically optimal retrofit investment options for energy savings in buildings. Energy Build. 2012, 49, 327–334. [Google Scholar] [CrossRef]
- Shao, T.; Zheng, W.; Cheng, Z. Passive Energy-Saving Optimal Design for Rural Residences of Hanzhong Region in Northwest China Based on Performance Simulation and Optimization Algorithm. Buildings 2021, 11, 421. [Google Scholar] [CrossRef]
- Hu, X.; Xiang, Y.; Zhang, H.; Lin, Q.; Wang, W.; Wang, H. Active–passive combined energy-efficient retrofit of rural residence with non-benchmarked construction: A case study in Shandong province, China. Energy Rep. 2021, 7, 1360–1373. [Google Scholar] [CrossRef]
- ASHRAE Guideline 14-2014, Measurement of Energy, Demand, and Water Savings. Available online: https://upgreengrade.ir/admin_panel/assets/images/books/ASHRAE%20Guideline%2014-2014.pdf (accessed on 27 November 2022).
- Gobakis, K.; Kolokotsa, D. Coupling building energy simulation software with microclimatic simulation for the evaluation of the impact of urban outdoor conditions on the energy consumption and indoor environmental quality. Energy Build. 2017, 157, 101–115. [Google Scholar] [CrossRef]
- Zhang, Y.; Jankovic, L. An interactive optimisation engine for building energy performance simulation. Build. Simul. 2017, 2232–2241. [Google Scholar] [CrossRef]
- Mondal, A.H.; Klein, D. Impacts of solar home systems on social development in rural Bangladesh. Energy Sustain. Dev. 2011, 15, 17–20. [Google Scholar] [CrossRef]
- Liu, Y.; Liqiang, H.; Jiang, L. The impact analysis of the thermal properties of the enclosure on the construction load. Acta Energ. Sol. Sin. 2018, 11, 3138–3146. [Google Scholar]
- Harkouss, F.; Fardoun, F.; Biwole, P.H. Multi-Objective Optimization Methodology for Net Zero Energy Buildings. J. Build. Eng. 2018, 16, 57–71. [Google Scholar] [CrossRef]
- GB50189-2015; Design Standard for Energy Efficiency of Public Buildings. China Architecture and Building Press: Beijing, China, 2015.


Publisher’s Note: MDPI stays neutral with regard to jurisdictional claims in published maps and institutional affiliations. |
© 2022 by the authors. Licensee MDPI, Basel, Switzerland. This article is an open access article distributed under the terms and conditions of the Creative Commons Attribution (CC BY) license (https://creativecommons.org/licenses/by/4.0/).