Article

Effects of the Application of Nutrients on Soil Bacterial Community Composition and Diversity in a Larix olgensis Plantation, Northeast China

1
Center for Ecological Research, Northeast Forestry University, Harbin 150040, China
2
Ministry of Education Key Laboratory of Sustainable Forest Ecosystem Management, Northeast Forestry University, Harbin 150040, China
3
College of Foreign Languages, Northeast Forestry University, Harbin 150040, China
*
Author to whom correspondence should be addressed.
Sustainability 2022, 14(24), 16759; https://doi.org/10.3390/su142416759
Submission received: 27 October 2022 / Revised: 8 December 2022 / Accepted: 13 December 2022 / Published: 14 December 2022

Abstract

:
Bacteria are among the most critical components in soil. The application of nutrients as an important management measure to maintain soil fertility can affect the structure of soil bacterial communities. The objective of this study was to explore the influence of the application of nutrients on the soil bacterial community composition and diversity in a Larix olgensis Henry plantation after thinning using Illumina high-throughput sequencing technology. In July 2015, a middle-aged (27 years old) Larix olgensis forest, afforested in the spring of 1988 (thinning was conducted in the winter of 2012), in MengJiagang National Forest Farm, Jiamusi City, China, was assessed. Four fertilizer treatments were applied, each replicated three times: nitrogen (N, 250 kg/ha); nitrogen + phosphorus (NP, nitrogen 250 kg/ha + phosphorus 50 kg/ha); nitrogen + phosphorus + potassium (NPK, nitrogen 250 kg/ha + phosphorus 50 kg/ha + potassium 30 kg/ha); and a control (CK, no fertilizer). In mid-August 2018, soil samples of a 0–10 cm soil layer were collected; the diversity and composition of soil bacteria under different the application of nutrients conditions were determined by Illumina high-throughput sequencing technology on the MiSeq platform. Our results found that: (1) compared with the CK treatment, long-term the application of nutrients significantly reduced the soil pH and soil total potassium content (p < 0.05); and (2) the continued application of nutrients increased the Chao1 richness index of the soil bacteria in the Larix olgensis plantation (p < 0.05); (3) soil organic carbon and soil total nitrogen were key drivers of the soil bacterial community structure. Therefore, the different long-term the application of nutrients regimes did not affect the stability of the soil ecosystem in the Larix olgensis plantation.

1. Introduction

Soil microorganisms are an important component of the soil ecosystem and are among the most active and decisive soil components [1]. They promote nutrient cycling and plant growth through their metabolism; hence, they are an important source of the available nutrients in the soil [2]. Bacteria are important components in 70% to 90% of soil microorganisms, representing important indexes for the quality of soil and plants [3,4].
The productivity of artificial forests in China is mostly lower than that of forests at the same latitude elsewhere in the world [5]. In addition to forests’ individual biological factors, inadequate management might be the main reason for this disparity [6]. For example, in the northeast forest region, the previous management method was untimely single tending and thinning operations without any exogenous energy input [7]; the thinning residues were mostly made into industrial chips or directly removed from the forest land for firewood. Stand productivity was usually not improved by simple thinning after canopy closure without the application of nutrients [8]. Most of the forest productivity operations internationally are superior to those in China. In addition to the timely intense thinning after canopy closure, a large amount of exogenous energy input (such as the application of nutrients) is an important reason [8,9].
In recent years, there have been few studies on the composition of forest soil microbial communities after thinning combined with the application of nutrients measures, mainly focusing on farmland in China [10,11]. There have been some studies on soil bacteria in plantations under single-application of nutrients, and scientific controversies around the effects of different the application of nutrients measures on the structure and diversity of the forest soil bacterial community have been presented. For example, Guan [12] demonstrated that the application of nutrients reduced the soil bacterial richness and diversity indices in Catalpa bungei plantations. Li Chao et al. [13] revealed that the application of nutrients significantly altered the relative abundance of the dominant soil bacterial phyla, increased the soil bacterial richness, and decreased the bacterial diversity index in Eucalyptus plantations. In addition, the application of nitrogen increased the soil bacterial diversity in Schima superba plantation and the relative abundance of Proteobacteria in Pinus massoniana plantation [14]. According to Wei et al. [15], the application of nitrogen significantly altered the soil bacterial community structure and reduced soil bacterial biomass in Picea koraiensis plantation. In contrast, the application of nitrogen did not affect the soil bacterial biomass in temperate broad-leaved and coniferous forests [16]. The physical and chemical properties of soil are significantly altered under long-term the application of nutrients conditions, and the changes in soil bacteria are inconsistent under different forest types after the application of nutrients. Given the inconsistencies in the effects of the application of nutrients on soil bacterial community structure and diversity under different forest types, in-depth and extensive research on the structure and diversity of soil bacterial communities under different forest types after the application of nutrients is needed.
Larch (Larix olgensis Henry) is one of the main plantation tree species in northeast China. It is important in timber supply, improving the ecological environment, and alleviating the effects of climate change [17]. Thinning is an important management strategy for improving forest wood production [8,18]. However, to the best of the authors’ knowledge, there have been no studies on the influence of the application of nutrients after thinning on soil microbial diversity and community composition in Larix olgensis plantation. At present, the long-term effects of the application of nutrients on soil bacteria communities in larch plantations are still assessed using the traditional culture methods, such as the plate mixed culture and chloroform fumigation extraction methods [19]; hence, it lacks in-depth analysis using the more precise high-throughput sequencing technology. Herein, we employed high-throughput sequencing technology to analyze the soil bacterial community and diversity in larch plantations following long-term nitrogen, phosphorus, and potassium the application of nutrients. We aimed to establish: (1) the effects of different fertilizers on the soil bacterial community structure and diversity; and (2) which soil chemical factors are the key drivers of the soil bacterial community structure and diversity under different the application of nutrients regimes. The findings in this study can provide a theoretical basis for understanding the soil bacterial diversity response and community structure response to the application of nutrients after thinning performed at the same intensity. In addition, it can provide a scientific basis for optimizing the management of soil microbial community structures in larch plantations.

2. Materials and Methods

2.1. Site Description

This study was conducted in MengJiagang National Forest Farm (46°20′16″~46°30′50″ N, 130°32′42″~130°52′36″ E), Heilongjiang Province, China. The farm consists of Quercus mongolica, Betula davurica, Populus davidiana, Larix olgensis, and Betula platyphylla as the major tree species for timber production. The area is hilly with a continental monsoon climate and alfisol soil type. The mean annual air temperature and precipitation are 2.7 °C and 535 mm, respectively. In 2015, a 4 hm2 middle-aged larch plantation in an 82 forest class 23 sub-compartment (west of seed orchard) was selected for the present study. The larch plantation was established in a flat, natural, open forest in the spring of 1988, and the first thinning was conducted in the winter of 2012. Before establishing the larch plantation, the secondary poplar–birch forest afforested in the area was clear-cut. The average diameters at breast height (DBH) of four treatments (in 2015, at 28 years old) were 14.2 cm, 13.4 cm, 13.3 cm, and 13.7 cm, respectively. Three years after the application of nutrients, the average DBH/cm (in 2018, 31 years old) values were 15.2 cm, 14.5 cm, 14.5 cm, and 14.8 cm; the average stand DBH regular growth rates were 6.58%/3a, 7.59%/3a, 8.28%/3a, and 37.43%/3a; the DBH after the nutrient application treatment was 0.85–1.70%/3a higher than that after the CK treatment.
The soil chemical properties after the application of nutrients are shown in Table 1. The different nutrient application treatments did not significantly affect the soil total nitrogen (TN), total phosphorus (TP), soil organic carbon (SOC), or available phosphorus (AP) concentrations in the larch plantation (Table 1). However, the soil pH and total potassium (TK) were significantly decreased (Table 1, p < 0.05). The TK content decreased by 48.9%, 38.66%, and 22.52% in the N, NP, and NPK treatments compared with the CK treatment, respectively. Although the available potassium (AK) concentration was increased in the respective treatments, the difference was significantly high under the NPK treatment (p < 0.05). Three years after the application of nutrients, the average regular growth rate of the DBH was 7.43–8.28%/3a, whereas the growth rate with the CK treatment was 0.85–1.70%/3a.

2.2. Experimental Design and Soil Sample Collection

Twelve experimental plots (340 m2 each) were established in July 2015. The plots were divided into four groups representing four treatments, replicated three times: nitrogen nutrient application (N, 250 kg/ha), nitrogen + phosphorus nutrient application (NP, nitrogen 250 kg/ha + phosphorus 50 kg/ha), nitrogen + phosphorus + potassium nutrient application (NPK, nitrogen 250 kg/ha + phosphorus 50 kg/ha + potassium 30 kg/ha), and control (CK, no nutrient application). Nitrogen, phosphorus, and potassium were applied as urea, hydrogen phosphate diamine, and potassium chloride, respectively, using the uniform hole application method between rows in a single application, then covering the fertilizer with soil. The number of nutrient application holes in each row was 20–25. The distance between different treatments was 30–40 m; the distance between repeated plots was 10 m. The quantities of the nutrients were based on a recommendation from the Ministry of Education Key Laboratory of Sustainable Forest Ecosystem Management, Northeast Forestry University, referring to the fertilization standard of Northeast Forest area.
In mid-August 2018, soil samples were randomly collected at 0–10 cm soil layer in five sampling points per plot. The five samples per plot were homogenized into a composite sample, and passed through a 2 mm sterile sieve to remove roots, wood fragments, and barks [19]. Each composite sample was divided into two parts, placed in sterile sealed bags, labeled, and immediately placed in ice boxes at 4 °C, then transported to the laboratory. One part of each composite sample was stored at −80 °C in the refrigerator awaiting DNA extraction and bacterial diversity analysis. The other part was used for the determination of the soil chemical properties.

2.3. Soil Chemical Properties and Biological Analysis

2.3.1. Chemical Properties Analysis

The soil pH was measured using a potentiometric pH meter (soil: 1 mol/L KCL solution extract in the ratio of 1:2.5, w/v). The soil organic carbon content was determined using a multiN/C 2100S analyzer (Elementar VarioELIII, Hanau, Germany) and the soil total nitrogen (TN) using the acid digestion–indophenol blue colorimetric method [20]. The soil total potassium (TK) and soil available potassium (AK) were determined using the acid digestion–flame atomic absorption method, and soil total phosphorus (TP) using the acid digestion–molybdenum antimony resistance colorimetric method [21]. The soil available phosphorus (AP) was determined using the hydrochloric acid, ammonium fluoride leaching/sodium bicarbonate leaching–molybdenum antimony anti-colorimetric method [20].

2.3.2. DNA Extraction and PCR Amplification

Total soil DNA was extracted from all samples using the E.Z.N.A.® soil DNA Kit (Omega Bio-tek, Norcross, GA, USA) according to the manufacturer’s instructions. The DNA extract was checked on 1% agarose gel, and DNA concentration and purity were determined with a NanoDrop 2000 UV–vis spectrophotometer (Thermo Scientific, Wilmington, DE, USA). The hypervariable regions V3–V4 of the bacterial 16S rRNA gene were amplified with primer pairs 338F (5′-ACTCCTACGGGAGGCAGCAG-3) and 806R (5′-GGACTACHVGGGTWTCTAAT-3′) [22] by an ABI GeneAmp® 9700 PCR thermocycler (ABI, Vernon, CA, USA). PCR amplification of 16S rRNA gene was performed as follows: initial denaturation at 98 °C for 5 min, followed by 25 cycles of denaturing at 98 °C for 30 s, annealing at 52 °C for 30 s and extension at 72 °C for 60 s, and single extension at 72 °C for 5 min, ending at 4 °C. The PCR mixtures contained 5 × TransStart FastPfu buffer 4 μL, 2.5 mM dNTPs 2 μL, forward primer (5 μM) 0.8 μL, reverse primer (5 μM) 0.8 μL, TransStart FastPfu DNA Polymerase 0.4 μL, template DNA 10 ng, and, finally, ddH2O up to 20 μL. PCR assays were performed in triplicate. The PCR product was extracted from 2% agarose gel and purified using the AxyPrep DNA Gel Extraction Kit (Axygen Biosciences, Union City, CA, USA), according to the manufacturer’s instructions, and quantified using Quantus™ Fluorometer (Promega, Carlsbad, CA, USA).
Purified amplicons were pooled in equimolar and paired-end sequenced on an Illumina MiSeq PE300 platform/NovaSeq PE250 platform (Illumina, San Diego, CA, USA), according to the standard protocols by Majorbio Bio-Pharm Technology Co., Ltd. (Shanghai, China). All 16S rRNA gene sequence datasets derived from Illumina MiSeq sequencing were submitted to the NCBI Sequence Read Archive (SRA) under accession number SRP411512.

2.4. Bioinformatics

The raw fasta sequences were processed using QIIME 2 (quantitative insights into microbial ecology) pipeline (University of Wisconsin System, Madison, WI, USA, Version 2.0) [23] and merged by FLASH Version 1.2.7 [24] using the following criteria. (1) The 300 bp reads were truncated at any site with an average quality score of <20 over a 50 bp sliding window. Truncated reads shorter than 50 bp and reads containing ambiguous characters were discarded. (2) Only overlapping sequences longer than 10 bp were assembled. The maximum mismatch ratio in the overlap region was 0.2. Reads that could not be assembled were discarded. (3) Sequences were distinguished based on the barcode and primers. The sequence direction was adjusted to exact barcode matching and two nucleotide mismatches in primer matching.
Operational taxonomic units (OTUs) with a similarity cutoff of 97% [25,26] were clustered using UPARSE (Shanghai Meiji Biomedical Technology Co., Ltd. Shanghai, China, Version 7.1) [25]. Next, the chimeric sequences were identified and removed. The taxonomy of each OTU representative sequence was analyzed by ribosomal database project Classifier Version 2.2 [27] against the 16S rRNA database (Silva v128) using a confidence threshold of 0.7. OTU—level α—diversity indices, including the richness, Chao1, and Shannon index, were calculated using the OTU table in QIIME. Venn diagrams were generated using the ‘vegan’ package in R statistical package [28].

2.5. Statistical Analyses

Non—metric multidimensional scaling (NMDS) was conducted based on the Bray −Curtis dissimilarity at the OTU level [29,30]. Pearson correlation analyses between the soil bacterial α diversity and the soil physical and chemical properties, and the correlation between the relative abundance of dominant bacterial groups and soil chemical properties, were performed using SPSS 17.0. Redundancy analysis (RDA) and distance-−based redundancy analysis (db-−RDA) were used to analyze the OTUs agglomerated at the phylum and genus level to generate the compositional profiles using the ‘vegan’ R package. Indicator species at the OTU level were analyzed as outlined by Rime et al. [31] and Frey et al. [32] using the ‘vegan’ and ‘labdsv’ packages in R [28]. FAPROTAX codes and data were downloaded from https://report.majorbio.com/meta/faprotax/task_id/sanger_119353.html?v= (accessed on 22 September 2022).
One—way analysis of variance (ANOVA) was used to analyze the differences in the soil chemical properties among the four nutrient application treatments at a 0.05 level of significance using SPSS 17.0 software (SPSS Inc., Chicago, IL, USA). The differences between the means were separated using Duncan’s test.

3. Results

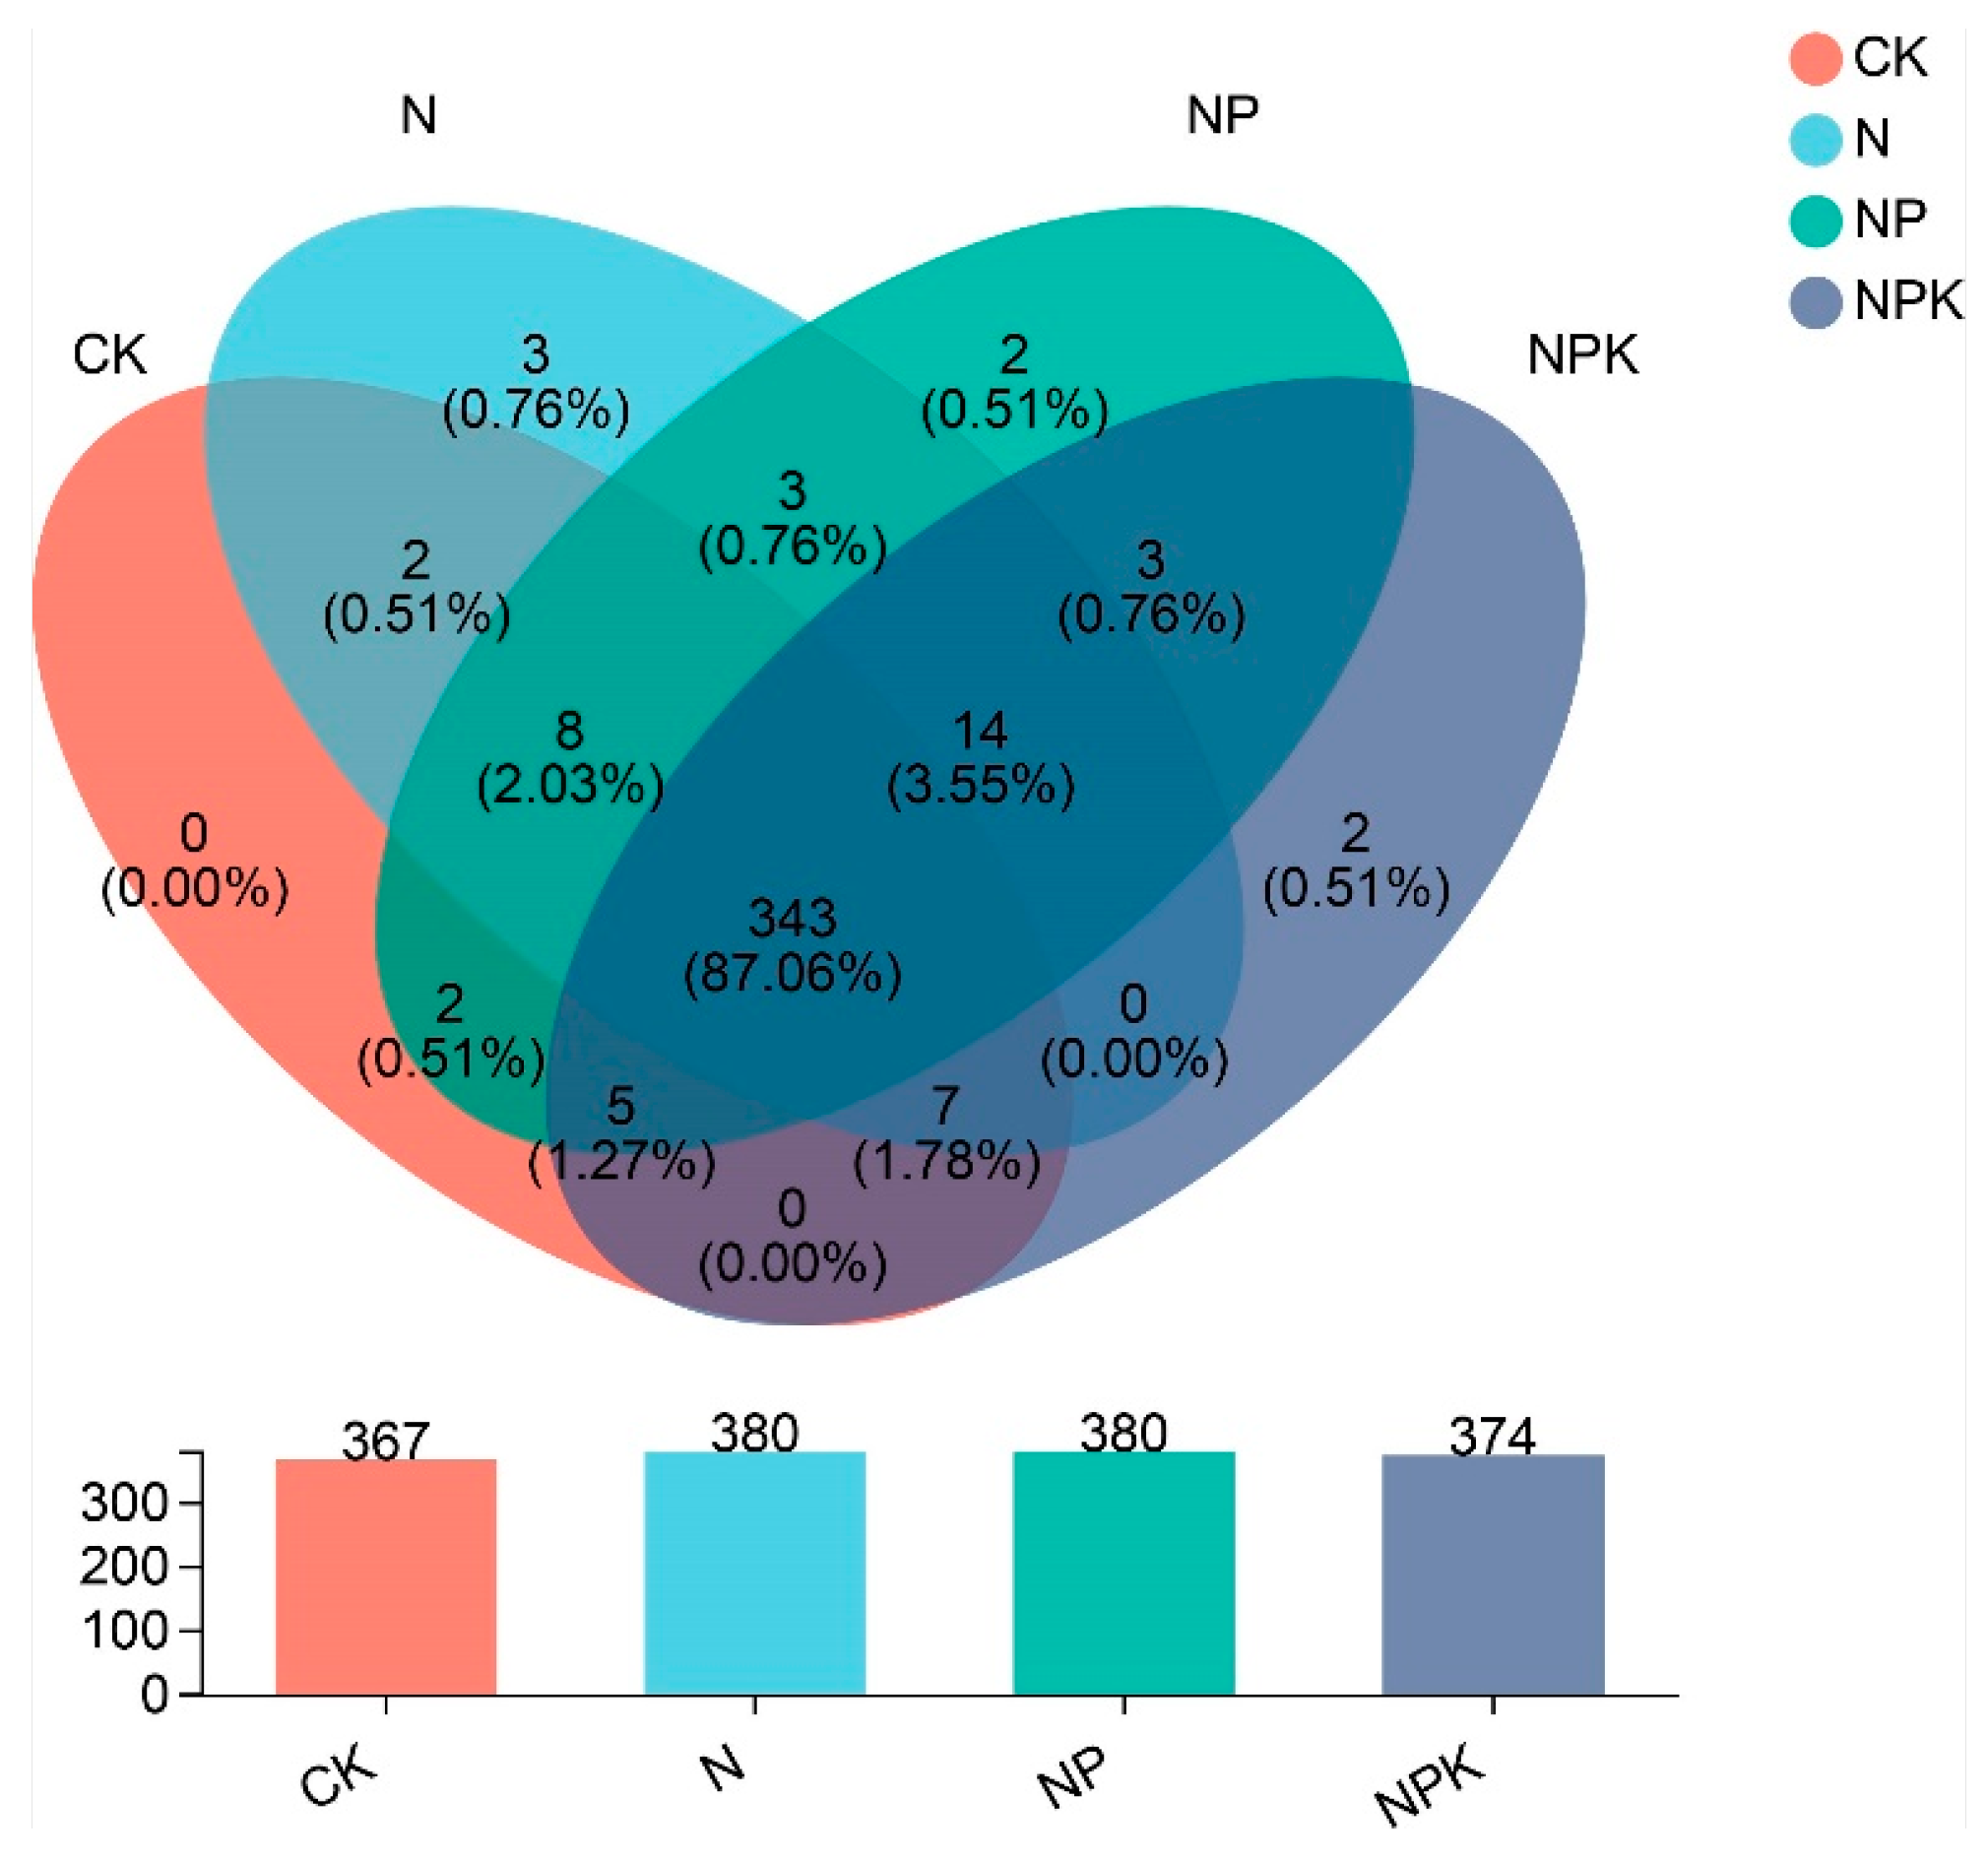
3.1. Characteristics of Soil Bacterial Diversity under Different Nutrient Application Measures

All treatments had a community coverage index of >99%, implying that the current sequencing covered most of the species in the sample, which reflected the species richness and the distribution of soil bacteria (Table 2). The Chao1 index of soil bacteria was significantly different under the different nutrient application treatments (Table 2, p < 0.05), but the Shannon index and bacterial count were not (Table 2). The Chao1 index of bacterial richness in the N, NP, and NPK treatments was increased by 4.28%, 3.73%, and 3.21% compared with the CK treatment, respectively. In addition, N levels with CK treatment (p < 0.05), and NP levels with CK treatment (p < 0.05) were significantly different, although the NPK with CK treatment were not. Pearson correlation analysis also revealed that the bacterial richness based on the Chao1 index (r = −0.531, p < 0.05) was negatively correlated with the soil TP content (Table S1).
The soil bacterial community composition under different nutrient application treatments based on Bray −Curtis distance analysis is shown in Figure S1. The bacterial community composition in the CK treatment differed from that in the N and NP treatments. However, the bacterial community composition in the N-−treated soil was more similar to that of the NPK treatment.

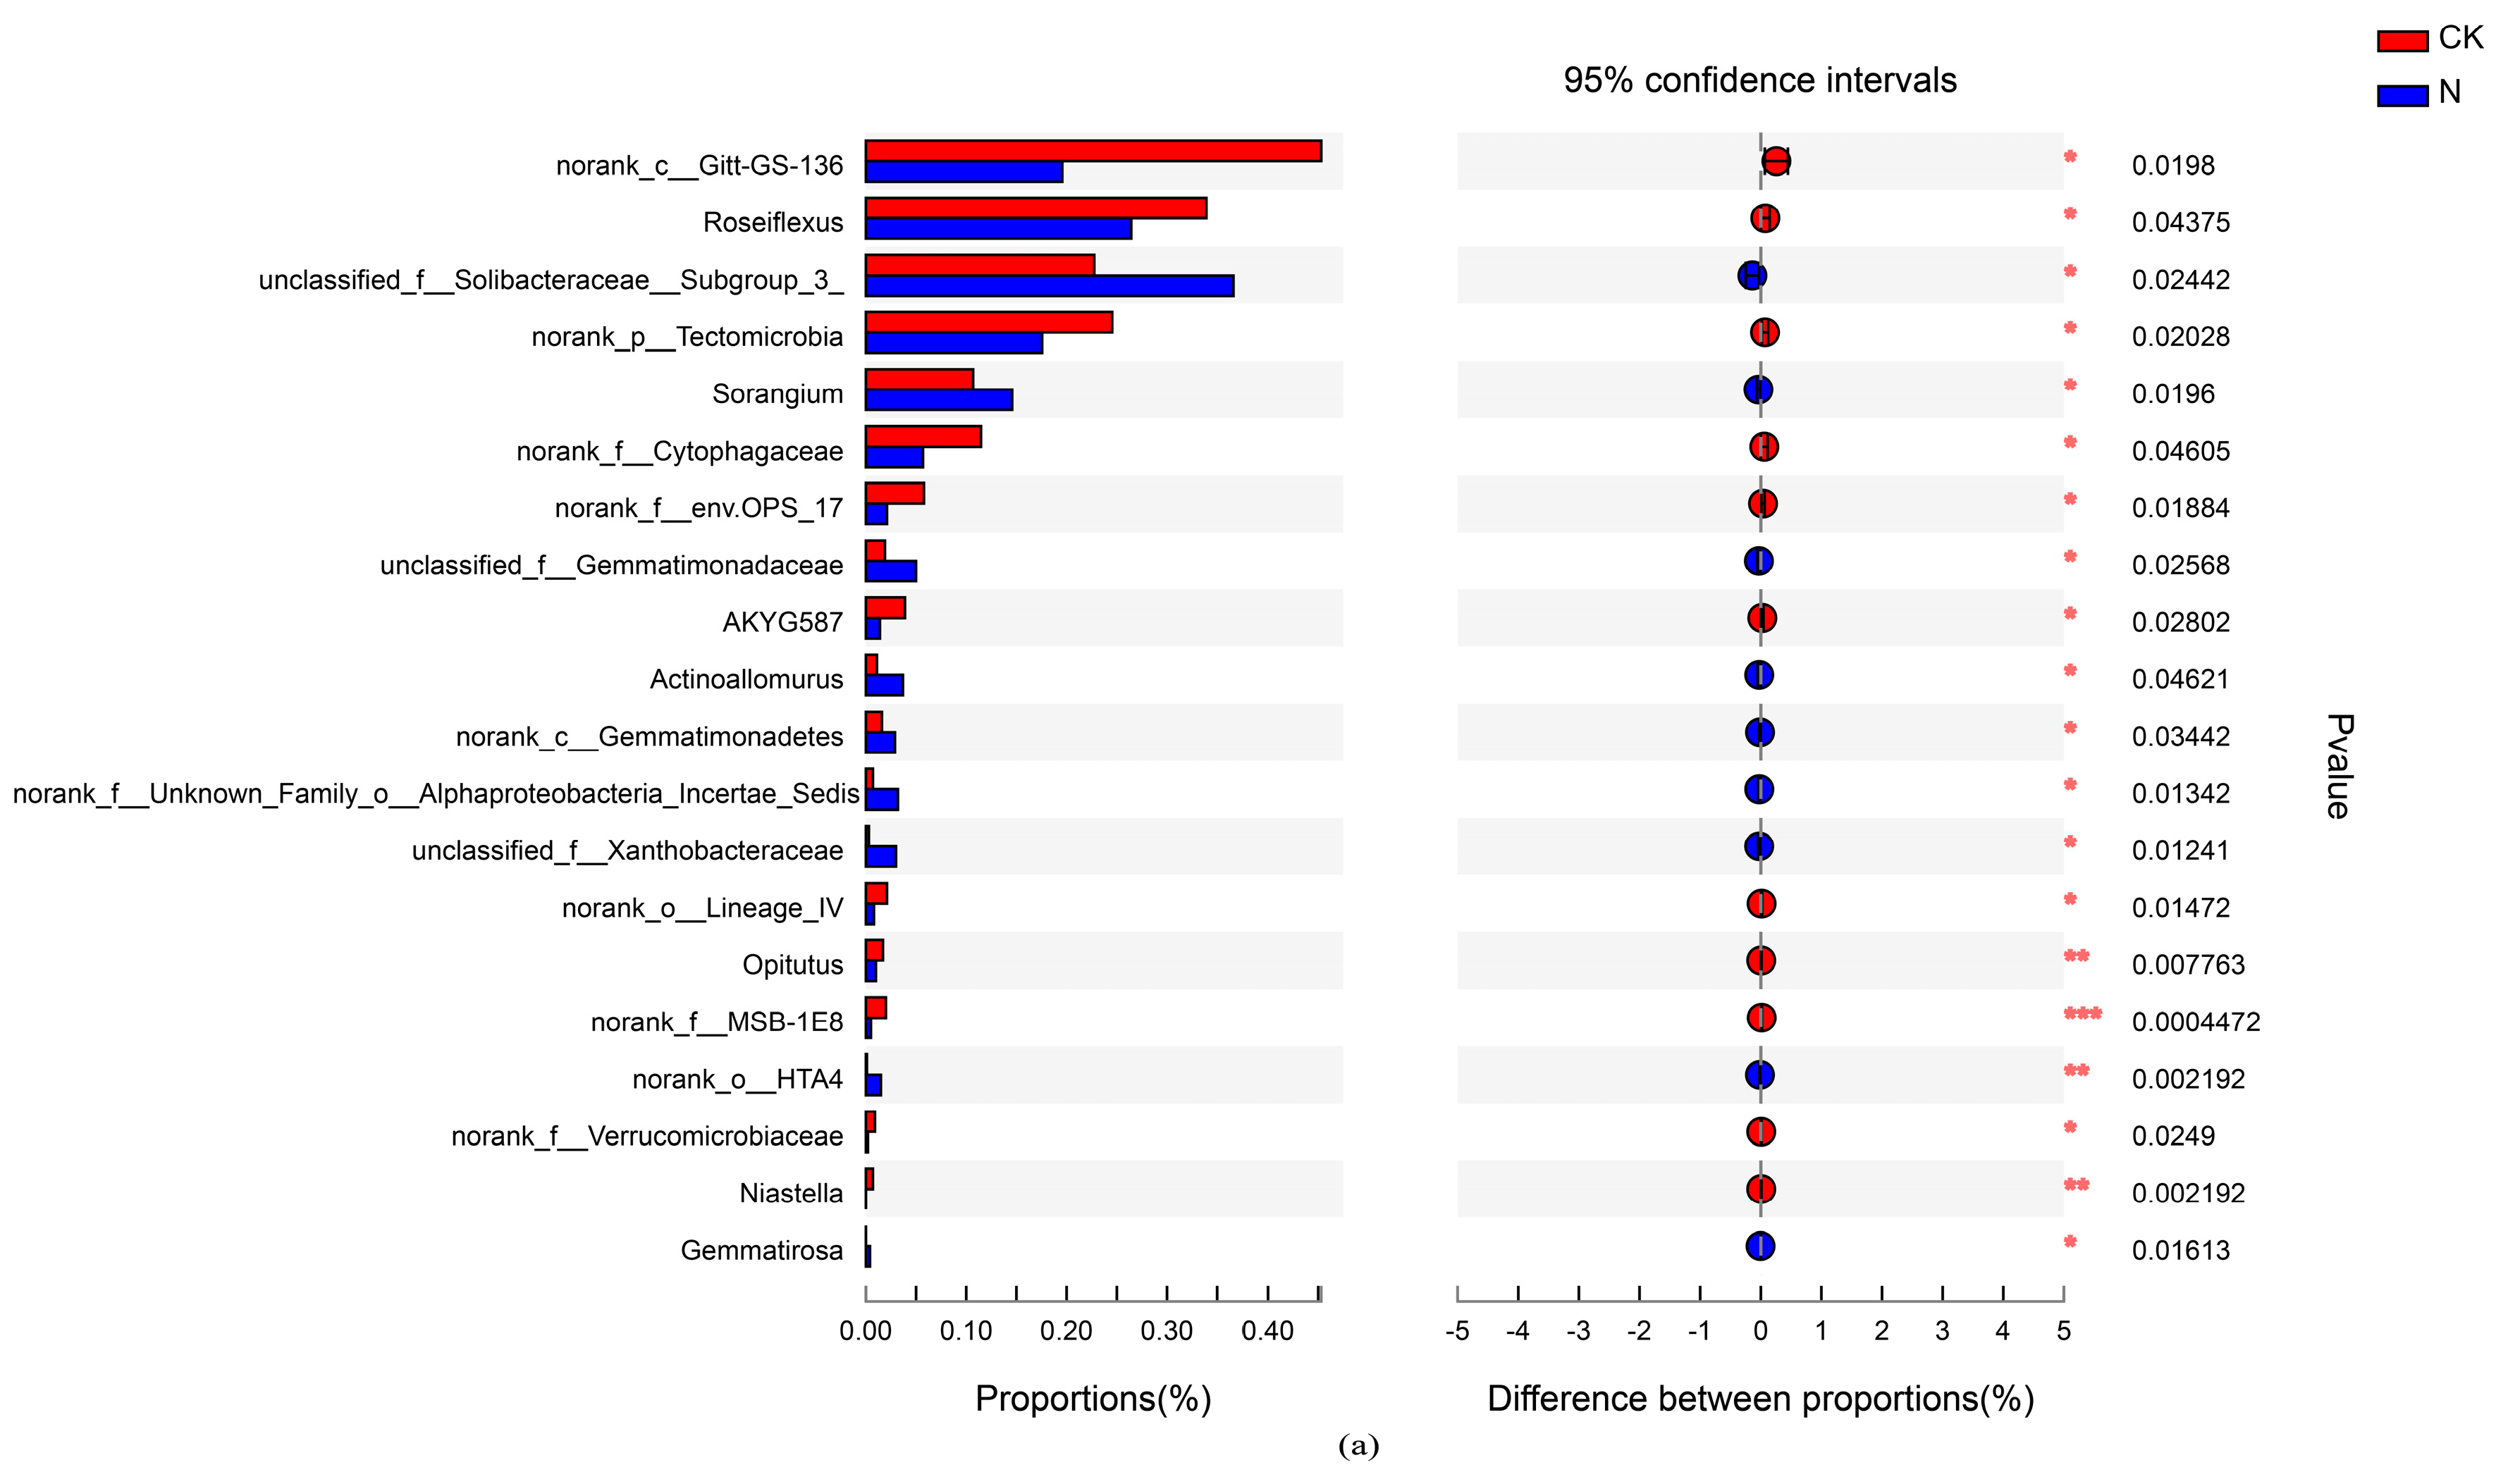
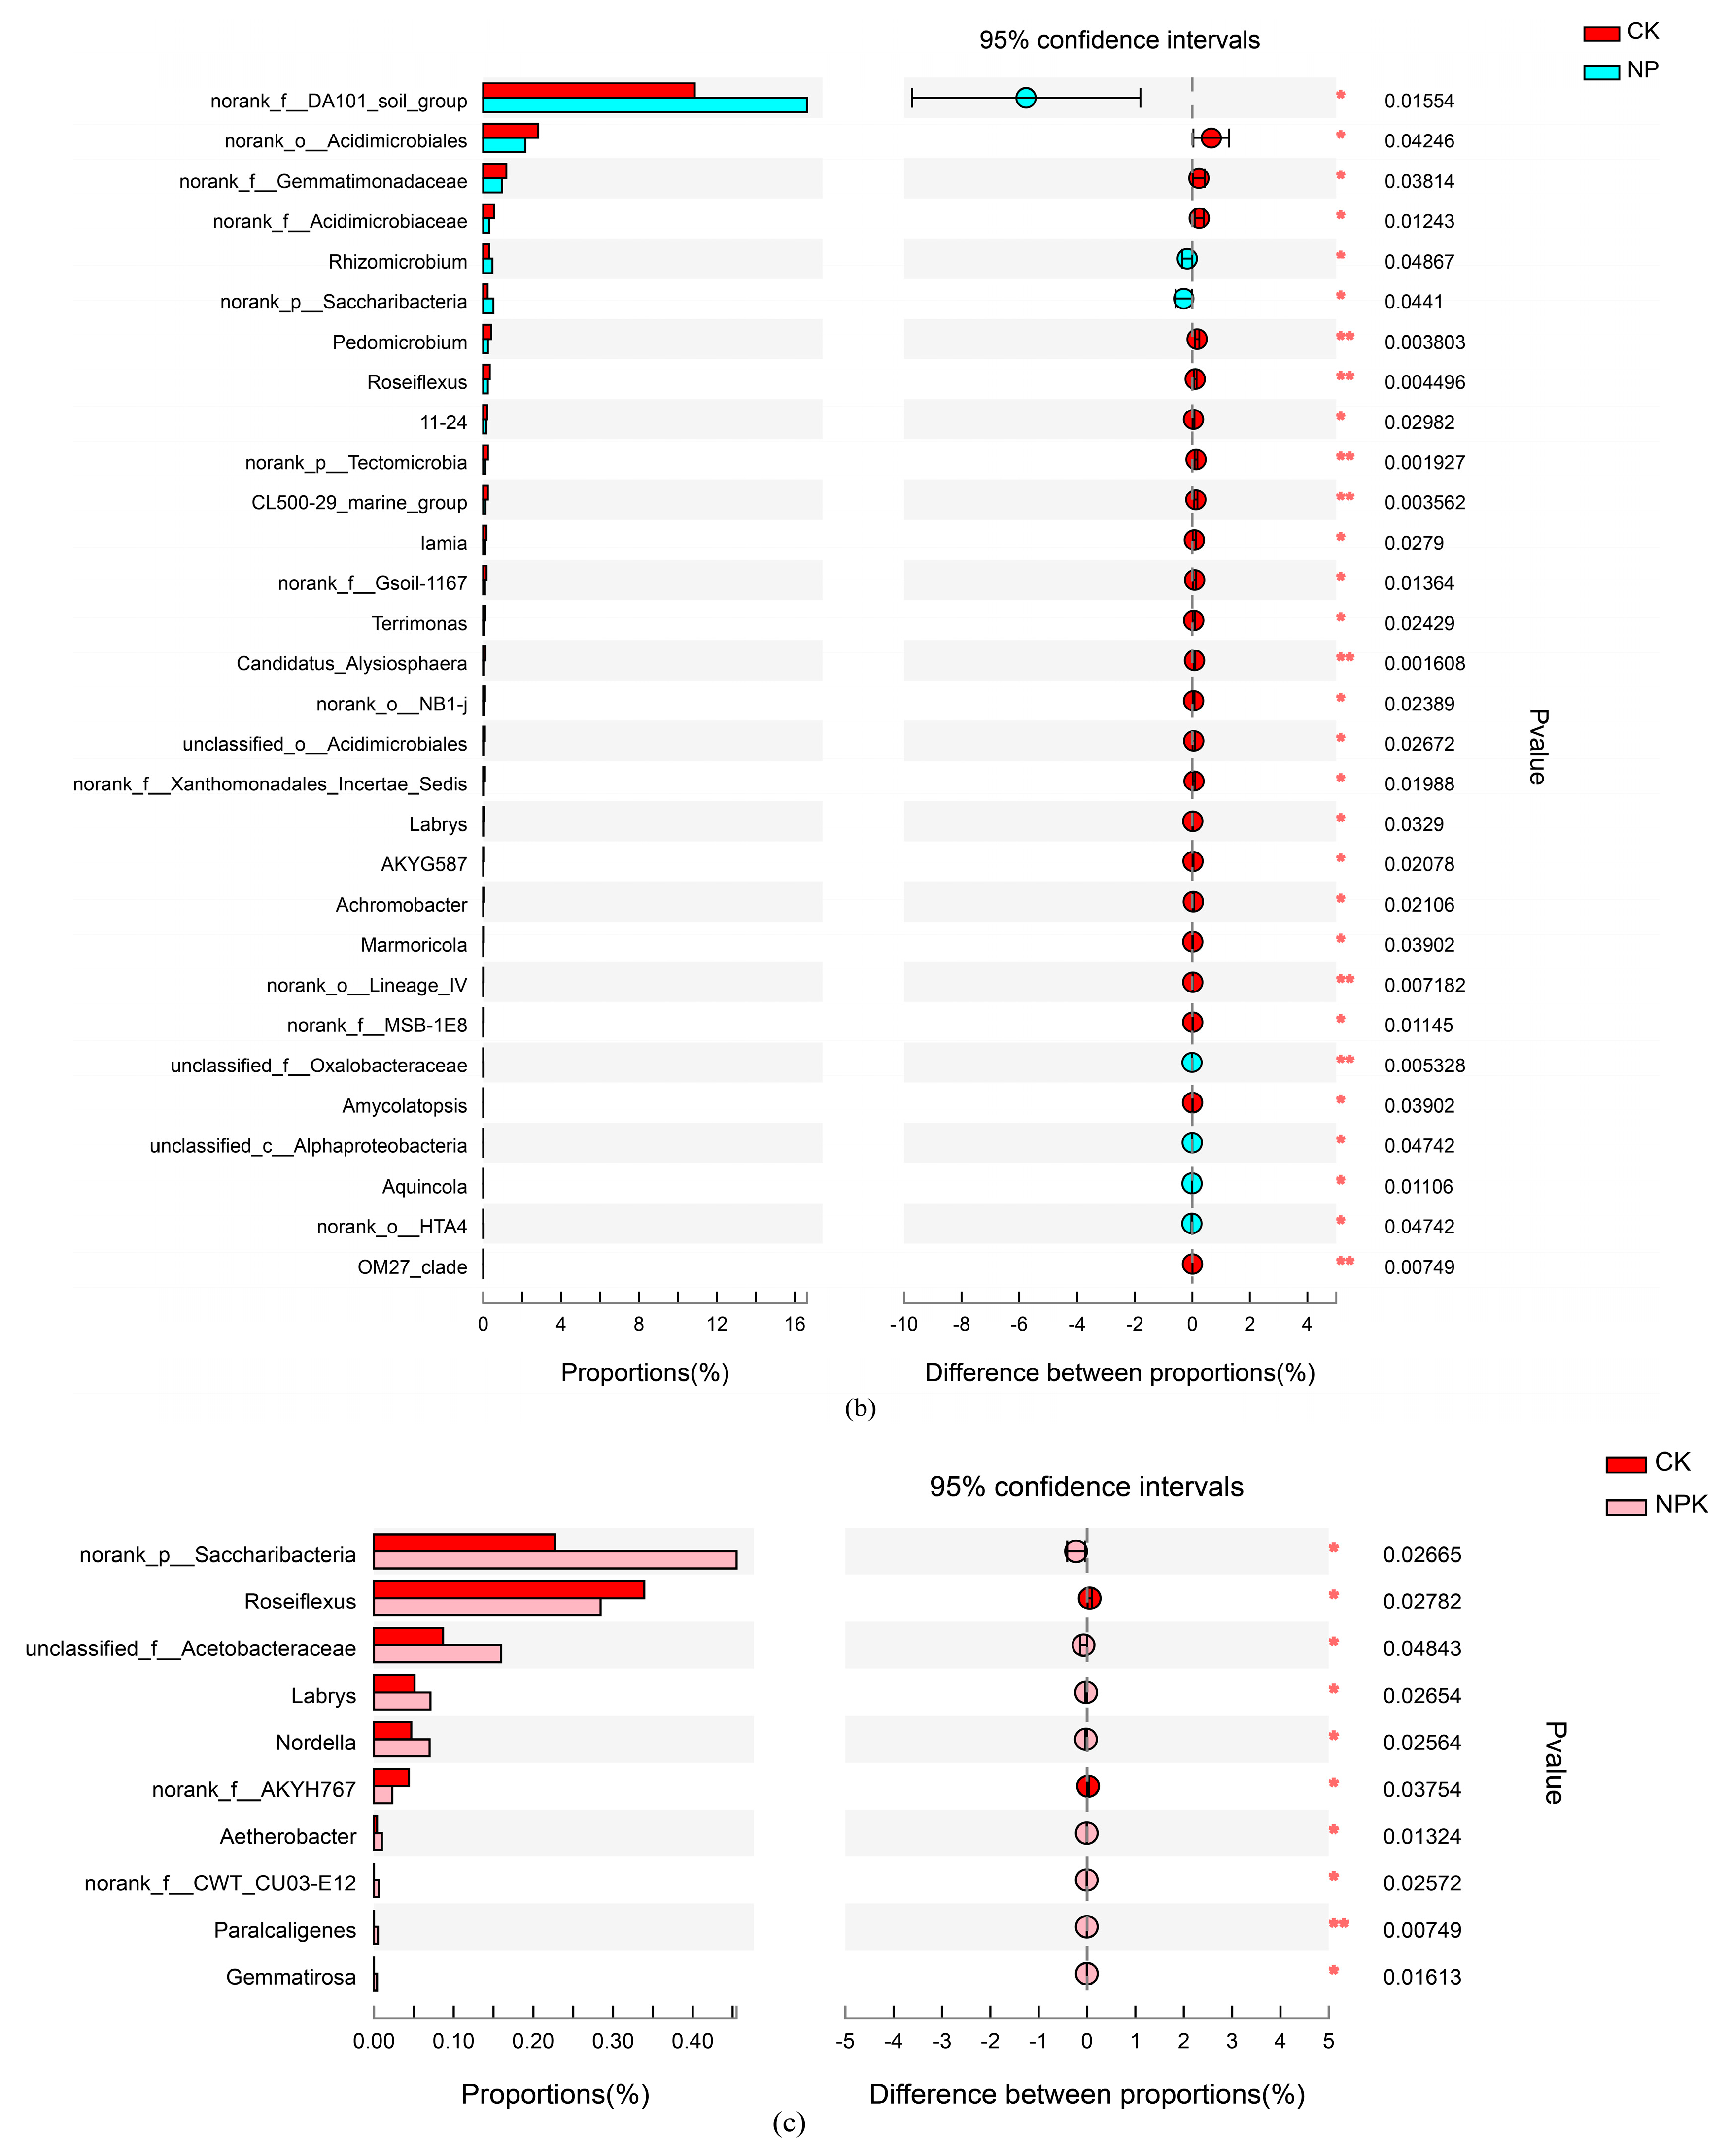
3.2. Effects of the Application of Nutrients on Soil Bacterial Community Composition

Based on the high-−throughput sequencing, 32 phyla, 71 classes, 134 orders, 259 families, 394 genera, 803 species, and 2042 OTU bacteria were identified in the 12 soil samples. The most abundant bacterial phyla in the sampled soils were Actinobacteria, Proteobacteria, Acidobacteria, Verrucomicrobia, Chloroflexi, Nitrospira, Bacteroidetes, Gemmatimonadetes, Planctomycetes, and Firmicutes (Figure 1, >1%). The phyla with an abundance <1% were classified as other. Only the abundance of Verrucomicrobia was significantly altered across the four treatments (p < 0.05, Figure S2), and the changes in abundance of the other major bacterial phyla across the four treatments were insignificant. Among the less abundant phyla, only Tectomicrobia was significantly different across the four treatments (p < 0.05). Correlation analysis between the soil physicochemical properties and the relative abundance of the main bacterial phyla revealed that Verrucomicrobia, Planctomycetes, Chloroflexi, and Nitrospirae were significantly negatively correlated with the soil TK content, AP concentration, and pH, whereas Verrucomicrobia, Gemmatimonadetes, and Firmicutes were significantly positively correlated with the soil TP, TN, and SOC contents, respectively (p < 0.05, Table S2).
The number of common bacteria genera in the four treatments was high, but the number of unique bacteria in each treatment was lower (Figure 2). In total, 343 bacterial genera (87.06 %) were shared among the four treatments; hence, they were able to adapt to the four treatments. However, there was no unique bacterial genus in the CK treatment. Compared with the CK treatment, there were 20 (5.07%), 22 (5.58%), and 19 (4.82%) unique bacterial genera in the N-−, NP-−, and NPK-−treated soils, respectively.
Compared with the CK treatment, the relative abundances of Sorangium, Actinoal-−lomurus, and Gemmatirosa were significantly increased in the N treatment, whereas those of Roseiflexus, Opitutus, and Niastella were significantly reduced (Figure 3a, p < 0.05). In the NP treatment, the relative abundances of Rhizomicrobium and Aquincola were significantly increased, whereas the relative abundances of Pedomicrobium, Roseiflexus, Achromobacter, Marmoricola, Amycolatopsis, Candidatus Alysiosphaera, and AKYG587 were significantly reduced compared with the CK treatment (Figure 3b, p < 0.05). At the same time, the relative abundances of Acthcrobacter, Paralcaligenes, and Gemmatirosa were significantly increased in the NPK treatment, whereas the relative abundance of Roseiflexus was significantly decreased compared with the CK treatment (Figure 3c, p < 0.05).
Correlation analysis between the soil physicochemical properties and the abundance of the soil bacterial genera revealed that the soil TK content was significantly negatively correlated with Mycobacterium, Streptomyces, and Bradyrhizobium (Table S2), but significantly positively correlated with Nitrospira. In addition, Mycobacterium, Bradyrhizobium, Reyranella, Variibacter, Streptomyces, Bryobacter, Gemmatimonas, and Rhizomicrobium were significantly positively correlated with the soil TN content, whereas Nitrospira abundance exhibited a significantly negative correlation with the soil TN content.

3.3. The Relationship between the Soil Bacterial Community Structure and Soil Chemical Properties

Redundancy analysis of the soil bacterial community structure and soil environmental factors revealed the key factors altering the soil bacterial community in the different nutrient application treatments in the larch plantation (Figure 4). The first ordination (RDA1 axis) explained 52.09% of the total variance. The soil bacterial community structure was positively correlated with the soil pH in the CK treatment; TN, pH, and AK in the N treatment; TK, TP, and AP in the NP treatment; and TN, SOC, TP, pH, and TK in the NPK treatment. Based on the db-−RDA analysis, the SOC (r2 = 0.75, p < 0.01) and the TN content (r2 = 0.497, p < 0.05) were the key factors driving the bacterial community changes (Table S3).

4. Discussion

4.1. Response of Soil Chemical Properties to the Different Nutrient Application Regimes

The insignificant changes in the soil TN, TP, and SOC were consistent with the findings reported by Wang [33]. However, these results contrast the soil chemical changes following the application of nutrients in the temperate zone of Inner Mongolia [34]. The insignificant changes in the present study could be due to the nutrient addition within the buffer range of the soil N and P contents in the experimental area. In addition, the application of nutrients increased the aboveground productivity of the larch plantation, leading to an increased aboveground litter, which slowed down the decomposition rate of the SOC [35]; hence, there was an insignificant change in the SOC. The decrease in the TK after the application of nutrients and the higher TK in the NPK treatment than in the N and NP treatments could be due to the increased K element [36]. In addition, the increase in the nutrient components increased the number of bacteria sensitive to K, including Acthcrobacter, Paralcaligenes, and Gemmatirosa, which promoted the transformation of non-−exchangeable K in the soil to AP directly absorbed by plants. This also increased the AK to plants in the soil [37,38], increasing the AK content in the soil while decreasing the TP. The decrease in soil pH was due to the release of a large amount of H+ after a series of decomposition and transformation in the soil with the addition of nitrogen (urea)-−based nutrients, which reduces the soil pH [39]. Previous studies have shown that differences in soil bacterial community diversity and richness can largely be explained by soil pH [40,41], which was inconsistent with our findings. There was no significant correlation between soil pH and soil bacterial diversity and richness. Therefore, soil pH may not be the key factor regulating soil bacterial diversity in middle-aged larch plantations.

4.2. Soil Bacterial Diversity under Nutrient Application Regimes

Bacteria account for 90% of microorganisms in the soil and participate in the decomposition and transformation of organic matter in the soil. Therefore, the community characteristics of the soil bacteria partially reflect the soil fertility [42]. In this study, the application of nutrients after thinning increased the soil bacterial richness (Chao1 index), especially in the N and NPK treatments. In addition, the bacterial richness index showed a downward trend (Chao1 index: N > NP > NPK > CK with the increased application of nutrients. These results demonstrate that adding nutrients after thinning increases the soil bacterial richness in larch plantations. For example, the decrease in TP with the application of nutrients was the lowest (22.52%) in the NPK treatment due to the addition of potassium; hence, the richness was not significantly different in the NPK treatment compared with the other treatments. N enrichment increases nutrients in the soil, providing a rich source of nutrients for bacterial growth; therefore, N addition in the present study promoted bacterial growth. However, under P and K enrichment, the availability of nutrients in the soil is altered. For example, the AP and AK were increased in the NP and NPK treatments compared with the N treatment, which promoted the growth of P and K bacterially sensitive populations such as Rhizomicrobium, Aquincola, Acthcrobacter, Paralcaligenes, Gemmatirosa, Rhizobium, Aquincola, Aetherobacter, Alcaligenes, and Gemmatimonadetes. At the same time, it inhibited other populations, including Pedomicrobium, Roseiflexus, Achromobacter, Marmoricola, Amycolatopsis, and Candidatus Alysiosphaera. Overall, the increase in the number of bacteria was the highest in the N treatment; hence, the highest bacterial richness index. In general, addition enrichment promoted the soil bacteria community structure.
The Shannon diversity index is a sensitive indicator of soil quality, which reflects the dynamics of the bacterial community [43]. A previous study revealed that the application of nutrients inhibited soil bacterial diversity [42]. However, another study revealed that N enrichment promoted the growth of the soil bacterial community [43]. In this study, the application of nutrients had no significant effect on the soil bacterial diversity, with a slightly lower Shannon index than the control. The findings in this study are consistent with several previous studies [44]. Natural factors such as soil type, temperature, and vegetation, and human factors such as soil tillage methods and fertilizer application determine soil properties. Soil properties affect soil bacterial community composition and diversity. Under the same conditions of other factors, the soil total nitrogen, total phosphorus, organic carbon, and other important chemical properties remained at a relatively stable level after adding nutrients. Therefore, there was no difference in the composition and abundance of dominant bacterial communities at the phylum level [45]. As a result, soil bacterial diversity is more stable.
Guan revealed that soil bacteria concentrations in fertilized Catalpa bungei trees were mainly related to the nitrogen [12]. In addition, Ling [46] revealed that the application of nutrients affected bacterial communities primarily by changing the soil pH and increasing P availability. However, this study found that soil SOC and TN content were the key factors causing changes in soil bacterial community structure in middle-aged larch plantations. The differences in fertilizer type, tree species, and age may be the reasons for the contradicting findings among these studies [47,48]. For instance, significant effects of soil pH and available phosphorus were observed on soil bacterial community in young Phoebe bournei plantations after adding phosphate fertilizer [49]. Total nitrogen, total phosphorus, and pH were the main environmental factors affecting the bacterial community structure of eucalyptus plantations [13]. Former studies showed soil pH was the most important factor driving different soil microbial community composition patterns and diversity [50]. However, there was no significant relationship between the soil bacterial diversity and pH in the present study, which was consistent with the findings reported by Liu [51]. It can be seen that the change in soil microbial community structure will be affected by many factors, but in different ecosystems, the driving factors may be different, which cannot be generalized and needs to be further explored.

4.3. Changes in the Main Soil Bacterial Community under Different Nutrient Application Measures

The application of nutrients altered the composition of the soil bacterial structure in the middle-aged larch plantation, including the abundance of the non-dominant bacterial community. High-throughput sequencing identified Actinobacteria, Proteobacteria, Acidobacteria, and Verrucomicrobia as some of the most dominant bacteria phyla, which were also some of the dominant phyla identified by Shen et al. [48,50] in the natural environment. However, only Verrucomicrobia and Microbiota among the low abundant bacteria phyla were significantly different across the four treatments. The soil bacterial community composition at the phylum level was relatively stable, although the soil chemical factors were unstable, implying that their stability may be related to other factors, such as the plant community composition. Specifically, the application of nutrients after thinning did not exceed the soil nutrient supplement threshold in the larch plantation. As a result, larch and other dominant shrubs and herbs in the study provided a stable composition of the root exudates in the soil [37], which were metabolized by the bacteria in the soil and did not alter the dominant bacterial flora, hence the relatively stable bacterial community at the phylum level.

5. Conclusions

The application of nutrients alters the composition and abundance of soil bacteria by changing the soil chemical properties. For example, the application of nutrients significantly changes the relative abundance of Verrucomicrobia, Tectomicrobia, and Sorangium, Roseiflexus, Achromobacter, etc., but does not affect the relative abundance of other phyla. The application of nutrients also alters the soil bacteria community structure. The soil SOC and TN contents are the main environmental factors that change the soil bacterial community structure in middle-aged larch plantations. Therefore, it is of great significance to explore how the different nutrient application measures alter the soil microbial community in larch plantations to protect and utilize the larch plantation ecosystem.

Supplementary Materials

The following supporting information can be downloaded at: https://www.mdpi.com/article/10.3390/su142416759/s1. Figure S1: Effects of different nutrient application measures on soil bacterial community β diversity in larch plantation; Table S1: Person correlation coefficients between bacteria alpha-diversity and soil parameters; Table S2: Correlation between the relative abundance of dominant bacterial taxa and soil chemical properties; Figure S2: Differences in bacterial phyla among different treatments; Table S3: Effects of environmental factors on soil bacterial community.

Author Contributions

Conceptualization, J.C. and Z.S.; methodology, J.C. and Z.S.; formal analysis, J.C.; investigation, J.C. and Z.W.; supervision, Z.S.; writing—original draft, J.C.; writing—review and editing, J.C.; L.G. and Z.S. All coauthors contributed to manuscript editing. All authors have read and agreed to the published version of the manuscript.

Funding

This research was funded by the grant from the National Natural Science Foundation of China (No. 31770670).

Institutional Review Board Statement

Not applicable.

Informed Consent Statement

Not applicable.

Data Availability Statement

Datasets generated and/or analyzed during the current study are available from the corresponding author upon reasonable request.

Acknowledgments

We thank the anonymous reviewers and the editor for their valuable comments.

Conflicts of Interest

The authors declare no conflict of interest.

References

  1. Lui, Z.F.; Fu, B.; Liu, G.H. Key Laboratory of System Ecology, Research Center for Eco-Environmental Sciences, Chinese Academy of Sciences. Acta Ecol. Sin. 2006, 26, 901–913. [Google Scholar]
  2. Dilly, O.; Munch, J.C. Ratios between estimates of microbial biomass content and microbial activity in soils. Biol. Fertil. Soils 1998, 27, 374–379. [Google Scholar] [CrossRef]
  3. Xu, Q.; Jiang, P.; Xu, Z. Soil microbial functional diversity under intensively managed bamboo plantations in southern China. J. Soils Sediments 2008, 8, 177–183. [Google Scholar] [CrossRef]
  4. Ding, X.; Jing, R.; Huang, Y.; Chen, B.; Ma, F. Bacterial structure and diversity of rhizosphere and bulk soil of Robinia pseudoacacia forests in Yellow River Delta. Acta Pedol. Sin. 2017, 54, 1293–1302. [Google Scholar]
  5. Sheng, W.T.; Fan, S.H. Study on the Mechanism of Maintaining Long-term Productivity of Plantation: Background, Present Condition and Trends. For. Res. 2004, 17, 105–115. [Google Scholar]
  6. Sun, C.Z. Study on the problems of forest plantation productivity of China Ⅱ. —To probelems into the social and other non-nature factors debasing the plantation productivity. Sci. Silvae Sin. 2001, 37, 26–34. [Google Scholar]
  7. Heilongjiang Forestry Society Communication; Heilongjiang Forestry Society: Harbin, China, 2011; Volume 5.
  8. Bergh, J.; Nilsson, U.; Allen, H.; Johansson, U.; Fahlvik, N. Long-term responses of Scots pine and Norway spruce stands in Sweden to repeated fertilization and thinning. For. Ecol. Manag. 2014, 320, 118–128. [Google Scholar] [CrossRef]
  9. Fernandez, I.; Álvarez-González, J.G.; Carrasco, B.; Ruíz-González, A.D.; Cabaneiro, A. Post-thinning soil organic matter evolution and soil CO2 effluxes in temperate radiata pine plantations: Impacts of moderate thinning regimes on the forest C cycle. Can. J. For. Res. 2012, 42, 1953–1964. [Google Scholar] [CrossRef]
  10. Zhu, Y.G.; Chen, B.D.; Fu, W. Research frontiers in soil ecology. Sci. Technol. Rev. 2022, 40, 25–31. [Google Scholar]
  11. Liu, Y.R.; Zhang, J.W.; Bao, Y.Y.; Lin, X.G.; Feng, Y.Z. Convergent Responses of Paddy Soil Microbial Community to Fertilization at Regional Scale. Soils 2022, 54, 968–977. [Google Scholar]
  12. Guan, Z.; Lin, D.; Dong, C.; Guo, Y. Soil microbial communities response to different fertilization regimes in young Catalpa bungei plantation. Front. Microbiol. 2022, 13, 948875. [Google Scholar] [CrossRef] [PubMed]
  13. LI, C.; Xu, Y.; Wu, Z. Short-term Effects of Different Eucalyptus Plantation Fertilization Treatments on Soil Bacterial Community Structure and Diversity. Eucalypt Sci. Technol. 2020, 37, 10–17. [Google Scholar]
  14. Guo, P.; Huang, X.; Wu, W.; Zheng, L.; Fang, X.; Yi, Z.G. Effects of different nitrogen application methods and levels on soil bacterial communities of Pinus massoniana and Schima superba seedling roots. Acta Ecol. Sin. 2021, 41, 149–161. [Google Scholar]
  15. Wei, J.; Zhang, J.; Wang, W.; Wang, Z.; Gu, J. Effect of Nitrogen Fertilization on Soil Microbial Biomass and Community Structure of Picea koraiensis Plantation in Maoershan Mountains of Northeastern China; Northeast Forestry University: Harbin, China, 2016; Volume 44, pp. 52–56. [Google Scholar]
  16. Serita, D.; Melissa, K.; Jeri, L.P.; Rodney, T.S. Chronic nitrogen enrichment affects the structure and function of the soil microbial community in temperate hardwood and pine forests. For. Ecol. Manag. 2004, 196, 159–171. [Google Scholar]
  17. Sun, C.; Shen, G.; Li, J.; Jia, L. Study on the Present Condition and the Potentialities of the Productivity of Main Tree Species Plantation of China. For. Res. 2001, 6, 657–667. [Google Scholar]
  18. Smolander, A.; Kitunen, V.; Tamminen, P.; Kukkola, M. Removal of logging residue in Norway spruce thinning stands: Long-term changes in organic layer properties. Soil Biol. Biochem. 2010, 42, 1222–1228. [Google Scholar] [CrossRef]
  19. Eilers, K.; Debenport, S.; Anderson, S. Fierer, N. Digging deeper to find unique microbial communities: The strong effect of depth on the structure of bacterial and archaeal communities in soil. Soil Biol. Biochem. 2012, 50, 58–65. [Google Scholar] [CrossRef]
  20. Jia, S.; Zhao, Y.; Li, C.; Wang, Z. Effects of nitrogen fertilization on seasonal dynamics of soil microbial biomasscar bonandni-trogenin Larixgme liniiand Fraxinusm and shurica plantations. Chin. J. Appl. Ecol. 2009, 20, 2063–2071. [Google Scholar]
  21. Nelson, D.; Sommers, L. Carbon and organic matter. In Methods of Soil Analysis-Part 2: Chemical and Microbiological Properties; Page, A.L., Mille, R.H., Eds.; American Society of Agronomy: Madison, WI, USA, 1982; pp. 561–579. [Google Scholar]
  22. Ravel, J.; Gajer, P.; Abdo, Z. Vaginal microbiome of reproductive-age women. Proc. Natl. Acad. Sci. USA 2011, 108, 4680–4687. [Google Scholar] [CrossRef] [Green Version]
  23. Chen, S.; Zhou, Y.; Chen, Y.; Gu, J. fastp: An ultra-fast all-in-one FASTQ preprocessor. Bioinformatics 2018, 34, 884–890. [Google Scholar] [CrossRef]
  24. Magoč, T.; Salzberg, S.L. FLASH: Fast length adjustment of short reads to improve genome assemblies. Bioinformatics 2011, 27, 2957–2963. [Google Scholar] [CrossRef] [PubMed] [Green Version]
  25. Edgar, R.C. UPARSE: Highly accurate OTU sequences from microbial amplicon reads. Nat. Methods 2013, 10, 996–998. [Google Scholar] [CrossRef] [PubMed]
  26. Stackebrandt, E.; Goebel, B.M. Taxonomic Note: A Place for DNA-DNA Reassociation and 16S rRNA Sequence Analysis in the Present Species Definition in Bacteriology. Int. J. Syst. Bacteriol. 1994, 44, 846–849. [Google Scholar] [CrossRef] [Green Version]
  27. Wang, Q.; Garrity, G.; Tiedje, J.; Cole, J. Naive Bayesian classifier for rapid assignment of rRNA sequences into the new bacterial taxonomy. Appl. Environ. Microbiol. 2007, 73, 5261–5267. [Google Scholar] [CrossRef] [Green Version]
  28. Oksanen, J. Vegan: An Introduction to Ordination; The Natural Resources Institute Finland, Itäinen Pitkäkatu: Turku, Finland, 2015. [Google Scholar]
  29. Hartmann, M.; Brunner, I.; Hagedorn, F.; Bardgett, R.D.; Stierli, B.; Herzog, C. A decade of irrigation transforms the soil microbiome of semi-arid pine forest. Mol. Ecol. 2017, 26, 1190–1206. [Google Scholar] [CrossRef] [Green Version]
  30. Frey, B.; Walthert, L.; Perez, M.C.; Stierli, B.; Koechli, R.; Dharmarajah, A.; Brunner, I. Deep soil layers of drought-exposed forests harbor poorly known bacterial and fungal communities. Front. Microbiol. 2021, 12, 674160. [Google Scholar] [CrossRef]
  31. Rime, T.; Hartmann, M.; Brunner, I.; Widmer, F.; Zeyer, J.; Frey, B. Vertical distribution of the soil microbiota along a successional gradient in a glacier forefield. Mol. Ecol. 2015, 24, 1091–1108. [Google Scholar] [CrossRef]
  32. Frey, B.; Rime, T.; Phillips, M.; Stierli, B.; Hajdas, I.; Widmer, F.; Hartmann, M. Microbial diversity in European alpine permafrost and active layers. Fems Microbiol. Ecol. 2016, 92, fiw018. [Google Scholar] [CrossRef] [Green Version]
  33. Wang, Q.; Ma, M.; Jiang, X.; Yang, X.; Li, J. Impact of 36 years of nitrogen fertilization on microbial community composition and soil carbon cycling related enzyme activities in rhizospheres and bulk soils in northeast China. Appl. Soil Ecol. 2019, 136, 148–157. [Google Scholar] [CrossRef]
  34. Sanon, A.; Andrianjaka, Z.N.; Prin, Y. Rhizosphere microbiota interfers with plant-plant interactions. Plant Soil 2009, 321, 259–278. [Google Scholar] [CrossRef]
  35. Cusack, D.F.; Karpman, J.; Ashdown, D. A Global change effects on humid tropical forests: Evidence for biogeochemical and biodiversity shifts at an ecosystem scale. Rev. Geophys. 2016, 54, 523–610. [Google Scholar] [CrossRef]
  36. Wang, T.; Song, J.C.; Yan, S.; Li, C. Effect of different potassium fertilizer application mass on olive root development and rhizospheric soil micro environment. Non-Wood For. Res. 2020, 38, 153–163. [Google Scholar]
  37. Krasilnikov, N. On the role of soil bacteria in plant nutrition. J. Gen. Appl. Microbiol. 2006, 7, 128–144. [Google Scholar] [CrossRef] [Green Version]
  38. Sibyl, M.; Hilszczańska, D. Biodiversity and the role of soil bacteria in a forest environment. Sylvan 2017, 161, 155–162. [Google Scholar]
  39. Luo, P.; Han, X.; Wang, Y.; Han, M.; Shi, H.; Liu, N.; Bai, H. Influence of long-term fertilization on soil microbial biomass, dehydrogenase activity, and bacterial and fungal community structure in a brown soil of northeast China. Ann. Microbiol. 2015, 65, 533–542. [Google Scholar] [CrossRef] [Green Version]
  40. Geisseler, D.; Scow, K.M. Long-term effects of mineral fertilizers on soil microorganisms—A review. Soil Biol. Biochem. 2014, 75, 54–63. [Google Scholar]
  41. Jiang, X.; Hou, X.; Zhou, X.; Xin, X.; Wright, A.; Jia, Z. pH regulates key players of nitrification in paddy soils. Soil Biol. Biochem. 2015, 81, 9–16. [Google Scholar] [CrossRef]
  42. Hoorman, J.J. The Role of Soil Bacteria; The Ohio State University: Columbus, OH, USA, 2012; Volume 614, pp. 292–1868. [Google Scholar]
  43. Liu, C.; Xue, S. Soil bacterial community dynamics reflect changes in plant community and soil properties during the secondary succession of abandoned farmland in the Loess Plateau. Soil Biol. Biochem. 2016, 90, 40–49. [Google Scholar]
  44. Zeng, J.; Liu, X.; Song, L. Chu, H. Nitrogen fertilization directly affects soil bacterial diversity and indirectly affects bacterial community composition. Soil Biol. Biochem. 2016, 92, 41–49. [Google Scholar] [CrossRef]
  45. Sun, S.; Xing, F.; Zhao, H.; Dong, Y. Response of bacterial community to simulated nitrogen deposition in soils and a unique relationship between plant species and soil bacteria in the songnen grassland in northeastern china. J. Soil Sci. Plant Nutr. 2014, 14, 565–580. [Google Scholar]
  46. Ling, N.; Chen, D.; Guo, H.; Wei, J.; Bai, Y.; Shen, Q. Differential responses of soil bacterial communities to long-term N and P inputs in a semi−arid steppe. Geoderma 2017, 292, 25–33. [Google Scholar]
  47. Liu, J.; Dang, P.; Gao, Y.; Zhu, H.; Zhu, H.; Zhao, F.; Zhao, Z. Effects of tree species and soil properties on the composition and diversity of the soil bacterial community following afforestation. For. Ecol. Manag. 2018, 427, 342–349. [Google Scholar] [CrossRef]
  48. Chodak, M.; Klimek, B.; Azarbad, H.; Ja´zwa, M. Functional diversity of soil microbial communities under Scots pine, Norway spruce, silver birch and mixed boreal forests. Pedobiologia 2015, 58, 81–88. [Google Scholar] [CrossRef]
  49. Peng, T.H.; Wen, S.Z. Effects of Phosphorus Assition on Soil Nutrient Elements and Microorganisms in Young Phoebe bournei Plantations by Peng Tieshuang; Central South University of Forestry and Technology: Changshai, China, 2022; p. 000410. [Google Scholar]
  50. Wang, N.; Zhang, T.; Zhang, F.; Wang, E.; He, J.; Ding, H.; Zhang, B.; Liu, J.; Ran, X.; Zhang, J. Diversity and structure of soil bacterial communities in the Fildes Region (maritime Antarctica) as revealed by 454 pyrosequencing. Front. Microbiol. 2015, 6, 11–88. [Google Scholar] [CrossRef] [Green Version]
  51. Insam, H.; Parkinson, D.; Domsch, K.H. Influence of macroclimate on soil microbial biomass. Soil Biol. Biochem. 1989, 21, 211–221. [Google Scholar] [CrossRef]
Figure 1. Relative abundance of soil bacteria phyla under different nutrient application measures.
Sustainability 14 16759 g001
Figure 2. Venn diagram of soil bacterial genus composition after different nutrient application measures.
Sustainability 14 16759 g002
Figure 3. (ac) Indigenous test of soil bacterial community (genus level) difference between the application of nutrients measures and control measures.
Sustainability 14 16759 g003aSustainability 14 16759 g003b
Figure 4. Redundancy analysis of soil bacteria, environmental factors, and DBH of larch. Notes. SOC, soil organic carbon; TN, soil total nitrogen; TP, soil total phosphorus; TK, soil total potassium; AK, soil available potassium; AP, soil available phosphorus.
Sustainability 14 16759 g004
Table 1. Soil (0–10cm) chemical properties in different nutrient application measures.
Treat.(g/kg) Total N(g/kg) Total P(g/kg) Total K(g/kg) Organic C(mg/kg) Available P(mg/kg) Available KpH
CK2.48 ± 0.28 a0.95 ± 0.21 a5.95 ± 1.85 a60.63 ± 22.53 a14.93 ± 6.72 a109.77 ± 33.09 b4.81 ± 0.25 a
N2.98 ± 1.01 a0.93 ± 0.44 a3.04 ± 1.48 b58.27 ± 8.90 a12.47 ± 4.55 a149.94 ± 29.04 b4.54 ± 0.30 ab
NP2.33 ± 0.76 a0.97 ± 0.23 a3.65 ± 1.00 ab62.44 ± 15.66 a18.74 ± 8.82 a199.15 ± 27.26 ab4.43 ± 0.04 b
NPK3.62 ± 0.89 a1.09 ± 0.37 a4.61 ± 1.13 ab59.64 ± 23.58 a15.49 ± 4.12 a286.15 ± 68.08 a4.55 ± 0.02 ab
Notes. Data are means ± SE (n = 3); different letters represent significant differences between treatments; p-value < 0.05 indicates a significant difference. CK, no fertilizer; N, nitrogen fertilizer; NP, nitrogen + phosphorus fertilizer; NPK, nitrogen + phosphorus + potassium fertilizer. DBH, Diameter at breast height.
Table 2. Soil bacterial diversity index under different nutrient application measures.
Treat.Chao1 IndexShannon IndexRichness IndexCoverage
CK1717.01 ± 35.851 b5.83 ± 0.090 a1519.00 ± 42.46 a0.99 ± 0.00 a
N1790.50 ± 32.010 a5.80 ± 0.107 a1549.33 ± 36.23 a0.99 ± 0.00 a
NP1781.14 ± 23.490 a5.75 ± 0.108 a1544.67 ± 41.04 a0.99 ± 0.00 a
NPK1772.19 ± 39.659 ab5.81 ± 0.107 a1549.67 ± 13.58 a0.99 ± 0.00 a
Notes. different letters represent significant differences between treatments.
Publisher’s Note: MDPI stays neutral with regard to jurisdictional claims in published maps and institutional affiliations.

