Article

A 10-Year Statistic Study on the Tornadoes That Occurred in Jiangsu and Zhejiang Province: Composite Background Environment and Linear Trends

1
Transmission & Transformation Engineering Department, China Electric Power Research Institute, Beijing 100055, China
2
Department of Operation & Maintenance, State Grid Corporation of China, Beijing 100031, China
3
Department of Operation & Maintenance, State Grid Zhejiang Electric Power Co., Ltd., Hangzhou 310007, China
4
Department of Operation & Maintenance, State Grid Jiangsu Electric Power Co., Ltd., Nanjing 210024, China
5
Equipment Technology Center, Research Institute of State Grid Zhejiang Electric Power Company, Hangzhou 310014, China
*
Authors to whom correspondence should be addressed.
Sustainability 2022, 14(24), 16766; https://doi.org/10.3390/su142416766
Submission received: 29 October 2022 / Revised: 2 December 2022 / Accepted: 9 December 2022 / Published: 14 December 2022

Abstract

:
According to a 10-year (from 2007 to 2016) statistical analysis on the tornadoes in China, Jiangsu Province and Zhejiang Province, which share many similar geographical characteristics, experienced 159 (ranked first) and 59 (ranked fifth) tornadoes, respectively. Tornadoes within Jiangsu [i.e., the Jiangsu type (JST)] and those within Zhejiang [i.e., the Zhejiang type (ZJT)] featured notable annual, monthly and diurnal variations, which were remarkably different from each other. Both JST and ZJT showed the largest occurrence frequency (~50% on average) in the afternoon of summer, and the background environments before the formation of these tornadoes were composited to focus on their respective universal features. For the JST, it is found that, the upper-tropospheric divergence and positive geopotential-height anomaly, the middle-tropospheric shortwave trough, warm temperature advection and positive temperature anomaly, and the lower-tropospheric strong southwesterly wind, convergence and cyclonic vorticity all acted as favorable conditions for the convective activities within Jiangsu. For the ZJT, their background environment differed from that of the Jiangsu notably, and the conditions for the tornadoes’ formation were overall more favorable for the JST. Linear trend analyses indicated that, both the annual and seasonal (summer) occurrence of the JST tended to decrease significantly, whereas, those of the ZJT were not significant. For the JST, its occurrence frequency showed a low linear correlation to the variation of the surface temperature, instead, its decreasing frequency was more closely related to the significant weakening in the intensity of the vertical shear of the zonal wind and the updraft helicity within Jiangsu.

1. Introduction

Tornadoes are the most severe convective weather phenomenon that has ever been observed by humans [1]. The surface wind associated with them could reach up to 125–140 m s−1 [2], possessing huge destructive power. According to statistics, the United States of American suffered frequent and intense tornadic activities during the warm seasons [3,4,5]. Compared to that, occurrence frequency and intensity of the tornadoes in China were much lower [6,7,8,9,10]. However, due to the high population density and relatively low meteorological early warning capability [11], the tornadoes often caused serious casualties in China [12,13]. For instance, on 30 July 2005, a category 3 tornado on the enhanced Fujita scale (EF3) appeared in Lingbi County, Anhui Province, and resulted in 15 deaths and 46 injuries [6]. On 23 June 2016, an EF4 tornado occurred in Funing, Yancheng City, Jiangsu Province, and caused 98 deaths and more than 800 injuries [14]. In the evening of 14 May 2021, strong tornadoes of the EF3 level appeared successively in Suzhou and Wuhan, causing 14 deaths [9]. In addition to serious casualties, tornadoes often cause major economic losses in China [8,9]. Of these, their damages to the power facilities of the State Grid Corporation of China were usually more severe. This is because that, in addition to the local damages, the tornadoes’ effects on the State Grid could cause serious economic losses in other regions through interruption of the power supply. According to the statistic from the State Grid Corporation of China, on 4 October 2015, a tornado occurred in Panyu, Guangzhou, resulting in a large area of power failure in Guangzhou, with 409,000 families out of power. On 23 June 2016, a tornado hit Yancheng, Jiangsu Province, destroyed a transmission tower, and caused two 500-Kilovolt (kV) transmission lines to trip. This resulted in a power failure for around 73,600 families. On 3 July 2019, a tornado occurred in Kaiyuan, Liaoning Province, damaged 39 10-kV transmission lines and caused 7 transmission towers of 66-kV to fall. This resulted in a wide power off for around 64,800 users.
According to the statistic of Zhou et al. [15], around 983 tornadoes occurred in China during the 10-yr period of 2007–2016 (Figure 1a). Of these, 159 tornadoes were observed in Jiangsu Province (Figure 1b), occupying a proportion of ~16.2% (ranking first among all provinces in China). Among all provinces with a high occurrence of tornadoes, Jiangsu and Zhejiang share the most notable similarities in terms of geographical characteristics: (i) they are coastal regions which border the sea in the east; (ii) they have similar longitudes and latitudes; (iii) most of their terrain are below 1000 m. However, for Zhejiang Province, only ~59 tornadoes were observed (accounting for ~6%; ranking fifth), which was much less than that of Jiangsu. As tornadoes appeared in these two provinces frequently caused severe economic losses and serious casualties, it is necessary to conduct detailed investigations on them. Statistical features are vital to understand the tornadoes [8,9,10]. Since their horizontal scales are really small [11,12,16], statistical analyses were mainly focused on tornadoes’ background environment. For Jiangsu and Zhejiang, where tornadoes are active, thus far, no previous studies have shown the universal features of the tornadoes’ background environment, and their key statistical features also remain vague. Therefore, the primary purpose of this study is to fill these two knowledge gaps. Determining the key statistical features of the tornadoes is helpful to enhance the understanding of their evolution. Exploring the universal features of the formation conditions of the tornadoes is useful to identify the precursor signals of the tornadoes’ formation, which has the potential to improve the related forecasts.
The reminder of this study is structured as follows: data and method used in this study are presented in Section 2; Spatiotemporal features of the tornadoes in Jiangsu and Zhejiang are shown in Section 3; the universal features of the tornadoes’ background environment are provided in Section 4; trend analyses related to the tornadoes during the 10-year period are conducted in Section 5, and finally, a conclusion and discussion are reached in Section 6.

2. Data and Method

In this study, a total of two types of data were used: (a) the tornadoes during a 10-year period (2007–2016) were analyzed by using the dataset provided by Zhou et al. [15]. This dataset documented the time (year, month, day, hour) and location (longitude, latitude, province, etc.) of the tornadoes. (b) the tornadoes’ background environment (e.g., composite analyses, etc.) was investigated by using the hourly 0.25° × 0.25° European Centre for Medium-Range Weather Forecasts (ECMWF) ERA5 data [17], which has 37 vertical levels. The convective available potential energy (CAPE), sea-level pressure (SLP), 2-m temperature, 2-m dew point, zonal wind, meridional wind, vertical velocity, geopotential height and temperature were used in calculations and analyses.
In order to show the universal features of the background environment for tornadoes in Jiangsu, we conducted composite analyses following the steps (i–iv): (i) Analyzing the diurnal variations of the tornadoes within Jiangsu to determine the period with relatively high occurrence frequency (to ensure the representativeness of the result, the accumulated proportion should be higher than 50%). Only the tornadoes appeared in this period were used for the composite (as the tornadoes’ background environments were affected notably by local diurnal variations, it was better to use the events appeared during a similar period of a day for composite). Suppose the period with relatively high occurrence frequency was from T1 to T2, then, the midpoint of T1 and T2 could be calculated as Tm = (T1 + T2)/2. (ii) Selecting a time span (i.e., from P1 to P2) to represent the stage before tornadoes’ formation. Here, both P1 and P2 should be earlier than T1, and the midpoint of P1 and P2 could be calculated as Pm = (P1 + P2)/2. (iii) At each time step from P1 to P2, we composited the background environment of all the tornadoes with equal weight based on the Euler viewpoint (i.e., calculating their arithmetic mean in the same coordinate system) [18,19,20,21]. (iv) For the composited background environments at each time step, we calculated their temporal mean during the period from P1 to P2 with equal weight to represent the background environment before these tornadoes’ formation. In order to highlight the distinct features of the tornadoes’ background environments relative to the climate mean state from 2007 to 2016, at each hour, we calculated the anomaly of the tornadoes’ background environment from the climate mean state (i.e., composite background environment minus the climate mean state).
The updraft helicity utilized in this study was defined by Fu et al. [22], which could be used as an effective indicator for severe weathers. Its expression is w ζ z , where w is the vertical velocity in the (x, y, z) coordinate system (it could be calculated by using the vertical velocity in the pressure coordinate system based on the hydrostatic approximation), and ζ z is the vertical component of the vorticity vector. In this study, both the updraft helicity and the vertical integral of the updraft helicity were used for analyses.

3. Spatiotemporal Features

Overall, in China, tornadoes showed a remarkable decreasing trend from east to west (Figure 1a). Coastal regions south of 36° N featured the most active tornado activities, as tornadoes are closely related to tropical cyclones [8]. Another key feature for the horizontal distribution of tornadoes in China is that, they tended to appear over the regions with relatively low altitude and flat surface. This may be an important reason for the notable contrast on the tornadoes’ frequencies in China and the USA [10]. As Figure 1b shows, for the tornadoes within Jiangsu, more events tended to occur in the central section; whereas for those within Zhejiang, more tornadoes tended to appear in the northern section, where the surface was more flat than other sections of Zhejiang.
Annual variations of tornadoes in Jiangsu were shown in Figure 2a. It can be found that, the occurrence number showed notable fluctuations during the 10-yr period, with the largest frequency (40 tornadoes) appeared in 2008 and the smallest frequency (5 tornadoes) appeared in 2014 and 2016. Overall, the annual occurrence frequency of the tornadoes in Jiangsu showed a significant decreasing trend (exceeding the 99.5% confidence level) of −2.2 tornadoes per year. For Zhejiang, the tornadoes’ occurrence number was ~37.1% of that in Jiangsu. The annual frequency also showed notable fluctuations during the 10-yr period (Figure 2b), with the largest frequency (13 tornadoes) appeared in 2011 and the smallest frequency (0 tornadoes) appeared in 2013. The time when the peak and valley values appeared was different from that of Jiangsu. From 2007 to 2016, only a weak decreasing trend (cannot exceed the 85% confidence level) was found in the annual frequency. This is also different from that of Jiangsu.
As Figure 2c shows, tornadoes in Jiangsu showed a notable monthly variation, with only one peak (July; 71 tornadoes) appeared. Other months with tornadoes numbers above 10 were June (18) and August (52), whereas, during January, November and December, no tornadoes occurred in Jiangsu. Overall, a total of 141 tornadoes appeared in summer (from June to August), occupying a proportion of 88.7%. For the tornadoes in Zhejiang, they had two peaks (13 tornadoes) in the monthly variation, which appeared in April and July (orange bar in Figure 2c). A total of 34 tornadoes appeared in summer, occupying a proportion of 57.6%, whereas, during the whole winter (December, January, February), no tornadoes occurred in Zhejiang. In summary, the monthly variation of the tornadoes’ occurrence in Zhejiang was notably different from that of Jiangsu.
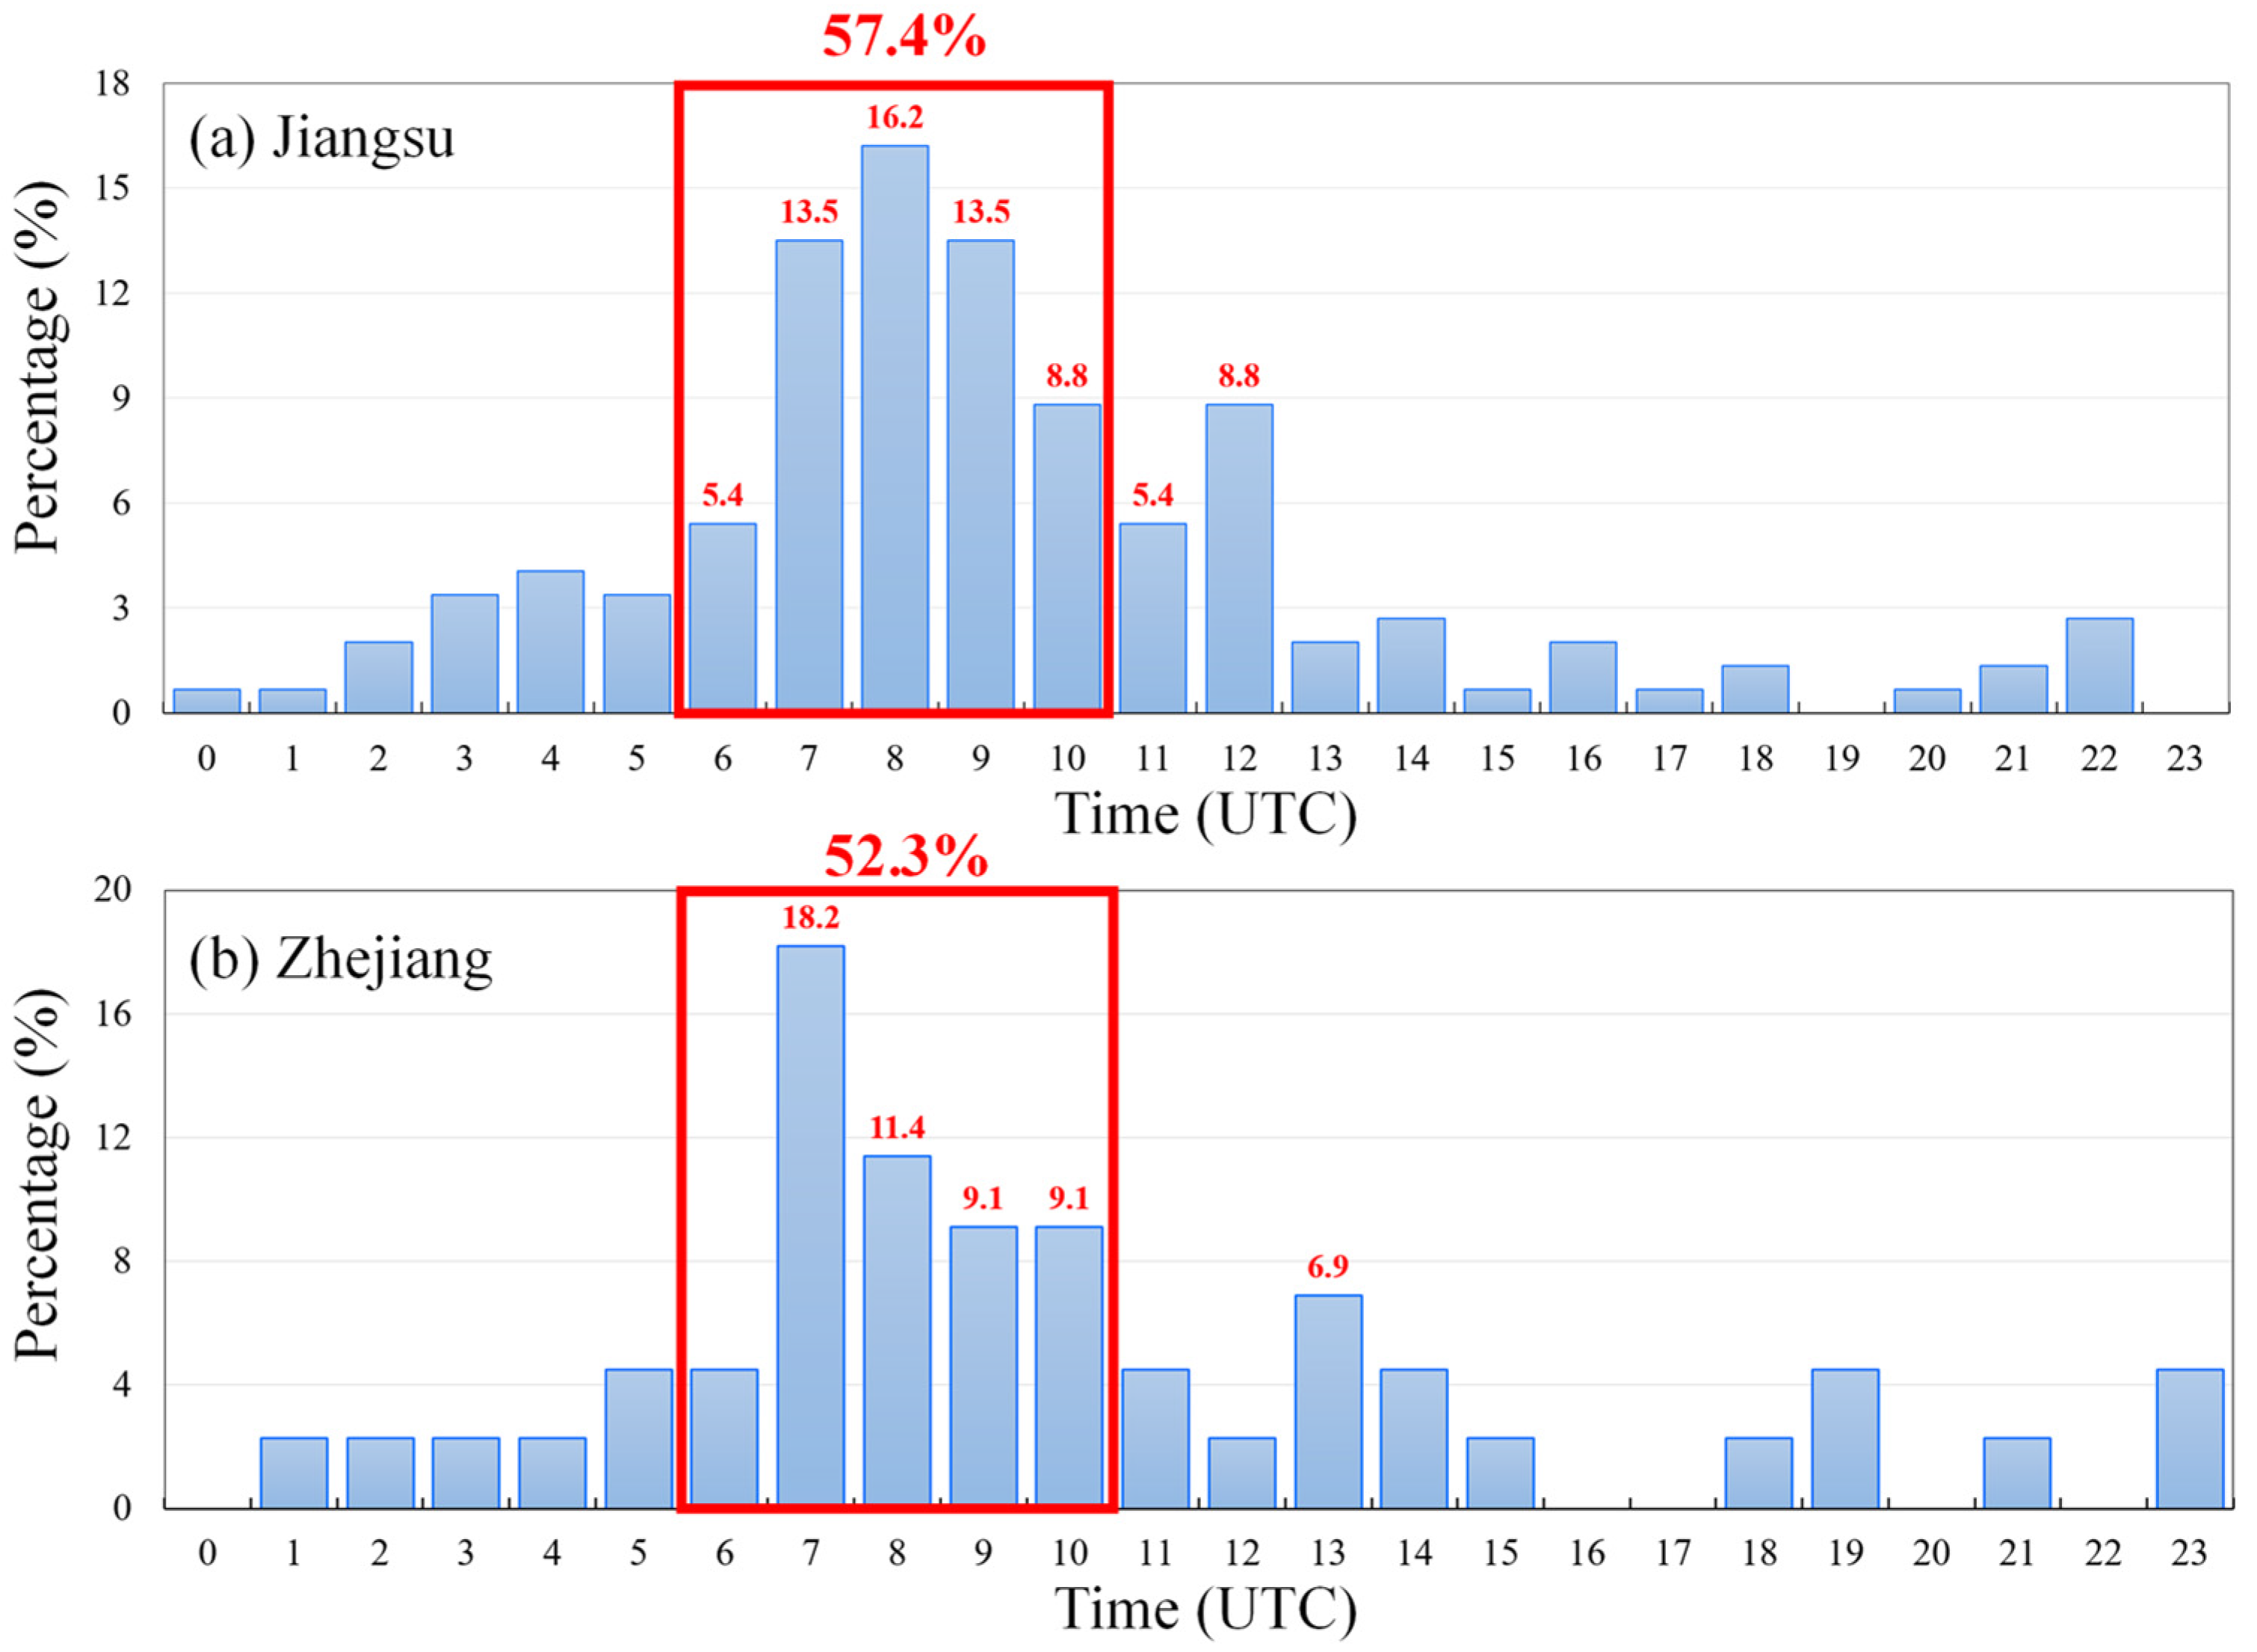
For the tornadoes documented in Zhou et al. [15], there were some events without an accurate time of occurrence. For these events, (i) if there were a time range, we calculated the temporal mean of this range to represent the hour when the tornadoes appeared; (ii) if there were no information about their hour, we did not use these events in the diurnal variation analyses. Therefore, there were a total of 148 tornadoes in Jiangsu and 44 tornadoes in Zhejiang for the analyses of diurnal variation. From Figure 3a, the tornadoes in Jiangsu showed a notable diurnal variation feature, with two peaks appeared at 0800 UTC [i.e., 1600 local standard time (LST)] and 1200 UTC, respectively. The former occupied a proportion of ~16.2%, and the latter accounted for ~8.8%. Around 57.4% tornadoes (85 events) appeared in the afternoon (i.e., the successive period from 0600 UTC to 1000 UTC). For the tornadoes in Zhejiang, they also showed two peaks, the first one appeared at 0700 UTC, accounting for 18.2%, and the second appeared at 1300 UTC accounting for 6.9%. These two peaks appeared at different time from those of Jiangsu. From 0600 UTC to 1000 UTC, around 52.3% tornadoes (23 events) occurred in Zhejiang, implying that the period featured the most frequent occurrence of tornadoes. This was consistent with that of Jiangsu, and therefore we defined T1 = 0600 UTC and T2 = 1000 UTC (Section 2) to analyze the tornadoes in both provinces. To focus on the stage before the tornadoes’ formation, we defined P1 = 0000 UTC and P2 = 0300 UTC (Section 2). As mentioned above, Tm = 0800 UTC and Pm = 0130 UTC, and thus the composite mentioned in Section 2 mainly show the background environment ~6.5 h before the tornadoes’ formation. Because the seasonal variations might change the background environment notably, it is better to remove their effects. A further analysis indicates that, for the 85 tornadoes appeared in the afternoon of Jiangsu (from 0600 UTC to 1000 UTC), 81 events appeared in summer (from June to August). For the 23 tornadoes appeared in the afternoon of Zhejiang, 15 events appeared in summer. So, for both provinces, tornadoes showed the largest occurrence frequency (~50% on average) in the afternoon of summer. Thus, in this study, the composite studies were conducted on the tornadoes appeared in the afternoon of summer (81 events in Jiangsu and 15 events in Zhejiang) to show the universal features of their background environment. Since we only focused on the tornadoes in summer, when calculated the climate mean state, we only used June, July and August (Section 2), and therefore, the anomalies in analyses were relative to the climate mean state of summer.

4. Universal Features of the Background Environment

In this section, we analyzed the composite background environments of the tornadoes that appeared within Jiangsu and Zhejiang, respectively, during the afternoon of summer (81 events in Jiangsu and 15 events in Zhejiang). To obtain the horizontal composite results, we used the method described in Section 2, with T1 = 0600 UTC, T2 = 1000 UTC, P1 = 0000 UTC and P2 = 0300 UTC. To obtain the vertical profile of a key factor, (i) we calculated its horizontal composites at all vertical levels from 1000 hPa to 200 hPa to get a three-dimensional composite field; (ii) we calculated the mean location of the tornadoes in Jiangsu/Zhejiang; (iii) we calculated the horizontal averaged (centered at the mean location of the tornadoes in Jiangsu/Zhejiang, and had a radius of 0.5°) vertical profile of the key factor by using the three-dimensional composite field of (i). For the sake of simplicity, we defined the composite results for the tornadoes in Jiangsu as the Jiangsu type (JST), and those for the tornadoes in Zhejiang as the Zhejiang type (ZJT).

4.1. Configuration of Different Vertical Levels

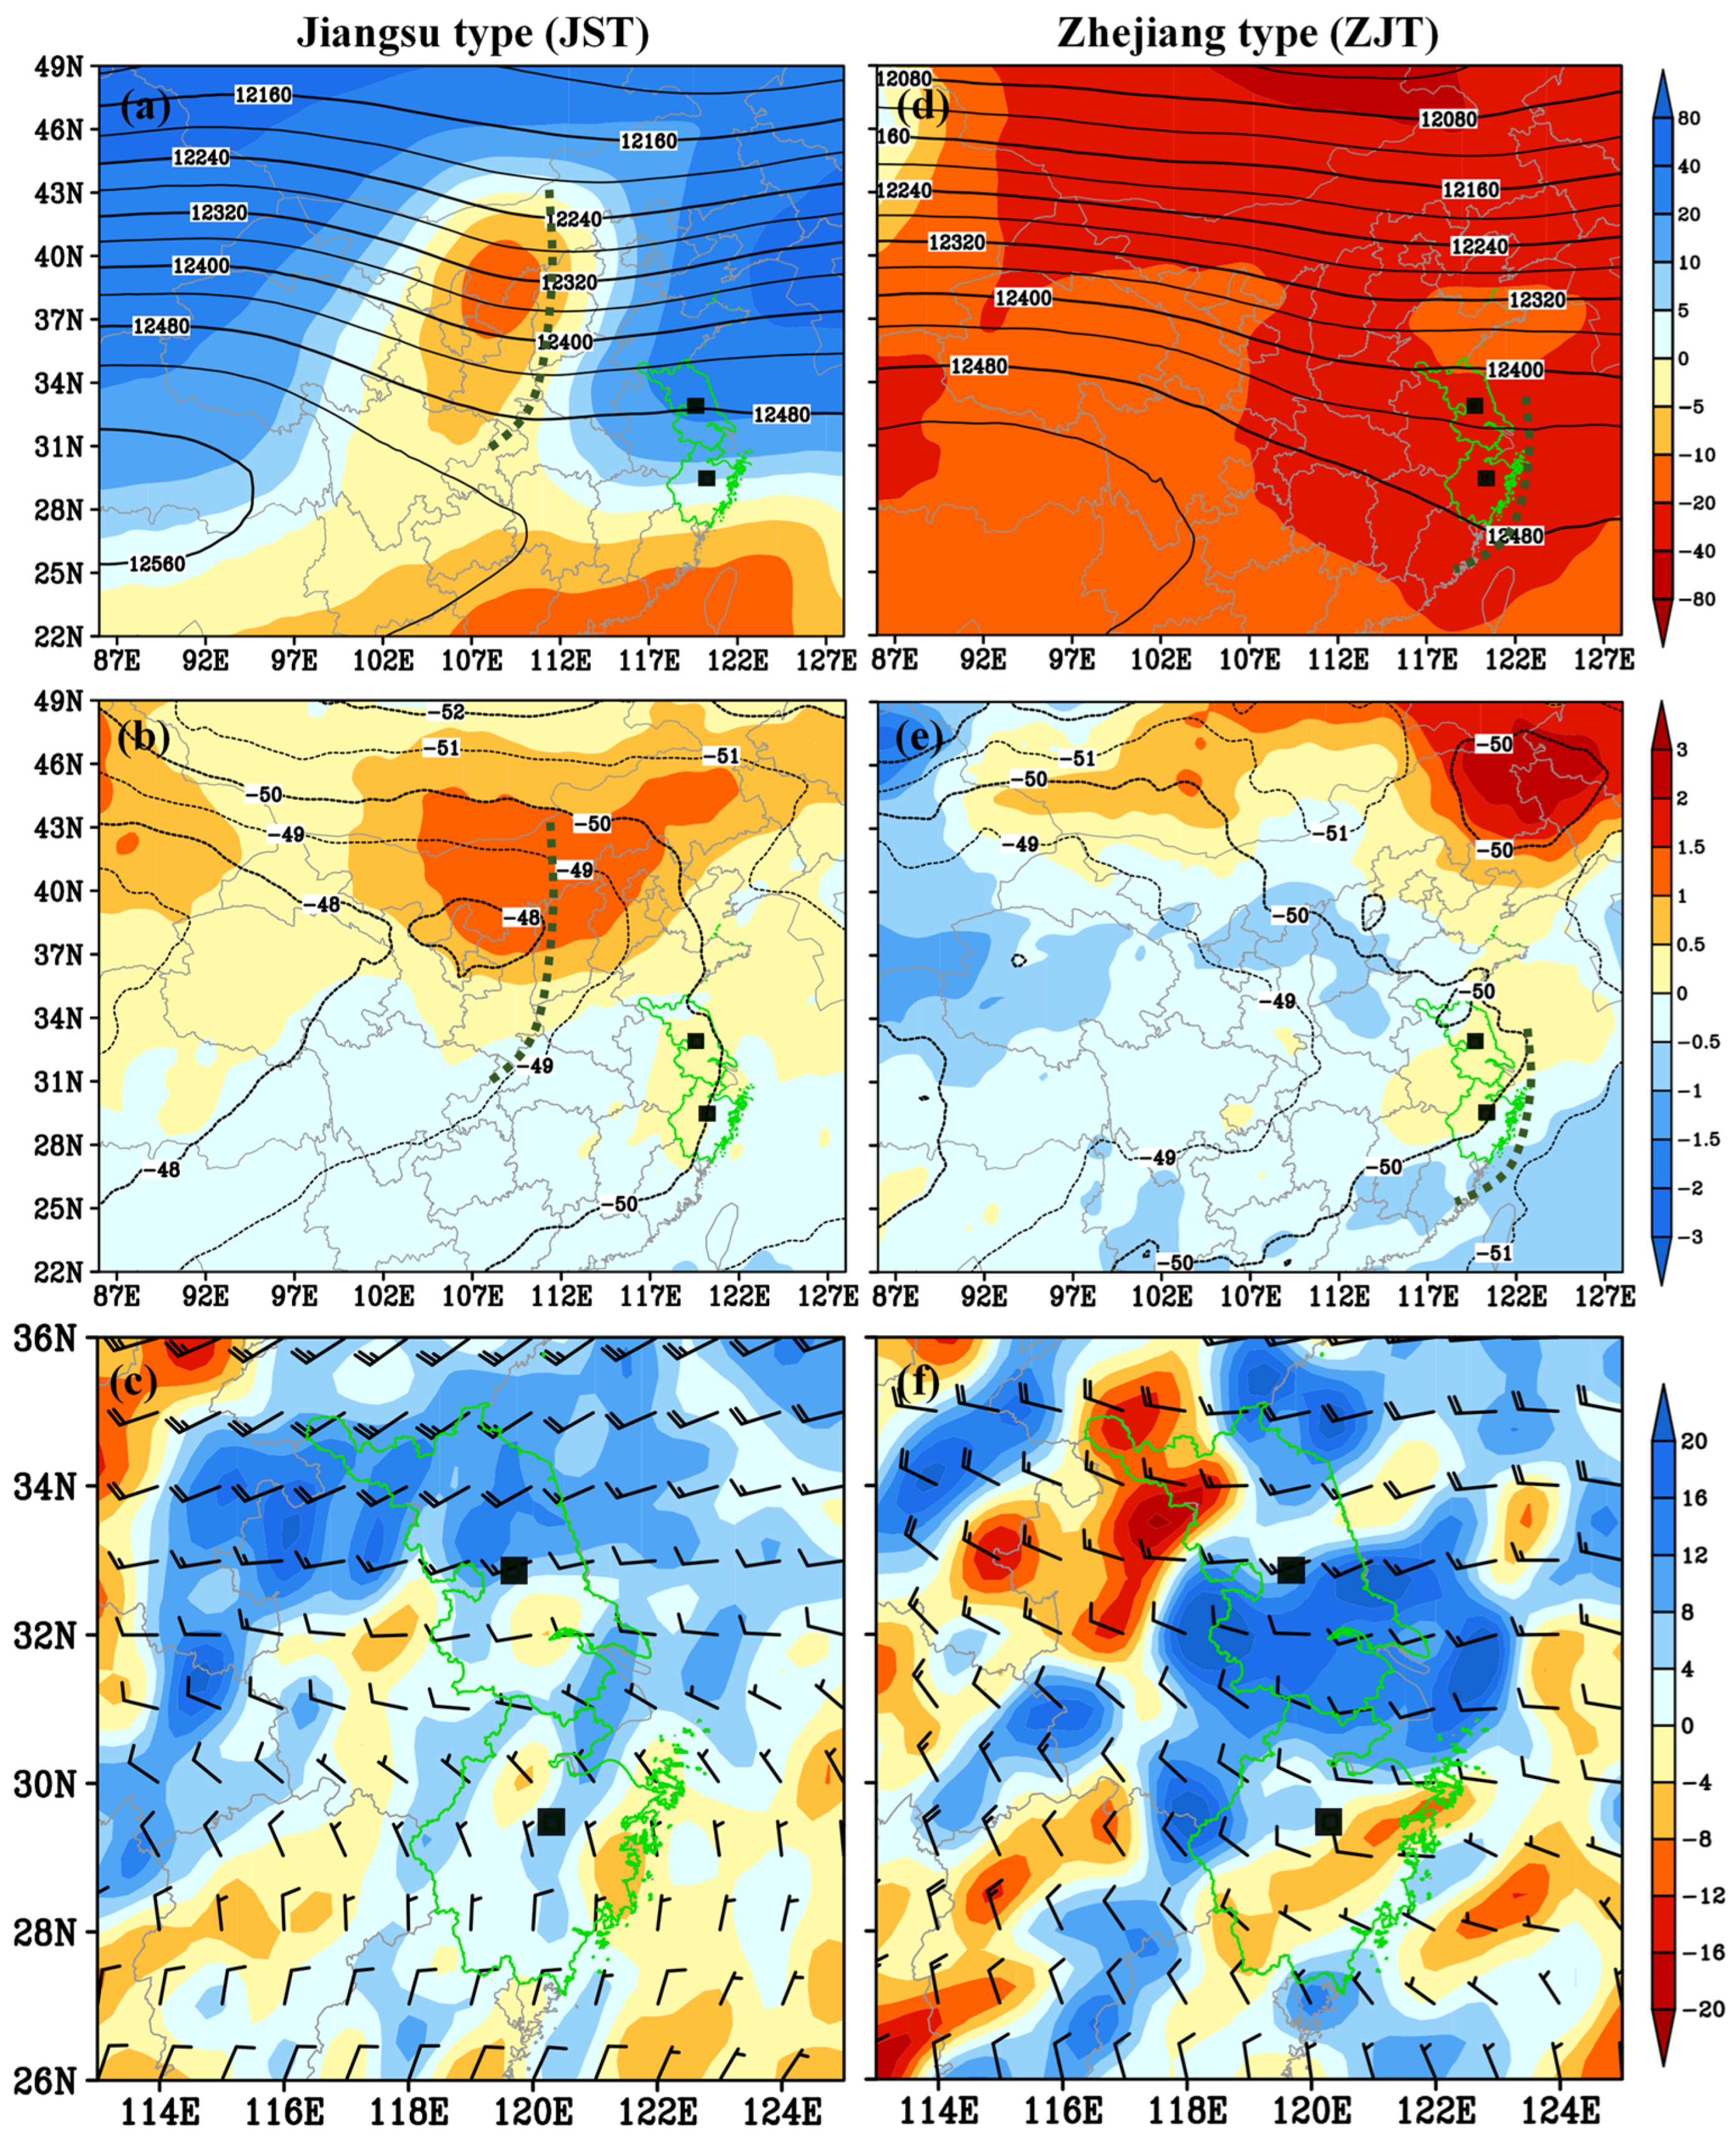
In the high troposphere, for the JST, the South Asia High (SAH) maintained around 28° N (Figure 4a), which was at a higher latitude than that of the 10-year climate mean state (according to the distribution of the geopotential-height anomaly). Northeast of the SAH, there was a shortwave trough in the middle and high latitudes, with its trough line mainly located around 112° E. The trough was associated with a warm tongue which stretched from west to east (Figure 4b), featuring a notable positive temperature anomaly. West of the trough line, a negative geopotential-height anomaly (Figure 4a) and a warm center (Figure 4b) appeared; whereas, east of the trough line, a positive geopotential-height anomaly (Figure 4a) was dominant. Most of Jiangsu was located southeast of the shortwave trough, which was dominated by a positive geopotential-height anomaly (Figure 4b), a southward decreasing westerly wind (Figure 4c) and a notable divergence. These were favorable for ascending motions. Compared to those of the JST, the ZJT showed a notably different background environment: the SAH was weaker (Figure 4d); the shortwave trough was located in a region with lower latitude but larger longitude, with Zhejiang located west of the trough line (around 122° E); the negative geopotential-height anomaly was in a much wider range which dominated Zhejiang. Moreover, the northern and southern sections of Zhejiang showed different features, as the former was governed by a positive temperature anomaly (Figure 4e), a westerly wind and a divergence (Figure 4f), whereas, the latter was controlled by a negative temperature anomaly (Figure 4e), a northwesterly wind and a convergence (Figure 4f). Therefore, the northern section was more favorable for ascending motions.
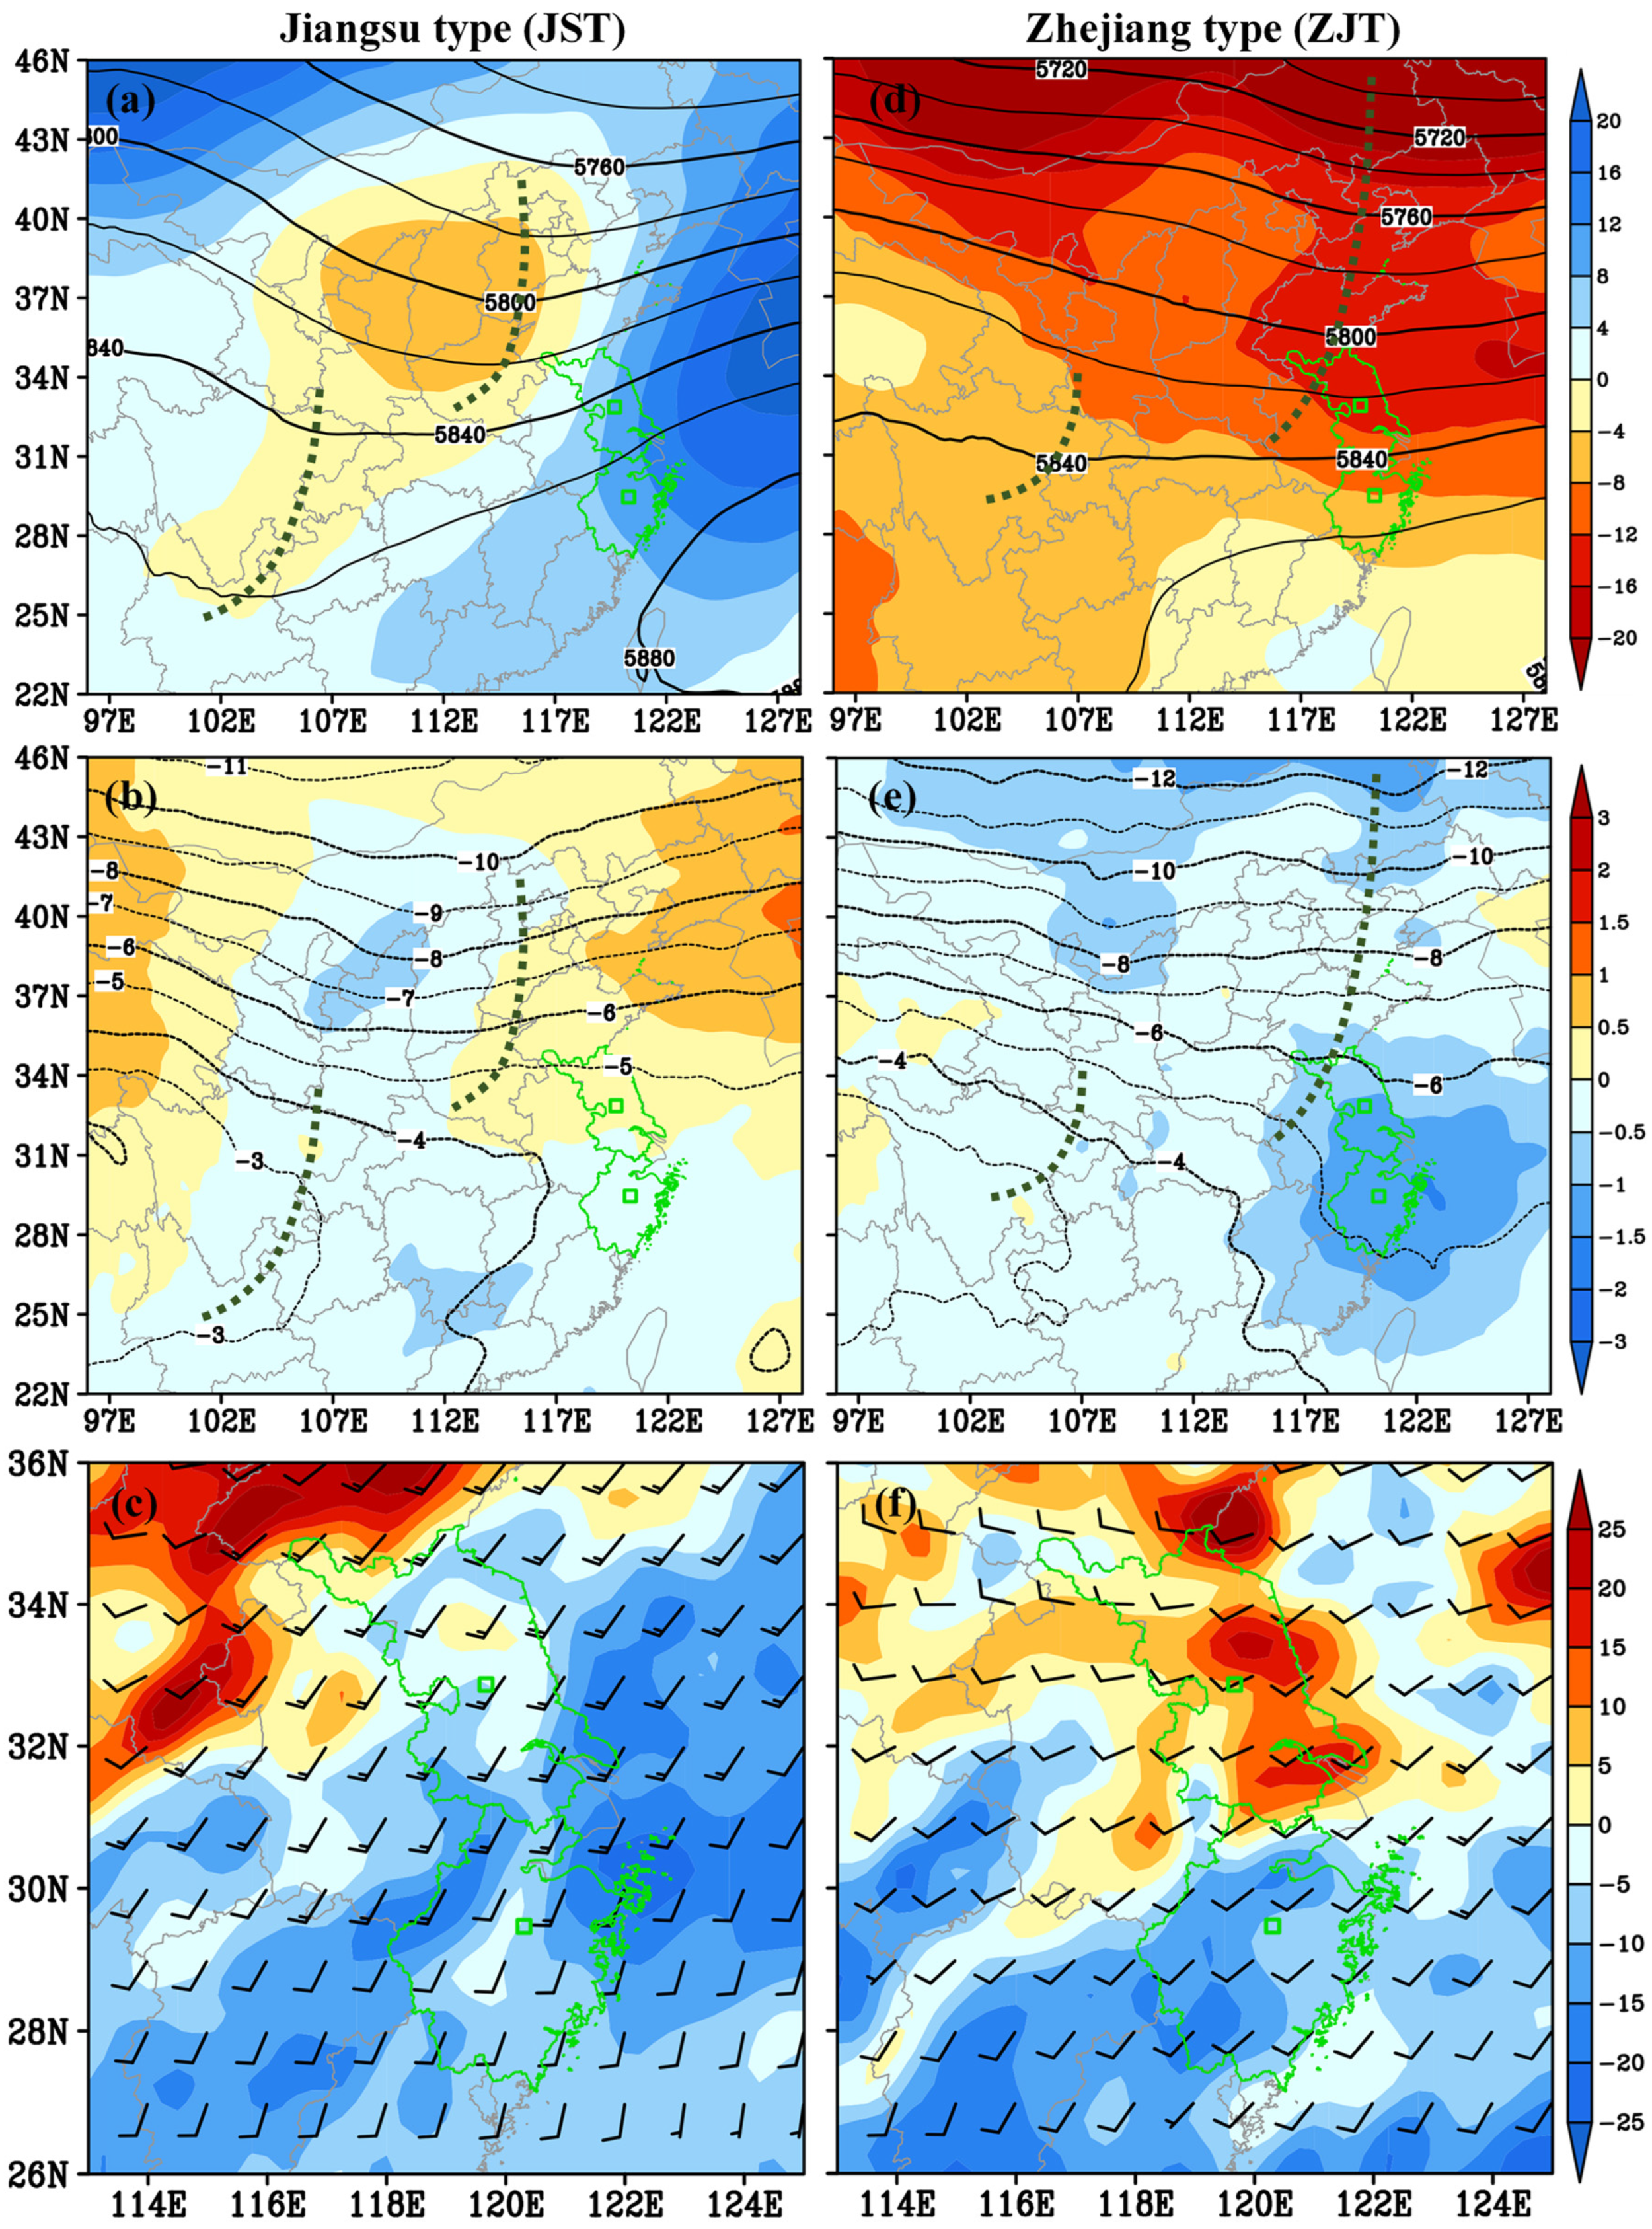
In the middle troposphere, for the JST, the Western Pacific Subtropical High (WPSH) mainly maintained southeast of Zhejiang (referred to the 5880 isohypse in Figure 5a). Over the Chinese mainland there were two shortwave troughs, which were associated with a southwest-northeast orientated negative geopotential-height anomaly. Jiangsu was located ahead of the shortwave trough over Henan and Hebei, where positive geopotential-height anomaly (Figure 5a) and warm temperature anomaly (Figure 5b) were dominant. As a southwesterly wind (Figure 5c) and a northeastward decreasing temperature field (Figure 5b) controlled Jiangsu, warm temperature advection appeared over this region. This was favorable for promoting ascending motions and lowering the lower-level pressure [23,24]. For the ZJT, it showed similar features to those of the JST, except that: (i) its WPSH was much weaker than that of the JST (Figure 5d); (ii) its negative geopotential-height anomaly was much stronger and larger (in area) than those of the JST, which controlled Zhejiang; (iii) Zhejiang was dominated by a strong cold temperature anomaly (Figure 5e); and (iv) the vorticity over Zhejiang was much smaller than that over Jiangsu (cf., Figure 5c,f).
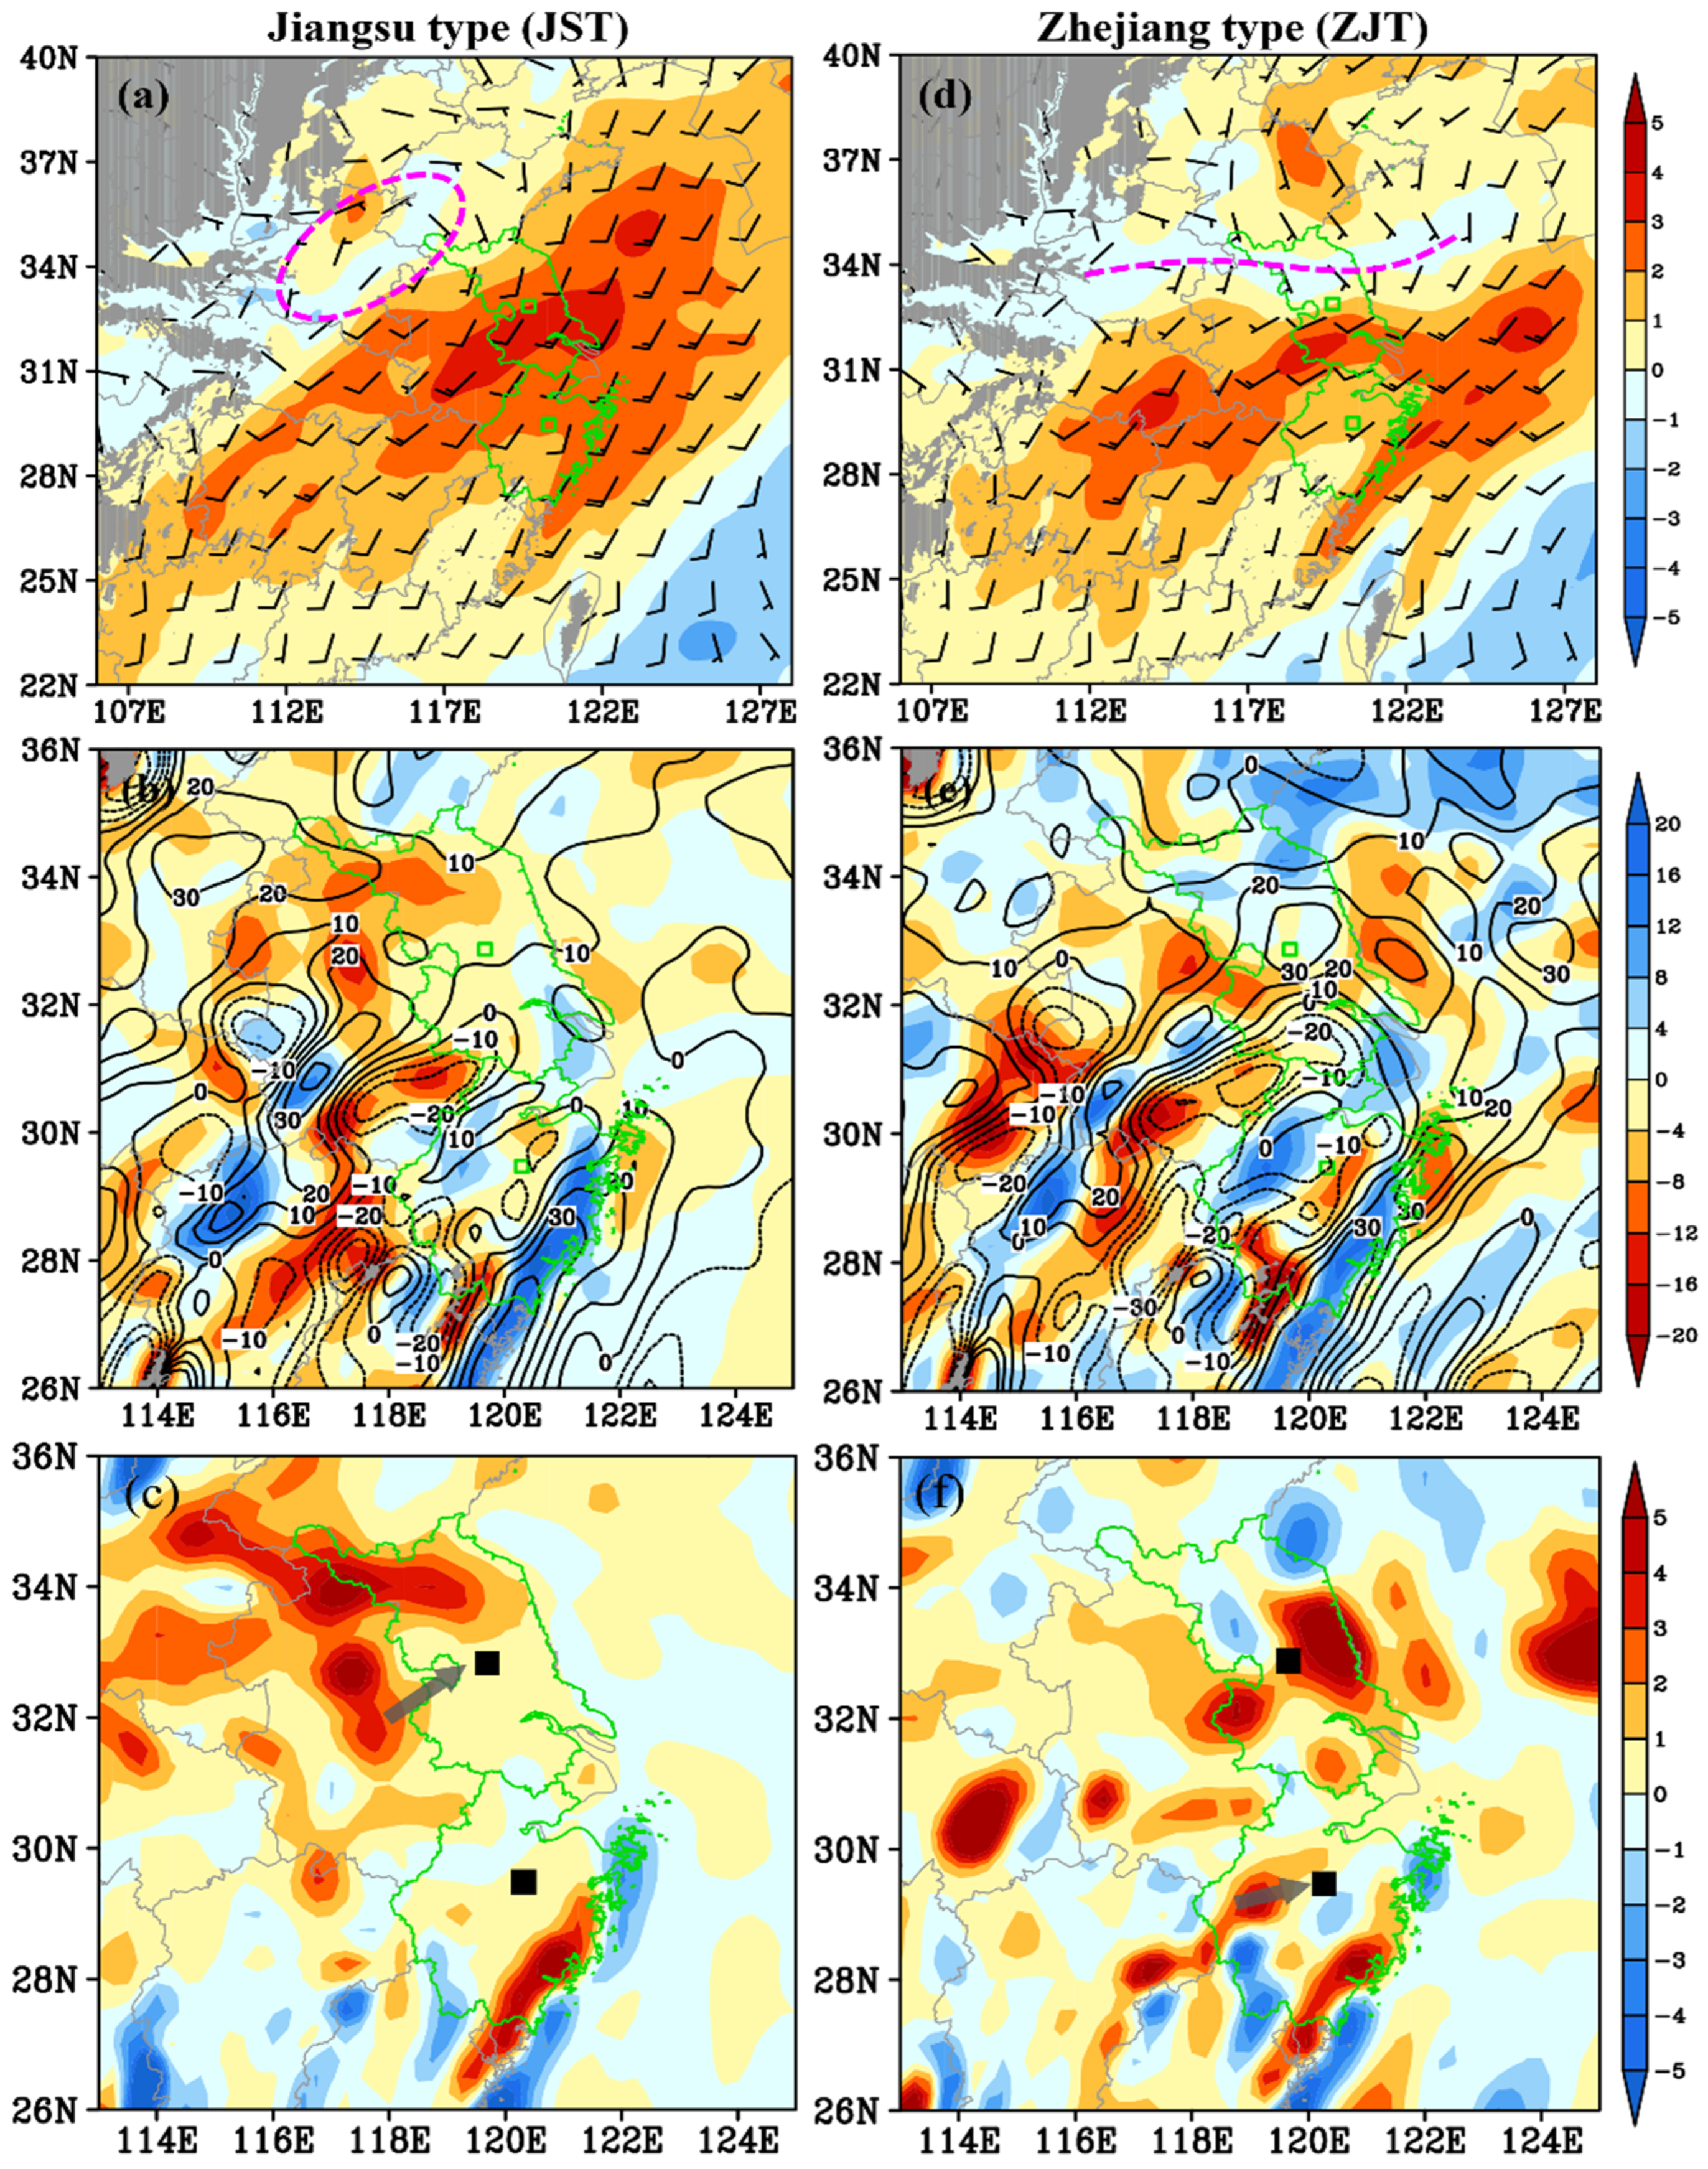
In the lower troposphere, at 700 hPa, Jiangsu was located southeast of a shortwave trough (that maintained over Henan and Hebei; Figure 6a), where was controlled by a high-pressure system (its closed center was located over the East China Sea). Negative and positive geopotential-height anomaly controlled the trough and high-pressure system, respectively. A strong southwesterly wind band that was along the periphery of the high-pressure system, controlled Jiangsu (Figure 6b), with the maximum wind speed anomaly of ≥4 m s−1 appeared in the northern section of Jiangsu. Overall, a negative vorticity dominated Jiangsu (Figure 6c), whereas, for the divergence, its horizontal distribution was different for the northern and southern sections of Jiangsu, which reached a nearly neutral effect within the regions around the mean location of the tornadoes in Jiangsu (i.e., the small green box in Jiangsu). At 900 hPa, it is clear that a mesoscale vortex maintained between the mountains in the west and Jiangsu (the purple ellipse in Figure 7a). Jiangsu was governed by a strong southwesterly wind related to the vortex, with the maximum wind speed anomaly of ≥3 m s−1 appeared in its southern section. Overall, Jiangsu was controlled by a strong convergence and a cyclonic vorticity (Figure 7b), both of which contributed to the convective activities [25,26,27,28,29]. For the ZJT, at 700 hPa, Zhejiang was also dominated by a high-pressure system (Figure 6d) and featured a negative geopotential-height anomaly (weaker than that of the JST). A westerly wind that decreased towards south appeared over Zhejiang (Figure 6e), corresponding to a positive wind speed anomaly (the maximum value was smaller than that of the JST). A negative vorticity dominated Zhejiang (Figure 6f), whereas, for the divergence, strong divergence and convergence both appeared, which reached an overall divergent effect. At 900 hPa, a zonally orientated shear line maintained around 34° N, its related southwesterly wind and positive wind speed anomaly governed Zhejiang (Figure 7d). As Figure 7e shows, positive and negative values of divergence appeared alternatively in Zhejiang, whereas, for the regions around (i.e., within a 1° × 1° box) the mean location of the tornadoes’ formation, the convergence was overall stronger than the divergence. This favored the convective activities [25,26]. Similarly, positive and negative values of vorticity appeared alternatively in Zhejiang, and resulted in an overall effect of anticyclonic vorticity. For the vertical integrated updraft helicity (from surface to 2 km), the mean tornadogenesis location (i.e., the composite center of the tornadoes) in Jiangsu was located northeast of a strong helicity center (Figure 7c). The helicity center would move northeastward towards the mean tornadogenesis location under the steering of the strong lower-level southwesterly wind (Figure 7a). This was conducive to the tornadogenesis within Jiangsu [22,26]. Similarly, the mean tornadogenesis location in Zhejiang was located east of a strong helicity center (Figure 7f), which would move eastward (under the steering of the strong lower-level westerly wind; Figure 7d) and favored the tornadogenesis within Zhejiang.

4.2. Surface Features

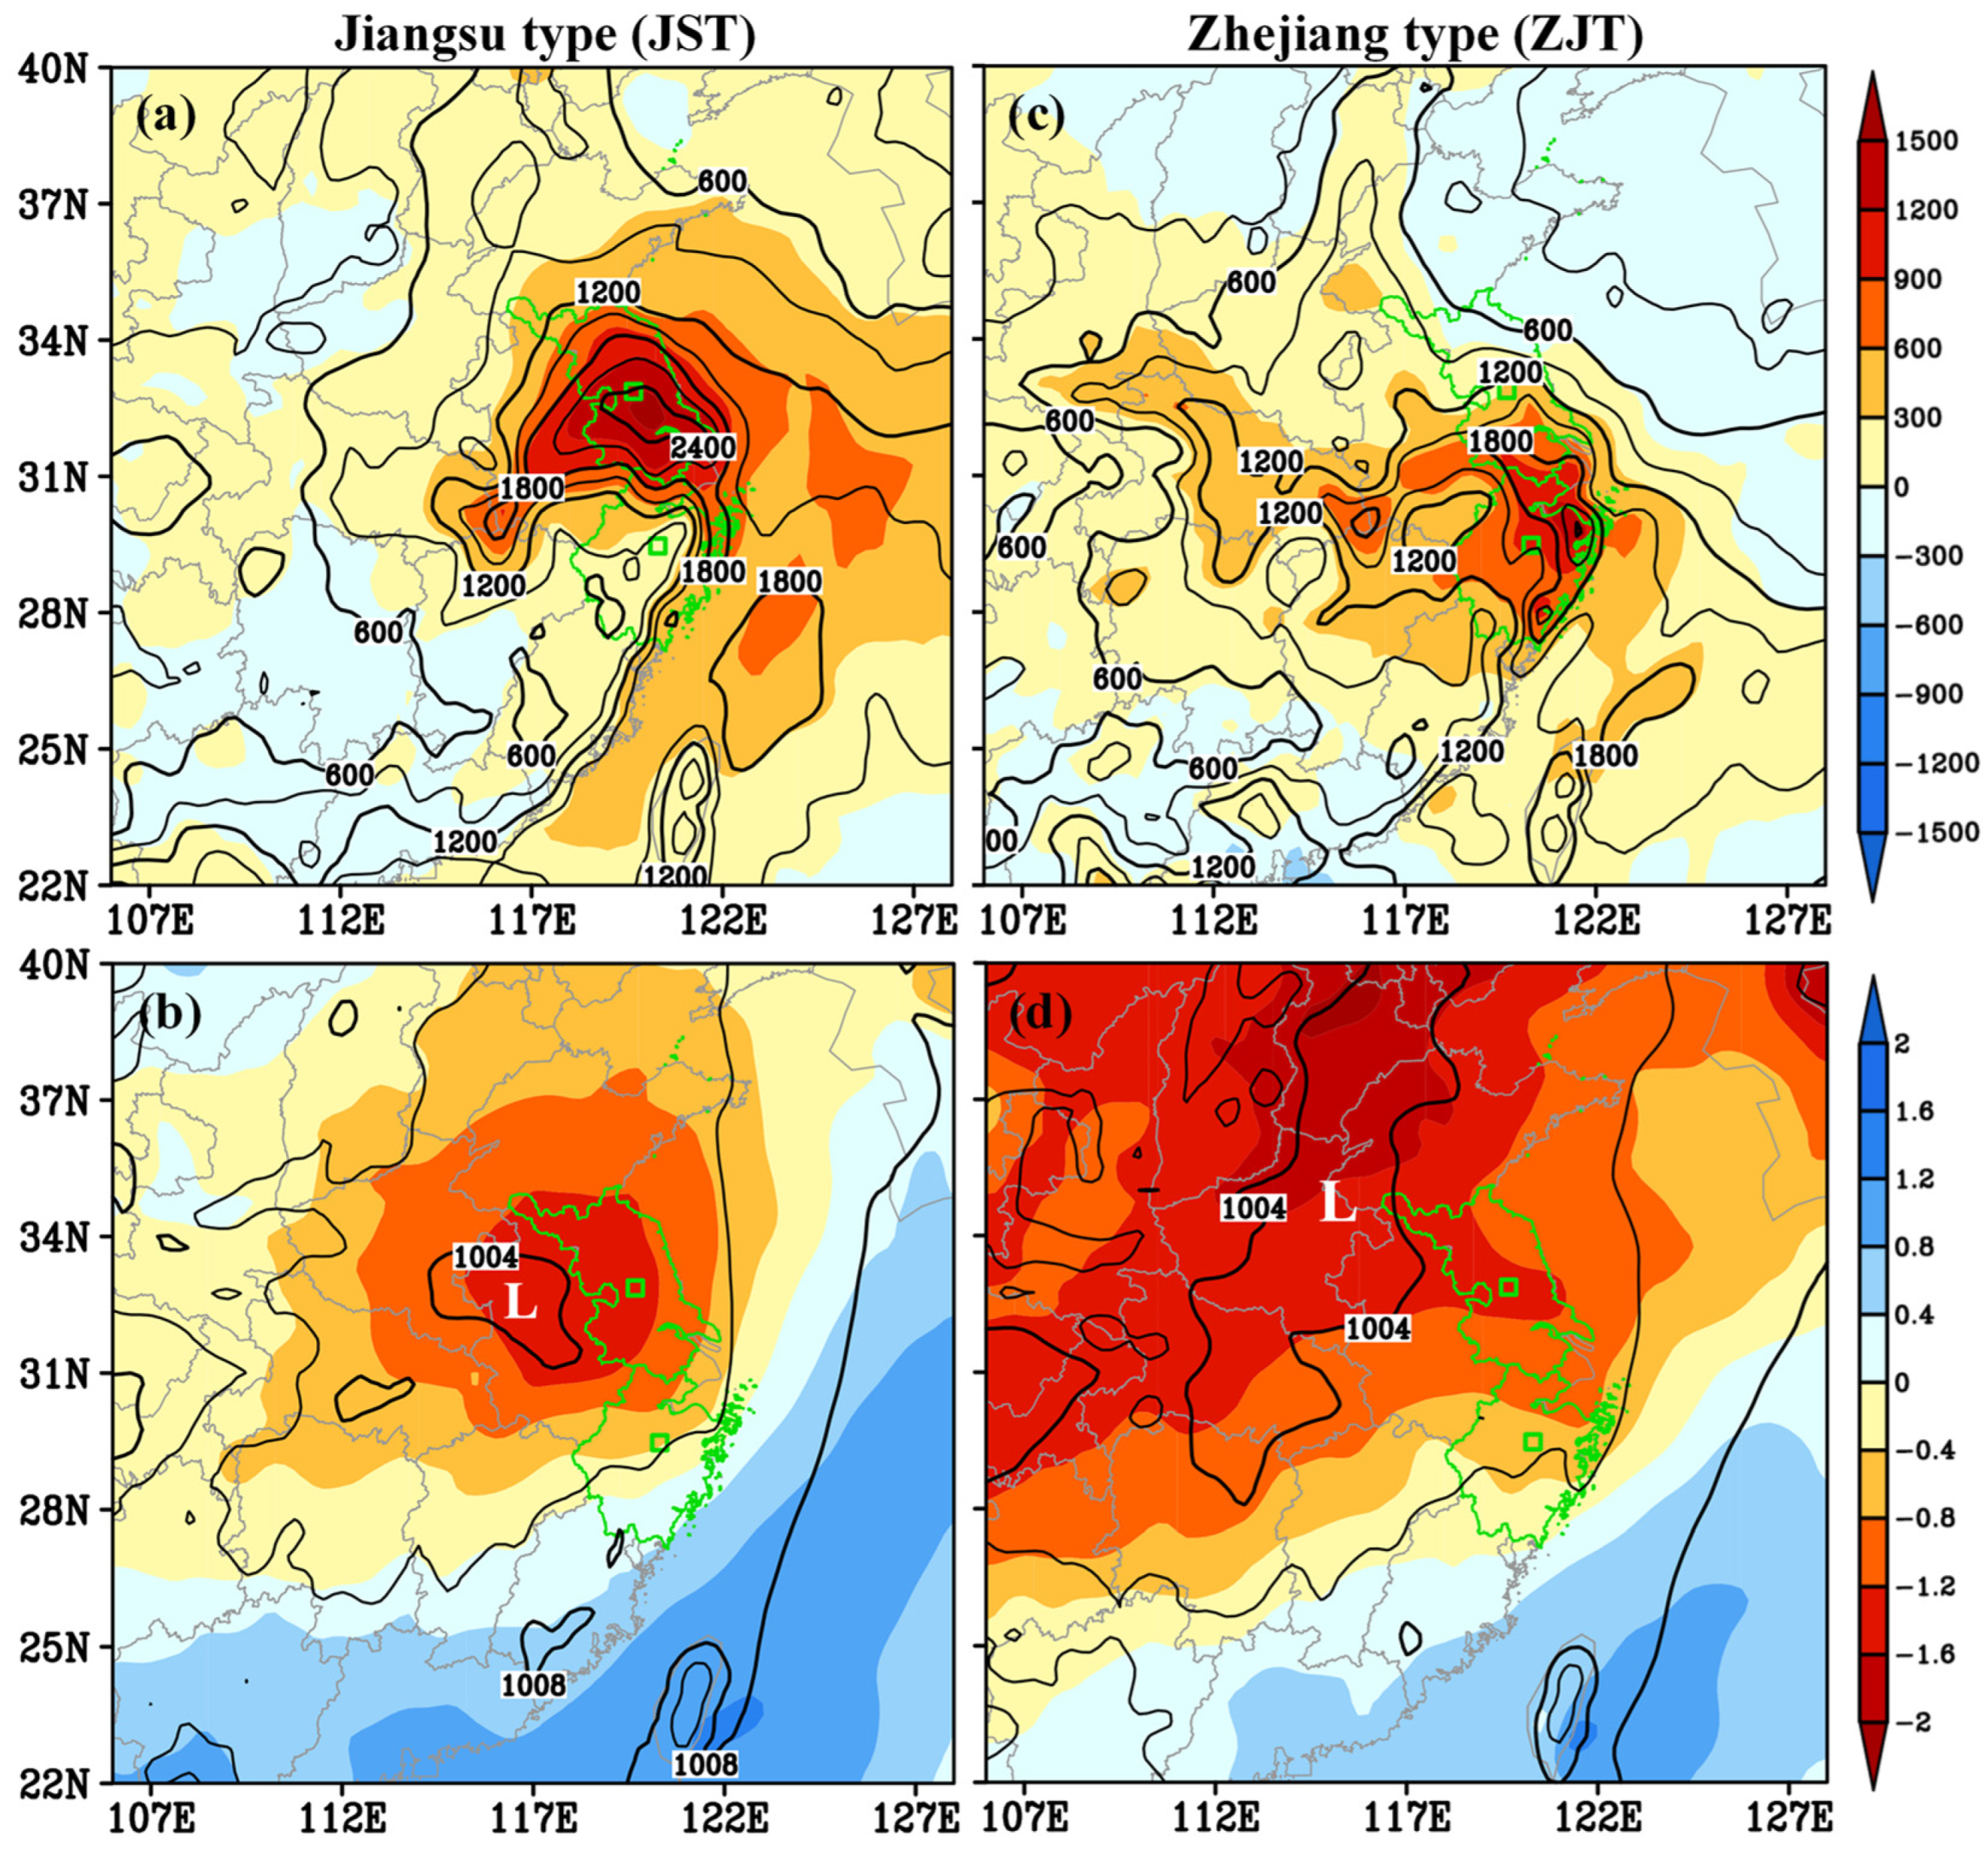
From Figure 8a, for the JST, a CAPE center of up to 2400 J kg−1 appeared in Jiangsu, which was much higher than the climate mean state (≥1500 J kg−1). A closed surface low center appeared west of Jiangsu (Figure 8b), which was associated with a strong negative SLP anomaly center. Jiangsu was located within a surface low-pressure band, where negative SLP anomaly was notable. High CAPE and low surface pressure were conducive to the convective activities. Similarly, for the ZJT, strong CAPE (the maximum value was above 2100 J kg−1) and positive CAPE anomaly also appeared in Zhejiang (Figure 8c), however, their intensity was weaker than that of the JST. Moreover, Zhejiang was mainly governed by a low-pressure zone that stretched from west to east (Figure 8d), and the corresponding SLP anomaly was also negative (weaker than that of the JST). These were favorable for the convective activities in Zhejiang.
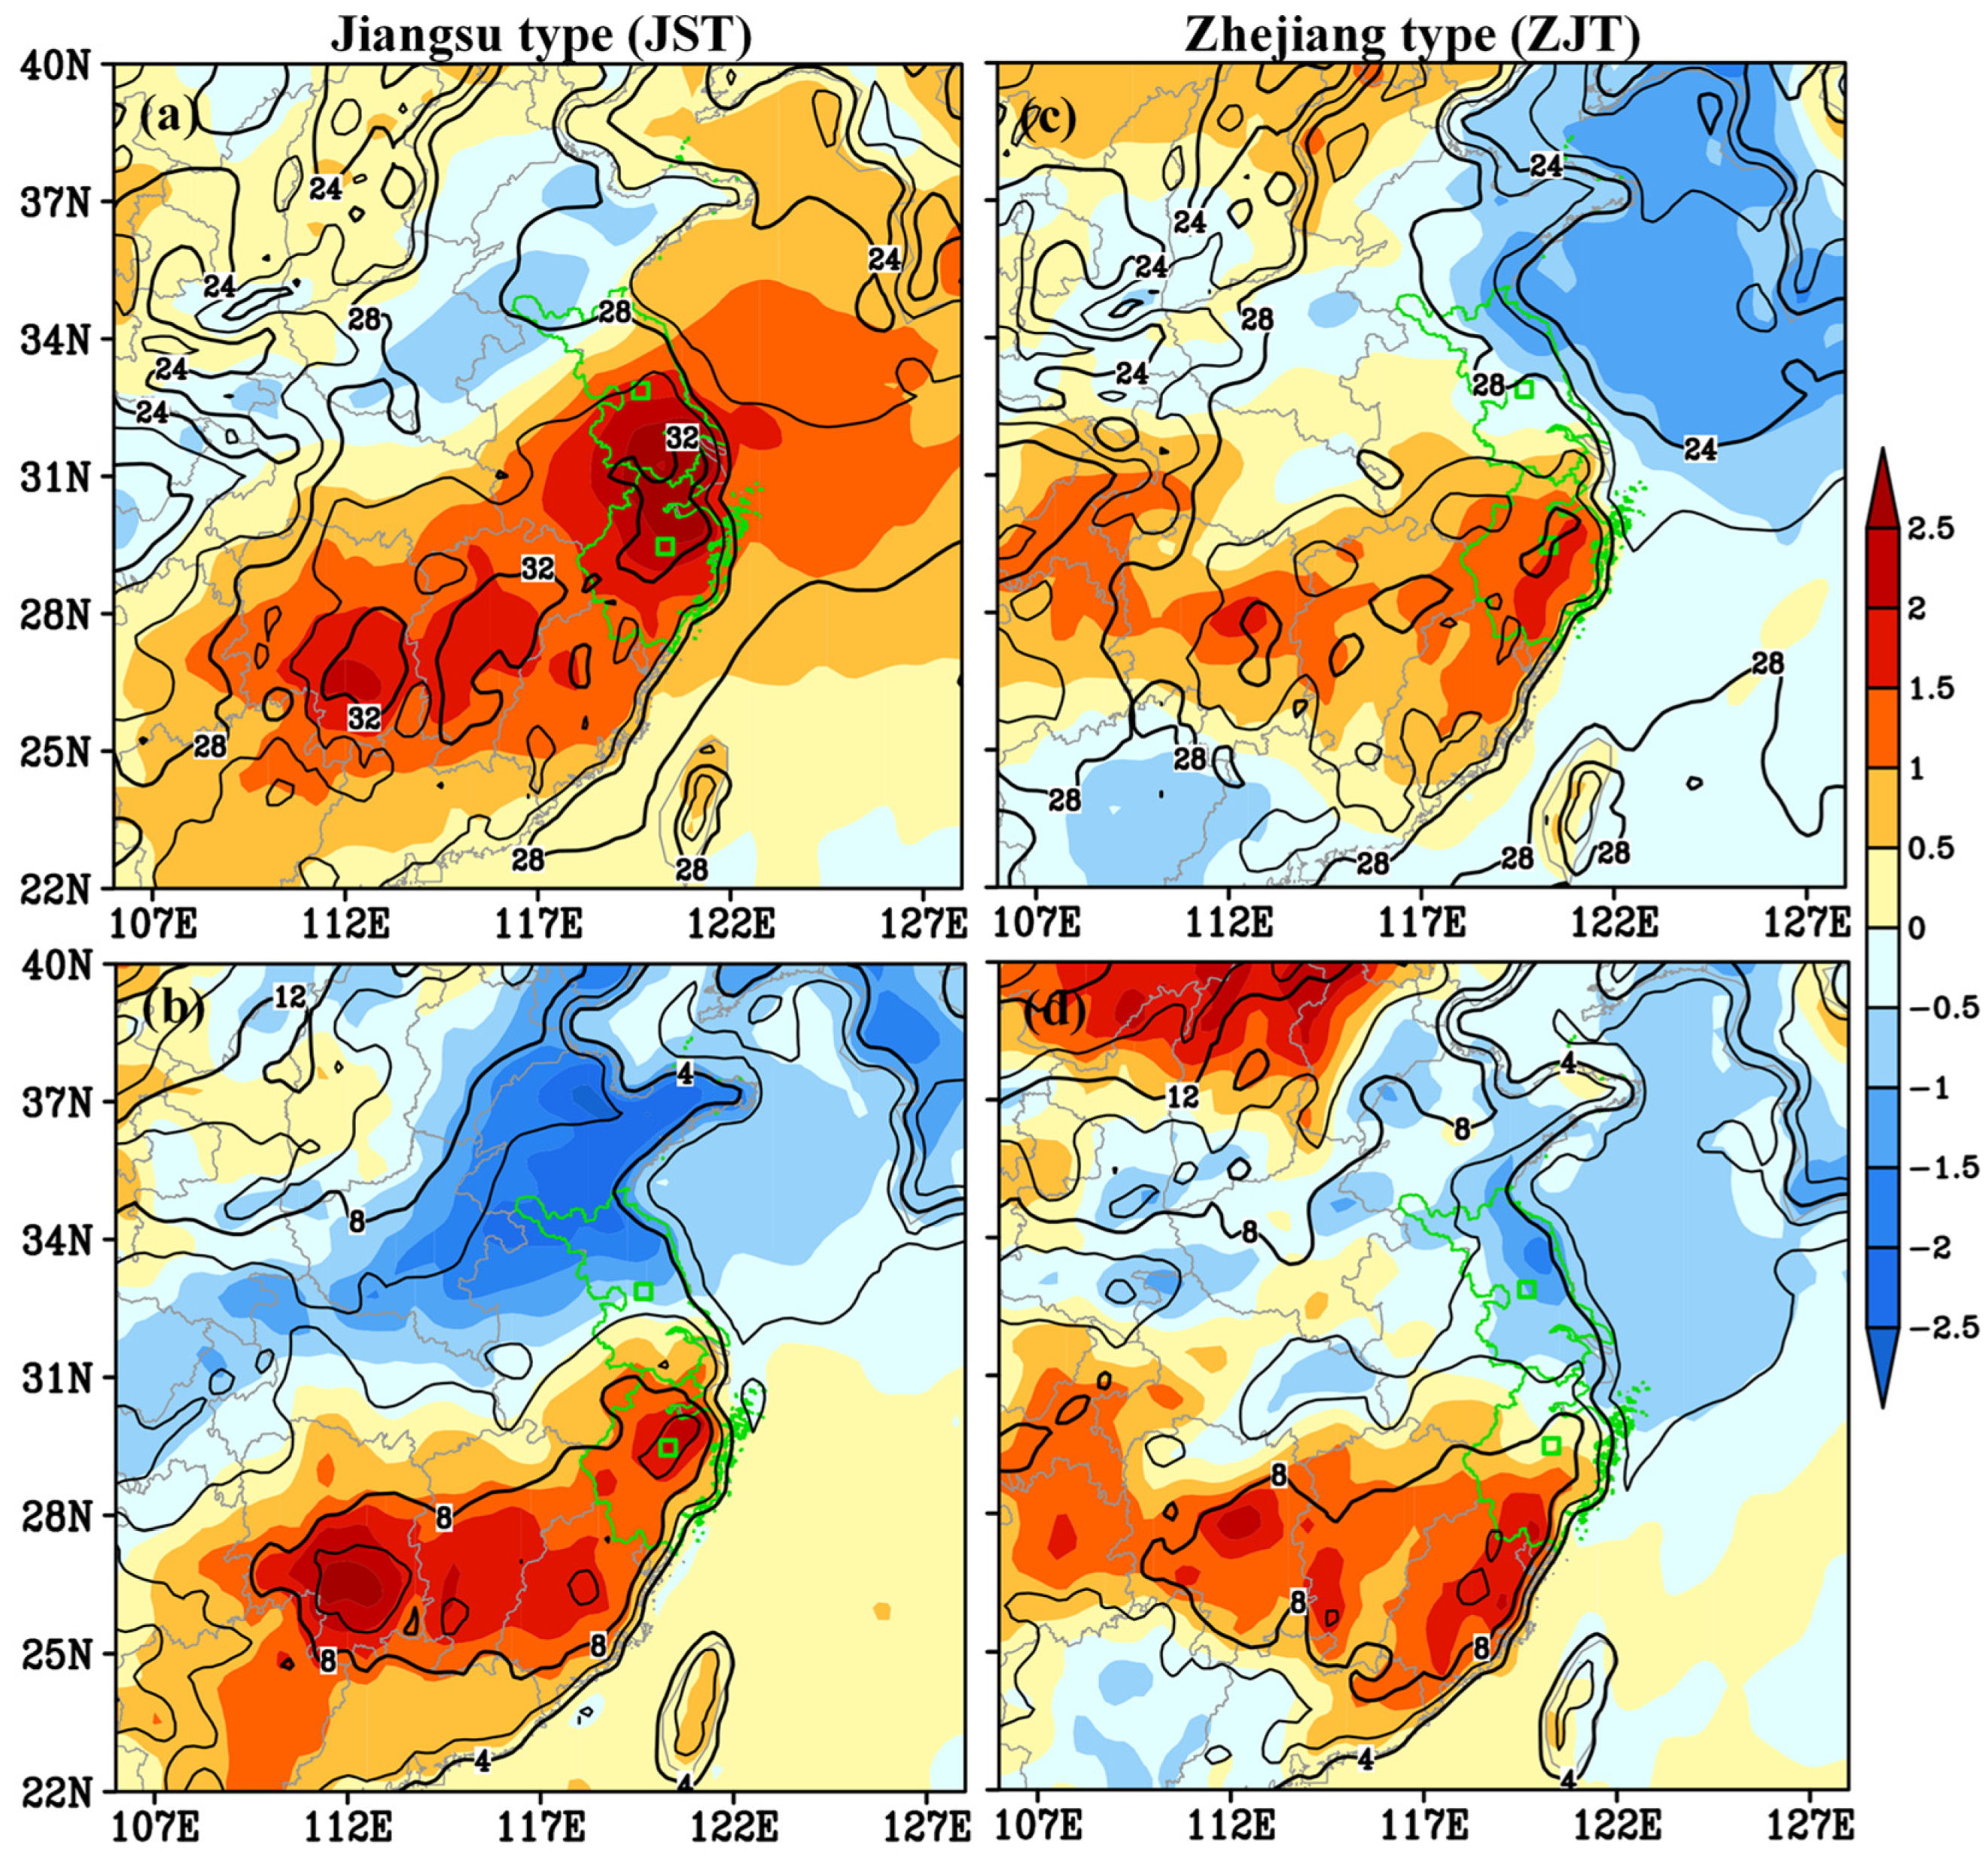
As Figure 9a shows, Jiangsu was governed by a southwest-northeast orientated surface warm tongue (the strongest warm center was above 32 °C), which featured a strong positive 2 m-temperature anomaly (maximum anomaly was above 2.5 °C). Moreover, at the surface, Jiangsu was located within a southwest-northeast orientated moist band (Figure 9b), where the difference of 2-m temperature and dew point (DTD) was mainly below 6 °C. The DTD anomaly within Jiangsu was mainly negative, indicating that it was moister than that of the climate mean state. A warmer and more moist background environment were conducive to the convective activities. For the ZJT, in terms of temperature, Zhejiang was also dominated by a warm zone (the strongest warm center was above 32 °C) and a warm temperature anomaly (weaker than that of the JST). In terms of moisture, Zhejiang was located within a relatively dry zone (Figure 9d), where the DTD was mainly above 8 °C, and the DTD anomaly was positive. This was notably different from that of JST.

4.3. Vertical Profiles

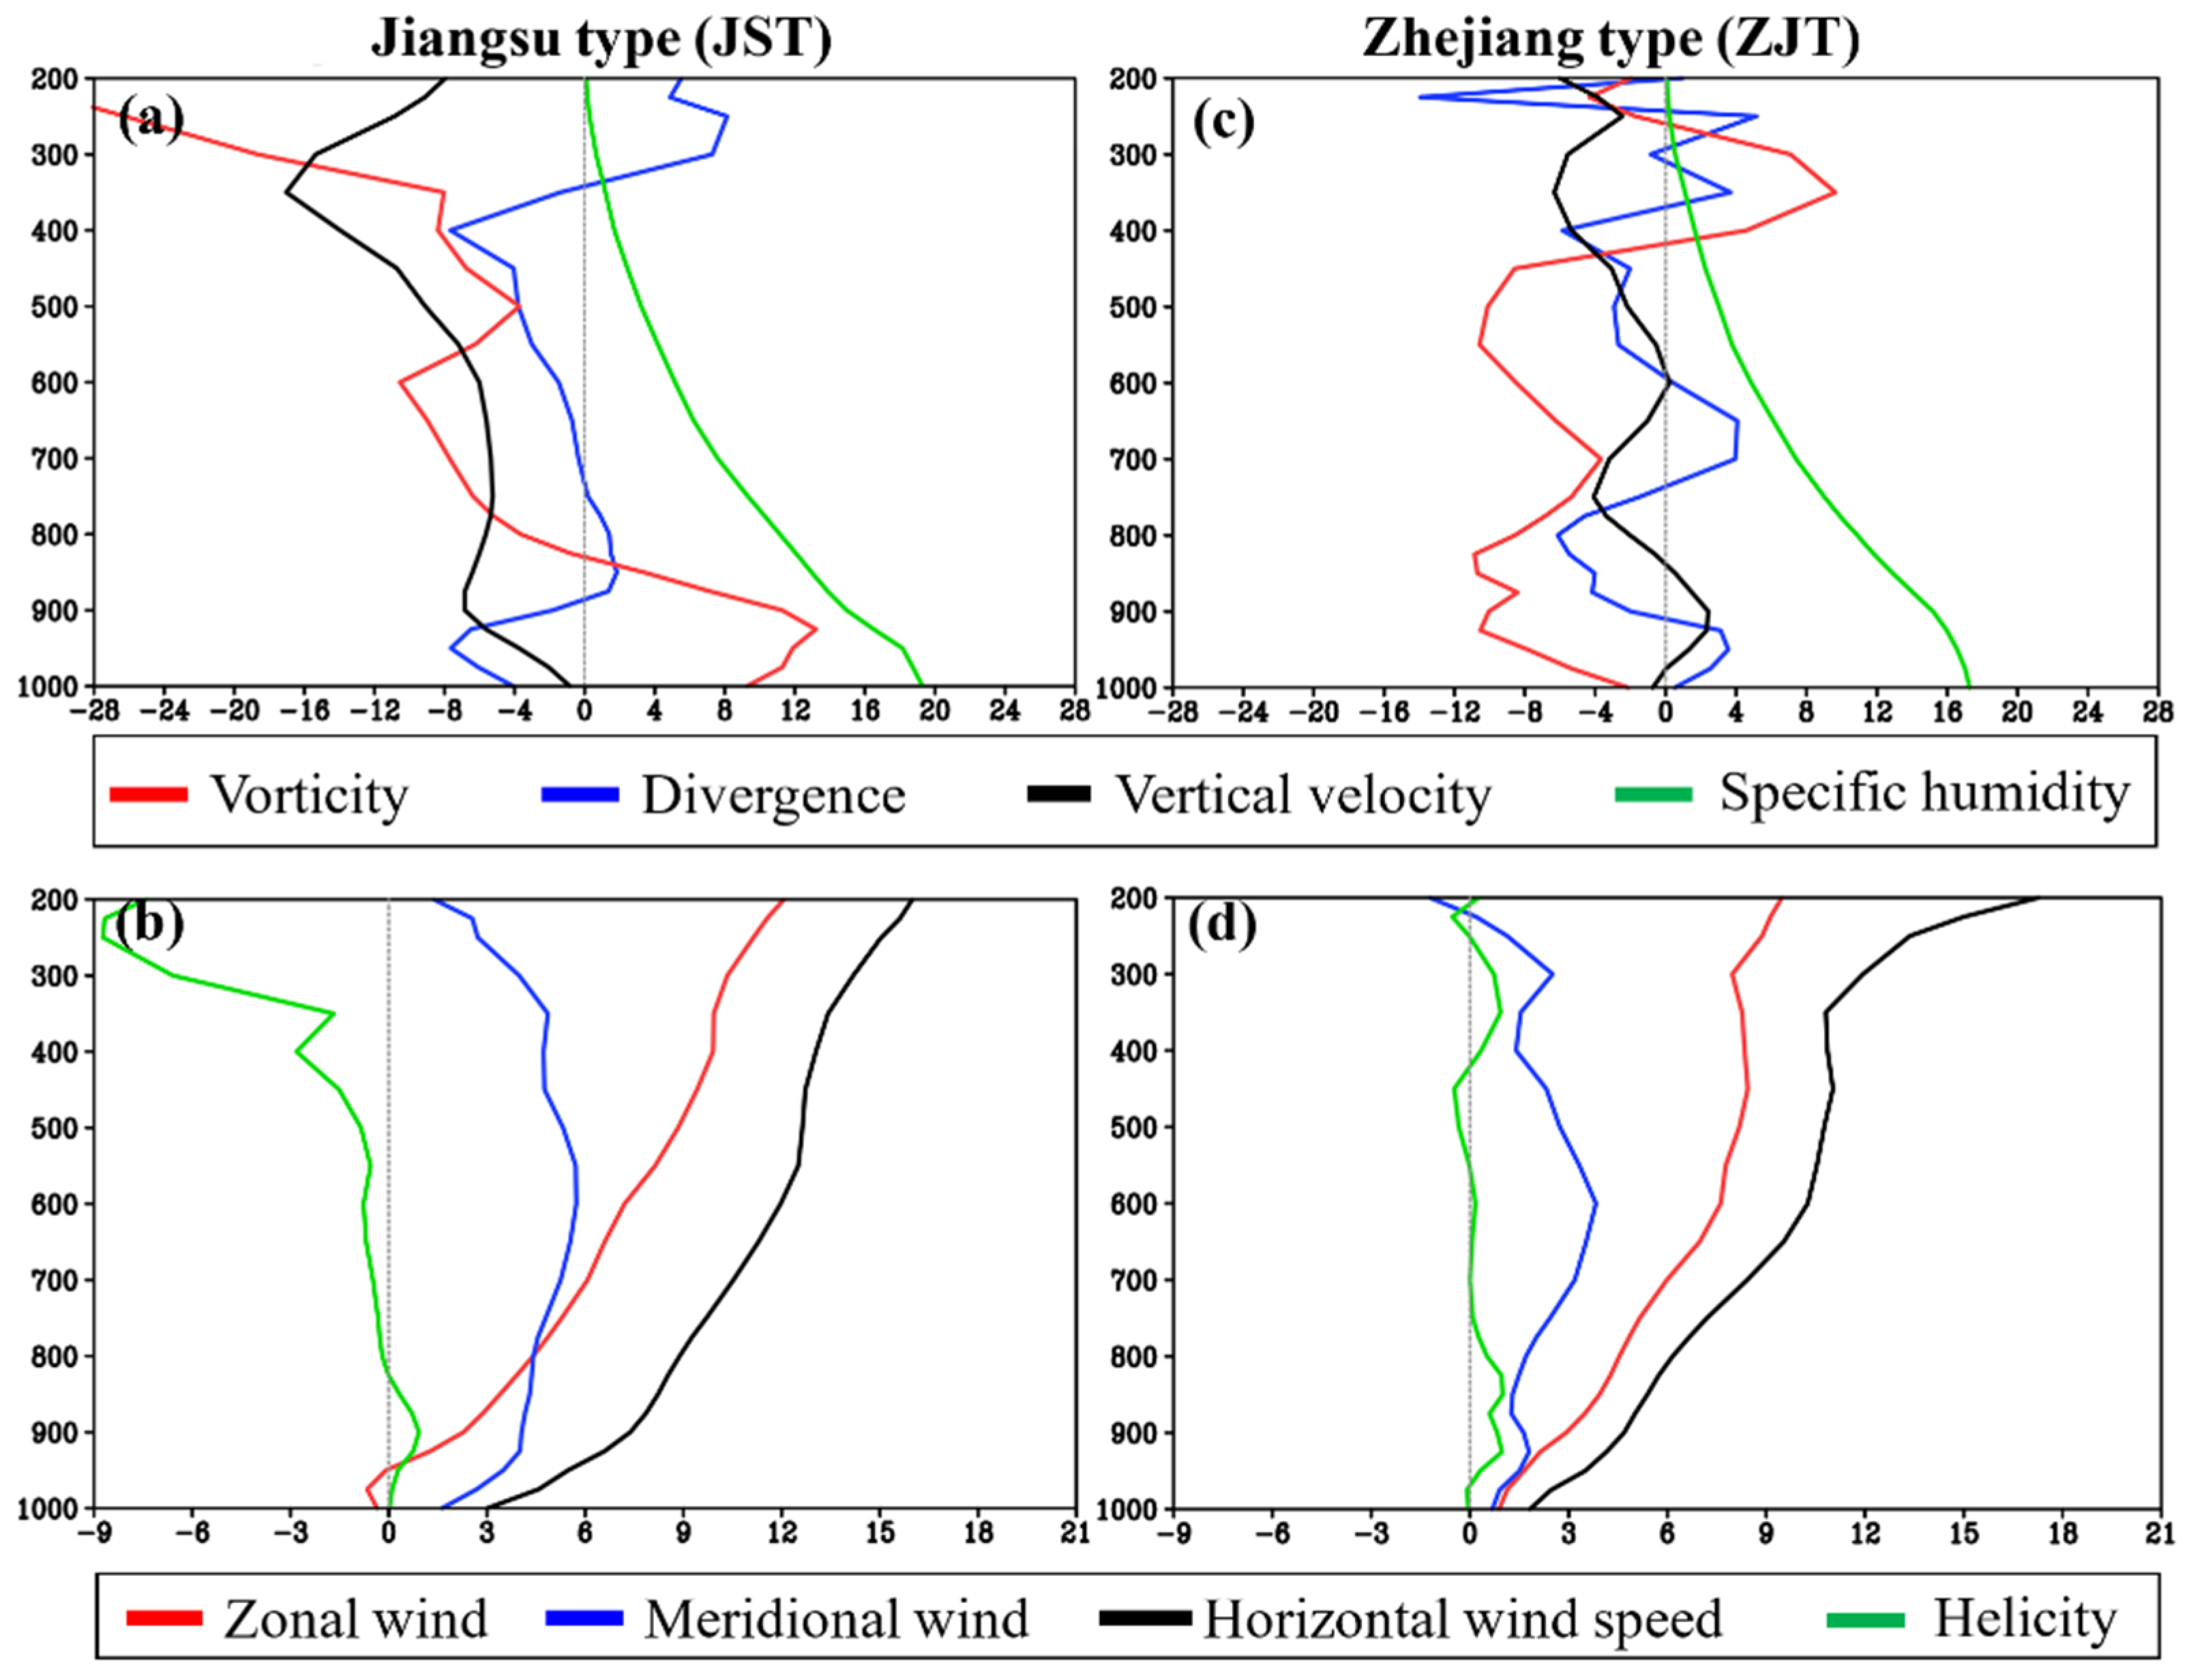
For the JST, as Figure 10a shows, strong convergence and ascending motions both appeared at the levels below 800 hPa (Figure 10a) and around 400 hPa. In contrast, strong cyclonic vorticity and large specific humidity only appeared in the levels below 800 hPa. The lower-level features mentioned above were all favorable conditions for the occurrence/development of the tornado-related convections. From Figure 10b, the updraft helicity was positive from 1000 hPa to 800 hPa, with the maximum value appeared around 900 hPa. A thin layer of easterly wind was located below 950 hPa, above which westerly wind enhanced rapidly with height. The maximum vertical wind shear of the zonal wind appeared in the layer from 1000 hPa to 900 hPa (~3 m s−1). In contrast, the vertical profile of the meridional wind showed a different feature: a southerly wind increased with height to 600 hPa, and then decreased with height. Its maximum vertical wind shear (~2.5 m s−1) was also located in the layer from 1000 hPa to 900 hPa. The total wind shear showed a similar vertical distribution to that of the zonal wind, and its maximum vertical shear was ~4.5 m s−1. As mentioned above, intense updraft helicity and strong vertical wind shear at lower levels were conducive to the occurrence/development of the tornado-related convections.
For the ZJT, it showed notably different features from those of the JST (cf., Figure 10a,c), which were characterized by a lower-level (800–1000 hPa) anticyclonic vorticity, convergence and descending motions. Although the specific humidity profiles showed similar distribution features for the JST and ZJT, the latter was drier at the lower-levels. As Figure 10d shows, only westerly wind appeared in the vertical profile, with its maximum vertical shear (~2 m s−1) mainly located in the layer from 1000 hPa to 900 hPa. For the meridional wind, the southerly wind first increased from 1000 hPa to 900 hPa (the vertical wind shear was ~1 m s−1); then, decreased from 900 hPa to 850 hPa; after that, it increased from 850 hPa to 600 hPa, where it reached the maximum value of ~4 m s−1, and then it decreased again. The total wind shear also showed a similar vertical distribution to that of the zonal wind, and its maximum vertical shear in the lower troposphere was ~3 m s−1 (appeared in the layer from 1000 hPa to 900 hPa). All the lower-level vertical shears were smaller than those of the JST. Another notable feature for the ZJT’s vertical profile shown in Figure 10d was that, a positive zone of the updraft helicity appeared at the lower levels (from 1000 hPa to 800 hPa), which were larger in range than that of the JST. Overall, the lower-level favorable features for the convective activities were the strong convergence (from 900 hPa to 750 hPa), large specific humidity, positive updraft helicity, and notable vertical shears.

5. Trend Analyses

As discussed in Section 4.2 and Section 4.3, the larger CAPE, lower SLP, warmer surface (indicated by the 2-m temperature), stronger vertical wind shear from 1000 hPa to 900 hPa (i.e., 0–1 km), and larger updraft helicity were conducive conditions for tornadoes within both Jiangsu and Zhejiang. Moreover, the surface moisture was also closely related to the tornadoes. Therefore, we calculated the linear correlations between the tornado frequency in summer (from 2007 to 2016) and the corresponding spatiotemporal mean factors (for each year, the temporal average was first conducted from June to August, and then the horizontal average was calculated within Jiangsu/Zhejiang) to determine the factors that account for the seasonal (i.e., summer) variation of the tornadoes. As Table 1 shows, for both JST and ZJT, the zonal-wind vertical shear (from 1000 hPa to 900 hPa) showed the closest relationships to the occurrence of tornadoes. For the JST, the linear correlation coefficient exceeded the 95% confidence level, whereas for the ZJT, the correlation was not significant. Another factor might affect the seasonal variation of the tornadoes in Jiangsu was the updraft helicity, and its correlation coefficient was 0.52, which exceeded the 90% confidence level. All the other remaining factors shown in Table 1 could not pass the significance test, implying that they might not be key factors that determined the seasonal variation of the tornadoes.
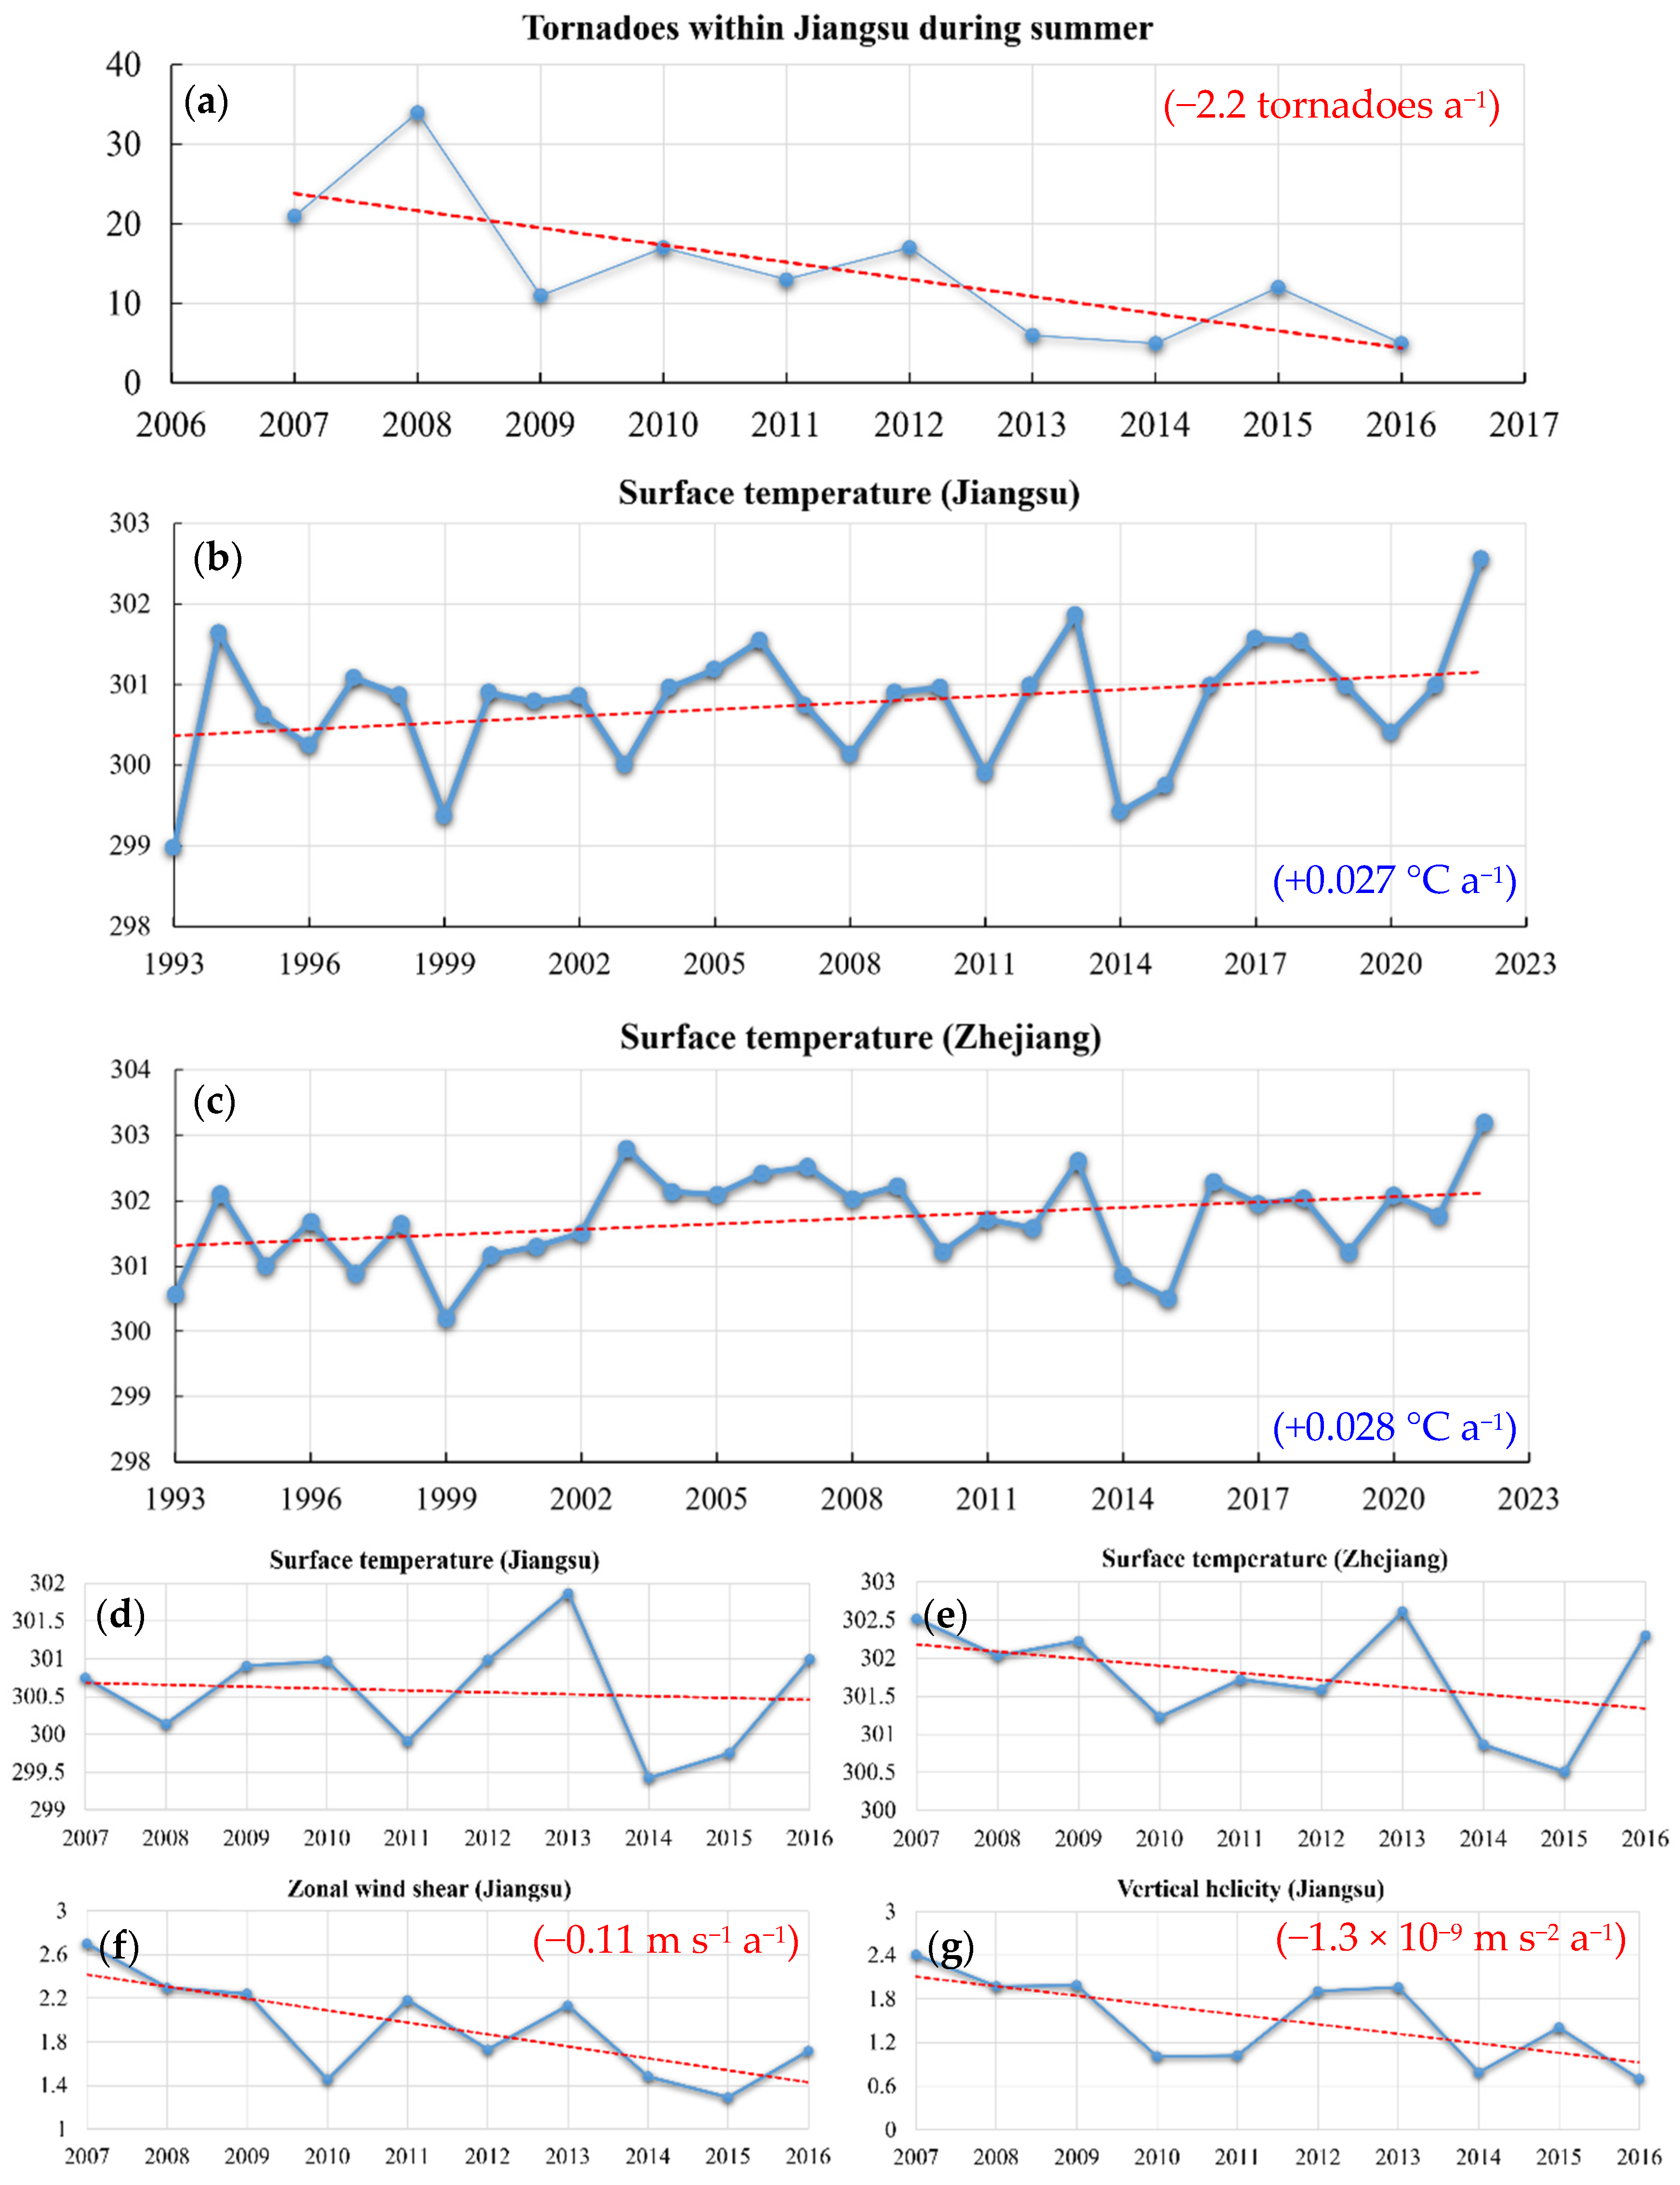
As discussed in Section 3, the annual occurrence frequency of the tornadoes in Jiangsu showed a significant decreasing trend. This decreasing trend was also significant for the tornadoes within Zhejiang during summer (Figure 11a), which exceeded the 99.9% confidence level. It can be found that, from 2007 to 2016, the tornadoes’ occurrence frequency within Jiangsu decreased by ~2.2 per year. This means tornadoes’ threat decreased during this period. Under global warming condition, from 1993 to 2022 (a 30-year period), Jiangsu and Zhejiang also showed an increasing trend in their surface temperature during the summer, both of which exceeded the 90% confidence level (Figure 11b,c). However, the increasing was not evenly distributed: from 2007 to 2016, both provinces showed a weak decreasing trend in temperature (could not exceed the 95% confidence level). However, no significant linear correlation could be found between the surface temperature and the tornadoes’ occurrence frequency (Table 1). This indicates that global warming might not directly affect the occurrence of tornadoes within Jiangsu and Zhejiang.
Since the vertical shear of zonal wind and the updraft helicity acted as key factors for the tornadoes’ occurrence within Jiangsu, we calculated their respective linear trends to check whether they showed consistent features with those of the tornadoes. As Figure 11f shows, the zonal wind shear featured a significant (exceed the 95% confidence level) decreasing trend of −0.11 m s−1 a−1 from 2007 to 2016. In addition, the updraft helicity also showed a significant (exceed the 95% confidence level) decreasing trend (−1.3 × 10⁻⁹ m s−2 a−1) during the 10-year period. The decreasing in intensity of these two factors mean that the conditions for the tornadoes’ occurrence became worse within Jiangsu, and therefore, the occurrence of tornadoes during summer tended to decrease from 2007 to 2016.

6. Conclusions and Discussion

Based on the 10-year statistical analysis of tornadoes from Zhou et al. [15], in this study, we mainly investigated the tornadoes in Jiangsu Province (ranked first in China) and Zhejiang (ranked fifth) Province to show the key features of their background environment and linear trends. Overall, in China, tornadoes showed a remarkable decreasing trend from east to west, and they tended to appear over the regions with relatively low altitude and flat surface. Tornadoes featured notable annual (on average, ~16 and ~6 tornadoes occurred per year for Jiangsu and Zhejiang, respectively), monthly and diurnal variations, which were remarkably different for Zhejiang and Jiangsu. For both provinces, tornadoes showed the largest occurrence frequency (~50% on average) in the afternoon of summer, and thus the background environments (~6.5 h) before the formation of these tornadoes (81 events in Jiangsu and 15 events in Zhejiang) were composited to focus on their respective universal features. The results indicate that, the conditions for the tornadoes’ formation were overall more favorable for the JST. It should be noted that, for the JST, 81 tornadoes within Jiangsu (~51% in proportion) were used in the composite, whereas, for the ZJT, only 15 events were used in the composite. In order to evaluate how well the composite results could represent the tornadoes’ universal features, we calculated the correlations (i.e., Pearson correlation) [1] between a composite variable (we tested three variables, including 500-hPa geopotential height, 700-hPa zonal and meridional wind) with the corresponding variable 6-h before the formation of each tornado. The correlation coefficients were calculated within the range of 26–36° N,113–125° E. It was found that, for both JST and ZJT, the mean values of the correlation coefficients were above 0.5 (not shown). Therefore, it can be concluded that, the composite results could be used as the representatives for the tornadoes’ background environments.
For the tornadoes within Jiangsu, it is found that, their background environment was notably favorable for convective activities: (i) In the high troposphere, a positive geopotential-height anomaly, a warm temperature anomaly and a strong divergence southeast of the shortwave trough over Central China were conducive to ascending motions. (ii) In the middle troposphere, the warm temperature anomaly and warm temperature advection ahead of a westerly shortwave trough over Central China acted as the favorable factors for promoting ascending motions and lowering the lower-level pressure. (iii) In the lower troposphere, a mesoscale vortex that maintained northwest of Jiangsu Province contributed to the convective activities within Jiangsu through its associated strong southwesterly wind, strong convergence and cyclonic vorticity. Moreover, the positive updraft helicity and strong vertical wind shear in the layer of 1000–800 hPa were also conducive to the convections. (iv) At surface, a closed surface low center maintained west of Jiangsu, its associated high CAPE, warm and moist tongue were all favorable factors for the convective activities within Jiangsu. For the tornadoes within Zhejiang, their background environment differed from that of the Jiangsu notably, and their similarities mainly lay in the high CAPE, low pressure, warm temperature at surface, as well as the positive updraft helicity and notable vertical wind shear at the lower levels.
Linear trend (from 2007 to 2016) analyses showed that, both the annual and seasonal (summer) occurrence of the tornadoes within Jiangsu tended to decrease significantly, whereas, those of Zhejiang were not significant. Decreasing trends that exceeded the 95% confidence level were also found in the vertical shear of the zonal wind and the updraft helicity, both of which acted as key factors for the tornadoes’ occurrence within Jiangsu. The decreasing in intensity of these two factors mean that the conditions for the tornadoes’ occurrence became worse within Jiangsu, and therefore, the occurrence of tornadoes during summer tended to decrease from 2007 to 2016. In contrast, although Jiangsu showed a notable warming trend during a 30-year period, from 2007 to 2016, there was no significant trend for its surface temperature. Moreover, the correlation between surface temperature and tornadoes’ frequency was not significant. These indicate that the global warming might not directly affect the occurrence of tornadoes within Jiangsu.
It should be noted that the results of this study might show nonnegligible limitations, as we only used a statistic during a 10-year period. Tornadoes are too small in horizontal scale, which made it really hard to collect the data. All the composite results were mainly focused on the background environment ~6.5 h before the tornadoes’ formation, rather than on the tornadoes themselves. In the future, after collecting enough data, we will conduct further studies during a longer period, which will be helpful to reach a more comprehensive understanding of the tornadoes in China.

Author Contributions

Conceptualization, B.L.; Methodology, D.L., B.L., W.J. and C.G.; Software, W.J. and X.Z.; Validation, X.Z., C.G. and Z.W.; Formal analysis, D.L., J.L. and B.L.; Investigation, D.L., B.L. and Z.W.; Resources, J.L., W.J. and X.Z.; Data curation, D.L. and C.B.; Writing – original draft, D.L.; Writing – review & editing, D.L. and J.L.; Visualization, D.L., C.G. and Z.W.; Supervision, J.L. and C.B.; Project administration, B.L.; Funding acquisition, J.L. All authors have read and agreed to the published version of the manuscript.

Funding

This work was supported by the Science and Technology Foundation of State Grid Corporation of China (grant No. 5200-202219096A-1-1-ZN).

Institutional Review Board Statement

Not applicable.

Informed Consent Statement

Not applicable.

Data Availability Statement

The ECMWF ERA5 reanalysis data can be download at https://www.ecmwf.int/en/forecasts/datasets/reanalysis-datasets/era5 (accessed on 5 April 2022); and the tornado data can be download at https://doi.org/10.18170/DVN/QKQHTG (accessed on 5 April 2022).

Acknowledgments

The author would like to thank Zhou Ruilin for providing the 10-yr tornadoes’ statistic, and to thank the ECMWF for providing the ERA5 reanalysis data (https://www.ecmwf.int/en/forecasts/datasets/reanalysis-datasets/era5 (accessed on 5 April 2022)). This work was supported by the Science and Technology Foundation of State Grid Corporation of China (grant No. 5200-202219096A-1-1-ZN).

Conflicts of Interest

The authors declare no conflict of interest.

References

  1. Markowski, P.; Richardson, Y. Mesoscale Meteorology in Midlatitudes; Wiley-Blackwell: Hoboken, NJ, USA, 2010; p. 407. [Google Scholar]
  2. Davies-Jones, R.; Trapp, R.J.; Bluestein, H.B. Tornadoes and tornadic storms. In Severe Convective Storms; Doswell, C.A., Ed.; American Meteorological Society: Boston, MA, USA, 2001; pp. 167–221. [Google Scholar] [CrossRef]
  3. Dawson, D.T.; Xue, M.; Shapiro, A.; Milbrandt, J.A.; Schenkman, A.D. Sensitivity of Real-Data Simulations of the 3 May 1999 Oklahoma City Tornadic Supercell and Associated Tornadoes to Multimoment Microphysics. Part II: Analysis of Buoyancy and Dynamic Pressure Forces in Simulated Tornado-Like Vortices. J. Atmos. Sci. 2016, 73, 1039–1061. [Google Scholar] [CrossRef]
  4. Edwards, R. Tropical Cyclone Tornadoes: A Review of Knowledge in Research and Prediction. Electron. J. Sev. Storms Meteorol. 2012, 7, 1–61. [Google Scholar] [CrossRef]
  5. Gallo, B.T.; Clark, A.J.; Dembek, S.R. Forecasting Tornadoes Using Convection-Permitting Ensembles. Weather Forecast. 2016, 31, 273–295. [Google Scholar] [CrossRef]
  6. Yu, X.D.; Zheng, Y.Y.; Liao, Y.F.; Yao, Y.Q.; Fang, C. Observational investigation of a tornadic heavy precipitation supercell storm. Chin. J. Atmos. Sci. 2008, 32, 508–522. [Google Scholar]
  7. Fan, W.J.; Yu, X.D. Characteristics of spatial temporal distribution of tornadoes in China. Meteor. Mon. 2015, 41, 793–805. [Google Scholar]
  8. Bai, L.; Meng, Z.; Sueki, K.; Chen, G.; Zhou, R. Climatology of tropical cyclone tornadoes in China from 2006 to 2018. Sci. China Earth Sci. 2019, 63, 37–51. [Google Scholar] [CrossRef]
  9. Li, C.L.; Tan, H.B.; Cai, K.L.; Bai, L.Q.; Huang, X.X.; Yan, L.J.; Zhi, J.L.; Zhang, J.J. Tornadoes in China and their disaster characteristics from 2016 to 2020. J. Trop. Meteorol. 2021, 37, 733–747. [Google Scholar]
  10. Zhou, R.; Meng, Z.; Bai, L. Differences in tornado activities and key tornadic environments between China and the United States. Int. J. Clim. 2021, 42, 367–384. [Google Scholar] [CrossRef]
  11. Wang, X.M.; Yu, X.D. A study on the physical process involved in the genesis of a severe tropical tornado. Acta Meteorol. Sin. 2019, 77, 387–404. [Google Scholar]
  12. Meng, Z.; Yao, D. Damage Survey, Radar, and Environment Analyses on the First-Ever Documented Tornado in Beijing during the Heavy Rainfall Event of 21 July 2012. Weather Forecast. 2014, 29, 702–724. [Google Scholar] [CrossRef]
  13. Bai, L.; Meng, Z.; Huang, L.; Yan, L.; Li, Z.; Mai, X.; Huang, Y.; Yao, D.; Wang, X. An Integrated Damage, Visual, and Radar Analysis of the 2015 Foshan, Guangdong, EF3 Tornado in China Produced by the Landfalling Typhoon Mujigae (2015). Bull. Am. Meteorol. Soc. 2017, 98, 2619–2640. [Google Scholar] [CrossRef]
  14. Xue, M.; Zhao, K.; Wang, M.; Li, Z.; Zheng, Y. Recent significant tornadoes in China. Adv. Atmos. Sci. 2016, 33, 1209–1217. [Google Scholar] [CrossRef]
  15. Zhou, R.L.; Meng, Z.Y.; Bai, L.Q. Chinese Tornado Dataset (2007~2016), Peking University Open Research Data Platform. 2020. Available online: https://opendata.pku.edu.cn/dataverse/pku;jsessionid=fa4ee10bc7095fe987980a4dd800?q=&fq0=fileAccess%3A%22Public%22&fq2=publicationDate%3A%222020%22&types=dataverses%3Afiles&sort=dateSort&order=desc (accessed on 5 April 2022).
  16. Fujita, T.T. Tornadoes and Downbursts in the Context of Generalized Planetary Scales. J. Atmos. Sci. 1981, 38, 1511–1534. [Google Scholar] [CrossRef]
  17. Hersbach, H.; Bell, B.; Berrisford, P.; Hirahara, S.; Horányi, A.; Munoz-Sabater, J.; Nicolas, J.; Peubey, C.; Radu, R.; Schepers, D.; et al. The ERA5 global reanalysis. Q. J. R. Meteorol. Soc. 2020, 146, 1999–2049. [Google Scholar] [CrossRef]
  18. Fu, S.-M.; Zhang, J.-P.; Sun, J.-H.; Zhao, T.-B. Composite Analysis of Long-Lived Mesoscale Vortices over the Middle Reaches of the Yangtze River Valley: Octant Features and Evolution Mechanisms. J. Clim. 2016, 29, 761–781. [Google Scholar] [CrossRef]
  19. Zhang, Y.-C.; Fu, S.-M.; Sun, J.-H.; Fu, R.; Jin, S.-L.; Ji, D.-S. A 14-year statistics-based semi-idealized modeling study on the formation of a type of heavy rain–producing southwest vortex. Atmos. Sci. Lett. 2019, 2019, e894. [Google Scholar] [CrossRef] [Green Version]
  20. Mai, Z.; Fu, S.; Sun, J.; Hu, L.; Wang, X. Key statistical characteristics of the mesoscale convective systems generated over the Tibetan Plateau and their relationship to precipitation and southwest vortices. Int. J. Clim. 2020, 36, 3148–3160. [Google Scholar] [CrossRef]
  21. Wang, H.; Sun, J.; Fu, S.; Zhang, Y. Typical Circulation Patterns and Associated Mechanisms for Persistent Heavy Rainfall Events over Yangtze-Huaihe River Valley during 1981–2020. Adv. Atmos. Sci. 2021, 38, 2167–2182. [Google Scholar] [CrossRef]
  22. Fu, S.; Mai, Z.; Sun, J.; Tang, H. On the physical significance and use of a set of horizontal and vertical helicity budget equations. Atmos. Ocean. Sci. Lett. 2019, 12, 417–423. [Google Scholar] [CrossRef] [Green Version]
  23. Fu, S.; Li, W.; Sun, J.; Zhang, J.; Zhang, Y. Universal evolution mechanisms and energy conversion characteristics of long-lived mesoscale vortices over the Sichuan Basin. Atmos. Sci. Lett. 2014, 16, 127–134. [Google Scholar] [CrossRef]
  24. Fu, S.-M.; Sun, J.-H.; Luo, Y.-L.; Zhang, Y.-C. Formation of Long-Lived Summertime Mesoscale Vortices over Central East China: Semi-Idealized Simulations Based on a 14-Year Vortex Statistic. J. Atmos. Sci. 2017, 74, 3955–3979. [Google Scholar]
  25. Feng, S.-L.; Jin, S.-L.; Fu, S.-M.; Sun, J.-H.; Zhang, Y.-C. Formation of a kind of heavy-precipitation-producing mesoscale vortex around the Sichuan Basin: An along-track vorticity budget analysis. Atmos. Sci. Lett. 2019, 2019, e949. [Google Scholar] [CrossRef] [Green Version]
  26. Fu, S.-M.; Mai, Z.; Sun, J.-H.; Li, W.-L.; Ding, Y.; Wang, Y.-Q. Impacts of convective activity over the Tibetan Plateau on plateau vortex, southwest vortex, and downstream precipitation. J. Atmos. Sci. 2019, 76, 3803–3830. [Google Scholar] [CrossRef]
  27. Fu, S.-M.; Zhang, J.-P.; Tang, H.; Jiang, L.-Z.; Sun, J.-H. A new mesoscale-vortex identification metric: Restricted vorticity and its application. Environ. Res. Lett. 2020, 15, 124053. [Google Scholar] [CrossRef]
  28. Fu, S.-M.; Tang, J.-H.; Sun, T.-B.; Zhao, W.-L.; Li, H. Historical rankings and vortices’ activities of the extreme Mei-yu seasons: Contrast 2020 to previous Mei-yu seasons. Geophys. Res. Lett. 2021, 49, e2021GL096590. [Google Scholar] [CrossRef]
  29. Fu, S.; Mai, Z.; Sun, J.; Li, W.; Zhong, Q.; Sun, J.; Zhang, Y. A semi-idealized modeling study on the long-lived eastward propagating mesoscale convective system over the Tibetan Plateau. Sci. China Earth Sci. 2021, 64, 1996–2014. [Google Scholar] [CrossRef]
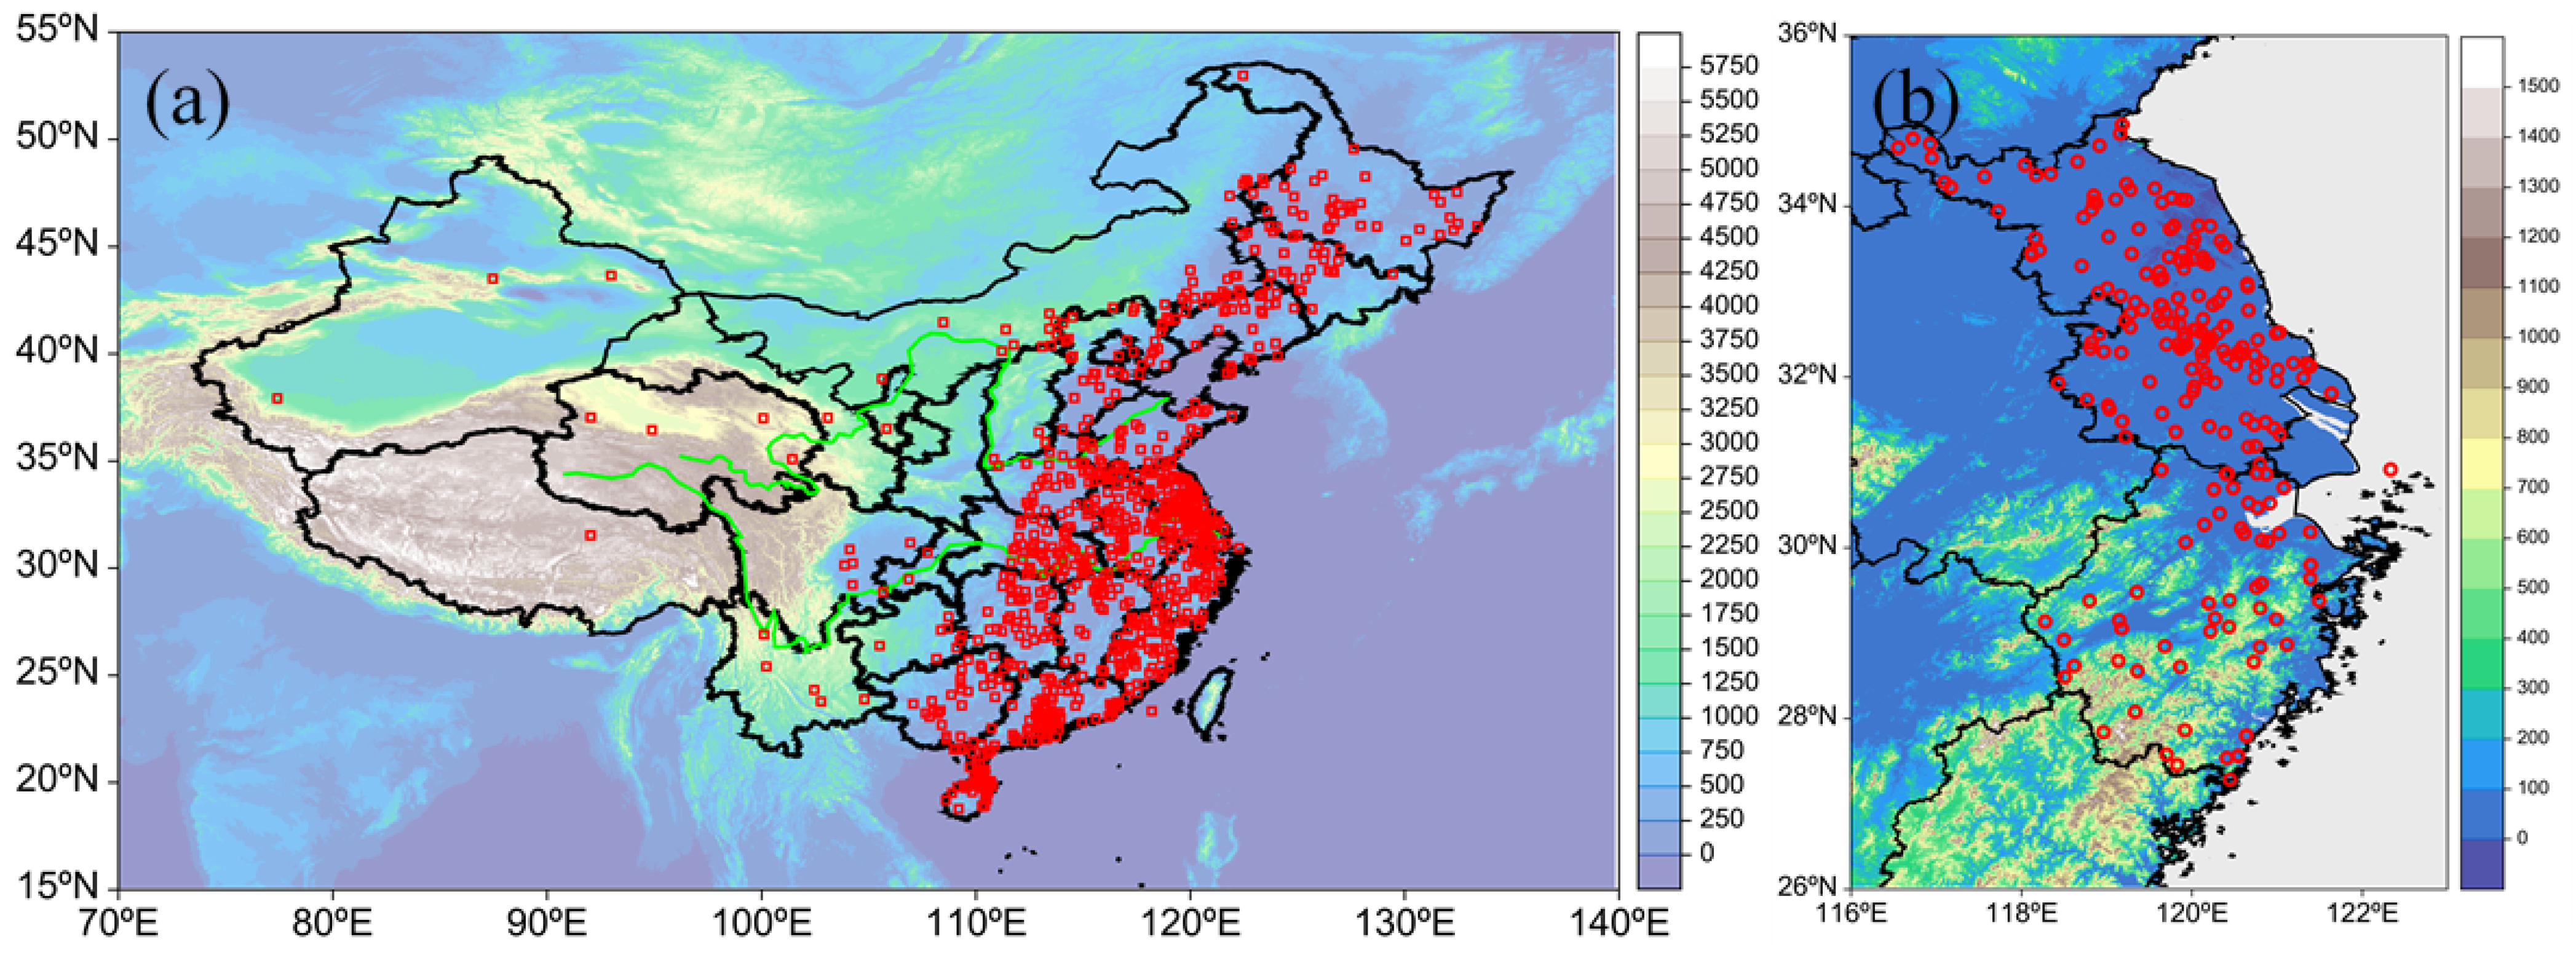
Figure 1. (a) shows the horizontal distribution of the tornadoes (small red boxes) in China from 2007 to 2016, where the shading is terrain (m). (b) shows the horizontal distribution of the tornadoes (small red boxes) in Jiangsu and Zhejiang from 2007 to 2016, where the shading is terrain (m).
Sustainability 14 16766 g001
Figure 2. (a,b) show the annual variation of the tornadoes from 2007 to 2016 within Provinces Jiangsu and Zhejiang, respectively, where the red dashed lines represent their corresponding linear trends. (c) illustrates the monthly variation of the tornadoes within Jiangsu and Zhejiang during the period of 2007–2016.
Sustainability 14 16766 g002
Figure 3. (a) shows the diurnal variation of the percentage of the occurrence numbers of the tornadoes in Jiangsu Province (%), with those higher than 5% shown in red numbers. (b) is the same as (a) but for Zhejiang Province. The red rectangles outline the focused period for this study, with the large percentage representing the accumulated proportion of the focused period.
Sustainability 14 16766 g003
Figure 4. (a) shows the composite 200-hPa geopotential height (black contour; gpm) and its anomaly (shading; gpm) for the JST. (d) is the same as (a) but for the ZJT. (b) shows the composite 200-hPa temperature (black contour; °C) and its anomaly (shading; °C) for the JST. (e) is the same as (b) but for the ZJT. Panel (c) shows the composite 200-hPa wind (a full bar represents 10 m s−1) and divergence (shading; 10−6 s−1). (f) is the same as (c) but for the ZJT. Jiangsu and Zhejiang are highlighted in green map, the two small black boxes mark the mean locations of all tornadoes in Jiangsu and Zhejiang, respectively, and the thick dashed blackish green lines are the trough lines.
Sustainability 14 16766 g004
Figure 5. (a) shows the composite 500-hPa geopotential height (black contour; gpm) and its anomaly (shading; gpm) for the JST. Panel (d) is the same as (a) but for the ZJT. (b) shows the composite 500-hPa temperature (black contour; °C) and its anomaly (shading; °C) for the JST. Panel (e) is the same as (b) but for the ZJT. (c) shows the composite 500-hPa wind (a full bar represents 10 m s−1) and vorticity (shading; 10−6 s−1). (f) is the same as (c) but for the ZJT. Jiangsu and Zhejiang are highlighted in green map, the two small green boxes mark the mean locations of all tornadoes in Jiangsu and Zhejiang, and the thick dashed blackish green lines are the trough lines.
Sustainability 14 16766 g005
Figure 6. (a) shows the composite 700-hPa geopotential height (black contour; gpm) and its anomaly (shading; gpm) for the JST. (d) is the same as (a) but for the ZJT. (b) shows the composite 700-hPa wind field (a full bar represents 4 m s−1) and the wind speed anomaly (shading; m s−1) for the JST. (e) is the same as (b) but for the ZJT. (c) shows the composite 700-hPa divergence (shading; 10−6 s−1) and vorticity (black contour; 10−6 s−1). Panel (f) is the same as (c) but for the ZJT. Jiangsu and Zhejiang are highlighted in green map, the two small green boxes mark the mean locations of all tornadoes in Jiangsu and Zhejiang, and the thick dashed blackish green lines are the trough lines.
Sustainability 14 16766 g006
Figure 7. (a) shows the composite 900-hPa wind field (a full bar represents 4 m s−1) and the wind speed anomaly (shading; m s−1) for the JST. (d) is the same as (a) but for the ZJT. Panel (b) shows the composite 900-hPa divergence (shading; 10−6 s−1) and vorticity (black contour; 10−6 s−1). (e) is the same as (b) but for the ZJT. Jiangsu and Zhejiang are highlighted in green map, the two small green boxes mark the mean locations of all tornadoes in Jiangsu and Zhejiang, the thick dashed purple ellipse marks the main body of a mesoscale vortex and the thick dashed purple line is the shear line. (c) shows the composite vertical integral (from surface to 2 km) of the updraft helicity (shading; 10−4 m2 s−2) for the JST. (f) is the same as (c) but for the ZJT. The small black boxes mark the mean locations of all tornadoes in Jiangsu and Zhejiang, and the big grey vector shows the direction of the lower-level (from surface to 2 km) steering flow.
Sustainability 14 16766 g007
Figure 8. (a) shows the composite surface convective available potential energy (black contour; J kg−1) and its anomaly (shading; J kg−1) for the JST. (c) is the same as (a) but for the ZJT. (b) shows the composite sea level pressure (black contour; hPa) and its anomaly (shading; hPa) for the JST. (d) is the same as (b) but for the ZJT. Jiangsu and Zhejiang are highlighted in green map, “L” means low-pressure center, and the two small green boxes mark the mean locations of all tornadoes in Jiangsu and Zhejiang.
Sustainability 14 16766 g008
Figure 9. (a) shows the composite 2-m temperature (black contour; °C) and its anomaly (shading; °C) for the JST. (c) is the same as (a) but for the ZJT. (b) shows the composite difference of 2-m temperature and dew point (black contour; hPa) and its anomaly (shading; hPa) for the JST. (d) is the same as (b) but for the ZJT. Jiangsu and Zhejiang are highlighted in green map, and the two small green boxes mark the mean locations of all tornadoes in Jiangsu and Zhejiang.
Sustainability 14 16766 g009
Figure 10. (a) shows the area (1° × 1° centered at the composite center of the tornadoes within Jiangsu) averaged composite profile of the vorticity (red; 10−6 s−1), divergence (blue; 10−6 s−1), vertical velocity (black; 10−2 Pa s−1), and specific humidity (green; g kg−1). (c) is the same as (a) but for Zhejiang. (b) shows the area (1° × 1° centered at the composite center of the tornadoes within Jiangsu) averaged composite profile of the zonal wind (red; m s−1), meridional wind (blue; m s−1), horizontal wind speed (black; m s−1) and updraft helicity (green; 10−7 m s−2). (d) is the same as (b) but for Zhejiang.
Sustainability 14 16766 g010
Figure 11. (a) illustrates the seasonal number (summer) of tornadoes in Jiangsu, where the red dashed line is the linear trend (the trend exceeding the confidence level of 95% is shown by a red value). (b) shows the horizonal average (within Jiangsu) of the summer mean temperature (from June to August; K) during a 30-yr period, where the red dashed line is the linear trend (the trend exceeding the confidence level of 90% is shown by a blue value). (c) is the same as (b) but for Zhejiang. (d,e) are the same as (b,c) but for a 10-yr period (the focused period in this study). (f) is the horizonal average (within Jiangsu) of the summer mean zonal wind shear (from June to August; m s−1) during a 10-yr period (the focused period in this study), where the red dashed line is the linear trend (the trend exceeding the confidence level of 95% is shown by a red value). (g) is the same as (f) but for the updraft helicity (10−8 m s−2).
Sustainability 14 16766 g011
Table 1. Correlations between the tornado number in Jiangsu/Zhejiang (from June to August) and averaged variables (for each year, the temporal average was first conducted from June to August, and then the horizontal average was calculated within Jiangsu/Zhejiang). Those exceed the 90% confidence level are highlighted in italic, and those exceed the 95% confidence level are highlighted in bold. CAPE = convective available potential energy, HEL = helicity (vertical component), ZWS = zonal-wind vertical shear (from 1000 hPa to 900 hPa), MWS = meridional-wind vertical shear (from 1000 hPa to 900 hPa), SLP = sea level pressure, SUT = surface temperature (indicated by the 2-m temperature) and DTD = difference of 2-m temperature and dew point.
CAPEHELZWSMWSSLPSUTDTD
Jiangsu0.250.520.740.480.12−0.130.29
Zhejiang0.260.180.340.150.240.220.23
Publisher’s Note: MDPI stays neutral with regard to jurisdictional claims in published maps and institutional affiliations.