Abstract
The purpose of this paper is to investigate the relationship between network structure attributes, sensing capability and growth performance of logistics service integrators for logistics service supply chain. Using survey research of logistics service integrators from China, through empirical analysis, this paper finds the following conclusions. Network structure attributes can affect logistics service integrators growth performance directly or indirectly through sensing capability: ① network size and centricity affect the growth performance by promoting sensing capability; ② heterogeneity can directly affect LSI growth performance; and ③ heterogeneity can affect growth performance indirectly. The network scope does not affect sensing capability and growth performance of logistics service integrators.
1. Introduction
Economic globalization is facing countercurrents, as centennial changes of the world, the COVID-19 pandemic and the Ukraine crisis are intertwined. It makes the environment become more resource-constrained, volatile, uncertain, and complex. That puts forward higher requirements for the logistics service ability of logistics enterprises. In the highly competitive and rapidly changing market, in order to meet the opportunities and challenges, networking has become the development trend of modern logistics. It is too hard to meet the market demand for a single logistics enterprise, which develops logistics service supply chain (LSSC for short). LSSC has received more and more attention [1,2,3,4,5]. LSSC is a kind of new mode based on the alliance of logistics services, with “functional logistics service subcontractor→functional logistics service provider→logistics services integrator→customer” as the basic structure. The logistics services integrator (LSI for short) is a core member, which can obtain various logistics facilities, logistics technology, capital, information, knowledge and other tangible resources and intangible resources through LSSC.
Sustainability has an obvious competitive advantage in LSSC, which can make LSSC adapt to and guide the market demand for a long time [6,7]. The purpose of LSI in forming a LSSC is to obtain scarce and complementary resources from the network and to improve the ability to adapt to environmental changes. These can guarantee their sustainable development in the long run in the global economy. Network structure attributes are variables that describe the topology of the social network [4,8] and reflect the overall network characteristics. They are used to reflect the essence of the network connection of LSSC. Social network theory holds that the network structure attributes, such as network size, network scope, network centrality and heterogeneity, among enterprises have a very important impact on the acquisition and utilization of enterprise resources, which in turn affects the growth of enterprises. Sensing capability is the ability to adapt to environmental changes. The existing research results show that the sensing capability can be influenced by enterprise network and can affect the growth performance of enterprises at the same time [9]. However, whether in practice or in theory, it is still inadequate for the study of the effect mechanism of the network structure on the growth of LSI. What is the role of sensing capability in the relationship between network structure and LSI growth performance? These questions have also led to a lack of clarity on how to leverage LSSC for LSI growth performance in a volatile market environment. This paper focuses on two key questions:
- (1)
- What network structure attributes of LSSC affect LSI growth performance?
- (2)
- What is the mechanism of LSSC network structure attributes improving LSI growth performance, that is, how does the LSSC network affect LSI growth performance?
In order to solve the above problems, this paper focuses on the research of the effect mechanism of the network structure on the growth of LSI. Introducing sensing capability as an intermediary variable, this paper presents a ‘network structure–sensing capability–logistics service integrators growth’ model for LSSC, and empirically confirms the effect mechanism of network structure attributes on the growth of LSI based on data from Chinese logistics services integrators.
Firstly, this paper defines the concept and refines the dimensions of network structure attributes of LSSC. Network structure attributes are measured by network size, network scope, network centrality, and heterogeneity. Then, we develop a theoretical model of relationship between network structure attributes of LSSC, sensing capability and growth performance of LSI. Finally, through a survey of 319 companies in China, using the statistical software of SPSS20.0 and AMOS19.0, based on the exploratory factor analysis and confirmatory factor analysis, structural equation modeling is used to verify and modify the proposed theoretical model. It eventually forms the effect mechanism of LSSC network structure attributes on the LSI growth performance.
The results show that the LSSC network structure can affect the LSI growth performance directly or indirectly through sensing capability. Among them, the structure attributes affect the LSI growth performance in three aspects: ① network size and centricity affect the LSI growth performance by promoting sensing capability; ② heterogeneity can directly affect LSI growth performance; and ③ network scope does not affect the sensing capability and LSI growth performance.
The study is divided into five parts: the literature on LSSC, network structure attributes, sensing capability and their relationship is reviewed in Section 2. Section 3 gives the research hypotheses. The fourth part is the verification of the hypothesis model. The last part gives the research conclusion.
2. Theoretical Development
2.1. LSSC
LSSC is a self-centered inter-enterprise network connected by the competition and cooperation business relationship between its members in the market. It is a new type of logistics service based on alliance developed in practice [2,10]. It guarantees the logistics operation of the product supply chain by providing flexible logistics services [2,11]. The main content on LSSC is cooperation with capability, which is a scarce resource for logistics enterprises [12]. The essence of LSSC is integrated management, which not only provides functional logistics services, but also management services [13]. On LSSC, there is not only physical flow, but also information flow, capital flow and so on. LSSC is based on the specialization and cooperation of logistics, which crosses the organizational boundary and realizes the seamless connection, emphasizing the partnership management and resource integration between logistics cooperation enterprises [6,14].
LSI may be a logistics enterprise with professional capital or elements, the designer of the logistics scheme in the system (such as the fourth party logistics enterprise as the integrator, integrator and manager of LSSC), or the information supporter in the system [14]. LSIs have their own advanced logistics information system and strong logistics management capabilities; they provide the required integrated logistics services for one or several customers by integrating the resources of functional logistics enterprises [15]. LSIs may have little or no material assets, but are familiar with customer’s needs. They have the ability to design, execute and operate logistics on LSSC by using the assets of the other logistics service providers [16]. They sign a service contract with the customer, provide them with a unified service interface, and help them customize and complete multiple or even all logistics service functions. LSI coordinates the operation of logistics services globally by planning, integrating and managing resources, technologies and capabilities on LSSC.
2.2. Network Structure Attributes
Attribute is a general term for the relationship between the nature of an object and the object. Network attributes focus on the topology of social networks, reflecting the overall characteristics of relational networks. They focus on the characteristics of connections that are common in enterprises, such as connection or no connection (whether access to network resources exists), network connection and network structure characteristics or form; describe the structure type and characteristics of the connection, the degree of strength of the connection, the degree of connection, etc.; and are concerned about the existence of an enterprise network connection and the number of connections (Jenssen, J.I., 2001 [4]).
Social network theory is usually analyzed from two dimensions: relational attributes and structural attributes (Hansen, E.L., 1995 [3]). Relational attributes are used to illustrate social adhesion, the specific behavior and process among members. They are subdivided into relation density, relation intensity, relation symmetry, relation scale, etc. Structural attributes discuss the location structure among members in the social network, and the formation and evolution mode of this structure. They are usually measured by network size, network scope, centrality, heterogeneity, etc. This paper focuses on the impact of network structure attributes on logistics service integrators.
There is no systematic and unified measurement model for structural attributes. Based on the idea of system science and the previous research results (Varadarajan, 2020 [17]; Zaheer, 2005 [18]; Cristobal, 2013 [19]; Burt, 1992 [20]; Hansen, E.L., 1995 [3]; Gulati, 1998 [21]), combined with the characteristics of LSSC, this paper determines the measurement dimensions of the structural attributes according to the following principles: firstly, these network attributes should have a sufficient basis for relevant literature analysis, and mature indicators are used; second, the enterprise characteristics of LSI and the network characteristics of LSSC should be fully considered; third, the selected attribute variables should fully reflect the connection status of the LSSC network; fourth, these attributes should affect the growth of LSI from different aspects; and fifth, the selected indicators must be suitable for the measurement of self-centered networks. According to the above principles and combining the literature analysis, and interviews, the network size, network scope, centrality, and heterogeneity are selected to measure the structure in this paper.
Network structure affects enterprise growth by affecting the acquisition of enterprise resources. It is the channel that affects resource flow. Network size is one of the important dimensions of the network to measure the size of the network (Gulati, 1998 [21]). There are two important forms of connection in the network: direct connection and indirect connection. This paper considers that the network size of LSSC is the number of members who are either directly or indirectly linked to the LSI on LSSC. In general, the size of the network determines the abundance of resources available to enterprises; the larger the size, the more abundant resources that the network can provide for the growth of the enterprise, the more complex the structure, and the greater the impact on the growth of the enterprise.
Network scope shows how many kinds of connections exist between the nodes, indicating the diversity of network relationships (Higgins and Kram, 2001 [22]). It represents the possibility of the target resources that the core enterprise can mobilize and integrate (Zaheer, 2005 [18]; Cristobal, 2013 [19]). Because the network is the channel to obtain information, knowledge and other important resources, the network scope means the flexibility and diversity of LSI to obtain resources. Unlike the focus of network scale, it is possible to have multiple collaboration approaches, even for the same partner, so the network scope places more emphasis on the diversity of means or ways that core enterprises can access resources. The network scope of LSSC in this paper is the number of types of cooperative relationships between LSI and other members. The relationships include outsourcing logistics service orders, common perfect, expansion of logistics network, resource allocation (joint operation), cooperation technology, product research and development, and so on.
The location of an enterprise in the network is expressed by the network centrality. Network centrality means that the enterprise occupies an important strategic position in the network in which the various important connections are involved, indicating that the enterprise that occupies the central position has more direct relations than other enterprises (Wellman, 1983 [23]; Zaheer, 2005 [18]; Lin, 2005 [24]). Network centrality describes the distribution of connections in the network, reflecting the rights and status of individuals or organizations in social networks. Wellman (1983) [23] believed that because of the different locations of the structure, there are differences in the availability of network resources by network members. A central location means that enterprises can have more network relationships and resources, obtain more information, and have a better social reputation, power and more benefits. Indeed, unequal access to scarce resources may increase the asymmetry of relationships. The structural location itself is a scarce resource because it determines access to other resources. Therefore, enterprises always find ways to constantly improve their network status to enhance their ability to influence or control network resources (Johanson and Mattsson, 1992 [25]). However, the centrality can also bring about restrictions on the enterprise behavior and the overlap of the information obtained. LSI is in the center of LSSC, occupying the advantages of information, resources, technology and other aspects. Other members have a high dependence on LSI to seek development in the fierce competition. Therefore, LSIs are regarded as expected potential collaborators by other members. They can establish more connections in LSSC, gain control over the flow of resources in LSSC, and obtain information and support faster. In this way, LSSC is built with LSI as the core, based on synergy or complementary advantages, to achieve the normal operation and stability of LSSC through building trust and commitment relationship in the long-term cooperation.
Network heterogeneity is an indicator to measure the differences in some characteristics of all members in the network. It reflects the degree of differences in corporate culture, enterprise scale, knowledge and talents, resources and skills among network members, and reflects the degree of diversification of the network (Gulati, 1998 [21]; Makoto, 2008 [26]). Different from network size and network scope, network heterogeneity focuses on describing the degree of difference in the types of partners or types of cooperative resources. For example, for networks with the same size and scope, the more types of resources owned by members, the greater the difference in enterprise size, the more types of business, and the greater the heterogeneity of the network.
Logistics service itself is heterogeneous; it cannot be as strict as the product production process and material standards, and its quality evaluation is given by the customer’s subjective judgment. At the same time, the operation content of logistics industry is very complicated, the technical and economic characteristics are different, and the heterogeneity among enterprises is strong. LSI cooperates with the others to complete the tasks that are difficult for a single enterprise to complete. Therefore, in terms of specific business segmentation, LSSC is also a highly heterogeneous network. Considering that heterogeneity is an important research indicator in network structure attributes, heterogeneity is also chosen as one of the indicators in this paper.
2.3. Sensing Capability
Sensing capability is the ability of enterprises to identify market opportunities and threats and their impact on existing strategic/tactical strategies, reflecting the sensitivity of enterprises to environmental changes (Palmatier, 2007 [27]; Grant, 1991 [28]; Teece, 2007 [29]). It is the result of the enterprise’s processing of relevant environmental information, including the collection, absorption and analysis of information knowledge. For example, enterprises can perceive the change trend of the market demand and the change of the market environment and policy environment through the change of product sales. Different sensing capabilities lead to different accuracies in grasping the change. Obviously, accurate identification is conducive for enterprises to capture market opportunities and adjust production and management strategies in a timely manner. In order to make strategic decisions, an enterprise must focus on the development direction of the future enterprise, and the choice of development direction depends on the accurate grasp of the market environment and the future market development trend (Iansiti, 1994 [30]). At this time, sensing capability is particularly important, which has an important impact on the survival and development of the enterprise.
Logistics resources are always limited. For LSI, sensing changes in the environment in advance can provide enterprises with the time to schedule logistics resources and change business strategies. For example, during the peak season of express delivery business, there is often a situation of ‘explosion and paralysis ‘. How to achieve normalization, standardization and institutionalization in peak season has become the challenge of express logistics. Based on the existing experience, relevant departments scientifically predict logistics demand, prepare in advance, attach importance to the docking mechanism between express logistics and e-commerce, and coordinate various logistics resources so that there is basically no warehouse explosion. Visible, in the case of limited resources, sensing capability is particularly important.
2.4. Network Structure Attributes, Sensing capability and Enterprise Growth
An important aspect of social network theory research is to examine how network affects enterprise behavior and performance (Ju, 2019 [6]; Ma, 2020 [14]; Teece, 2007 [29]; Johnston, 2004 [31]; Zahra, 2006 [32]). Through embedding into a certain network, enterprises can obtain all kinds of resources and capabilities needed for survival and development, and their competitive advantages or performance are generally recognized by the influence of the network in which they live (Varadarajan, 2020 [17]; Zaheer and Bell, 2005 [18]; Cristobal et al., 2013 [19]).
Most scholars agreed on and confirmed the positive effect of enterprise network attributes on enterprise growth in previous studies (Chen and Yang, 2022 [1]; Subramaniam and Youndt, 2005 [33]). They believe that the network structure has different effects on the growth of enterprises through different network structure attributes in the following three aspects: first, to provide information and external resources; second, to share risks and reduce the losses caused by uncertainty; and third, to facilitate the flow of knowledge, and then to promote the learning and innovation of enterprises (Burt, 1992 [20]; Gulati, 1998 [21]). Makoto, U. and Susumu, S. (2008) [26] found that the network structure has a great influence on the network effect of communication service market through simulation. Su-Yu Liu et al. (2013) [34] thought that the network clustering structure affects logistics performance through model analysis.
Enterprises should have a high degree of environmental insight to discover and identify market opportunities, timely change or transfer strategy, in order to obtain a sustainable competitive advantage to adapt to the development of the dynamic environment. Sensing capability is important for the growth performance of enterprises (Herbert, 2020 [35]; Joel M, Hannele H, 2022 [36]). Alshanty and Emeagwali (2019, [37]) found a positive effect of sensing capability on knowledge creation, and firm innovation in small- and medium-sized enterprises.
It is generally believed that structural attributes influence corporate behavior or performance through a certain intermediary. This intermediary may be dynamic capabilities, network capabilities, resource or others. This paper investigates the mediation role of sensing capability. It is not clear how structure attributes of LSSC affect LSI growth. This paper is about studying this problem.
3. Research Hypotheses
3.1. Network Structural Attributes and LSI Growth
Network size represents the number of nodes in the network, representing the maximum possible number of partners in the focus enterprise. Hansen’s (1995) [3] empirical results show that the network size has a positive impact on enterprise performance in the first year of growth. Beekman and Robinson (2004) [38] used the data of 91 drug-related enterprises to perform empirical research, and found that maintaining or expanding the relationship with suppliers is beneficial to the growth of enterprises. Nybakk E. et al. (2013) [39] studied the social network of wood entrepreneurs in Norway. Through the data obtained from 645 questionnaires collected, it was found that the network scale positively affects enterprise performance through the innovation ability of wood entrepreneurs. For LSI, the network size represents how many resources it might obtain from partners. As an enterprise with an outsourcing mode as the main logistics capacity supplement, the logistics flexibility of LSI depends on the amount of resources that LSI can obtain from LSSC in addition to relying on its own resources.
Summarizing the previous research results, we propose research Hypothesis 1a.
H1a:
The larger the LSSC network size, the more it can promote LSI growth.
Because different types of relationship involve different resources and exchanged information content, the number of relationship types represents the scope of resource heterogeneity on the LSSC. The larger the network scope, the richer the heterogeneous network relationship, the more resources and information that LSI contains in LSSC, and the more likely the provision of various resources and information support for the growth of LSI.
The wide variety of external network relationships can bring LSI a lot of knowledge, resources and expertise. Network scope, on the other hand, enhances the LSI ability to acquire and absorb knowledge. This study found that enterprises with a wide range of networks often practice knowledge transfer and knowledge acquisition with different partners and thus have more opportunities to learn from experience and improve their ability to acquire knowledge.
Summarizing the previous views, we present research Hypothesis 1b.
H1b:
The larger the LSSC network is, the more it can promote LSI growth.
It is generally believed that the higher the centrality, the more favorable it is for enterprises to obtain resources from the network, and the more it can promote the growth of enterprises. The central position of the LSI in the LSSC network enables it to obtain more information and resources, have more opportunities, higher visibility and attraction within the network. A central position can help LSI to control the whole logistics process and the link of each link, to coordinate the relationship between other members, to obtain the core resources of the logistics service providers and subcontractors so LSI can use the ability and resources to achieve growth.
Summarizing the previous views, we present research Hypothesis 1c.
H1c:
The closer LSI is to the center position of LSSC, and the higher the center of the LSSC network, the more likely it is to achieve growth.
In general, the greater the network heterogeneity, the more resources the network contains. Therefore, network heterogeneity can bring more explicit and implicit opportunities and resources to members on the enterprise network (Lin, 2005 [24]). The resource-based view holds that enterprises obtain external resources through network, which is the sum of the relationships connected by member enterprises based on heterogeneous resources. The more heterogeneous the network, the more it promotes the growth of enterprises (Johanson, 1992 [25]). LSSC is a network built based on the complementary advantages of resources. Heterogeneity can give LSI the opportunity to obtain more resources. LSI properly allocates the resources of the network members as needed. Network heterogeneity provides the possibility for LSI to absorb heterogeneous resources and services on LSSC.
Summarizing the previous views, we present research Hypothesis 1d.
H1d:
The stronger the heterogeneity of LSSC, the more likely its core enterprise LSI is to achieve rapid growth.
3.2. Relationship between Network Structural Attributes and Sensing Capability
Network structural attributes have an important impact on sensing capability. Baum (1998) [40] pointed out that the communication between enterprises and external organizations can help enterprises collect information and make up for the deficiency of internal learning, and then enhance the ability of enterprises to adapt to complex situations. Danilovic and Winroth (2005) [41] believed that enterprises lacking their own resources can obtain resources through external networks constructed by cooperation or strategic alliance, and network structural attributes can affect their own sensing capability. Kuo-Chung Chang (2011) [42] used the empirical method to verify that the external network relationships of enterprises (including horizontal, vertical and market relationships) can increase the sensing capability of enterprises and optimize flexibility. The sensing capability of LSI is the ability to perceive and respond to environmental changes by acquiring, integrating and reconstructing resources obtained from LSSC. The network size is related to the coverage of LSI and the maximum circulation of each line, which affects the breadth and depth of logistics activities, and then affects the scope of information collection and the grasp of the market environment. The size of the network scope determines the scale and heterogeneity of knowledge resources in LSSC, which is more helpful for LSI enterprises to find business opportunities, conduct service innovation and accumulate logistics service experience, and improve the sensing capability of LSI. Centrality makes LSI more aware of other members of the LSSC and makes it easier to obtain information and resources from the LSSC, enabling it to improve its perception of the environment through the network. Heterogeneity provides diversified network resources, and LSI builds LSSC based on the principle of resource complementarity. The higher the network heterogeneity, the more efficiently LSI can use and integrate resources. The more resources and methods LSI can choose when customer needs and environment change, the more conducive it is to enhancing the LSI sensing capability.
Here, we propose research hypotheses between the structural attributes and sensing capability of LSI on LSSC.
H2a:
Network size positively affects the sensing capability of LSI.
H2b:
Network scope positively affects the sensing capability of LSI.
H2c:
Network centrality positively affects the sensing capability of LSI.
H2d:
Network heterogeneity positively affects the sensing capability of LSI.
3.3. Relationship between Sensing Capability and LSI Growth
Sensing capability can directly change the development strategy of enterprises to adapt to environmental changes (Zahra et al., 2006 [32]). Most scholars prove that sensing capability can promote the performance of enterprises in growth. Yu, J.L.; Sung, E.K.; et al. (2022) [9] studied how sensing capability and strategic agility have affected B2B high-tech firms during the COVID-19 pandemic. The results show that sensing capability can significantly improve the competitive advantage of enterprises. Joel M., Hannele H., 2022 [36] demonstrated a strong reliance on managers’ effectual decision making in situations of unexpected uncertainty and sensing capability. Alshanty (2019 [37]) illustrated a positive effect of sensing capability on knowledge creation and firm innovation.
As a service industry, logistics enterprises are oriented to customer demand. Sensing capability enables LSI to better understand customer needs, enables it to deliver high-quality logistics services and create value-added services for customers, thereby increasing customer satisfaction and enterprise service capabilities, thereby achieving higher customer loyalty. With the exception of perceived customer changes, sensing capability enables LSI to gain timely insight into changes in the environment, including changes in demand, market orientation, policy culture, etc. LSI can find access to emerging markets and adopt up-to-date technologies, devices, applied business intelligence, and dominant resource combinations that enable faster decision-making and strategic shifts, which enable LSI to create more logistics products and tap more logistics needs, thereby promoting LSI growth.
This paper examines the sensing capability of LSI. LSI must face uncertain demand and changing environment, sensing capability has a positive effect on LSI to adapt to changes, obtain continuous competitive advantage and increase enterprise growth performance.
Based on the results of the above literature combing and analysis, this paper presents research Hypothesis 3.
H3:
Sensing capability of LSIs positively affects the growth performance of LSI.
3.4. Intermediary Effect of Sensing Capability on the Relationship between Network Structural Attributes and LSI Growth Performance
Logistics enterprises are based on information technology, involving spatial distribution and distance transfer. LSIs make use of their own advantages in information processing ability, position and reputation in the network, and enhance their competitive advantage by coordinating network members and integrating resources [42]. LSSC provides LSIs with externally accessible resources and opportunities, the sensing capability helps LSI to access these resources and opportunities from networks, and LSI growth is the ultimate goal and outcome of the formation of LSSC.
Based on the mediating effect of sensing capability, this paper studies how network structural attributes affect LSI growth performance. Summarizing the previous research results, we put forward research Hypothesis 4.
H4:
Sensing capability plays an intermediary role between network structural attributes and LSI growth performance.
The conceptual framework of this study is shown in Figure 1.
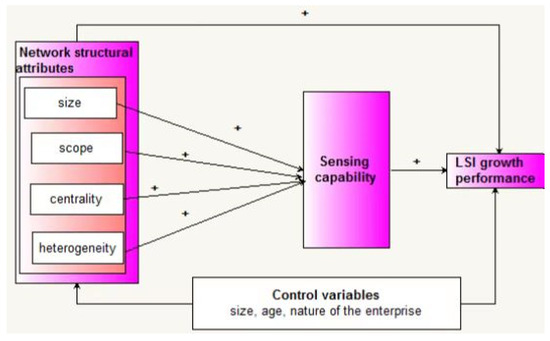
Figure 1.
Theoretical model of this study.
Figure 1 is a hypothetical model that reveals the interaction between network structural attributes, sensing capability and LSI growth performance, which is explained in the hypotheses. “+” represents a positive impact. It believes that network structural attributes can promote sensing capability and LSI growth performance. Sensing capability can promote LSI growth performance. The sensing capability is the mediation between network structural attributes and LSI growth.
LSI growth is a multi-factor variable. In addition to the influence of the LSSC network structural attributes and sensing capability, there are other variables that will have a significant impact on it. This study needs to control these variables to highlight the impact of LSSC network structural attributes and sensing capability on LSI growth performance. The control variables selected in this paper are enterprise nature, enterprise size and enterprise age (represented by the time involved in the logistics industry).
The nature of enterprises is different, and the operation and management methods will also be quite different, which will significantly affect the growth performance of enterprises. Therefore, this paper takes the nature of the enterprise as a control variable to examine its impact on LSI growth performance. According to the different nature of enterprises, this paper divides enterprises into six categories, namely, state-owned enterprises, private enterprises, collectives, foreign-funded-domestic holding, foreign-funded-foreign holding and others.
Enterprise scale is an important attribute that affects the behavior and decision making of logistics enterprises. The larger the scale of logistics enterprises, the more resources they have, the more areas their logistics network covers, the stronger the logistics circulation capacity, and the more obvious the scale effect, which is conducive to the growth of enterprises. Therefore, enterprise size has a significant impact on the growth performance of LSI. This study divides the size of logistics enterprises from the perspective of the number of employees and total assets.
The longer the enterprise runs the logistics, the more likely it is to accumulate more knowledge, experience, relationship network and ability, and the more likely it is to expand a larger area, standardize the logistics operation process, and develop more types of logistics service products, which is more conducive to obtaining customer recognition and improving customer satisfaction and enterprise growth performance. In this study, the operation time of logistics enterprises is divided into several stages: “less than 3 years, 3–5 years, 6–10 years, 11–20 years, and more than 20 years”.
4. Empirical Design
4.1. Sampling and Data Collection
This paper proposes the theoretical model of the micro-mechanism of LSSC network structure attributes to promote the growth of its core enterprise LSI by affecting the sensing capability. In addition to the fuzzy perception, the model should be accurately measured and tested empirically. Therefore, this paper will be adhering to the analysis steps of empirical research norms: questionnaire development, pre-survey and questionnaire revision, questionnaire distribution, data collection, data entry, data analysis, empirical research through the data collected by large sample questionnaire survey, verification of the hypothesis model, and in-depth discussion and analysis of the quantitative research results.
Variables were measured (see Table 1). This study used operable measurement items to measure variables.

Table 1.
Variables measurement.
When developing the questionnaire in this study, we followed the questionnaire design principles proposed by Floyd J. Fowler Jr. (2010) [43] and combined it with the characteristics of LSI. In terms of choosing the scale of the questionnaire measure table, the Likert scale (also known as the identity–disidentity scale), invented by psychologist Lexis Likert in 1932, was widely adopted by later generations. The Likert scale is divided into the 5 and 7 scales, the former being adopted by most scholars. Most items of the variables measured in the study questionnaire used the 5-scale Likert scale, where “1” means “complete disagreement”, gradually increasing from 1 to 5 consent degree, and “5” means “complete consent”. Adding up the respondent’s scores for each item gives a total individual attitude score.
Data were collected from middle and senior managers of large logistics enterprises in China through a professional questionnaire collection platform—Questionnaire Star. Questionnaire Star has abundant network resources and technical means to ensure the authenticity and accuracy of data. This study commissioned the platform to collect data. The whole questionnaire work lasted 6 months, and 319 valid data were collected.
Considering the practical difficulties of collecting questionnaires, the number of valid samples planned for this study is five times higher than the observed variables. This study included 20 observed variables for the structural model analysis alone, and the determined number of valid samples recovered was higher than 100. However, the total number of valid samples collected in this study was 319, which can meet the verification requirements.
SPSS20.0 was used for descriptive statistics, multivariate regression analysis and measuring the reliability and validity of variables. AMOS19.0 was used to perform confirmatory factor analysis for estimating the goodness of fit and validity of the constructs. Structural equation modeling for testing hypothesis model was also completed in AMOS19.0.
4.2. Descriptive Statistical Analysis
Descriptive statistics will be made on the sample enterprises, including the distribution area of the surveyed enterprises, the nature of the enterprises and the basic situation of the respondents. The surveyed enterprises cover all provinces in China, with a comprehensive geographical coverage, reflecting the strong representativeness of the sample. Data results are shown in Table 2.
Table 2.
Descriptive statistics.
Table 2 shows that private enterprises accounted for 64.9% of the total, more than half, and the proportion of state-owned enterprises, collective enterprises and foreign-funded enterprises was less than 10%. This is directly related to the distribution of the nature of China‘s logistics enterprises, of which small private enterprises accounted for the majority. The size of the enterprise is counted according to the number of employees and the total assets. The number of employees in the sample enterprises varies greatly. A total of 5 companies were below 20 employees, accounting for 1.6%; 23 logistics enterprises have 20~50 employees, accounting for 7.2%. This shows that there are not many companies with less than 50 people, and even fewer companies with less than 20 people. The number of samples from 50 to 200 people, 200 to 500, and more than 500 is not much different, all accounting for about 30% of the total, respectively. This reflects the distribution of the sample in the size of the number of employees, which is well-representative. From the distribution of total assets of the sample enterprises, there were 18 enterprises with total assets below 10 million, accounting for 5.6%; 10~30 million enterprises have 85, accounting for 26.6; 30 million to 150 million enterprises have 104, accounting for 32.6%; 150 million to 300 million enterprises have 60, accounting for 18.8%; and more than 300 million enterprises have 52, accounting for 16.3%. The sample data reflect the distribution of enterprises with different asset sizes, reflecting the good representativeness of sample enterprises. There are 146 enterprises aged 6–10 years, accounting for 45.8%; there are 114 in 11–20 years, accounting for 35.7%; 3–5 years is 41, accounting for 12.9%; and there are only 18 more than 20 years, accounting for 5.6%. Thus, most of the sample enterprises are between 6 and 20 years old. The sample can reflect the distribution of enterprises at different ages and has a certain representativeness.
From the position statistics of the questionnaire respondents in Table 1, it can be seen that there are 105 senior managers, accounting for 32.9%, and 214 middle managers, accounting for 67.1%. Because this paper limits the questionnaire filling to be completed by middle-level or above managers, the number of personnel in other categories is 0. Thus, the sample source meets the requirements of this paper.
4.3. The Results of Reliability and Validity
The second step of the statistical analysis is to complete a data reliability analysis in order to convince people that the data collected are reliable and stable. In addition to the network scope, the enterprise size, enterprise age, and enterprise nature were directly measured, and other latent variables were measured by subjective factor description, so it was necessary to test the reliability of these latent variables. A sample reliability test was conducted using SPSS20.0.
The Cronbach’s α coefficient was selected as an index to determine the internal consistency and stability of the data. The Cronbach’s α is between 0 and 1, and the greater the Cronbach ‘s α value, the higher the internal reliability. It is generally believed that the credible criterion is a Cronbach’s α greater than 0.7, Otherwise, the items of the questionnaire need to be modified. In addition, according to experience, it is reasonable that the correlation coefficient between each item kept in the variable measurement scale and the total is greater than 0.35 (Floyd J. Fowler Jr. 2010 [43]).
The validity test was completed by factor analysis. It extracted the factors by principal component analysis and performed the factor rotation according to the extreme generous difference method. The condition that the eigenvalue is greater than 1 is taken as the standard of factor extraction. The greater the variance contribution rate, the more likely the public factors reflect the information of the observed variables. When the value of the factor loadings of the index terms is greater than 0.5, and the proportion of the cumulative explained variance is greater than 60%, which shows that the latent variables of the multi-index terms meet the requirements of structural validity. According to these steps and standards, this paper tests the validity of variables.
The Kaiser–Meyer–Olkin (KMO) test is an indicator used to compare simple correlation coefficients and partial correlation coefficients between variables. The KMO is between 0 and 1. When the sum of squares of simple correlation coefficients between all variables is much larger than the sum of squares of bias relations, the KMO value is close to 1. The closer the KMO value is to 1, the stronger the correlation between variables, the more suitable the original variables are for factor analysis. When the sum of squares of simple correlation coefficients between all variables is close to 0, the KMO value is close to 0. The closer the KMO value is to 0, the weaker the correlation between variables, and the more unsuitable the original variables are for factor analysis.
This paper takes LSI growth performance as the dependent variable, based on the literature review and the characteristics of LSI, select the general enterprise growth performance is relatively mature but also suitable for logistics enterprises measurement indicators. The design of seven questions, respectively is about your company compared with the main competitors in the industry in the past three years: (JXC1) sales growth rate is very high; (JXC2) profit growth rate is very high; (JXC 3) the annual growth rate of employees is very high; (JXC 4) the employee specialization rate is growing rapidly; (JXC 5) the logistics services/products we provide have a strong competitive advantage; (JXC 6) the annual growth rate of market share is very high; and (JXC 7) high customer satisfaction. The total correlation is, respectively, 0.712, 0.734, 0.733, 0.733, 0.420, 0.417, and 0.709. Cronbach’s α, respectively, is 0.835, 0.831, 0.830, 0.831, 0.874, 0.872, and 0.834. The Cronbach’s α coefficient of the growth performance measure scale was more than 0.70, but the total correlation coefficient of the items JXF5 and JXF6 was less than 0.5, indicating that the response scores were not strong. After deletion, the reliability analysis was conducted. The reliability detection of the LSI growth performance scale after the deletion of the unqualified items meets the statistical requirements. We found unreasonable items JXF5/JXF6 and removed them, and then the reliability of data collected by the remaining variables was within acceptable range. The variable common degrees of the seven question items are, respectively, 0.718, 0.721, 0.704, 0.715, and 0.703. The factor loads of the seven question items are, respectively, 0.847, 0.849, 0.839, 0.846, and 0.838, which are all greater than 0.50. The eigenvalue of growth performance is 3.560. The variance contribution rate is 71.201%, which is all greater than 60%. KMO is 0.860, which is greater than 0.7. The significance probability of Bartlett ‘s spherical test is 0.000, less than 0.001. It shows that the validity test of the LSI growth performance measurement scale meets the statistical requirements.
The independent variable network scale is tested with two items. (SJGM1) Compared with peers, more and other logistics service providers have business contact with your company. (SJGM 2) Compared with your peers, more customers have business contacts with your company. The network range is directly calculated by summing up the number of cooperation and communication methods with LSI. Twenty-four main modes of communication were listed, and five spaces were left for the questionnaire bearer to fill in other possible communication methods (if present). Measure the centrality with four question items: (SJZXX 1) your company has easier access to certain resources in your network; (SJZXX 2) your company’s position in the network encourages other companies on the network to strengthen their cooperation with them; (SJZXX 3) your company’s network status strengthens the trust of the partners in your company; (SJZXX 4) when establishing contacts with your company, many of them have to be connected through your company. Heterogeneity is measured by the difference between enterprise partners (customers, logistics service providers, logistics service subcontractors) in the type, organizational structure, technical level and technical expertise, corporate culture, employment personnel, total assets and other aspects. The following five items are used to measure: (SJYZX1) your logistics partners and customers are quite different from the company in main business; (SJYZX2) your customers have more types; (SJYZX3) different organizational structure between cooperation/contact; (SJYZX4) different technical level and technical expertise in cooperation/contact; (SJYZX5) different corporate culture, employment personnel and total assets with your company. The total correlations of the above items were all greater than 0.5, except for JGZXX2, which was 0.435. After deleting it, the Cronbach’s α coefficient of network structure properties was 0.771, which is greater than 0.70; the correlation coefficient of all network structural attributes is greater than 0.50, and the Cronbach’s α coefficient of all variables is greater than 0.70, indicating that the reliability detection of the measure of network structure properties meets the statistical requirements.
The sensing capability as an intermediary variable was tested with five questions: (DGZ1) to frequently communicate with peers, logistics service demand enterprises, final customers and other stakeholders, and can obtain useful information from it; (DGZ2) good understanding of the development and operation rules of the logistics industry; (DGZ3) have a deep understanding of logistics service providers, logistics service subcontractors and competitors; (DGZ4) can fully understand the changing trend of the environment and can respond to it in advance; (DGZ5) can quickly perceive the current needs and changing trends of customers. The correlation coefficient of all items is greater than 0.50, the Cronbach‘s α coefficient of all items is greater than 0.70, Cronbach’s α of sensing capability is 0.896, indicating that the reliability detection of the measure of the sensing capability meets the statistical requirements. The variable common degrees of the seven question items are, respectively, 0.701, 0.692, 0.703, 0.722, and 0.727; the eigenvalue of growth performance is 5.835; KMO is 0.893, which is greater than 0.7; and the significance probability of Bartlett ‘s spherical test is 0.000, less than 0.001. It shows that the validity test of the LSI growth performance measurement scale meets the statistical requirements.
The main purpose of the confirmatory factor analysis is to verify whether the factor structure (number of factors and factor load) of the measured variables is unified with the pre-established hypothetical model, focusing on the parameter estimation and model testing so as to provide the basis for further structural equation model testing. To ensure that the factor structure of the measured variables was in conceptual agreement with the present study, this study next performed a confirmatory factor analysis using AMOS19.0 software. The results show that the measurement scale of each variable in this paper has passed the validity test and reliability analysis and can be further analyzed.
4.4. Results
In this paper, the AMOS19.0 software is used to construct the structural equation model to test the proposed conceptual model. Table 3 shows the results of a path analysis.
Table 3.
Fitting results of initial structure equation model.
Investigate the adaptation of models (as shown in Table 3). χ2/df = 24.989 > 5, RMSEA = 0.275, which is greater than 0.05, RFI = 0.073 < 0.9, AGFI = 0.144 < 0.9, well beyond the adaptation range; CFI = 0.950 > 0.90, GFI = 0.961 > 0.90, NFI = 0.949 > 0.9, IFI = 0.951 > 0.9, RMR = 0.006 < 0.05, reached the adaptation standard. This shows that the adaptability of the model is not good, and there is much room for improvement, which needs further correction.
It is believed that when making a model correction to the SEM, it is best to correct only one parameter at a time, and then re-execute the model estimation after the correction. Model corrections include removing nonsignificant paths, limiting paths, or releasing previously restricted paths. The deletion path is followed according to the path principle that the smallest absolute value of C.R. value is deleted first, because the absolute value of C.R. value is the smallest, which means the lowest level of significance. The principle of increasing the path is to increase the correlation between the variables with the largest correction index MI. However, it must be noted that the added parameter relationship cannot violate the assumption of SEM; for example, there is no direct relationship between potential variables and index variables, but not a path causal relationship.
The model was corrected as described above. These two paths of “Network-size to LSI growth performance” and “heterogeneous to sensing capability” were deleted, and the network scope variable was deleted because it has no significant impact on LSI growth performance. The following modified model-fitting results are shown in Table 4.
Table 4.
Fitting results of modified structure equation model.
4.5. Discussion
It is proved that network structural attributes can improve the growth performance and sensing capability of LSI. The sensing capability can significantly improve the growth performance of LSI. The sensing capability plays an intermediary role between the network structural attributes and LSI growth performance.
Table 3 shows that only centrality and heterogeneity in network structural attributes have a direct impact on LSI growth performance, and their impact standardized path coefficients are 0.146 and 0.160, respectively, that is to say, centrality and heterogeneity can significantly affect the growth performance of LSI directly. Theoretically, the network scope is related to the growth performance, but the empirical verification shows that there is no correlation between the specific LSSC network scope and the LSI growth performance. After further investigation, this paper thinks that it may be brought by the particularity of LSSC network. The connection mode of LSSC network is mainly commercial activities, and its upper members are mainly logistics enterprises and logistics demand side (including end customers). The goal of its formation is very clear, and the content of cooperation is also determined based on the principle of complementarity, so the scope of the network does not affect the LSI growth performance. Network size indirectly affects LSI growth performance through intermediary variables.
Network size significantly promotes sensing capability, and the standardized path coefficient for sensing capability is 0.15. This shows that the network size has a greater impact on sensing capability. Network scope has no effect on sensing capability due to the particularity of the LSSC network. The standardized path coefficient for the impact of network centrality on sensing capability is 0.30, indicating that the direct effects of network centrality on the sensing capability are significant. Heterogeneity has no direct impact on sensing capability.
Sensing capability has positive and significant effects on growth performance of LSI. The standardized path coefficient is 0.17.
As given in Table 3, Table 4 and Table 5, the sensing capability is the intermediary between network structural attributes and LSI growth performance. As shown in Table 5, the standardized coefficient of the overall impact of network size on LSI growth performance is 0.161, of which the direct impact is 0 (that is, there is no direct impact), the indirect impact is 0.161; the indirect impact is significant. Centrality has a significant direct impact on sensing capability. At the same time, the sensing capability can significantly improve the LSI growth performance directly. From this, it can further test the mediating effects of sensing capability between centrality and LSI growth performance. The standardized path coefficient is 0.296, shown in Table 5, in which the direct impact is 0.146 (shown in Table 6) and the indirect impact is 0.15 (shown in Table 7). The significant level of overall impact was 0.000, indicating that the overall impact of network centrality on LSI growth performance reached a significant level; the significant level of direct impact was 0.098, greater than 0.05, indicating that the direct impact of network centrality on the overall impact of LSI growth performance did not reach a significant level. p ≤ 0.001 indicates that the indirect impact of network centrality on LSI growth performance reached a significant level. The indirect effects of sensing capability on LSI growth performance are 0.303 × 0.167 = 0.0506. From this, it can be concluded that the ability of sensing capability plays a complete intermediary role between “centrality” and “LSI growth performance“. Heterogeneity has no direct and significant effect on sensing capability. Therefore, it can be concluded that sensing capability does not act as an intermediary between “heterogeneity” and “LSI growth performance“.
Table 5.
Standardization coefficient of overall impact.
Table 6.
Standardization coefficient of direct impact.
Table 7.
Standardization coefficient of indirect impact.
5. Conclusions
Combined with the literature and theoretical analysis, this paper discusses the relationship between network structural attributes, sensing capability and LSI growth performance. Using AMOS19.0 as the analysis tool, the theoretical framework and research hypothesis are tested by using the structural model equation method. The fitting degree of the initial model is not very good. By deleting the insignificant paths, the modified model is obtained, and the modified model obtains good fitting results. Finally, based on the modified model, the influence effect between each variable is analyzed so as to clarify the path and mechanism of the interaction between each variable. At the same time, the intermediary role of sensing capability is tested, and the research conclusion that sensing capability plays different intermediary roles between each dimension of network structural attributes and LSI growth performance is obtained.
The empirical results show that network size, centricity, and heterogeneity have a significant positive influence on growth performance. The theoretical model of this paper is consistent to explain the network with large scale, high heterogeneity and high status in the network, which can bring more heterogeneous resources and information to LSI, and thus can increase the LSI growth performance, the network size, and centricity by promoting LSI dynamic capability.
The empirical study shows that the network scope has no significant impact on the sensing capability and growth performance of LSI, which does not agree with the assumption of the model. Of the possible reasons, the first is that the network scope of understanding does not have logistics coverage, but speaks to the diversity of the network relations. The purpose of forming LSSC for LSI is to take advantage of complementary resources to cope with uncertainty. Secondly, the characteristics of LSSC have a short structure and high complexity and are dominated by LSI. Cooperation and competition are the main relationships between LSI and other members on the LSSC.
This study enriches and develops the social network and supply chain theory. More and more logistics enterprises are beginning to form and join the LSSC with increasing demand and environmental uncertainties. The research conclusion can help logistics enterprises in China to understand LSSC and sensing capability, understand the ways to enhance the level of sensing capability, which has a positive guiding significance in the dynamic environment.
Although we obtained a meaningful research conclusion, because of the limitation of subjective ability and objective resource constraints in this paper, there are still some deficiencies; thus, there are many aspects that need to be deepened and improved in future studies. For example, the variable network attributes and sensing capability of this study are abstract concepts; in addition, there is much content, but because of the limitations of the study in this paper, based on the characteristics of logistics enterprises and LSSC, we selected a few main dimensions to measure and were unable to measure different aspects of the two variables.
Author Contributions
Conceptualization, C.H. and X.X.; methodology, C.H.; software, X.X.; validation, C.H. and X.X.; formal analysis, C.H.; investigation, X.X.; resources, X.X.; data curation, X.X.; writing—original draft preparation, C.H.; writing—review and editing, X.X.; visualization, X.X.; supervision, X.X.; project administration, C.H.; funding acquisition, C.H. and X.X. All authors have read and agreed to the published version of the manuscript.
Funding
This research was funded by Humanities and Social Sciences Planning fund project, Ministry of Education, China, grant number 20YJA880064.
Institutional Review Board Statement
Not applicable.
Informed Consent Statement
Not applicable.
Data Availability Statement
The data used to support the findings of this study are currently under embargo while the research findings are commercialized. Requests for data [6/12 months] after publication of this article will be considered by the corresponding author.
Conflicts of Interest
The authors declare no conflict of interest. The funders had no role in the design of the study; in the collection, analyses, or interpretation of data; in the writing of the manuscript; or in the decision to publish the results.
References
- Chen, Y.J.; Yang, B. Analysis on the evolution of shipping logistics service supply chain market structure under the application of blockchain technology. Adv. Eng. Inform. 2022, 53, 4–17. [Google Scholar] [CrossRef]
- Zhang, S.; Bi, C.; Zhang, M. Logistics service supply chain order allocation mixed K-Means and Qos matching. Procedia Comput. Sci. 2021, 188, 121–129. [Google Scholar] [CrossRef]
- Hansen, E.L. Entrepreneurial networks and new organization growth. Entrep. Theory Pract. 1995, 19, 7–19. [Google Scholar] [CrossRef]
- Jenssen, J.I. Social networks, resources and entrepreneurship. Int. J. Entrep. Innov. 2001, 2, 103–109. [Google Scholar] [CrossRef]
- Crainic, T.G.; Feliu, J.G.; Ricciardi, N.; Semet, F.; VanWoensel, T. Operations Research for Planning and Managing City Logistics Systems; Technical report CIRRELT-2021-45; CIRRELT–Université de Montréal: Montreal, Canada, 2021. [Google Scholar]
- Ju, Y.; Wang, Y.; Cheng, Y.; Jia, J. Investigating the Impact Factors of the Logistics Service Supply Chain for Sustainable Performance: Focused on Integrators. Sustainability 2019, 11, 538. [Google Scholar] [CrossRef]
- Morana, J. Sustainable Supply Chain Management; John Wiley & Sons: Hoboken, NJ, USA, 2013. [Google Scholar]
- Li, C.; Shi, M.; Qu, B.; Li, X. Deep attributed network representation learning via attribute enhanced neighborhood. Neurocomputing 2022, 508, 170–181. [Google Scholar] [CrossRef]
- Zahoor, N.; Golgeci, I.; Haapanen, L.; Ali, I.; Arslan, A. The role of dynamic capabilities and strategic agility of B2B high-tech small and medium-sized enterprises during COVID-19 pandemic: Exploratory case studies from Finland. Ind. Market. Manag. 2022, 105, 502–514. [Google Scholar] [CrossRef]
- Wang, S.; Hu, Z.-H. Green Logistics Service Supply Chain Games Considering Risk Preference in Fuzzy Environments. Sustainability 2021, 13, 8024. [Google Scholar] [CrossRef]
- Liu, W.; Ji, J. Service Supply Chain: A New Trend in Supply Chain Research; China Material Press: Beijing, China, 2006. [Google Scholar]
- Arsić, M.; Jovanović, Z.; Tomić, R.; Tomović, N.; Arsić, S.; Bodolo, I. Impact of Logistics Capacity on Economic Sustainability of SMEs. Sustainability 2020, 12, 1911. [Google Scholar] [CrossRef]
- Gimenez, C.; van der Vaart, T.; van Donk, D.P. Supply chain integration and performance: The moderating effect of supply complexity. Int. J. Oper. Prod. Manag. 2012, 32, 583–610. [Google Scholar] [CrossRef]
- Ma, F.; Xue, H.; Yuen, K.F.; Sun, Q.; Zhao, S.; Zhang, Y.; Huang, K. Assessing the Vulnerability of Logistics Service Supply Chain Based on Complex Network. Sustainability 2020, 12, 1991. [Google Scholar] [CrossRef]
- Qureshi, M.R.N.M. A Bibliometric Analysis of Third-Party Logistics Services Providers (3PLSP) Selection for Supply Chain Strategic Advantage. Sustainability 2022, 14, 11836. [Google Scholar] [CrossRef]
- Liu, H.; Chen, H.; Zhang, H.; Liu, H.; Yu, X.; Zhang, S. Contract Design of Logistics Service Supply Chain Based on Smart Transformation. Sustainability 2022, 14, 6261. [Google Scholar] [CrossRef]
- Varadarajan, R. Customer information resources advantage, marketing strategy and business performance: A market resources based view. Ind. Mark. Manag. 2020, 89, 89–97. [Google Scholar] [CrossRef]
- Zaheer, A.; Bell, G.G. Benefiting from network position: Firm capabilities, structural holes, and performance. Strateg. Manag. J. 2005, 26, 809–825. [Google Scholar] [CrossRef]
- Cristobal, C.; Angeles, G.; Maria, S. Network resources and social capital in aire alliance portfolios. Tour. Manag. 2013, 36, 441–453. [Google Scholar]
- Burt Ronald, S. Structural Holes: The Social Structure of Competition; Harvard University Press: Cambridge, MA, USA, 1992. [Google Scholar]
- Gulati, R. Alliances and networks. Strateg. Manag. J. 1998, 19, 293–317. [Google Scholar] [CrossRef]
- Higgins, M.C.; Kram, K.E. Reconceptualizing mentoring at work: A developmental network perspective. Acad. Manag. Rev. 2001, 26, 264–288. [Google Scholar] [CrossRef]
- Wellman, B. Network analysis: Some basic principles. Sociol. Theory 1983, 1, 155–200. [Google Scholar] [CrossRef]
- Lin, N.; Zhang, L. Social Capital: Theory of Social Structure and Action; Shanghai People’s Publishing House: Shanghai, China, 2005. [Google Scholar]
- Johanson, J.; Mattsson, L.G. Network positions and strategic action: An analytical framework. In Industrial Networks: Anew View of Reality, Univ.; Axelsson, B., Easton, G., Eds.; Routledge: London, UK, 1992; pp. 205–217. [Google Scholar]
- Makoto, U.; Susumu, S. Influence of a network structure on the network effect in the communication service market. Physica A 2008, 387, 5303–5310. [Google Scholar]
- Palmatier, R.W.; Dant, R.P.; Grewal, D.A. Comparative longitudinal analysis of theoretical perspectives of inter-organizational relationship performance. J. Mark. 2007, 71, 172–194. [Google Scholar] [CrossRef]
- Grant, R.M. The resource-based theory of competitive advantage: Implications for strategy formulation. California. Manag. Rev. 1991, 33, 114–135. [Google Scholar] [CrossRef]
- Teece, D.J. Explicating dynamic capabilities: The nature and micro foundations of (sustainable) enterprise performance. Strateg. Manag. J. 2007, 28, 1319–1350. [Google Scholar] [CrossRef]
- Iansiti, M.; Clark, K.B. Integration and dynamic capability: Evidence from product development in automobiles and mainframe computers. Ind. Corp. Change 1994, 3, 557–605. [Google Scholar] [CrossRef]
- Johnston, D.A.; McCutcheon, D.M.; Stuart, F.I.; Kerwood, H. Effects of supplier trust on performance of cooperative supplier relationships. J. Oper. Manag. 2004, 22, 23–38. [Google Scholar] [CrossRef]
- Zahra, S.; Sapienza, H.; Davidsson, P. Entrepreneurship and dynamic capabilities: A review, model and research agenda. J. Manag. Stud. 2006, 43, 917–955. [Google Scholar] [CrossRef]
- Subramaniam, M.; Youndt, M.A. The influence of intellectual capital on the types of innovative capabilities. Acad. Manag. J. 2005, 48, 450–463. [Google Scholar] [CrossRef]
- Liu, S.Y.; Li, C.; Feng, Y.P.; Rong, G. Clustering structure and logistics: A new framework for supply network analysis. Chem. Eng. Res. Design 2013, 2, 1–7. [Google Scholar] [CrossRef]
- Endres, R.; Helm, R.; Dowling, M. Linking the types of market knowledge sourcing with sensing capability and revenue growth: Evidence from industrial firms. Ind. Mark. Manag. 2020, 90, 30–43. [Google Scholar] [CrossRef]
- Mero, J.; Haapio, H. An effectual approach to executing dynamic capabilities under unexpected uncertainty. Ind. Mark. Manag. 2022, 107, 82–91. [Google Scholar] [CrossRef]
- Alshanty, A.M.; Emeagwali, O.L. Market-sensing capability, knowledge creation and innovation: The moderating role of entrepreneurial-orientation. J. Innov. Knowl. 2019, 4, 171–178. [Google Scholar] [CrossRef]
- Beekman, A.V.; Robinson, R.B. Supplier Partnerships and the Small, High-Growth Firm: Selecting for Success. J. Small Bus. Manag. 2004, 42, 59–77. [Google Scholar] [CrossRef]
- Nybakk, E.; Lunnan, A.; Jenssen, J.I.; Crespell, P. The importance of social networks in the Norwegian firewood industry. Biomass Bioenergy 2013, 57, 48–56. [Google Scholar] [CrossRef][Green Version]
- Baum, J.A.C.; Ingram, P. Survival-enhancing learning in the Manhattan hotel industry, 1898–1980. Manag. Sci. 1998, 44, 996–1016. [Google Scholar] [CrossRef]
- Danilovic, M.; Winroth, M. A tentative framework for analyzing integration in collaborative manufacturing network settings: A case study. J. Eng. Technol. Manag. 2005, 22, 141–158. [Google Scholar] [CrossRef]
- Chang, K.C.; Wong, J.H.; Li, Y.; Lin, Y.C.; Chen, H.G. External social capital and information systems development team flexibility. Inf. Softw. Technol. 2011, 53, 592–600. [Google Scholar] [CrossRef]
- Furnude, J.F. Questionnaire design and Evaluation; Chongqing University Press: Chongqing, China, 2010. [Google Scholar]

Publisher’s Note: MDPI stays neutral with regard to jurisdictional claims in published maps and institutional affiliations. |
© 2022 by the authors. Licensee MDPI, Basel, Switzerland. This article is an open access article distributed under the terms and conditions of the Creative Commons Attribution (CC BY) license (https://creativecommons.org/licenses/by/4.0/).