Abstract
The steep reduction in costs of electrolysis and methanation has made renewable power-to-gas much more affordable. Reeling from an energy crisis, Europe could use this technology for near-shoring production of clean and reliable synthetic natural gas (SNG) and end dependence on Russian gas. This article investigates the economic feasibility of producing SNG in Norway, which has amongst the cleanest and cheapest electricity production in Europe. It is found that SNG can be produced for 141 €/MWh at a 10 MW electrolyzer facility in 2023; and for 108 €/MWh at a larger 100 MW electrolyzer facility in 2030. The relevance of these prices is discussed in the context of the current and future European gas markets, and recommendations are made to reduce the production costs even further.
1. Introduction
The Russian invasion of Ukraine in 2022 and the ensuing disruption of natural gas supplies to Europe has led to an energy crisis [1]. The European Union (EU) depends on natural gas for nearly a quarter of its energy needs [2], and more than 40% of this gas is supplied by Russia [3]. The supply disruption caused European gas prices (Dutch TTF) to soar nearly ten times in a year, as shown in Figure 1, and touch all-time highs of 339 €/MWh [4]. The energy crisis led to the RePowerEU Plan, which aims to make Europe independent of Russian fossil fuels before 2030 and proposes increasing the renewables target to 45% of electricity generation within the same time frame [5]. The policy builds upon the 2019 European Green Deal [6], which requires EU member states to reduce emissions by at least 55% by 2030, compared to 1990 levels.
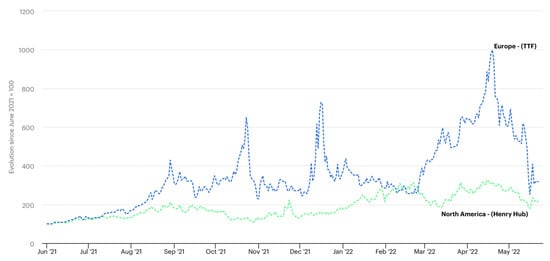
Figure 1.
The European (TTF) gas price (blue dashed curve) has increased significantly from June 2021 to October 2022 as compared to the US (Henry Hub) price (green dashed curve) [13]. Gas prices are indexed to a starting index value of 100 in June 2021 to enable comparison between different price markers. The European TTF prices increased by ~10× from June 2021 to August 2022, while North American prices increased by ~3× over the same period. The peak European TTF price in August 2022, corresponding to index value of 1000, was 339 €/MWh [4].
Renewable Power-to-Gas (PtG) technologies could help address the trilemma of secure, affordable, and sustainable natural gas supply in Europe. This article focuses on PtG applications which convert electricity to methane in a two-step process. In the first step called electrolysis, electrical energy is passed through water to decompose it into its constituents, i.e., hydrogen and oxygen. In the second step, also called methanation or the Sabatier reaction, hydrogen reacts with carbon dioxide to produce water and synthetic natural gas (SNG) The so-formed methane is referred to as synthetic natural gas (SNG), and the reaction is highly exothermic, releasing 165 kJ/mol of heat as shown in Equation (1) [7,8].
CO2 + 4H2 → CH4 + 2H2O ΔHR = −165 kJ/mol
PtG applications can help achieve significant reductions in carbon emissions, especially in geographies with limited availability of CO2 underground storage. Furthermore, SNG can be used for manifold applications such as long-term storage of renewable energy (RE) and load balancing of electricity grids [9], helping reduce capital costs in upgrading the grid to accommodate more RE. Additionally, converting power to SNG instead of H2 could help reduce upgrade costs of existing pipeline and gas transportation infrastructure. The European Hydrogen backbone study estimated that repurposing existing natural gas pipelines to transport hydrogen within 21 European countries would need between €43 and €81 billion by 2040, mainly driven by compression costs [10,11]. Another European study suggests that only four “no-regret” pure hydrogen corridors are sufficient for early investment in hydrogen pipelines, and emphasizes that there is no justification for creating a larger, pan-European hydrogen backbone [12].
While PtG production has been explored in many geographies around the world, the potential of Norway as a PtG producer has not been studied adequately. Norway generates cheap and abundant clean electricity, which can be used to produce renewable SNG. This article aims to investigate the economic feasibility of SNG production in Norway, while factoring in long-term cost trends for electricity, electrolyzers, methanation units and other key components. A sensitivity analysis has been performed as well to estimate the impact of key parameters on SNG production costs.
The article consists of six sections. After the Introduction, Section 2 examines existing literature on the economic analysis of PtG applications and discusses the missing gap. Section 3 dives into the methods and key cost assumptions used for performing the economic analysis. Section 4 presents the main results of the analysis including cost breakdown and sensitivity tornado charts. Section 5 discusses key results with regards to natural gas price trends and compares them with results obtained in previously performed studies. The last section concludes the article and points towards additional strategies and future research areas to further improve the economic feasibility of SNG.
2. Literature Review
2.1. Existing PtG Projects and Associated Studies
The idea of large-scale PtG to enable the transition of energy systems was first published by Sterner in Germany [14], where CO2 methanation was discussed in the context of fuel cells in the early 2000s [15]. The European Union has funded various research and pilot scale PtG facilities to improve process efficiency and develop a roadmap for large-scale PtG conversion in Europe. One of these initiatives, HELMETH, focused on the development of a proof of concept of a highly efficient PtG system by thermally integrating methanation with high-temperature electrolysis using a solid oxide electrolyzer cell (SOEC) [16]. Another European initiative, STORE&GO, operated three pilot plants located in Italy, Switzerland and Germany with a mix of electrolysis and methanation technologies [17].
A review of operational PtG projects by Thema et al. suggests that 38 methanation projects were active worldwide in 2019. Of these, the bulk of projects were located in Germany, Denmark and Netherlands [18], and only represent an installed production capacity of 6 MWLHV-SNG [18]. STORE& GO estimated that the European power-to-methane capacity would be in the range of 40 to 200 GWSNG in nearly half of the analyzed low-carbon scenarios [19]. Böhm et al. estimated that European demand for large-scale PtG could go up to an even higher 600 GWSNG by 2050 as supply of renewable power and the demand for decarbonized fuel increases [20].
Given the importance of PtG towards achieving energy transition, many studies have been performed on the technical and economic feasibility of producing SNG from electricity [20,21,22,23,24,25,26,27,28,29]. Böhm et al. developed a calculation model for learning curves of main components of a PtG system [22], and used it to estimate the future costs of SNG production [20]. Gorre et al. [23] evaluated the production costs of SNG for an optimized PtG system, while considering variations in full load hours of plant operations. Hoffman et al. [21] determined additional system costs to inject produced SNG into the pipeline network.
Additional studies have focused on the economic feasibility of SNG production in a more localized context. A study executed by Agora Energiewende investigates the economic feasibility of producing SNG in Germany versus importing it from Iceland, North Africa and the Middle East [24]. Ipsakis et al. [26] estimates the production cost of SNG for a typical cement industrial facility in Europe. Leeuwen et al. [27] examine the PtG operator’s willingness to pay for electricity prices in Germany, France, Netherlands and Denmark. Jiang et al. [28] determine the production cost of SNG for a factory located in Northwest China, while Dominguez-Gonzalez et al. [29] evaluate the business case for integrating a PtG system with power production in the UK.
While these studies reveal the general methodology, system configurations and cost assumptions for estimation of SNG production costs, they fail to contextualize these costs with respect to market trends for natural gas prices. Furthermore, these studies refrain from addressing the potential of Norway in producing and supplying Europe with SNG. prices. This study aims to fill the missing gaps and appraise SNG production costs for Norway.
2.2. Norway as a Potential SNG Supplier for Europe
Norway is the second largest supplier of natural gas to the EU after Russia [3]. Given the geopolitical situation, the EU is seeking to increase pipeline and liquified natural gas (LNG) imports from Norway even further [5]. Additionally, Norway’s electricity production is not only amongst the cheapest in Europe [30,31,32], but also amongst the cleanest, nearly ten times lower than Germany [33] (Figure 2). Thus, Norway could use its abundant clean electricity to generate “clean” natural gas and send it to European countries through the existing pipeline network.
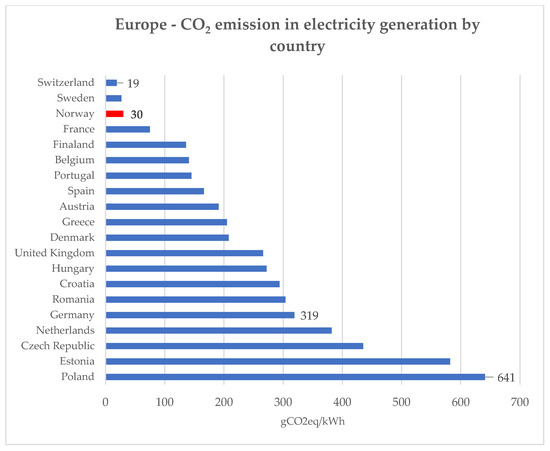
Figure 2.
CO2 emissions from electricity production by country on 28 October 2022 [33].
Norway’s clean and cheap electricity supply could be attributed to hydropower. In 2021, Norway produced 157 TWh, of which 91% was from hydropower, 8% from onshore wind and <1% from thermal sources [32]. Norway typically generates surplus electricity and exports 19 TWh to neighboring countries in normal weather years [34]. Norway’s power grid is divided into five different pricing zones, with the consumption concentrated in the three southern regions of Oslo, Stavanger and Bergen [31]. However, surplus production in the northern regions, and limited transmission capacity to southern demand centers result in significantly cheaper prices in north Norway, which could be used to produce SNG.
3. Materials and Methods
3.1. Methodology
The economic feasibility of SNG is estimated using a levelized cost of energy (LCOE) approach, which calculates the lifetime costs for the facility per unit energy produced. This methodology enables cost comparison between different technologies and configurations of PtG systems while factoring in the time-value of money [23]. The levelized cost approach has been adapted to estimate the gas production costs (GPC) for SNG as below Equation (2) [35]:
where GPC = Gas Production Cost, or Levelized cost of SNG production;
CAPEXt = Capital expenditure, calculated using depreciation expenses in year t (€);
OPEXt = Operation and maintenance expenditure in year t (€);
Energyt = Electricity costs in year t (€);
SNGt = Synthetic methane gas produced in year t (MWh);
r = Discount rate (%);
n = Operations lifetime of facility (years), assumed to be 20 years.
Decommissioning costs have not been considered for the purpose of this analysis.
3.2. PtG System Configuration
Leeuwen et al. [36] proposed a PtG system configuration (Figure 3) for the STORE&GO project. This study considers a similar setup composed of two principal systems, electrolyzer and methanation, further discussed in Section 3.3.
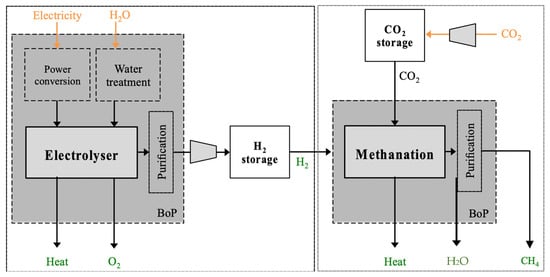
Figure 3.
Overview of a methane producing PtG facility. The feedstocks are marked in orange, while outputs are marked in green [36].
Electrolysis is at the core of producing natural gas from power. Currently, two main electrolysis technologies are commercially available—alkaline electrolysis (AE), which uses a strong base such as potassium hydroxide as the electrolyte, and proton exchange membrane (PEM), which uses an ionically conductive solid polymer [37]. While AE is more matured and cheaper, PEM is more efficient, easier to handle, has a relatively lower footprint and produces pressurized hydrogen. PEM is more expensive than AE currently, but is expected to become more cost-efficient than AE as the technology matures [38,39,40].
A third electrolysis technology, solid oxide electrolysis cell (SOEC), also holds significant potential for improving overall process efficiency, as the heat generated by methanation could be used to drive efficient electrolysis at high temperatures. This concept was being researched by the HELMETH consortium in Europe [16], but it is not as mature as AE or PEM. Consequently, PEM electrolysis has been considered for this analysis. A more detailed comparison between the various electrolyzer technologies is presented in Table 1.

Table 1.
Electrolysis production technologies [41].
The second part of the PtG process, methanation, can be performed using both biological and chemical approaches. Biological methanation uses methanogenic microorganisms as biocatalysts under anaerobic conditions [42]. Chemical methanation typically uses nickel (Ni) as catalyst in an adiabatic fixed-bed reactor at relatively higher temperatures of 200–550 °C [43,44]. A review by Götz et al. [43] of different methanation techniques suggests that while biological methanation is relatively simpler, it is still at lab scale compared to chemical methanation, which is commercially developed and cheaper. Furthermore, the high temperature level of thermochemical methanation helps improves process efficiency. Thus, chemical methanation has been considered for this study.
3.3. Principal Scenarios
The study evaluates two main scenarios, those of a mid-scale 10 MW electrolyzer in 2023, and that of a large-scale 100 MW electrolyzer in 2030. Given the recent natural gas price shock in Europe, there is an imperative need to secure gas production. Thus, the first scenario considers the immediate startup of a mid-size (10 MW electrolyzer) PtG facility in Norway, which can export 33.2 GWhSNG/year of gas to European consumers. The second 2030 scenario estimates the future GPC for a large-scale PtG facility and determines long-term economic feasibility of this process. The main scenarios are listed in Table 2, and the key inputs and assumptions used for GPC calculation are listed in Table 3 below.
Table 2.
Principal scenarios considered in the analysis.
Table 3.
Key inputs used in estimation of GPC for PtG process.
Several studies have discussed historic as well as future cost trends in electrolysis technologies [38,39,54,55,56,57,58]. All of these establish that electrolysis, and in particular PEM, has a very high learning rate with costs dropping rapidly. Given the rapidly declining costs, CAPEX assumptions are based on the most recent LCOH analysis by the investment bank, Lazard, in order to be as close to market as possible [46]. The 2023 scenario considers the average price case for a mid-size (20 MW) PEM electrolyzer, with stack replacement costing 50% of the original stack price. The 2030 scenario for a large-scale (100 MW) PEM electrolyzer is based on estimates by Sterner et al. [15], with stack replacement costing 50% of original stack price. It is assumed that the costs of electrolyzer technologies will keep decreasing till they stabilize at <100 €/kWel as mentioned in Table 1. Lastly, it is assumed that research in PEM technologies will lead to a substantial increase in the total operating hours over the next decade.
The cost estimates for chemical me”hana’Ion units are based on an analysis by STORE&GO [45]. It suggests that small-scale catalytic reactors cost around 600 €/kWSNG, but can go down to 275 €/kWSNG in 2030 for a 25 MWSNG facility [45], which would correspond to a 100 MW electrolyzer plant.
Electricity is one of the major inputs in the PtG process, and SNG’s economic viability depends to a large part on the cost of electricity in Norway. In the short to mid-term, Norway’s electricity system operator, Statnett, predicts that average electricity prices in Norway are expected to increase due to increasing export capacity to Europe, where electricity prices would be impacted by the increased fuel and carbon prices. This is also expected to exacerbate the differences between pricing in the southern and northern regions of Norway in the mid-term, which could even out by 2040 as investments are made to improve grid capacity [50]. In the long-term, i.e., 2040+, increasing penetration of cheaper wind and solar would help lower the electricity pricing, though carbon and fuel prices will still continue to be key drivers [34].
The near-term pricing for electricity is based on latest available data (from July 2022) on electricity prices for energy-intensive manufacturing sectors on Norway’s official statistics website [48]. The mid-term 2030 price is based on estimates by Norway’s system operator, Statnett [50]. 2040+ prices are based on the low case estimated in an analysis on Norwegian long-term power prices by Jåstad et al. [34]. The price in 2035 is extrapolated, assuming a linear cost decline between 2030 and 2040.
Lastly, the significantly large portion of hydroelectricity in Norway’s energy mix ensures a continuous supply of low-carbon electricity. This is expected to result in continuous operation of the PtG system, where both electricity and natural gas is covered under long-term contracts [23]. The continuous operation mode would help lead to a significantly large utilization rate, assumed to be 90%, while also diminishing the need for gas storage facilities. Consequently, no CAPEX or OPEX has been assumed towards storage.
3.4. Sensitivity Analysis
A sensitivity analysis has been performed around key parameters to evaluate the impact of a step change of 10% in parameter value on GPC. Unless specified, a range of −20% to +20% variation in values of below parameters is analyzed:
- CAPEX: Both electrolyzers and methanation processes have high learning rates, due to which there is significant uncertainty in estimates of future equipment and construction pricing. Furthermore, it has a significant impact on GPC. CAPEX includes both the initial setup costs, as well as costs towards electrolyzer stack replacement.
- OPEX: The overall operating expenses are expected to decrease due to improving technology, but can also increase, depending on site-specific conditions, the labor market, land lease and other macroeconomic variables.
- Electricity Price: Electricity is the main energy input in the PtG process, and hence a key variable for the sensitivity analysis. Statnett’s long-term market analysis also states that Norway’s electricity pricing is expected to become more volatile over the coming years [50], which further highlights the necessity for a sensitivity analysis.
- Utilization Rate: The realized production of SNG is based on the overall utilization rate of the PtG facility, which can go up or down based on availability of electricity and system maintenance requirements. Since the base utilization rate is significantly high at 90%, a sensitivity range of only +10% to −20% is considered. The corresponding range of utilization rate is 72% to 99%.
- Discount Rate: The discount rate will be dependent on both market conditions and the individual investor. It is expected to be lower for state-owned utilities, and higher for private small companies. Additionally, a low interest rate regime is expected to decrease the discount rate. A sensitivity analysis has been carried out to isolate these impacts on GPC.
The price of CO2 is not considered in the sensitivity analysis since it is not the principal focus of this study. The STORE&GO study has estimated the cost to capture CO2 from various industrial and biogenic sources [36]. However, the actual cost incurred will depend on a mix of capture cost, transportation cost and regulatory policies. In Norway, industrial CO2 emitters need to pay the Norway carbon tax and EU ETS, resulting in ~110 €/ton of CO2 emitted [59]. Since emission tax price is higher than the cost to capture CO2, emitters in Norway might be willing to pay for capture and transportation. However, this needs to be analyzed on a case-by-case basis.
4. Results
4.1. 2023 Scenario
The GPC for SNG is estimated to be 141 €/MWhSNG for the 2023 scenario (Table 4, Figure 4a). Energy is the key cost contributor, making up around 60% of the total cost. CAPEX and OPEX are responsible for nearly 30% of the cost, and CO2 and transportation make up the last 10%.
Table 4.
Gas Production Cost for 2023 Scenario.
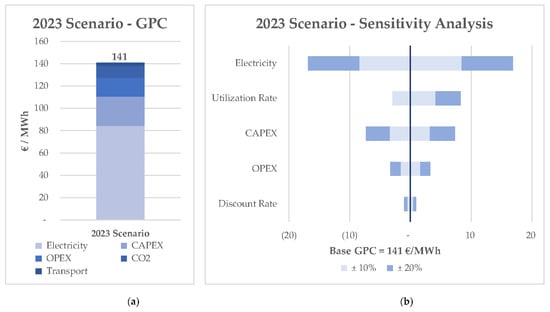
Figure 4.
Results for 2023 Scenario: (a) GPC buildup; (b) sensitivity analysis for various parameters, the values on y-axis represent change in GPC in €/MWhSNG for a 10–20% change in parameter values.
The sensitivity analysis (Figure 4b) finds that electricity price has the highest impact on GPC, which is expected given its substantial share in overall costs. A 10% change in electricity price impacts the GPC by 8 €/MWhSNG. Utilization Rate and CAPEX are the next most impactful parameters, where a 10% variation leads to a ~4 €/MWhSNG change in GPC. However, there is limited scope for increase in utilization rate since it is already at 90%. OPEX and the discount rate are the least important amongst all the studied variables, affecting the GPC by less than 2 €/MWhSNG for a 10% change.
4.2. 2030 Scenario
The GPC for the large-scale 2030 scenario is estimated to be 108 €/MWhSNG. The nearly 25% reduction from 2023 GPC is attributable to decline in costs for electricity (Figure 5), CAPEX and OPEX. Even though electricity costs decline on an absolute basis, its overall share in the total costs is predicted to increase to 63%. This is likely due to the relatively higher learning rates of electrolysis and methanation, which reduces CAPEX and OPEX more significantly as compared to the drop in electricity prices. Subsequently, the contribution of CAPEX and OPEX reduces to only 25%, while the share of CO2 and pipeline transportation costs increases to 12%. (Table 5 and Figure 6a)
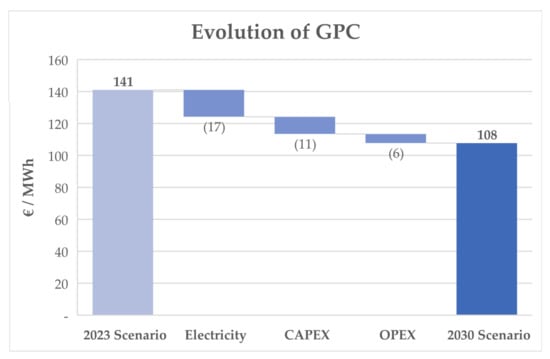
Figure 5.
Waterfall diagram highlighting main cost updates between 2023 and 2030 scenarios. On a levelized basis, decline in electricity costs lead to the largest decline of 17 €/MWh, followed by CAPEX reductions of 11 €/MWh and OPEX reductions of 6 €/MWh.
Table 5.
Gas Production Cost for 2030 Scenario.
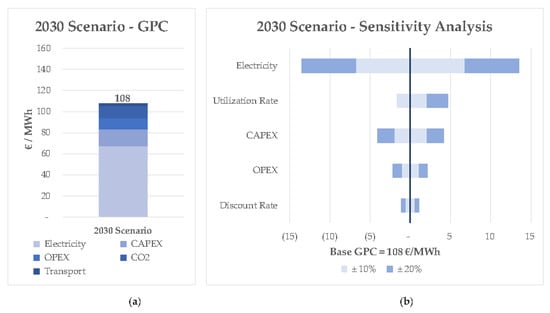
Figure 6.
Results for 2030 Scenario: (a) GPC buildup; (b) sensitivity analysis for various parameters, the values on y-axis represent change in GPC in €/MWhSNG for a 10–20% change in parameter values.
The parameter sensitivity (Figure 6b) follows a similar pattern as the 2023 scenario, though the volatility in GPC is lower due to a decline in the total cost. A 10% change in electricity price impacts the GPC by 7 €/MWhSNG. Additionally, a 10% variation in utilization rate and CAPEX changes GPC by 2 €/MWhSNG, while the same change in OPEX and discount factor only impacts the GPC by 1 €/MWhSNG. It is interesting to note that the impact of CAPEX and OPEX is halved compared to the 2023 scenario due to high technology learning rates. Furthermore, a 12% reduction in electricity costs is required to achieve a GPC of less than 100 €/MWhSNG.
5. Discussion
The disruption in Russian natural gas supplies led to unprecedented gas prices in Europe (TTF prices), averaging above 100 €/MWh in Q1 and Q2 of 2022 [60,61]. The average TTF price further increased to 185 €/MWh in Q3-2022, touching an all-time high of 340 €/MWh on 26 August 2022 following Gazprom’s announcement of unplanned maintenance on the Nord Stream pipeline system [62]. The soaring gas prices have also led to a steep decline in fertilizer production, which is expected to accelerate food inflation [63]. While the TTF price is unlikely to stay at such high levels in the coming months as LNG imports replace Russian gas [64], geopolitical and meteorological uncertainty could still drive high price volatility. Furthermore, countries in central and eastern Europe lacking regasification facilities, which are necessary to import LNG, will still need to pay an additional premium over TTF prices [62].
Amidst this backdrop, the proposed PtG system could be a reliable source of “clean” natural gas. The estimated GPC for the 2023 scenario, 141 €/MWh, is well below the Q3-2022 average price and could make economic sense for industries in central Europe seeking a reliable and carbon-neutral source of fuel. The decline in electricity and equipment costs is expected to further lower the GPC to 108 €/MWh for a large scale PtG facility in Norway by 2030.
The result is aligned with previously conducted studies. Data from the pilot plants under STORE&GO project suggest that cost to produce SNG from the grid in 2030 will vary between 90–125 €/MWh depending on taxes, charges and network tariffs [65]. Bohm et al. [20] determined that large scale PtG plants will be able to reach production costs of 100 €/MWh by 2030 over a broad range of operating hours based on an optimized electricity purchasing strategy. Gorre et al. [23] estimate a GPC of 119 €/MWh for an average electricity price of 50 €/MWhel. Jiang et al. [28] estimate a GPC of 118 €/MWh for operations in Northwestern China.
However, this steep reduction in SNG prices might still not be sufficient. In the long term, European gas prices are likely to trend towards prices of imported US LNG, which have varied between 15–30 €/MWh prior to COVID [66]. Assuming that the nominal US LNG prices reach 20–40 €/MWh based on an average inflation of 2.5%, SNG at 103 €/MWh will be much more expensive and economically unfeasible. A study by Guilera et al. suggests that in a feasible future scenario, SNG can be produced for just 40 €/MWh in countries such as Germany and Spain [67]. Section 5 lists potential areas of future research which could help reduce SNG prices even further. A similar or even lower cost might be feasible for SNG production in Norway, making it competitive with US LNG and paving the path for large-scale deployment of PtG facilities.
6. Conclusions
The study concludes that high natural gas prices in Europe due to recent geopolitical issues make it economically attractive to produce SNG using PEM electrolysis and chemical methanation in Norway. This could help attract investment from industry to further develop PtG technology and reduce associated costs.
In the mid- to long term, lower SNG production costs will be needed to compete with natural gas prices. Future studies could explore dedicated wind/solar energy facilities in Norway to feed the PtG system. Given the steep decline anticipated in renewable costs [68], a dedicated plant could reduce electricity price significantly. However, the intermittency of renewable generation will reduce utilization rate and could necessitate additional investment to store hydrogen and natural gas. The design and location of PtG systems will have to be optimized to achieve lowest GPC.
Additionally, PtG systems present additional monetization opportunities through oxygen generated during electrolysis and the high temperature heat generated during catalytic methanation. These could effectively lower the GPC.
Lastly, regulatory support could be a significant driver of reduction in GPC. There is a significant global impetus on transitioning to a hydrogen-based economy and more than 30 major countries, including Norway, have announced commitments to developing their local hydrogen production [41]. Additional support for generating hydrogen through investment grants and production credits could help scale SNG production in Norway. Furthermore, credits for using low-carbon fuel could make SNG competitive. SNG production in Norway is expected to generate carbon-neutral methane, avoiding release of ~189 kg of CO2 per MWh of natural gas. Thus, a credit of 100 €/ton of CO2 avoided could lower GPC by 19 €/MWh.
Given the EU’s strong focus on securing clean and affordable energy, enabling policies such as the ones discussed above could make SNG more competitive as compared to imported LNG.
Funding
This research received no external funding.
Institutional Review Board Statement
Not applicable.
Informed Consent Statement
Not applicable.
Data Availability Statement
Not applicable.
Conflicts of Interest
The authors report no conflict of interest.
References
- Hall, S. 3 Charts that Show the State of Europe’s Energy Crisis Right Now. Available online: https://www.weforum.org/agenda/2022/10/europe-energy-crisis-gas-report-iea/ (accessed on 27 October 2022).
- Eurostat Shedding Light on Energy in the EU: Where Does Our Energy Come from? Available online: https://ec.europa.eu/eurostat/cache/infographs/energy/bloc-2a.html (accessed on 27 October 2022).
- Eurostat Shedding Light on Energy in the EU: From Where Do We Import Energy? Available online: https://ec.europa.eu/eurostat/cache/infographs/energy/bloc-2c.html (accessed on 27 October 2022).
- Trading Economics EU Natural Gas—2022 Data. Available online: https://tradingeconomics.com/commodity/eu-natural-gas (accessed on 27 October 2022).
- European Commission REPowerEU: Affordable, Secure and Sustainable Energy for Europe. Available online: https://ec.europa.eu/info/strategy/priorities-2019-2024/european-green-deal/repowereu-affordable-secure-and-sustainable-energy-europe_en (accessed on 20 October 2022).
- Delivering the European Green Deal. Available online: https://ec.europa.eu/info/strategy/priorities-2019-2024/european-green-deal/delivering-european-green-deal_en (accessed on 27 October 2022).
- Miranda, P.E. (Ed.) Application of Hydrogen by Use of Chemical Reactions of Hydrogen and Carbon Dioxide. In Science and Engineering of Hydrogen-Based Energy Technologies; Academic Press: Cambridge, MA, USA, 2019; Chapter 5.3.3; pp. 279–289. ISBN 978-0-12-814251-6. [Google Scholar]
- Wai, S.; Ota, Y.; Sugiyama, M.; Nishioka, K. Evaluation of a Sabatier Reaction Utilizing Hydrogen Produced by Concentrator Photovoltaic Modules under Outdoor Conditions. Appl. Sci. 2020, 10, 3144. [Google Scholar] [CrossRef]
- Maroufmashat, A.; Fowler, M. Transition of Future Energy System Infrastructure; through Power-to-Gas Pathways. Energies 2017, 10, 1089. [Google Scholar] [CrossRef]
- Wang, A.; van der Leun, K.; Peters, D.; Buseman, M. European Hydrogen Backbone: How a Dedicated Infrastructure Can Be Created; Guidehouse: Chicago, IL, USA, 2020. [Google Scholar]
- ACER. Transporting Pure Hydrogen by Repurposing Existing Gas Infrastructure: Overview of Existing Studies and Reflections on the Conditions of Repurposing; European Union Agency for the Cooperation of Energy Regulators (ACER): Ljubljana, Slovenia, 2021; p. 23. [Google Scholar]
- Agora Energiewende; AFRY Management Consulting. No-Regret Hydrogen: Charting Early Steps for H₂ Infrastructure in Europe; Agora: Baltimore, MD, USA, 2021; p. 92. [Google Scholar]
- IEA Evolution of Key Regional Natural Gas Prices, June 2021–October 2022. Available online: https://www.iea.org/topics/global-energy-crisis (accessed on 27 October 2022).
- Sterner, M. Bioenergy and Renewable Power Methane in Integrated 100% Renewable Energy Systems. Limiting Global Warming by Transforming Energy Systems; Kassel University Press GmbH: Kassel, Germany, 2009; ISBN 978-3-89958-799-9. [Google Scholar]
- Sterner, M.; Specht, M. Power-to-Gas and Power-to-X—The History and Results of Developing a New Storage Concept. Energies 2021, 14, 6594. [Google Scholar] [CrossRef]
- European Union HELMETH Project. Available online: http://www.helmeth.eu/ (accessed on 28 October 2022).
- European Union STORE&GO. Available online: https://www.storeandgo.info/ (accessed on 28 October 2022).
- Thema, M.; Bauer, F.; Sterner, M. Power-to-Gas: Electrolysis and methanation status review. Renew. Sustain. Energy Rev. 2019, 112, 775–787. [Google Scholar] [CrossRef]
- Blanco, H. Impact Analysis and Scenarios Design. Available online: https://www.storeandgo.info/fileadmin/downloads/deliverables_2020/Update/2018-05-29_STOREandGO_D6.3_RUG_accepted.pdf (accessed on 25 October 2022).
- Böhm, H.; Zauner, A.; Rosenfeld, D.C.; Tichler, R. Projecting cost development for future large-scale power-to-gas implementations by scaling effects. Appl. Energy 2020, 264, 114780. [Google Scholar] [CrossRef]
- Hoffman, M. Report on Economic Analysis of Test Cases. Available online: https://www.storeandgo.info/fileadmin/downloads/deliverables_2020/20200713-STOREandGO_D5.10_DBI_Report_on_economic_analysis_of_test_cases.pdf (accessed on 27 October 2022).
- Böhm, H.; Goers, S.; Zauner, A. Estimating future costs of power-to-gas – a component-based approach for technological learning. Int. J. Hydrogen Energy 2019, 44, 30789–30805. [Google Scholar] [CrossRef]
- Gorre, J.; Ortloff, F.; van Leeuwen, C. Production costs for synthetic methane in 2030 and 2050 of an optimized Power-to-Gas plant with intermediate hydrogen storage. Appl. Energy 2019, 253, 113594. [Google Scholar] [CrossRef]
- Agora Verkehrswende; Agora Energiewende and Frontier Economics. The Future Cost of Electricity-Based Synthetic Fuels; Agora: Baltimore, MD, USA, 2018; p. 96. [Google Scholar]
- Gorre, J.; Ruoss, F.; Karjunen, H.; Schaffert, J.; Tynjälä, T. Cost benefits of optimizing hydrogen storage and methanation capacities for Power-to-Gas plants in dynamic operation. Appl. Energy 2020, 257, 113967. [Google Scholar] [CrossRef]
- Ipsakis, D.; Varvoutis, G.; Lambropoulos, A.; Mandela, E.; Papaefthimiou, S.; Marnellos, G.E.; Konsolakis, M. A Circular Approach to Upgrade Cement-based CO2 and Renewable H2: Techno-economic Analysis of SNG Production. Chem. Eng. Trans. 2021, 88, 673–678. [Google Scholar] [CrossRef]
- Van Leeuwen, C.; Mulder, M. Power-to-gas in electricity markets dominated by renewables. Appl. Energy 2018, 232, 258–272. [Google Scholar] [CrossRef]
- Jiang, W.; Zhao, S.; Yang, T. Economic and Technical Analysis of Power to Gas Factory Taking Karamay as an Example. Sustainability 2022, 14, 5929. [Google Scholar] [CrossRef]
- Dominguez-Gonzalez, G.; Muñoz-Hernandez, J.I.; Bunn, D.; Garcia-Checa, C.J. Integration of Hydrogen and Synthetic Natural Gas within Legacy Power Generation Facilities. Energies 2022, 15, 4485. [Google Scholar] [CrossRef]
- BloombergNEF. Wind and Solar Corporate PPA Prices Rise Up To 16.7% Across Europe. Available online: https://about.bnef.com/blog/wind-and-solar-corporate-ppa-prices-rise-up-to-16-7-across-europe/ (accessed on 27 October 2022).
- IEA. Norway 2022: Energy Policy Review; IEA: Paris, France, 2022. [Google Scholar]
- NVE. Langsiktig Kraftmarkedsanalyse 2021–2040; NVE: Eden Prairie, MN, USA, 2021. [Google Scholar]
- Nowtricity. Available online: https://www.nowtricity.com/ (accessed on 27 October 2022).
- Jåstad, E.O.; Trotter, I.M.; Bolkesjø, T.F. Long term power prices and renewable energy market values in Norway—A probabilistic approach. Energy Econ. 2022, 112, 106182. [Google Scholar] [CrossRef]
- US Department of Energy. Levelized Cost of Energy (LCOE). Available online: https://www.energy.gov/sites/prod/files/2015/08/f25/LCOE.pdf/ (accessed on 25 October 2022).
- Van Leeuwen, C.; Zauner, A. Report on the Costs Involved with PtG Technologies and Their Potentials Across the EU. Available online: https://www.storeandgo.info/fileadmin/downloads/deliverables_2020/Update/20180424_STOREandGO_D8.3_RUG_accepted.pdf/ (accessed on 27 October 2022).
- L’Huby, T.; Gahlot, P.; Debarre, R. Hydrogen Applications and Business Models; Kearney Energy Transition Institute: Paris, France, 2020. [Google Scholar]
- Reksten, A.H.; Thomassen, M.S.; Møller-Holst, S.; Sundseth, K. Projecting the future cost of PEM and alkaline water electrolysers; a CAPEX model including electrolyser plant size and technology development. Int. J. Hydrogen Energy 2022, 47, 38106–38113. [Google Scholar] [CrossRef]
- Holst, M.; Aschbrenner, S.; Smolinka, T.; Voglstatter, C.; Grimm, G. Cost Forecast for Low-Temperature Electrolysis—Technology Driven Bottom-Up Prognosis for PEM and Alkaline Water Electrolysis Systems; Fraunhofer Institute for Solar Energy Systems ISE: Freiburg im Breisgau, Germany, 2021. [Google Scholar]
- Between Two Stacks: How a PEM Electrolyzer is More Cost-Effective Than an Alkaline Electrolyzer—Plug Power. Available online: https://www.plugpower.com/between-two-stacks-how-a-pem-electrolyzer-is-more-cost-effective-than-an-alkaline-electrolyzer/ (accessed on 2 November 2022).
- Agarwal, R. Transition to a Hydrogen-Based Economy: Possibilities and Challenges. Sustainability 2022, 14, 15975. [Google Scholar] [CrossRef]
- Thema, M.; Weidlich, T.; Hörl, M.; Bellack, A.; Mörs, F.; Hackl, F.; Kohlmayer, M.; Gleich, J.; Stabenau, C.; Trabold, T.; et al. Biological CO2-Methanation: An Approach to Standardization. Energies 2019, 12, 1670. [Google Scholar] [CrossRef]
- Götz, M.; Lefebvre, J.; Mörs, F.; McDaniel Koch, A.; Graf, F.; Bajohr, S.; Reimert, R.; Kolb, T. Renewable Power-to-Gas: A technological and economic review. Renew. Energy 2016, 85, 1371–1390. [Google Scholar] [CrossRef]
- Frontera, P.; Macario, A.; Ferraro, M.; Antonucci, P. Supported Catalysts for CO2 Methanation: A Review. Catalysts 2017, 7, 59. [Google Scholar] [CrossRef]
- Zauner, A.; Bohm, H.; Rosenfeld, D.C.; Tichler, R. Analysis on Future Technology Options and on Techno-Economic Optimization; Store&Go: Kassel, Germany, 2019. [Google Scholar]
- Lazard’s Levelized Cost of Hydrogen Analysis. 2021. Available online: https://www.lazard.com/media/451779/lazards-levelized-cost-of-hydrogen-analysis-vf.pdf (accessed on 1 November 2022).
- DeSantis, D.; James, B.D.; Houchins, C.; Saur, G.; Lyubovsky, M. Cost of long-distance energy transmission by different carriers. iScience 2021, 24, 103495. [Google Scholar] [CrossRef]
- Statistics Norway Electricity Prices August 2022. Available online: https://www.ssb.no/en/energi-og-industri/energi/statistikk/elektrisitetspriser (accessed on 1 November 2022).
- Statnett Long-Term Market Analysis. Available online: https://www.statnett.no/en/for-stakeholders-in-the-power-industry/our-analyses-and-assessments/long-term-market-analysis/ (accessed on 1 November 2022).
- Statnett. Long-term Market Analysis 2020–2050, Update Spring 20221; Statnett: Oslo, Norway, 2021. [Google Scholar]
- PEM Electrolyzer ME450: H-TEC SYSTEMS Products. Available online: https://www.h-tec.com/en/products/detail/h-tec-pem-electrolyser-me450/me450/ (accessed on 1 November 2022).
- Frank, E.; Gorre, J.; Ruoss, F.; Friedl, M.J. Calculation and analysis of efficiencies and annual performances of Power-to-Gas systems. Appl. Energy 2018, 218, 217–231. [Google Scholar] [CrossRef]
- Finbox WACC for Equinor ASA (DNQ). Available online: https://finbox.com/DB:DNQ/explorer/wacc (accessed on 1 November 2022).
- Bohm, H.; Zauner, A.; Goers, S.; Tichler, R.; Kroon, P. Report on Experience Curves and Economies of Scale. Available online: https://www.storeandgo.info/fileadmin/downloads/deliverables_2020/Update/20181031_STOREandGO_D7.5_EIL_accepted.pdf (accessed on 25 October 2022).
- Schoots, K.; Ferioli, F.; Kramer, G.J.; van der Zwaan, B.C.C. Learning curves for hydrogen production technology: An assessment of observed cost reductions. Int. J. Hydrogen Energy 2008, 33, 2630–2645. [Google Scholar] [CrossRef]
- Bristowe, G.; Smallbone, A. The Key Techno-Economic and Manufacturing Drivers for Reducing the Cost of Power-to-Gas and a Hydrogen-Enabled Energy System. Hydrogen 2021, 2, 273–300. [Google Scholar] [CrossRef]
- Saba, S.M.; Müller, M.; Robinius, M.; Stolten, D. The investment costs of electrolysis—A comparison of cost studies from the past 30 years. Int. J. Hydrogen Energy 2018, 43, 1209–1223. [Google Scholar] [CrossRef]
- Luo, Z.; Hu, Y.; Xu, H.; Gao, D.; Li, W. Cost-Economic Analysis of Hydrogen for China’s Fuel Cell Transportation Field. Energies 2020, 13, 6522. [Google Scholar] [CrossRef]
- Norwegian Petroleum Emissions to Air. Available online: https://www.norskpetroleum.no/en/environment-and-technology/emissions-to-air/ (accessed on 1 November 2022).
- IEA. Gas Market Report, Q2-2022; OECD: Paris, France, 2022. [Google Scholar]
- IEA. Gas Market Report, Q3-2022; OECD: Paris, France, 2022. [Google Scholar]
- IEA. Gas Market Report Q4-2022; OECD: Paris, France, 2022. [Google Scholar]
- Gebre, S.; Elkin, E. Europe’s Deepening Fertilizer Crunch Threatens Food Crisis. Available online: https://www.bloomberg.com/news/articles/2022-08-26/europe-s-fertilizer-crisis-deepens-with-70-of-capacity-hit#:~:text=Europe's%20fertilizer%20crunch%20is%20deepening,is%20hurting%20industries%20across%20Europe (accessed on 3 November 2022).
- Amaro, S. Goldman Sachs Expects European Natural Gas Prices to Tumble 30% in the Coming Months. Available online: https://www.cnbc.com/2022/11/02/goldman-sachs-expects-european-gas-prices-to-tumble-30percent.html (accessed on 3 November 2022).
- Schlautmann, R.; Böhm, H.; Zauner, A.; Mörs, F.; Tichler, R.; Graf, F.; Kolb, T. Renewable Power-to-Gas: A Technical and Economic Evaluation of Three Demo Sites Within the STORE&GO Project. Chem. Ing. Tech. 2021, 93, 568–579. [Google Scholar] [CrossRef]
- Tsafos, N. How Much Does U.S. LNG Cost in Europe? Available online: https://www.csis.org/blogs/energy-headlines-versus-trendlines/how-much-does-us-lng-cost-europe (accessed on 3 November 2022).
- Guilera, J.; Ramon Morante, J.; Andreu, T. Economic viability of SNG production from power and CO2. Energy Convers. Manag. 2018, 162, 218–224. [Google Scholar] [CrossRef]
- Wiser, R.; Rand, J.; Seel, J.; Beiter, P.; Baker, E.; Lantz, E.; Gilman, P. Expert elicitation survey predicts 37% to 49% declines in wind energy costs by 2050. Nat. Energy 2021, 6, 555–565. [Google Scholar] [CrossRef]


Publisher’s Note: MDPI stays neutral with regard to jurisdictional claims in published maps and institutional affiliations. |
© 2022 by the author. Licensee MDPI, Basel, Switzerland. This article is an open access article distributed under the terms and conditions of the Creative Commons Attribution (CC BY) license (https://creativecommons.org/licenses/by/4.0/).