

Spatial–Temporal Characteristics of Freezing/Thawing Index and Permafrost Distribution in Heilongjiang Province, China
Abstract
:1. Introduction
2. Data and Methods
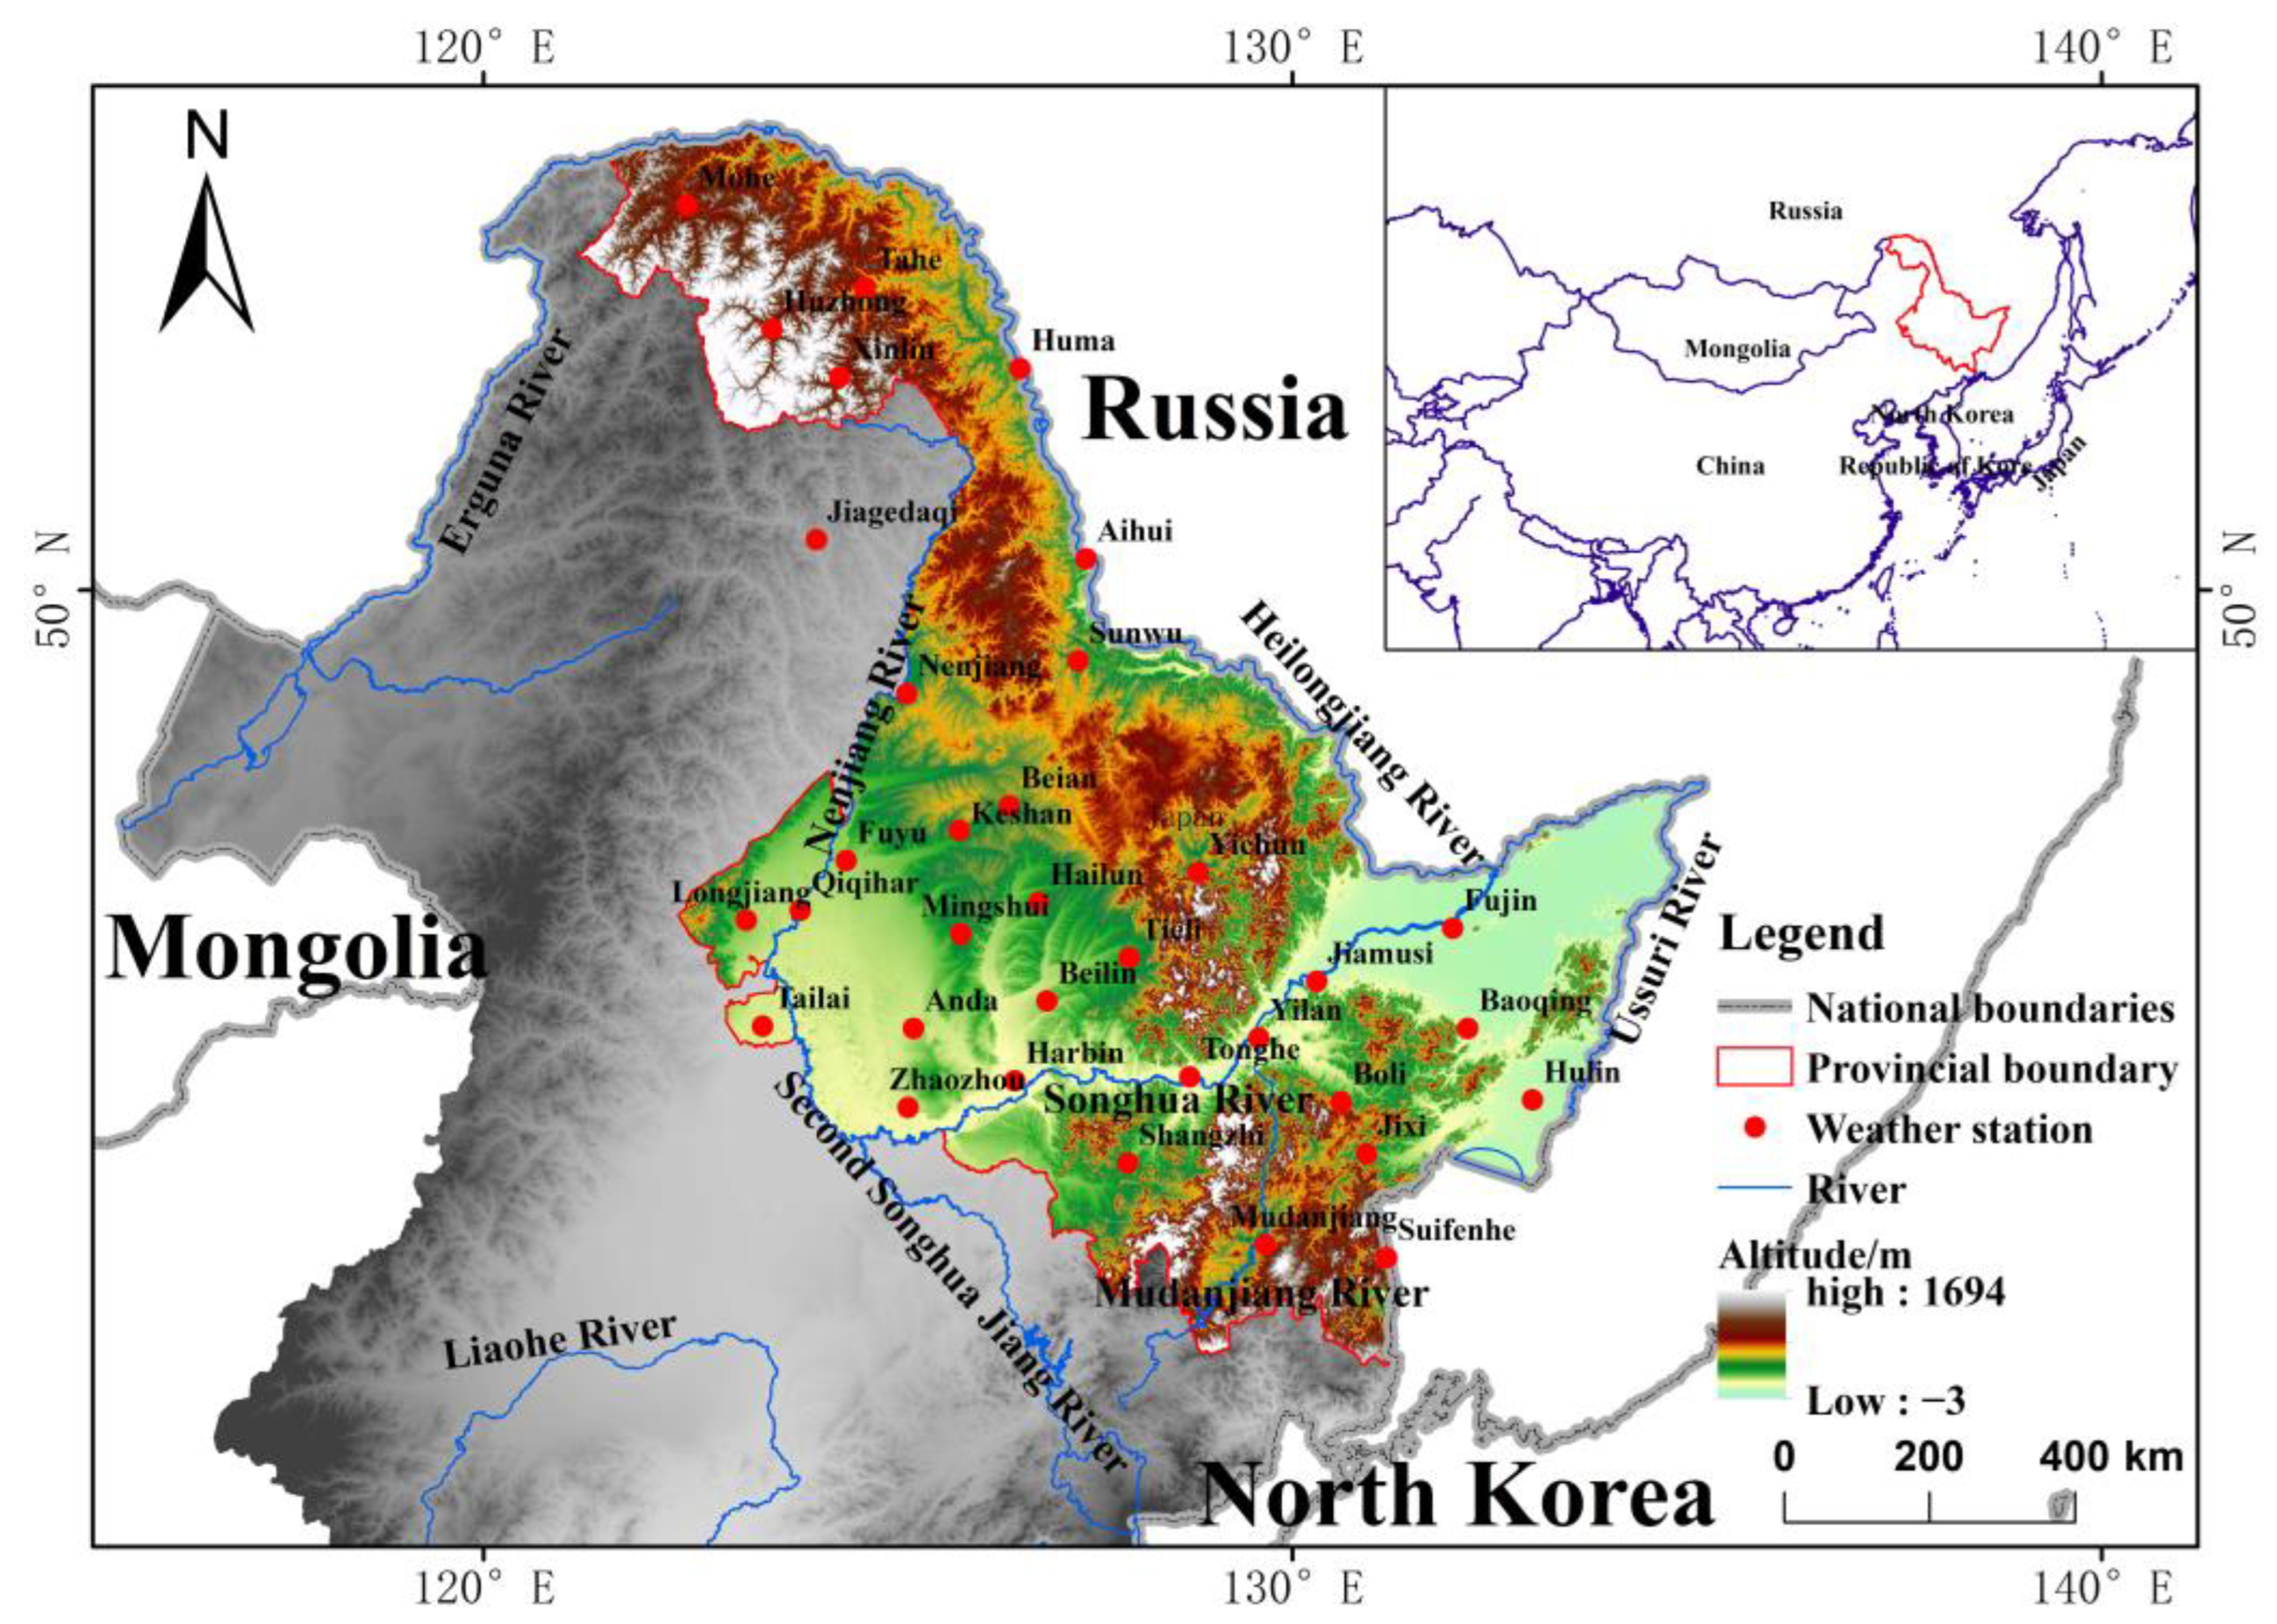
2.1. Study Area
2.2. Data Sources
- A single day of missing measurement: interpolate the missing data with the mean of the data for the days before and after the day of missing measurement.
- Two consecutive days of missing measurements: the means of the data for the two days before the first day of missing measurements and of the data for the two days after the second day of missing measurements are interpolated.
- Missing measurements for more than two consecutive days: The double cumulative curve method is often used to check the consistency of hydro-meteorological elements and to interpolate missing values or to correct information.
2.3. Research Methods
2.3.1. Computation of the Freezing/Thawing Index
2.3.2. Surface Freezing Index Model
2.3.3. Analysis Methods
3. Results
3.1. Spatial and Temporal Characteristics of MAAT and MAGST
3.2. Temporal Variation Characteristics of the Freezing/Thawing Index
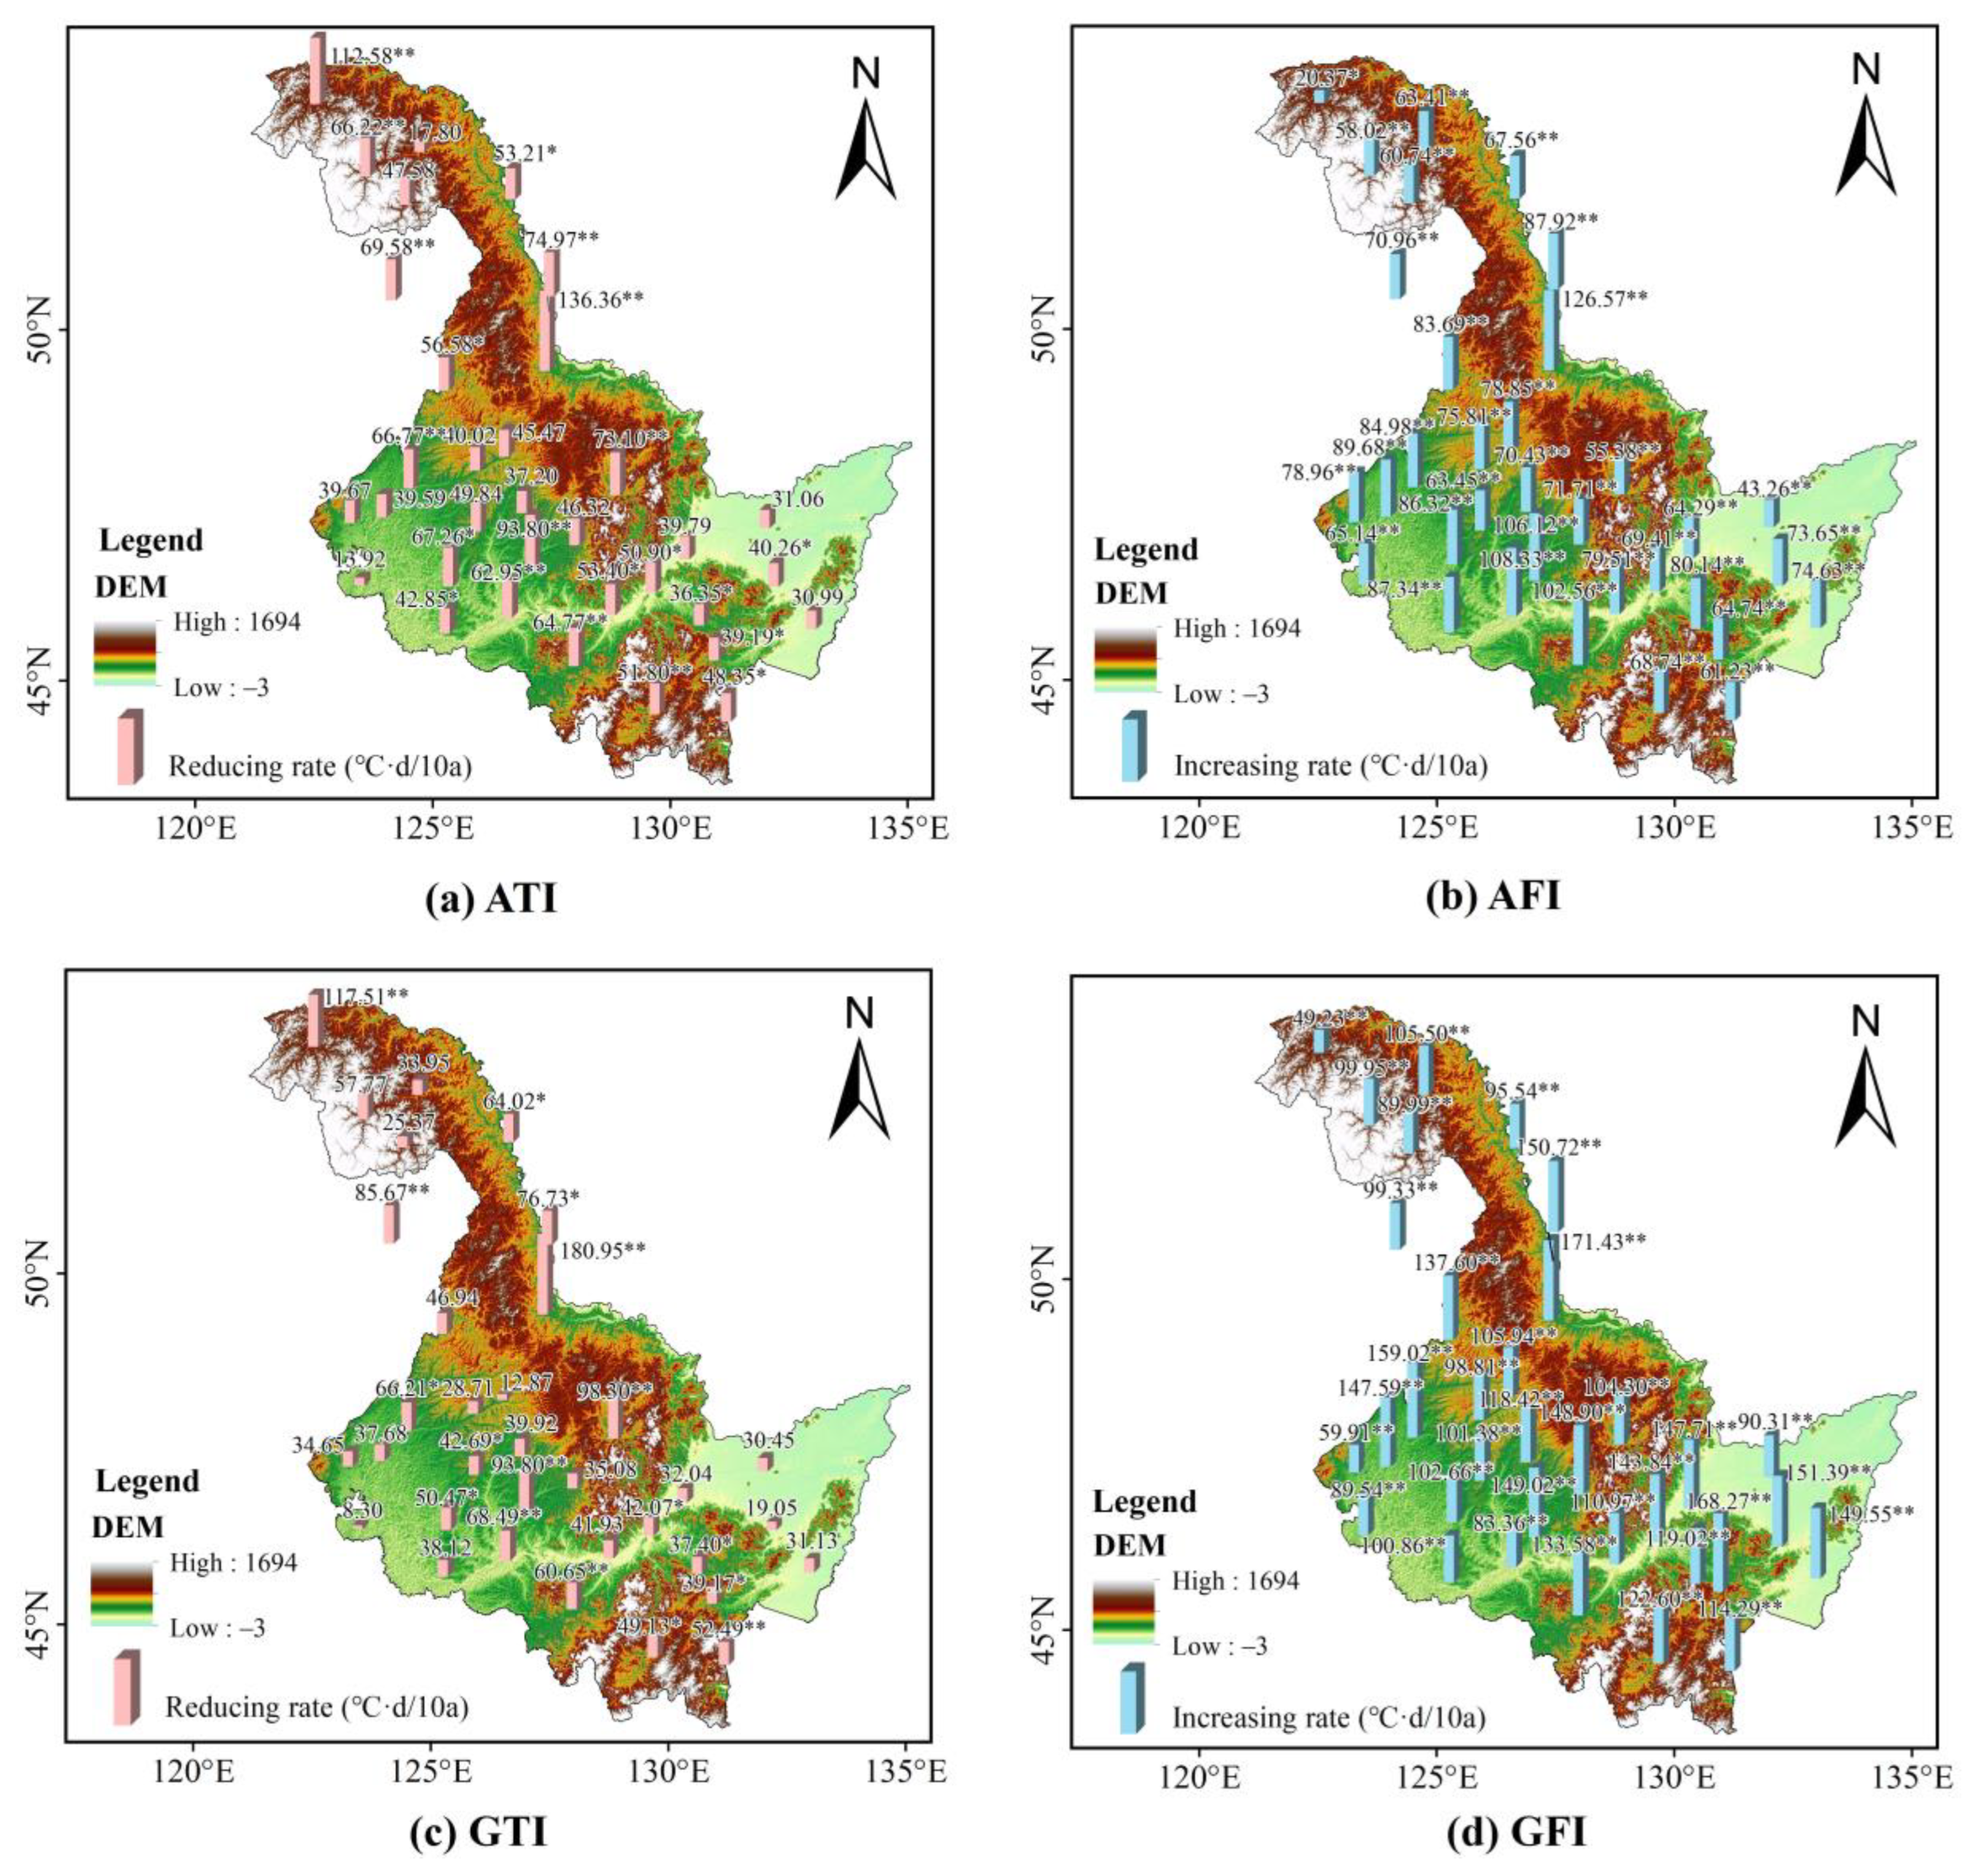
3.3. Spatial Variation Characteristics of the Freezing/Thawing Index
4. Discussions
4.1. Correlation between Freezing/Thawing Index and MAAT
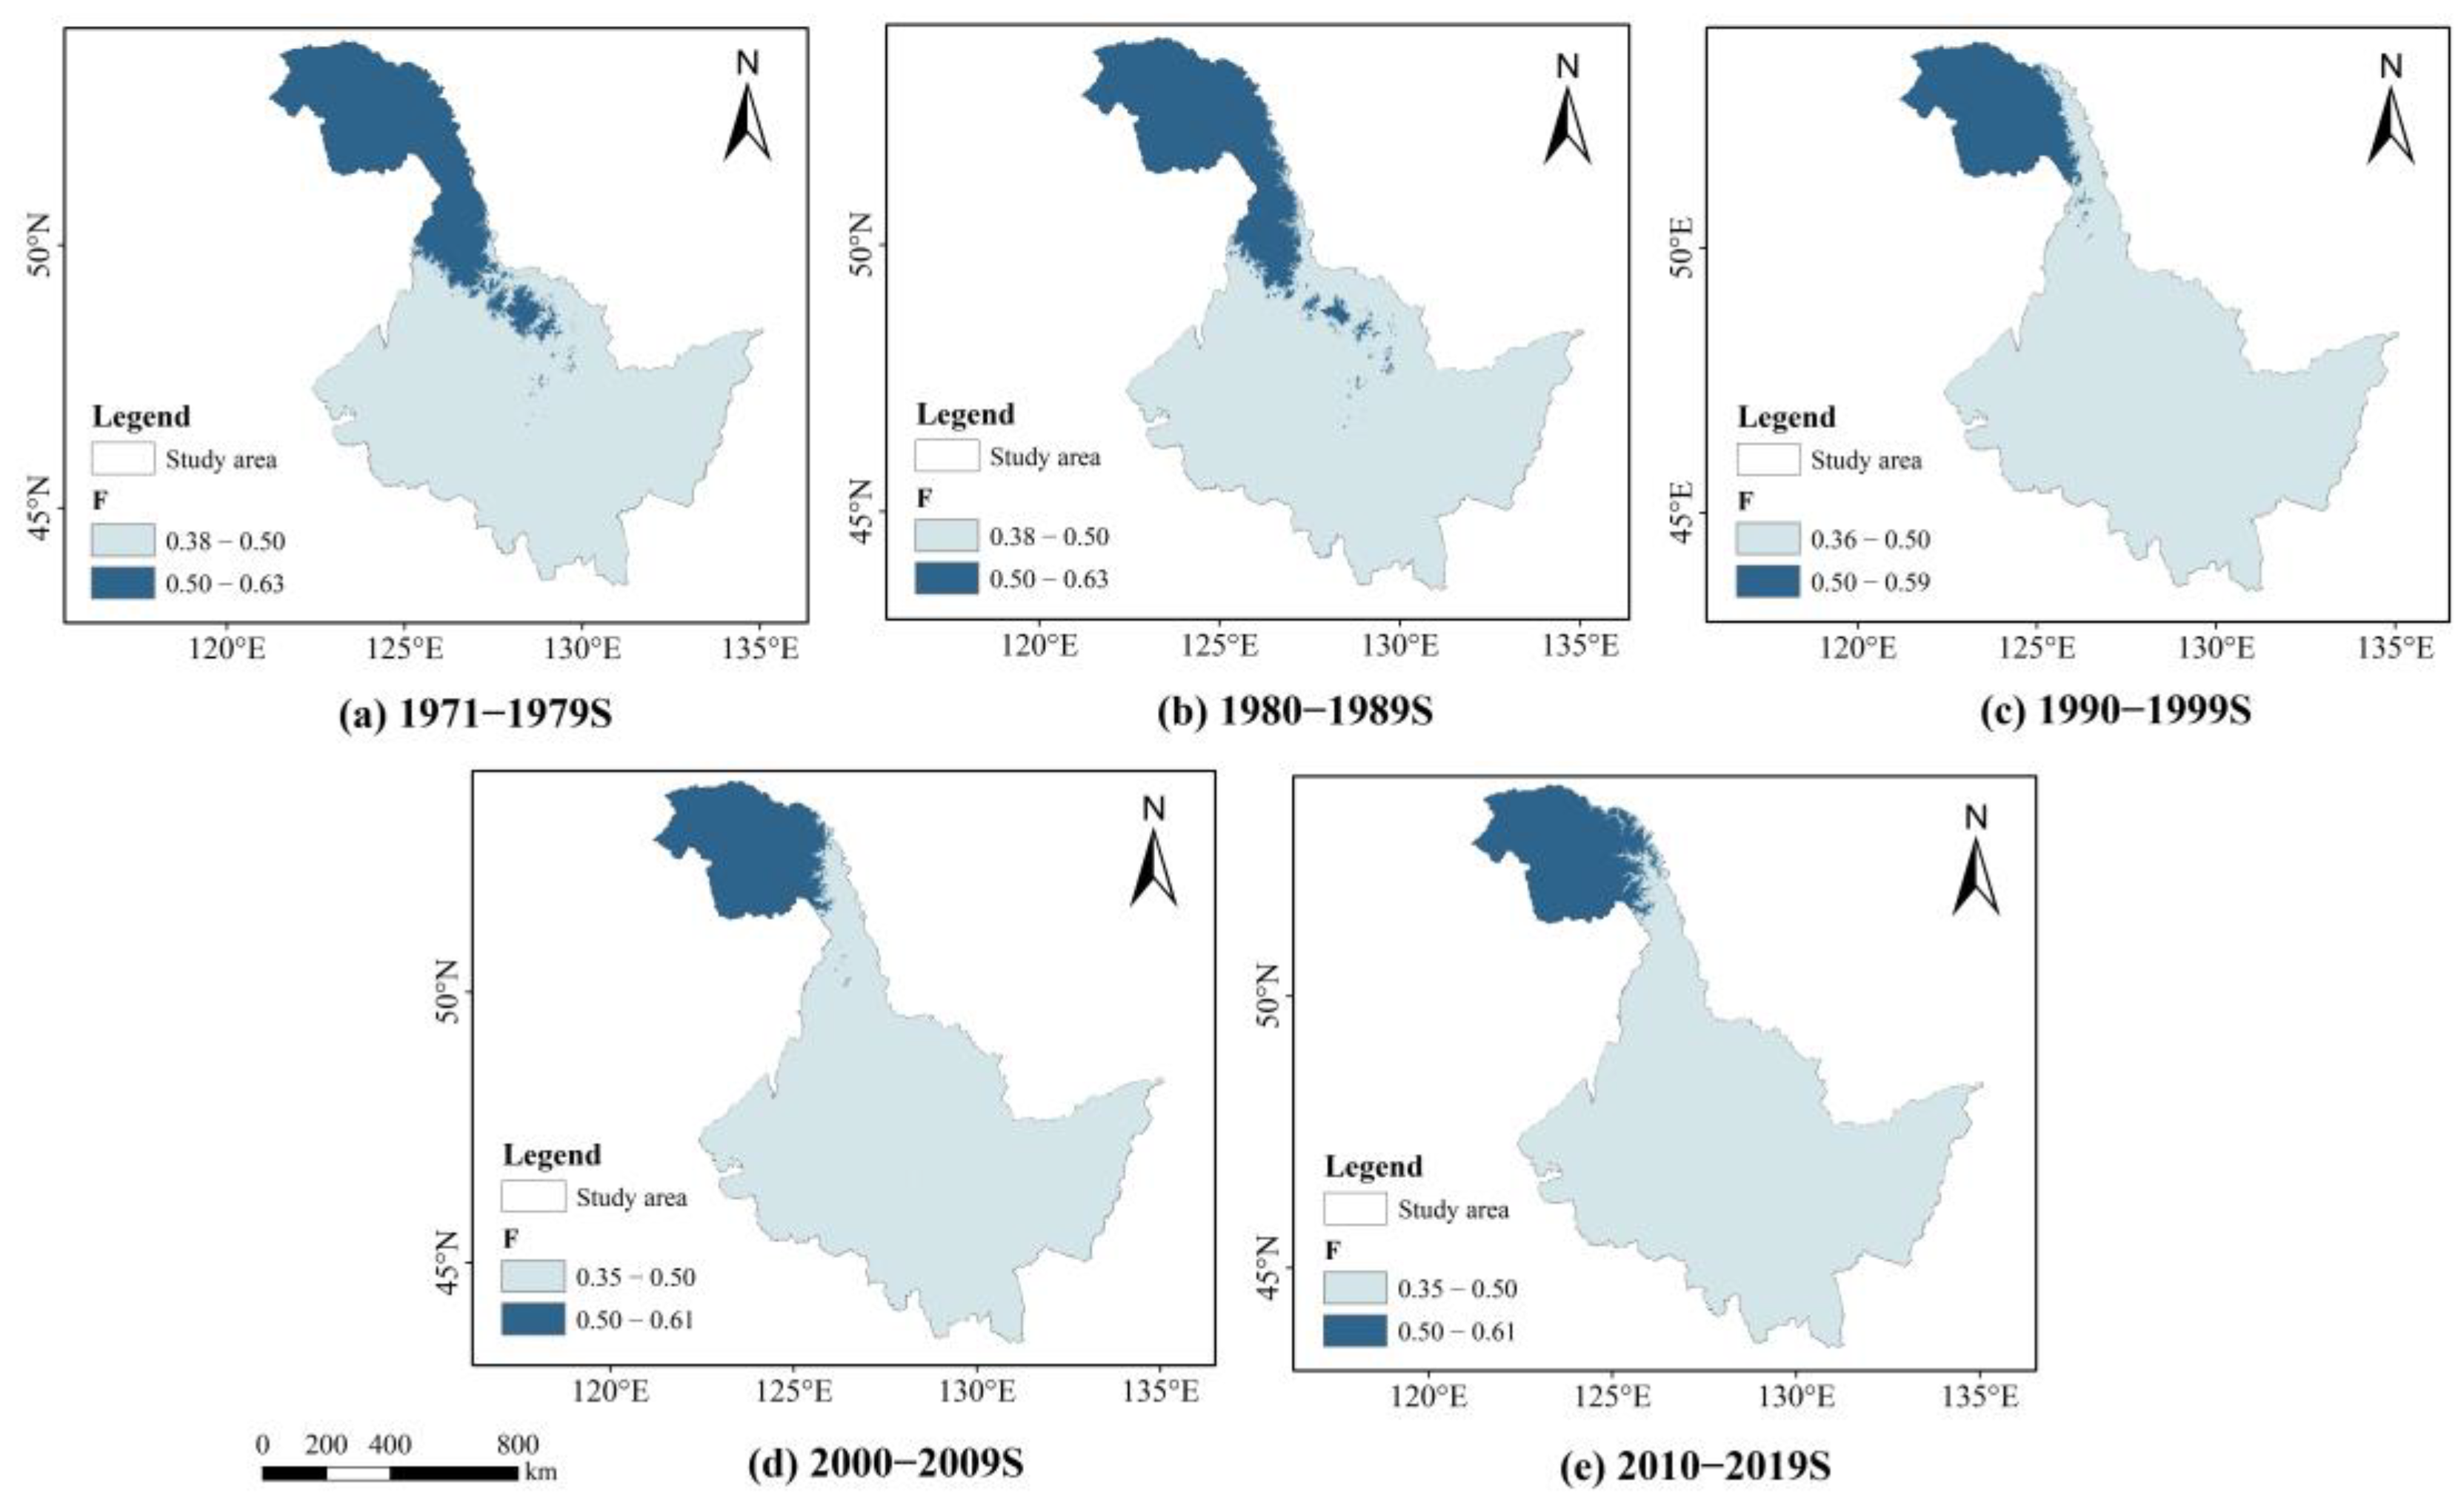
4.2. Changes in the Distribution of Frozen Soil Based on the Surface Freezing Index Model
5. Conclusions
- The spatial distribution of MAAT and MAGST in Heilongjiang Province shows a decreasing trend with the increase of the latitude and altitude; the MAAT in Heilongjiang Province is higher than the MAGST, and they all tend to be on an upward trend, with a range of −8.64–5.60 °C for the multiyear MAAT and of −6.52–7.58 °C for the multiyear MAGST.
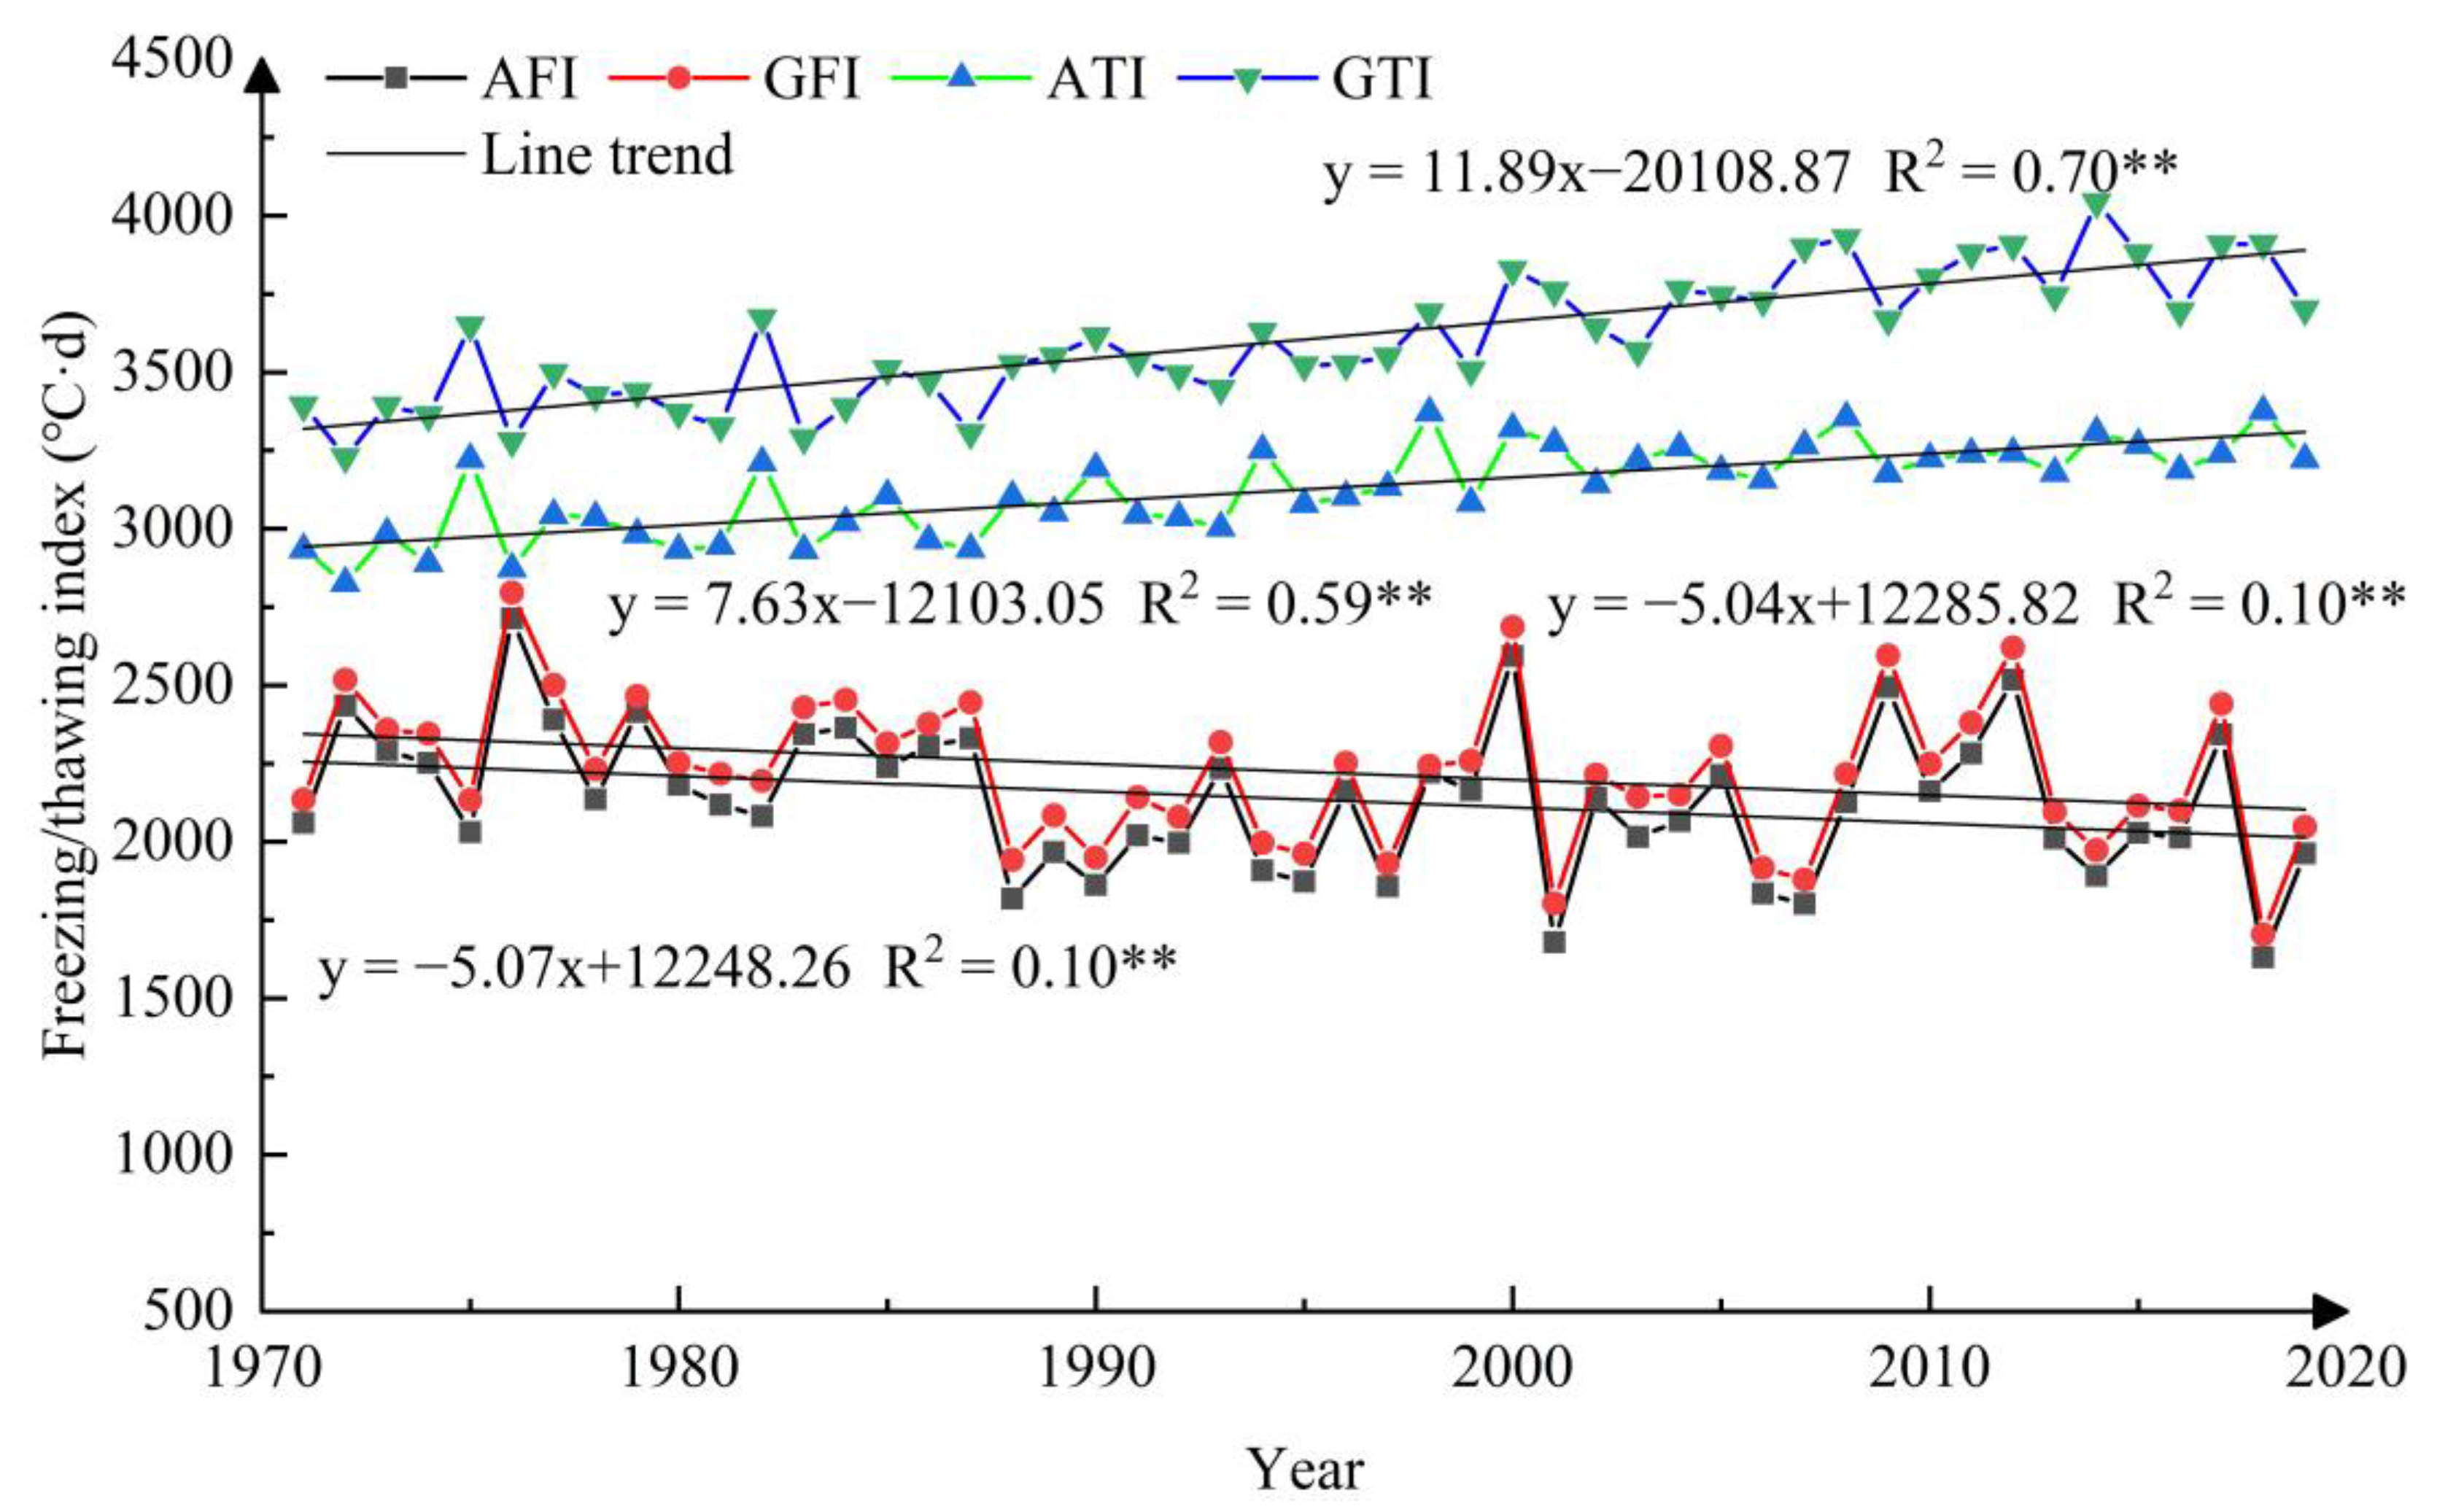
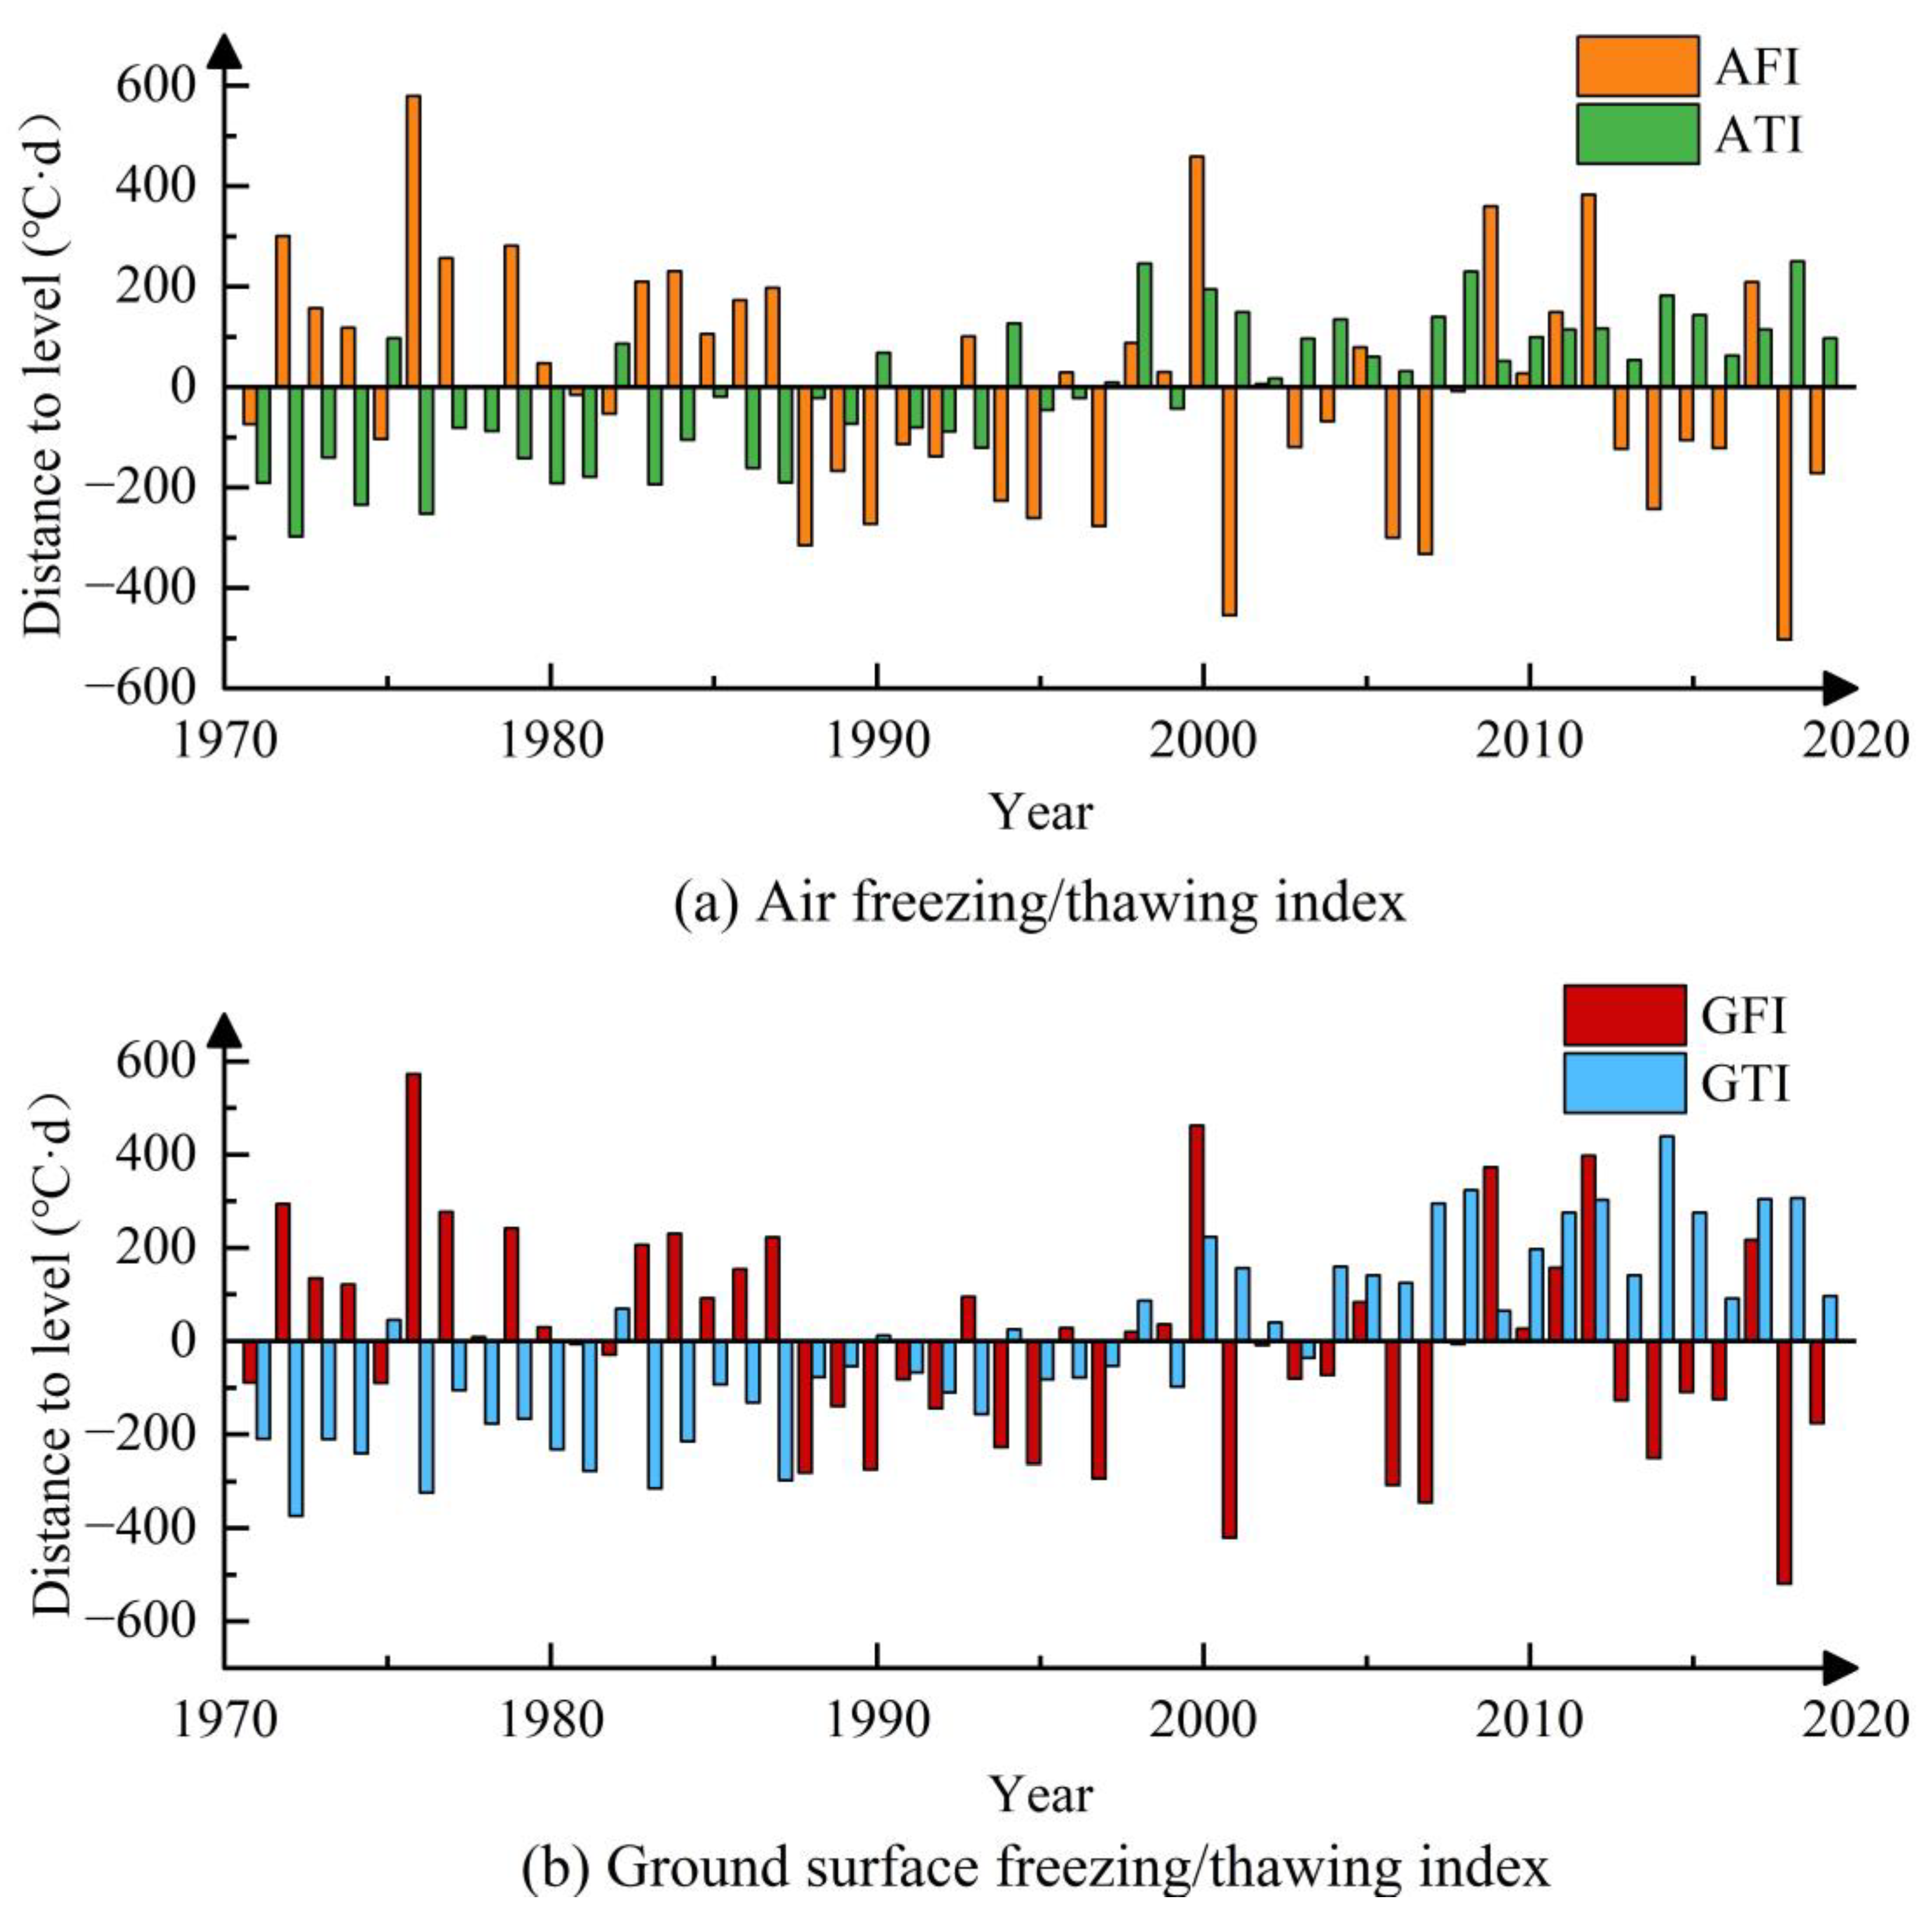
- During the study period, the mean annual AFI and GFI showed a decreasing trend, and the decreasing trend of both was almost the same. The mean annual ATI and GTI both showed an overall increasing trend, and the increasing trend of the mean annual GTI was greater than that of the mean annual ATI, with an increasing rate of 7.63 °C·d·a−1 and 11.89 °C·d·a−1, respectively.
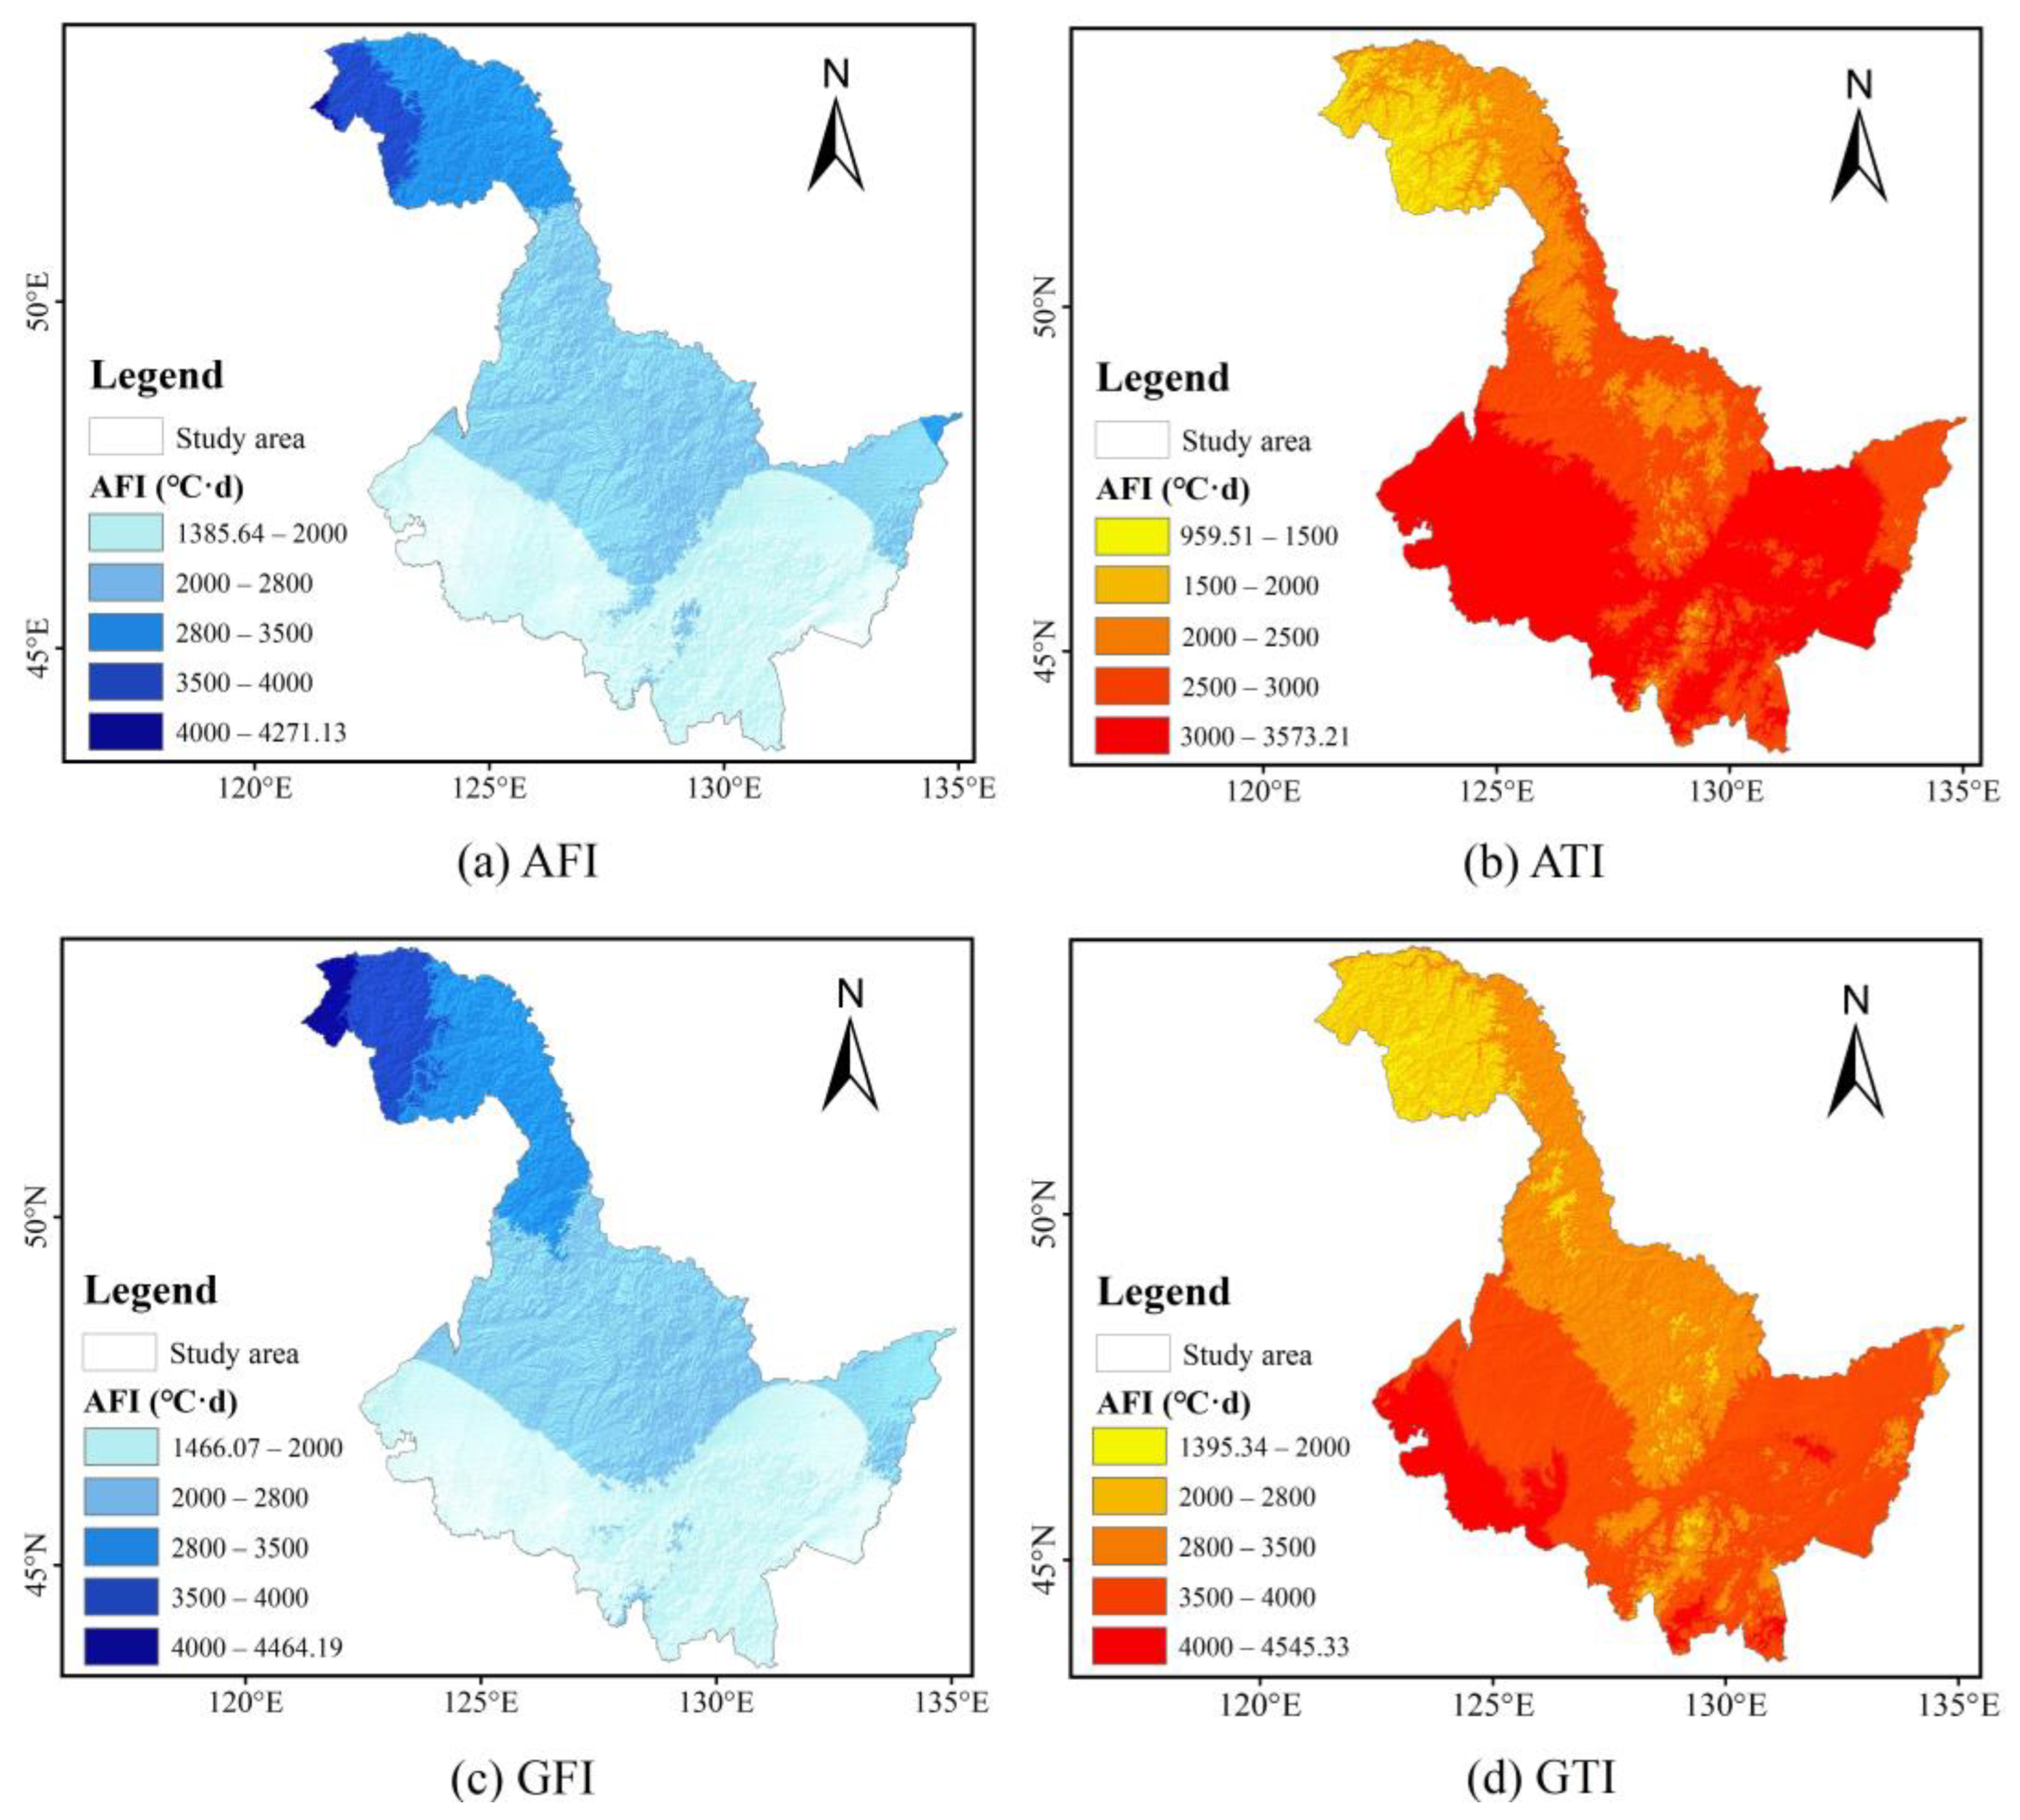
- For spatial distribution, the mean annual air/ground freezing/thawing index also showed a latitudinal trend, but in the northern Daxing’an mountain region, altitude plays a major role in the distribution of freezing/thawing index, while latitude has a greater influence on the distribution of freezing/thawing index than altitude in the southern region. Across Heilongjiang Province, the range of variation of the mean annual AFI was 1385.64–4271.13 °C·d, the range of variation of mean annual GFI was 1466.07–4464.10 °C·d, the range of variation of the mean annual ATI was 959.51–3573.21 °C·d and the range of variation of the mean annual GTI was 1395.34–4545.33 °C·d.
- Permafrost in Heilongjiang Province is primarily distributed in the northern Daxing’an Mountains and Xiaoxing’an Mountains and sporadically in some mountainous areas in the central part of the province. For the 1970–2010 period, the trend of permafrost degradation is obvious; the southern permafrost boundary moved nearly 2° to the north and the total permafrost area shrank from 1.11 × 10⁵ km2 in the 1970s to 6.53 × 10⁴ km2 in the 2010s, a reduction of approximately 40.9%. The southern boundary of permafrost in the 2010s was nearly stable at around 51° N.
Author Contributions
Funding
Institutional Review Board Statement
Informed Consent Statement
Data Availability Statement
Conflicts of Interest
References
- Gregory, J.M.; Stouffer, R.J.; Molina, M.J.; Chidthaisong, A.; Solomon, S.; Raga, G.B.; Friedlingstein, P.; Bindoff, N.L.; Treut, H.L.; Rusticucci, M.; et al. Climate Change 2021—The Physical Science Basis; IPCC: Geneva, Switzerland, 2021. [Google Scholar]
- IPCC. Climate Change 2013—The Physical Science Basis: Working Group I Contribution to the Fifth Assessment Report of the Intergovernmental Panel on Climate Change; Cambridge University Press: Cambridge, UK, 2014. [Google Scholar]
- Hoelzle, M.; Chinn, T.; Stumm, D.; Paul, F.; Zemp, M.; Haeberli, W. The application of glacier inventory data for estimating past climate change effects on mountain glaciers: A comparison between the European Alps and the Southern Alps of New Zealand. Glob. Planet. Chang. 2007, 56, 69–82. [Google Scholar] [CrossRef]
- Wei, Z.; Jin, H.; Zhang, J.; Yu, S.; Han, X.; Ji, Y.; He, R.; Chang, X. Prediction of permafrost changes in Northeastern China under a changing climate. Sci. China Earth Sci. 2011, 54, 924–935. [Google Scholar] [CrossRef]
- Zhang, Z.; Wu, Q.; Xun, X.; Li, Y. Spatial distribution and changes of Xing’an permafrost in China over the past three decades. Quat. Int. 2019, 523, 16–24. [Google Scholar]
- Jin, H.; Yu, Q.; Lü, L.; Guo, D.; He, R.; Yu, S.; Sun, G.; Li, Y. Degradation of permafrost in the Xing’anling Mountains, northeastern China. Permafr. Periglac. Process. 2007, 18, 245–258. [Google Scholar] [CrossRef]
- Wang, F.; Li, G.; Ma, W.; Mu, Y.; Zhou, Z.; Mao, Y. Permafrost thawing along the China-Russia Crude Oil Pipeline and countermeasures: A case study in Jiagedaqi, Northeast China. Cold Reg. Sci. Technol. 2018, 155, 308–313. [Google Scholar] [CrossRef]
- Li, X.; Jin, X.; Wang, X.; Jin, H.; Tang, L.; Li, X.; He, R.; Li, Y.; Huang, C.; Zhang, S. Investigation of permafrost engineering geological environment with electrical resistivity tomography: A case study along the China-Russia crude oil pipelines. Eng. Geol. 2021, 291, 106237. [Google Scholar] [CrossRef]
- Dong, X.; Liu, C.; Li, M.; Ma, D.; Chen, Q.; Zang, S. Variations in active layer soil hydrothermal dynamics of typical wetlands in permafrost region in the Great Hing’an Mountains, northeast China. Ecol. Indic. 2021, 129, 107880. [Google Scholar] [CrossRef]
- Li, X.; Jin, H.; Wang, H.; Jin, X.; Bense, V.F.; Marchenko, S.S.; He, R.; Huang, Y.; Luo, D. Effects of fire history on thermal regimes of permafrost in the northern Da Xing’anling Mountains, NE China. Geoderma 2022, 410, 115670. [Google Scholar] [CrossRef]
- He, R.-X.; Jin, H.-J.; Luo, D.-L.; Li, X.-Y.; Zhou, C.-F.; Jia, N.; Jin, X.-Y.; Li, X.-Y.; Che, T.; Yang, X.; et al. Permafrost changes in the Nanwenghe Wetlands Reserve on the southern slope of the Da Xing′anling—Yile′huli mountains, Northeast China. Adv. Clim. Chang. Res. 2021, 12, 696–709. [Google Scholar] [CrossRef]
- Rongali, G.; Keshari, A.K.; Gosain, A.K.; Khosa, R. Split-Window Algorithm for Retrieval of Land Surface Temperature Using Landsat 8 Thermal Infrared Data. J. Geovisualization Spat. Anal. 2018, 2, 14. [Google Scholar] [CrossRef]
- Luo, D.; Jin, H.; Marchenko, S.S.; Romanovsky, V.E. Difference between near-surface air, land surface and ground surface temperatures and their influences on the frozen ground on the Qinghai-Tibet Plateau. Geoderma 2018, 312, 74–85. [Google Scholar] [CrossRef]
- Frauenfeld, O.W.; Zhang, T.; Mccreight, J.L. Northern Hemisphere freezing/thawing index variations over the twentieth century. Int. J. Clim. 2006, 27, 47–63. [Google Scholar] [CrossRef]
- Peng, X.; Zhang, T.; Liu, Y.; Luo, J. Past and Projected Freezing/Thawing Indices in the Northern Hemisphere. J. Appl. Meteorol. Clim. 2019, 58, 495–510. [Google Scholar] [CrossRef]
- Peng, X.; Zhang, T.; Cao, B.; Wang, Q.; Wang, K.; Shao, W.; Guo, H. Changes in Freezing-Thawing Index and Soil Freeze Depth Over the Heihe River Basin, Western China. Arct. Antarct. Alp. Res. 2016, 48, 161–176. [Google Scholar] [CrossRef] [Green Version]
- Nelson Frederick, E. (Un) frozen in Time. Science 2003, 299, 1673–1675. [Google Scholar] [CrossRef]
- Nelson, F.E.; Outcalt, S.I. A Computational Method for Prediction and Regionalization of Permafrost. Arct. Alp. Res. 1987, 19, 279. [Google Scholar] [CrossRef]
- Zhang, Z.; Wu, Q.; Xun, X.; Wang, B.; Wang, X. Climate change and the distribution of frozen soil in 1980–2010 in northern northeast China. Quat. Int. 2018, 467, 230–241. [Google Scholar] [CrossRef]
- Wu, Q.; Liu, Y. Ground temperature monitoring and its recent change in Qinghai–Tibet Plateau. Cold Reg. Sci. Technol. 2004, 38, 85–92. [Google Scholar]
- Klene, A.E.; Nelson, F.E.; Shiklomanov, N.I.; Hinkel, K.M. The N-factor in Natural Landscapes: Variability of Air and Soil-Surface Temperatures, Kuparuk River Basin, Alaska, U.S.A. Arct. Antarct. Alp. Res. 2001, 33, 140–148. [Google Scholar] [CrossRef]
- Yin, G.; Niu, F.; Lin, Z.; Luo, J.; Liu, M. Effects of local factors and climate on permafrost conditions and distribution in Beiluhe basin, Qinghai-Tibet Plateau, China. Sci. Total Environ. 2017, 581–582, 472–485. [Google Scholar] [CrossRef]
- Luo, D.; Liu, L.; Jin, H.; Wang, X.; Chen, F. Characteristics of ground surface temperature at Chalaping in the Source Area of the Yellow River, northeastern Tibetan Plateau. Agric. For. Meteorol. 2019, 281, 107819. [Google Scholar] [CrossRef]
- Aalto, J.; Karjalainen, O.; Hjort, J.; Luoto, M. Statistical Forecasting of Current and Future Circum-Arctic Ground Temperatures and Active Layer Thickness. Geophys. Res. Lett. 2018, 45, 4889–4898. [Google Scholar] [CrossRef]
- Peng, X.; Zhang, T.; Frauenfeld, O.W.; Wang, K.; Cao, B.; Zhong, X.; Su, H.; Mu, C. Response of seasonal soil freeze depth to climate change across China. Cryosphere 2017, 11, 1059–1073. [Google Scholar] [CrossRef] [Green Version]
- Shi, Y.; Niu, F.; Lin, Z.; Luo, J. Freezing/thawing index variations over the circum-Arctic from 1901 to 2015 and the permafrost extent. Sci. Total Environ. 2019, 660, 1294–1305. [Google Scholar] [CrossRef] [PubMed]
- Zhang, T.; Frauenfeld, O.W.; Serreze, M.C.; Etringer, A.; Oelke, C.; McCreight, J.L.; Barry, R.; A Gilichinsky, D.; Yang, D.; Ye, H.; et al. Spatial and temporal variability in active layer thickness over the Russian Arctic drainage basin. J. Geophys. Res. Atmos. 2005, 110, 1–14. [Google Scholar] [CrossRef]
- Wu, T.; Wang, Q.; Zhao, L.; Batkhishig, O.; Watanabe, M. Observed trends in surface freezing/thawing index over the period 1987–2005 in Mongolia. Cold Reg. Sci. Technol. 2011, 69, 105–111. [Google Scholar] [CrossRef]
- Wu, Q.; Zhang, T. Recent permafrost warming on the Qinghai-Tibetan Plateau. J. Geophys. Res. Atmos. 2008, 113, D13108. [Google Scholar] [CrossRef]
- Frauenfeld, O.W.; Zhang, T.; Barry, R.; Gilichinsky, D. Interdecadal changes in seasonal freeze and thaw depths in Russia. J. Geophys. Res. Earth Surf. 2004, 109, D05101. [Google Scholar] [CrossRef]
- Shan, W.; Zhang, C.; Guo, Y.; Qiu, L. Mapping the Thermal State of Permafrost in Northeast China Based on the Surface Frost Number Model. Remote Sens. 2022, 14, 3185. [Google Scholar] [CrossRef]
- Shan, W.; Zhang, C.; Guo, Y.; Qiu, L.; Xu, Z.; Wang, Y. Spatial Distribution and Variation Characteristics of Permafrost Temperature in Northeast China. Sustainability 2022, 14, 8178. [Google Scholar] [CrossRef]
- Xu, S.; Liu, D.; Li, T.; Fu, Q.; Liu, D.; Hou, R.; Meng, F.; Li, M.; Li, Q. Spatiotemporal evolution of the maximum freezing depth of seasonally frozen ground and permafrost continuity in historical and future periods in Heilongjiang Province, China. Atmospheric Res. 2022, 274, 106195. [Google Scholar] [CrossRef]
- Song, C.; Dai, C.; Wang, C.; Yu, M.; Gao, Y.; Tu, W. Characteristic Analysis of the Spatio-Temporal Distribution of Key Variables of the Soil Freeze–Thaw Processes over Heilongjiang Province, China. Water 2022, 14, 2573. [Google Scholar] [CrossRef]
- Wang, C.; Shan, M.; Hu, Z.; Shan, W. Multi-spectral remote sensing based land surface temperature retrieval and isolated permafrost zone segmentation. Infrared Laser Eng. 2015, 44, 1390–1396. [Google Scholar]
- Shi, P.; Sun, S.; Wang, M.; Li, N.; Wang, J.A.; Jin, Y.; Gu, X.; Yin, W. Climate change regionalization in China (1961–2010). Sci. China Earth Sci. 2014, 57, 2676–2689. [Google Scholar] [CrossRef]
- Zuo, H.; Lyu, S.; Hu, Y. Variations trend of yearly mean air temperature and precipitation in China in the last 50 years. Plateau Meteorology 2004, 23, 238–244. [Google Scholar]
- He, W.; Bu, R.; Xiong, Z.; Hu, Y. Characteristics of temperature and precipitation in Northeastern China from 1961 to 2005. Acta Ecol. Sin. 2013, 33, 519–531. [Google Scholar] [CrossRef]
- Holben, B.N. Characteristics of maximum-value composite images from temporal AVHRR data. Int. J. Remote Sens. 1986, 7, 1417–1434. [Google Scholar] [CrossRef]
- Pinzon, J.E.; Tucker, C.J. A non-stationary 1981–2012 AVHRR NDVI3g time series. Remote Sens. 2014, 6, 6929–6960. [Google Scholar] [CrossRef] [Green Version]
- Myneni, R.B.; Hall, F.G.; Sellers, P.J.; Marshak, A.L. The interpretation of spectral vegetation indexes. IEEE Trans. Geosci. Remote Sens. 1995, 33, 481–486. [Google Scholar] [CrossRef]
- Chang, X.L.; Jin, H.; He, R. Advances in permafrost and cold regions environments studies in the Da Xing’anling Mountains, Northeastern China. J. Glaciol. Geocryol. 2008, 30, 176–182. [Google Scholar]
- Jin, H.; Li, S.; Cheng, G.; Shaoling, W.; Li, X. Permafrost and climatic change in China. Glob. Planet. Chang. 2000, 26, 387–404. [Google Scholar] [CrossRef]
- Zhang, Z.-Q.; Wu, Q.-B.; Hou, M.-T.; Tai, B.-W.; An, Y.-K. Permafrost change in Northeast China in the 1950s–2010s. Adv. Clim. Chang. Res. 2021, 12, 18–28. [Google Scholar] [CrossRef]
- Wang, X.; Chen, R.; Liu, G.; Yang, Y.; Song, Y.; Liu, J.; Liu, Z.; Han, C.; Liu, X.; Guo, S.; et al. Spatial distributions and temporal variations of the near-surface soil freeze state across China under climate change. Glob. Planet. Chang. 2018, 172, 150–158. [Google Scholar] [CrossRef]
- Fu, Q.; Zhou, Z.; Li, T.; Liu, D.; Hou, R.; Cui, S.; Yan, P. Spatiotemporal characteristics of droughts and floods in northeastern China and their impacts on agriculture. Stoch. Environ. Res. Risk Assess. 2018, 32, 2913–2931. [Google Scholar] [CrossRef]
- Pei, W.; Fu, Q.; Liu, D.; Li, T.-X.; Cheng, K.; Cui, S. Spatiotemporal analysis of the agricultural drought risk in Heilongjiang Province, China. Theor. Appl. Clim. 2018, 133, 151–164. [Google Scholar] [CrossRef]
- Zhou, Z.; Ding, Y.; Shi, H.; Cai, H.; Fu, Q.; Liu, S.; Li, T. Analysis and prediction of vegetation dynamic changes in China: Past, present and future. Ecol. Indic. 2020, 117, 106642. [Google Scholar] [CrossRef]
- Luo, D.; Jin, H.; Jin, R.; Yang, X.; Lü, L. Spatiotemporal variations of climate warming in northern Northeast China as indicated by freezing and thawing indices. Quat. Int. 2014, 349, 187–195. [Google Scholar] [CrossRef]
- Wang, R.; Zhu, Q.; Ma, H. Changes in freezing and thawing indices over the source region of the Yellow River from 1980 to 2014. J. For. Res. 2019, 30, 257–268. [Google Scholar] [CrossRef]
- Gocic, M.; Trajkovic, S. Analysis of changes in meteorological variables using Mann-Kendall and Sen’s slope estimator statistical tests in Serbia. Glob. Planet. Chang. 2013, 100, 172–182. [Google Scholar] [CrossRef]
- Longo-Minnolo, G.; Vanella, D.; Consoli, S.; Pappalardo, S.; Ramírez-Cuesta, J.M. Assessing the use of ERA5-Land reanalysis and spatial interpolation methods for retrieving precipitation estimates at basin scale. Atmospheric Res. 2022, 271, 106131. [Google Scholar] [CrossRef]
- Fedorov, A.; Konstantinov, P.; Vasilyev, N.; Shestakova, A. The influence of boreal forest dynamics on the current state of permafrost in Central Yakutia. Polar Sci. 2019, 22, 100483. [Google Scholar] [CrossRef]
- Xu, S.; Fu, Q.; Li, T.; Meng, F.; Liu, D.; Hou, R.; Li, M.; Li, Q. Spatiotemporal characteristics of the soil freeze-thaw state and its variation under different land use types—A case study in Northeast China. Agric. For. Meteorol. 2021, 312, 108737. [Google Scholar] [CrossRef]
- Smith, M.W.; Riseborough, D.W. Climate and the limits of permafrost: A zonal analysis. Permafr. Periglac. Process. 2002, 13, 1–15. [Google Scholar] [CrossRef]
- Luo, D.; Jin, H.; Lü, L.; Zhou, J. Spatiotemporal changes in extreme ground surface temperatures and the relationship with air temperatures in the Three-River Source Regions during 1980–2013. Theor. Appl. Clim. 2016, 123, 885–897. [Google Scholar] [CrossRef]
- Zhan, M.-J.; Xia, L.; Zhan, L.; Wang, Y. Recognition of Changes in Air and Soil Temperatures at a Station Typical of China’s Subtropical Monsoon Region (1961–2018). Adv. Meteorol. 2019, 2019, 6927045. [Google Scholar] [CrossRef]
- Pan, Y.; Xiao, H.; Xin, Z.; Li, J.; Miri, A.; Cao, Q. Characteristics of Energy Distribution in a Desert Ecosystem in Inner Mongolia, Northern China. Front. Environ. Sci. 2022, 10, 939782. [Google Scholar] [CrossRef]
- Zhu, M.; Liu, D.; Tang, W.; Chi, Q.; Zhao, X.; Xu, S.; Ye, S.; Wang, Y.; Cui, Y.; Zhou, S. Exploring the Ecological Climate Effects Based on Five Land Use Types: A Case Study of the Huang-Huai-Hai River Basin in China. Land 2022, 11, 265. [Google Scholar] [CrossRef]
- Gao, Z.; Horton, R.; Liu, H.P. Impact of wave phase difference between soil surface heat flux and soil surface temperature on soil surface energy balance closure. J. Geophys. Res. Atmos. 2010, 115, D16112. [Google Scholar] [CrossRef]
- Zhang, Q.; Li, H.; Zhao, J. Modification of the land surface energy balance relationship by introducing vertical sensible heat advection and soil heat storage over the Loess Plateau. Sci. China Earth Sci. 2012, 55, 580–589. [Google Scholar] [CrossRef]
- Wang, Q.; Zhang, T.; Jin, H.; Cao, B.; Peng, X.; Wang, K.; Li, L.; Guo, H.; Liu, J.; Cao, L. Observational study on the active layer freeze–thaw cycle in the upper reaches of the Heihe River of the north-eastern Qinghai-Tibet Plateau. Quat. Int. 2016, 440, 13–22. [Google Scholar] [CrossRef]
- Guo, W.; Liu, H.; Anenkhonov, O.A.; Shangguan, H.; Sandanov, D.V.; Korolyuk, A.Y.; Hu, G.; Wu, X. Vegetation can strongly regulate permafrost degradation at its southern edge through changing surface freeze-thaw processes. Agric. For. Meteorol. 2018, 252, 10–17. [Google Scholar] [CrossRef]
- Way, R.G.; Lapalme, C.M. Does tall vegetation warm or cool the ground surface? Constraining the ground thermal impacts of upright vegetation in northern environments. Environ. Res. Lett. 2021, 16, 054077. [Google Scholar] [CrossRef]
- Shen, X.; Liu, B.; Li, G.; Yu, P.; Zhou, D. Impacts of grassland types and vegetation cover changes on surface air temperature in the regions of temperate grassland of China. Theor. Appl. Climatol. 2016, 126, 141–150. [Google Scholar] [CrossRef]
- Shen, X.; Liu, Y.; Wu, L.; Ma, R.; Wang, Y.; Zhang, J.; Wang, L.; Liu, B.; Lu, X.; Jiang, M. Grassland greening impacts on global land surface temperature. Sci. Total. Environ. 2022, 838, 155851. [Google Scholar] [CrossRef] [PubMed]
- Wi, L.; Zhang, J.; Dong, W. Vegetation effects on mean daily maximum and minimum surface air temperatures over China. Chin. Sci. Bull. 2011, 56, 900–905. [Google Scholar] [CrossRef]
- Sharkhuu, N.; Sharkhuu, A. Effects of Climate Warming and Vegetation Cover on Permafrost of Mongolia. In Eurasian Steppes. Ecological Problems and Livelihoods in a Changing World; Werger, M.J.A., van Staalduinen, M.A., Eds.; Springer: Dordrecht, The Netherlands, 2012; pp. 445–472. [Google Scholar]
- Duveiller, G.; Hooker, J.; Cescatti, A. The mark of vegetation change on Earth’s surface energy balance. Nat. Commun. 2018, 9, 679. [Google Scholar] [CrossRef] [Green Version]
- Throop, J.; Lewkowicz, A.G.; Smith, S.L. Climate and ground temperature relations at sites across the continuous and discontinuous permafrost zones, northern Canada. Can. J. Earth Sci. 2012, 49, 865–876. [Google Scholar] [CrossRef]
- Zhang, T. Influence of the seasonal snow cover on the ground thermal regime: An overview. Rev. Geophys. 2005, 43, RG4002. [Google Scholar] [CrossRef]
- Vasil’ev, I.S.; Vasil’ev, A.I.; Torgovkin, Y.I. Air freezing and thawing indices in Yakutia and their mapping. Russ. Meteorol. Hydrol. 2012, 37, 170–176. [Google Scholar] [CrossRef]
- Wu, T.; Zhu, X.; Wang, P.; Adiya, S.; Avirmed, D.; Dorjgotov, B.; Li, R.; Wu, X.; Lou, P. Climate warming in the Qinghai-Tibet Plateau and Mongolia as indicated by air freezing and thawing indices. Ecol. Indic. 2022, 138, 108836. [Google Scholar] [CrossRef]
- Qi, F.; Zhang, M.; Lu, S.; Bai, Y.; Yang, W. Quaternary Geology of Sanjiang Plain; Geological Press: Beijing, China, 2015. [Google Scholar]
- Zhou, X.; Zhao, C.; Li, N.; Liu, M.; Cui, Y.; Ao, X. Influence of snow and temperature on the depth of frozen soil in winter half year in Northeast China. J. Glaciol. Geocryol. 2021, 43, 1027–1039. [Google Scholar]
- Liu, S.; Zang, S.; Zhang, L.; Na, X. Estimation of land surface temperature from MODIS in Northeast China. Geogr. Res. 2017, 36, 2251–2260. [Google Scholar]
- Zhao, J.-Y.; Chen, J.; Wu, Q.-B.; Hou, X. Snow cover influences the thermal regime of active layer in Urumqi River Source, Tianshan Mountains, China. J. Mt. Sci. 2018, 15, 2622–2636. [Google Scholar] [CrossRef]
- Chang, X.; Jin, H.; Yu, S.; Sun, H.; He, R.; Luo, D.; Sun, G.; Lu, L. Influence of vegetation on frozen ground temperatures the forested area in the Da Xing’anling Mountains, Northeastern China. Shengtai Xuebao/Acta Ecol. Sin. 2011, 31, 5138–5147. [Google Scholar]
- Wang, Y.; Jin, H.; Li, G. Investigation of the freeze–thaw states of foundation soils in permafrost areas along the China–Russia Crude Oil Pipeline (CRCOP) route using ground-penetrating radar (GPR). Cold Reg. Sci. Technol. 2016, 126, 10–21. [Google Scholar] [CrossRef]
- Li, X.; Jin, H.; He, R.; Huang, Y.; Wang, H.; Luo, D.; Jin, X.; Lü, L.; Wang, L.; Li, W.; et al. Effects of forest fires on the permafrost environment in the northern Da Xing’anling (Hinggan) mountains, Northeast China. Permafr. Periglac. Process. 2019, 30, 163–177. [Google Scholar] [CrossRef]
- Boike, J.; Grau, T.; Heim, B.; Günther, F.; Langer, M.; Muster, S.; Gouttevin, I.; Lange, S. Satellite-derived changes in the permafrost landscape of central Yakutia, 2000–2011: Wetting, drying, and fires. Glob. Planet. Chang. 2016, 139, 116–127. [Google Scholar] [CrossRef]


| Period | Permafrost | Seasonal Frozen Ground | ||
|---|---|---|---|---|
| Area/km2 | Proportion | Area/km2 | Proportion | |
| 1971–1979s | 110,541 | 24.26% | 345,073 | 75.74% |
| 1980–1989s | 101,046 | 22.18% | 354,568 | 77.82% |
| 1990–1999s | 66,186 | 14.53% | 389,428 | 85.47% |
| 2000–2009s | 65,779 | 14.44% | 389,835 | 85.56% |
| 2010–2019s | 65,333 | 14.34% | 390,281 | 85.66% |
Publisher’s Note: MDPI stays neutral with regard to jurisdictional claims in published maps and institutional affiliations. |
© 2022 by the authors. Licensee MDPI, Basel, Switzerland. This article is an open access article distributed under the terms and conditions of the Creative Commons Attribution (CC BY) license (https://creativecommons.org/licenses/by/4.0/).
Share and Cite
Song, C.; Dai, C.; Gao, Y.; Wang, C.; Yu, M.; Tu, W.; Jia, M.; Li, R. Spatial–Temporal Characteristics of Freezing/Thawing Index and Permafrost Distribution in Heilongjiang Province, China. Sustainability 2022, 14, 16899. https://doi.org/10.3390/su142416899
Song C, Dai C, Gao Y, Wang C, Yu M, Tu W, Jia M, Li R. Spatial–Temporal Characteristics of Freezing/Thawing Index and Permafrost Distribution in Heilongjiang Province, China. Sustainability. 2022; 14(24):16899. https://doi.org/10.3390/su142416899
Chicago/Turabian StyleSong, Chengjie, Changlei Dai, Yaqi Gao, Chuang Wang, Miao Yu, Weiming Tu, Minghui Jia, and Ruotong Li. 2022. "Spatial–Temporal Characteristics of Freezing/Thawing Index and Permafrost Distribution in Heilongjiang Province, China" Sustainability 14, no. 24: 16899. https://doi.org/10.3390/su142416899