Trends in College–High School Wage Differentials in China: The Role of Cohort-Specific Labor Supply Shift
Abstract
:1. Introduction
2. Literature Review
3. Trends in BA–HS Wage Gaps in Urban China during 2002–2009
4. Theoretical Model
5. Data, Sample and Key Variables
5.1. Data
5.2. Sample
5.3. Key Variables
5.3.1. Indicators for Age Groups
5.3.2. BA–HS Wage Gap
5.3.3. Age-Group-Specific Supply of BA- and HS-Educated Labor
5.3.4. Aggregate Supply of BA- and HS-Educated Labor
6. Results
6.1. Basic Model
6.2. Robustness Checks
7. Relative Supplies and Predicted Wage Gaps after 2009
7.1. Relative Supplies of BA-Educated Labor after 2009
7.2. Predicted BA–HS Wage Gaps after 2009
8. Discussion and Conclusions
Funding
Institutional Review Board Statement
Informed Consent Statement
Data Availability Statement
Conflicts of Interest
References
- Heckman, J.J.; Lochner, L.J.; Todd, P.E. Earnings Functions, Rates of Return and Treatment Effects: The Mincer Equation and Beyond. In Handbook of the Economics of Education; North Holland: Amsterdam, The Netherlands; North Holland: Oxford, UK; North Holland: Waltham, MA, USA, 2006; Volume 1, pp. 307–458. [Google Scholar]
- Lemieux, T. The Mincer Equation Thirty Years after Schooling, Experience and Earnings. In Jacob Mincer, A Pioneer of Modern Labor Economics; Schechtman, S.G., Ed.; Springer: New York, NY, USA, 2006. [Google Scholar]
- Hanushek, E.A.; Woessmann, L. The role of cognitive skills in economic development. J. Econ. Lit. 2008, 46, 607–668. [Google Scholar] [CrossRef] [Green Version]
- Aghion, P.; Boustan, L.; Hoxby, C.; Vandenbussche, J. The causal impact of education on economic growth: Evidence from US. Brook. Pap. Econ. Act. 2009, 1, 1–73. [Google Scholar]
- DeLong, J.B.; Goldin, C.; Katz, L.F. Sustaining US Economic Growth. In Agenda for the Nation; Aaron, H., Lindsay, J., Nivola, P.P., Eds.; Brookings Institution: Washington, DC, USA, 2003; pp. 12–60. [Google Scholar]
- Moretti, E. Estimating the social return to higher education: Evidence from longitudinal and repeated cross-sectional data. J. Econom. 2004, 121, 175–212. [Google Scholar] [CrossRef] [Green Version]
- Autor, D.H. Skills, education, and the rise of earnings inequality among the “other 99 percent”. Science 2014, 344, 843–851. [Google Scholar] [CrossRef] [PubMed] [Green Version]
- Goldin, C.; Katz, L.F. Long-run changes in the wage structure: Narrowing, widening, polarizing. Brook. Pap. Econ. Act. 2007, 2, 135–165. [Google Scholar]
- Pack, H.; Nelson, R.R. The Asian Miracle and Modern Growth Theory. Econ. J. 1999, 109, 416–436. [Google Scholar]
- Noorbakhsh, F.; Paloni, A.; Youssef, A. Human capital and FDI inflows to developing countries: New empirical evidence. World Dev. 2001, 29, 1593–1610. [Google Scholar] [CrossRef]
- Ministry of Education of the People’s Republic of China. Educational Statistics Yearbook of China; People’s Education Press: Beijing, China, 1998.
- Ministry of Education of the People’s Republic of China. Educational Statistics Yearbook of China; People’s Education Press: Beijing, China, 1999.
- Ministry of Education of the People’s Republic of China. Educational Statistics Yearbook of China; People’s Education Press: Beijing, China, 2001.
- Ministry of Education of the People’s Republic of China. Educational Statistics Yearbook of China; People’s Education Press: Beijing, China, 2008.
- Card, D.; Lemieux, T. Can falling supply explain the rising return to college for younger men? A cohort-based analysis. Q. J. Econ. 2001, 116, 705–746. [Google Scholar] [CrossRef] [Green Version]
- The Organization for Economic Cooperation and Development. Education at a Glance: OECD Indicators; OECD Publishing: Paris, France, 2016. [Google Scholar]
- Acemoglu, D.; Autor, D.H.; Lyle, D. Women, war, and wages: The effect of female labor supply on the wage structure at midcentury. J. Political Econ. 2004, 112, 497–551. [Google Scholar] [CrossRef] [Green Version]
- Autor, D.H.; Katz, L.F.; Kearney, M.S. Trends in US wage inequality: Revising the revisionists. Rev. Econ. Stat. 2008, 90, 300–323. [Google Scholar] [CrossRef]
- Edlund, L.; Kopczuk, W. Women, wealth, and mobility. Am. Econ. Rev. 2009, 99, 146–178. [Google Scholar] [CrossRef] [Green Version]
- Katz, L.F.; Murphy, K.M. Changes in relative wages, 1963–1987: Supply and demand factors. Q. J. Econ. 1992, 107, 35–78. [Google Scholar] [CrossRef] [Green Version]
- Kopczuk, W.; Saez, E.; Song, J. Earnings inequality and mobility in the United States: Evidence from social security data since 1937. Q. J. Econ. 2010, 125, 91–128. [Google Scholar] [CrossRef]
- Acemoglu, D. Why do new technologies complement skills? Directed technical change and wage inequality. Q. J. Econ. 1998, 113, 1055–1089. [Google Scholar] [CrossRef] [Green Version]
- Acemoglu, D.; Restrepo, P. The race between machine and man: Implications of technology for growth, factor shares and employment. Am. Econ. Rev. 2018, 108, 1488–1542. [Google Scholar] [CrossRef] [Green Version]
- Autor, D.H.; Katz, L.F.; Krueger, A.B. Computing inequality: Have computers changed the labor market. Q. J. Econ. 1998, 113, 1169–1213. [Google Scholar] [CrossRef] [Green Version]
- Autor, D.H.; Levy, F.; Murnane, R. The skill content of recent technological change: An empirical exploration. Q. J. Econ. 2003, 118, 1279–1333. [Google Scholar] [CrossRef]
- Berman, E.; Bound, J.; Griliches, Z. Changes in the demand for skilled labor within US manufacturing: Evidence from the annual survey of manufactures. Q. J. Econ. 1994, 109, 367–397. [Google Scholar] [CrossRef] [Green Version]
- Card, D.; DiNardo, J. Skill-biased technological change and rising wage inequality: Some problems and puzzles. J. Labor Econ. 2002, 20, 733–783. [Google Scholar] [CrossRef] [Green Version]
- Johnson, G.E. Changes in earnings inequality: The role of demand shifts. J. Econ. Perspect. 1997, 11, 41–54. [Google Scholar] [CrossRef]
- Lemieux, T. Increasing residual wage inequality: Composition effects, noisy data, or rising demand for skill? Am. Econ. Rev. 2006, 96, 461–498. [Google Scholar] [CrossRef] [Green Version]
- Spitz-Oener, A. Technical change, job tasks and rising educational demands: Looking outside the wage structure. J. Labor Econ. 2006, 24, 235–270. [Google Scholar] [CrossRef] [Green Version]
- Tinbergen, J. Substitution of graduate by other labour. Kyklos Int. Rev. Soc. Sci. 1974, 27, 217–226. [Google Scholar] [CrossRef]
- Acemoglu, D.; Autor, D. Skills, tasks and technologies: Implications for employment and earnings. In Handbook of Labor Economics, 4B; Card, D., Ashenfelter, O., Eds.; Elsevier: San Diego, CA, USA; Elsevier: Amsterdam, The Netherlands, 2010; pp. 1043–1171. [Google Scholar]
- Goldin, C.; Katz, L.F. The Race between Education and Technology; Harvard University Press: Cambridge, UK, 2009. [Google Scholar]
- Blau, F.; Kahn, L.M. Do cognitive test scores explain higher U.S. wage inequality? Rev. Econ. Stat. 2005, 87, 184–193. [Google Scholar] [CrossRef] [Green Version]
- Carneiro, P.; Lee, S. Trends in quality-adjusted skill premia in the United States, 1960–2000. Am. Econ. Rev. 2011, 101, 2309–2349. [Google Scholar] [CrossRef] [Green Version]
- Autor, D.H.; Manning, A.; Smith, C.L. The Contribution of the Minimum Wage to U.S. Wage Inequality over Three Decades: A Reassessment. Am. Econ. J. Appl. Econ. 2016, 8, 58–99. [Google Scholar] [CrossRef] [Green Version]
- Brown, C. Minimum wages, employment, and the distribution of income. In Handbook of Labor Economics, 3B; Ashenfelter, O., Card, D., Eds.; Elsevier: Amsterdam, The Netherlands, 1999; pp. 2101–2163. [Google Scholar]
- Card, D. The effects of unions on wage inequality in the US labor market. Ind. Labor Relat. Rev. 2001, 54, 296–315. [Google Scholar] [CrossRef]
- DiNardo, J.; Fortin, N.M.; Lemieux, T. Labor market institutions and the distribution of wages, 1973–1993: A semi-parametric approach. Econometrica 1996, 64, 1001–1044. [Google Scholar] [CrossRef] [Green Version]
- Beaudry, P.; Green, D.A.; Benjamin, M.S. The declining fortunes of the young since 2000. Am. Econ. Rev. Pap. Proc. 2014, 104, 381–386. [Google Scholar] [CrossRef]
- Juhn, C.; Murphy, K.M.; Pierce, B. Wage inequality and the rise in returns to skill. J. Political Econ. 1993, 101, 410–442. [Google Scholar] [CrossRef] [Green Version]
- Katz, L.F.; Autor, D.H. Changes in the Wage Structure and Earnings Inequality. In Handbook of Labor Economics; Elsevier: Amsterdam, The Netherlands, 1999; Volume 3A, pp. 1463–1555. [Google Scholar]
- Piketty, T.; Saez, E. Income inequality in the United States, 1913–1998. Q. J. Econ. 2003, 118, 1–41. [Google Scholar] [CrossRef]
- Byron, R.P.; Manaloto, E.Q. Returns to education in China. Econ. Dev. Cult. Chang. 1990, 38, 783–796. [Google Scholar] [CrossRef]
- Johnson, E.N.; Chow, G.C. Rates of return to schooling in China. Pac. Econ. Rev. 1997, 2, 101–113. [Google Scholar] [CrossRef]
- Liu, Z. Earnings, education, and economic reforms in urban China. Econ. Dev. Cult. Chang. 1998, 46, 697–725. [Google Scholar] [CrossRef]
- Zhang, J.; Zhao, Y.; Park, A.; Song, X. Economic returns to schooling in urban China, 1988 to 2001. J. Comp. Econ. 2005, 33, 730–752. [Google Scholar] [CrossRef]
- Psacharopoulos, G.; Patrinos, H.A. Returns to investment in education: A decennial review of the global literature. Educ. Econ. 2018, 26, 445–458. [Google Scholar] [CrossRef] [Green Version]
- Gao, W.; Smyth, R. Education expansion and returns to schooling in urban China, 2001–2010: Evidence from three waves of the China urban labor survey. J. Asia Pac. Econ. 2015, 20, 178–201. [Google Scholar] [CrossRef]
- Ge, S.; Yang, D.T. Labor market developments in China: A neoclassical view. China Econ. Rev. 2011, 22, 611–625. [Google Scholar] [CrossRef] [Green Version]
- Meng, X. Labor market outcomes and reforms in China. J. Econ. Perspect. 2012, 26, 75–101. [Google Scholar] [CrossRef] [Green Version]
- Appleton, S.; Song, L.; Xia, Q. Understanding urban wage inequality in China 1988–2008: Evidence from quantile analysis. World Dev. 2014, 62, 1–13. [Google Scholar] [CrossRef]
- Hu, A.; Hibel, J. Increasing heterogeneity in the economic returns to higher education in urban China. Soc. Sci. J. 2015, 52, 322–330. [Google Scholar] [CrossRef]
- Yang, J.; Gao, M. The impact of education expansion on wage inequality. Appl. Econ. 2018, 50, 1309–1323. [Google Scholar] [CrossRef]
- National Bureau of Statistics of China. National Data. 2021. Available online: http://data.stats.gov.cn/index.htm (accessed on 18 March 2021).
- Fang, H.; Qiu, X. “Golden Ages”: A Tale of the Labor Markets in China and the United States; No. w29523; National Bureau of Economic Research: Cambridge, MA, USA, 2021. [Google Scholar]
- Feng, S.; Hu, Y.; Moffitt, R. Long run trends in unemployment and labor force participation in China. J. Comp. Econ. 2017, 45, 304–324. [Google Scholar] [CrossRef]
- Cao, J.; Ho, M.S.; Liang, H. Household energy demand in urban China: Accounting for regional prices and rapid income change. Energy J. 2016, 37, 87–110. [Google Scholar] [CrossRef]
- Li, H.; Shi, X.; Wu, B. The retirement consumption puzzle in China. Am. Econ. Rev. Pap. Proc. 2015, 105, 437–441. [Google Scholar] [CrossRef]
- Yu, J.; Shi, X.; Laurenceson, J. Will the Chinese economy be more volatile in the future? Insights from Urban Household Survey data. Int. J. Emerg. Mark. 2019, 15, 790–808. [Google Scholar] [CrossRef]
- The World Bank. Data: Labor Force Participation Rate, Male (% of Male Population Ages 15+). 2022. Available online: https://data.worldbank.org/indicator/SL.TLF.CACT.MA.ZS?end=2009&locations=CN&start=2002 (accessed on 16 May 2022).
- Gustafsson, B.; Li, S.; Sato, H. Data for studying earnings, the distribution of household income and poverty in China. China Econ. Rev. 2014, 2014, 419–431. [Google Scholar] [CrossRef] [Green Version]
- Low, H.; Meghir, C. The use of structural models in econometrics. J. Econ. Perspect. 2017, 31, 33–58. [Google Scholar] [CrossRef] [Green Version]
- Ministry of Education of the People’s Republic of China. Educational Statistics Yearbook of China; People’s Education Press: Beijing, China, 2021.
- Mincer, J. Investment in human capital and personal income distribution. J. Political Econ. 1958, 66, 281–302. [Google Scholar] [CrossRef] [Green Version]
- Mincer, J. Schooling, Experience, and Earnings; Columbia University Press: New York, NY, USA, 1974. [Google Scholar]
- Becker, G.S. Human Capital: A Theoretical and Empirical Analysis, With Special Reference to Education; University of Chicago Press: Chicago, IL, USA, 1964. [Google Scholar]


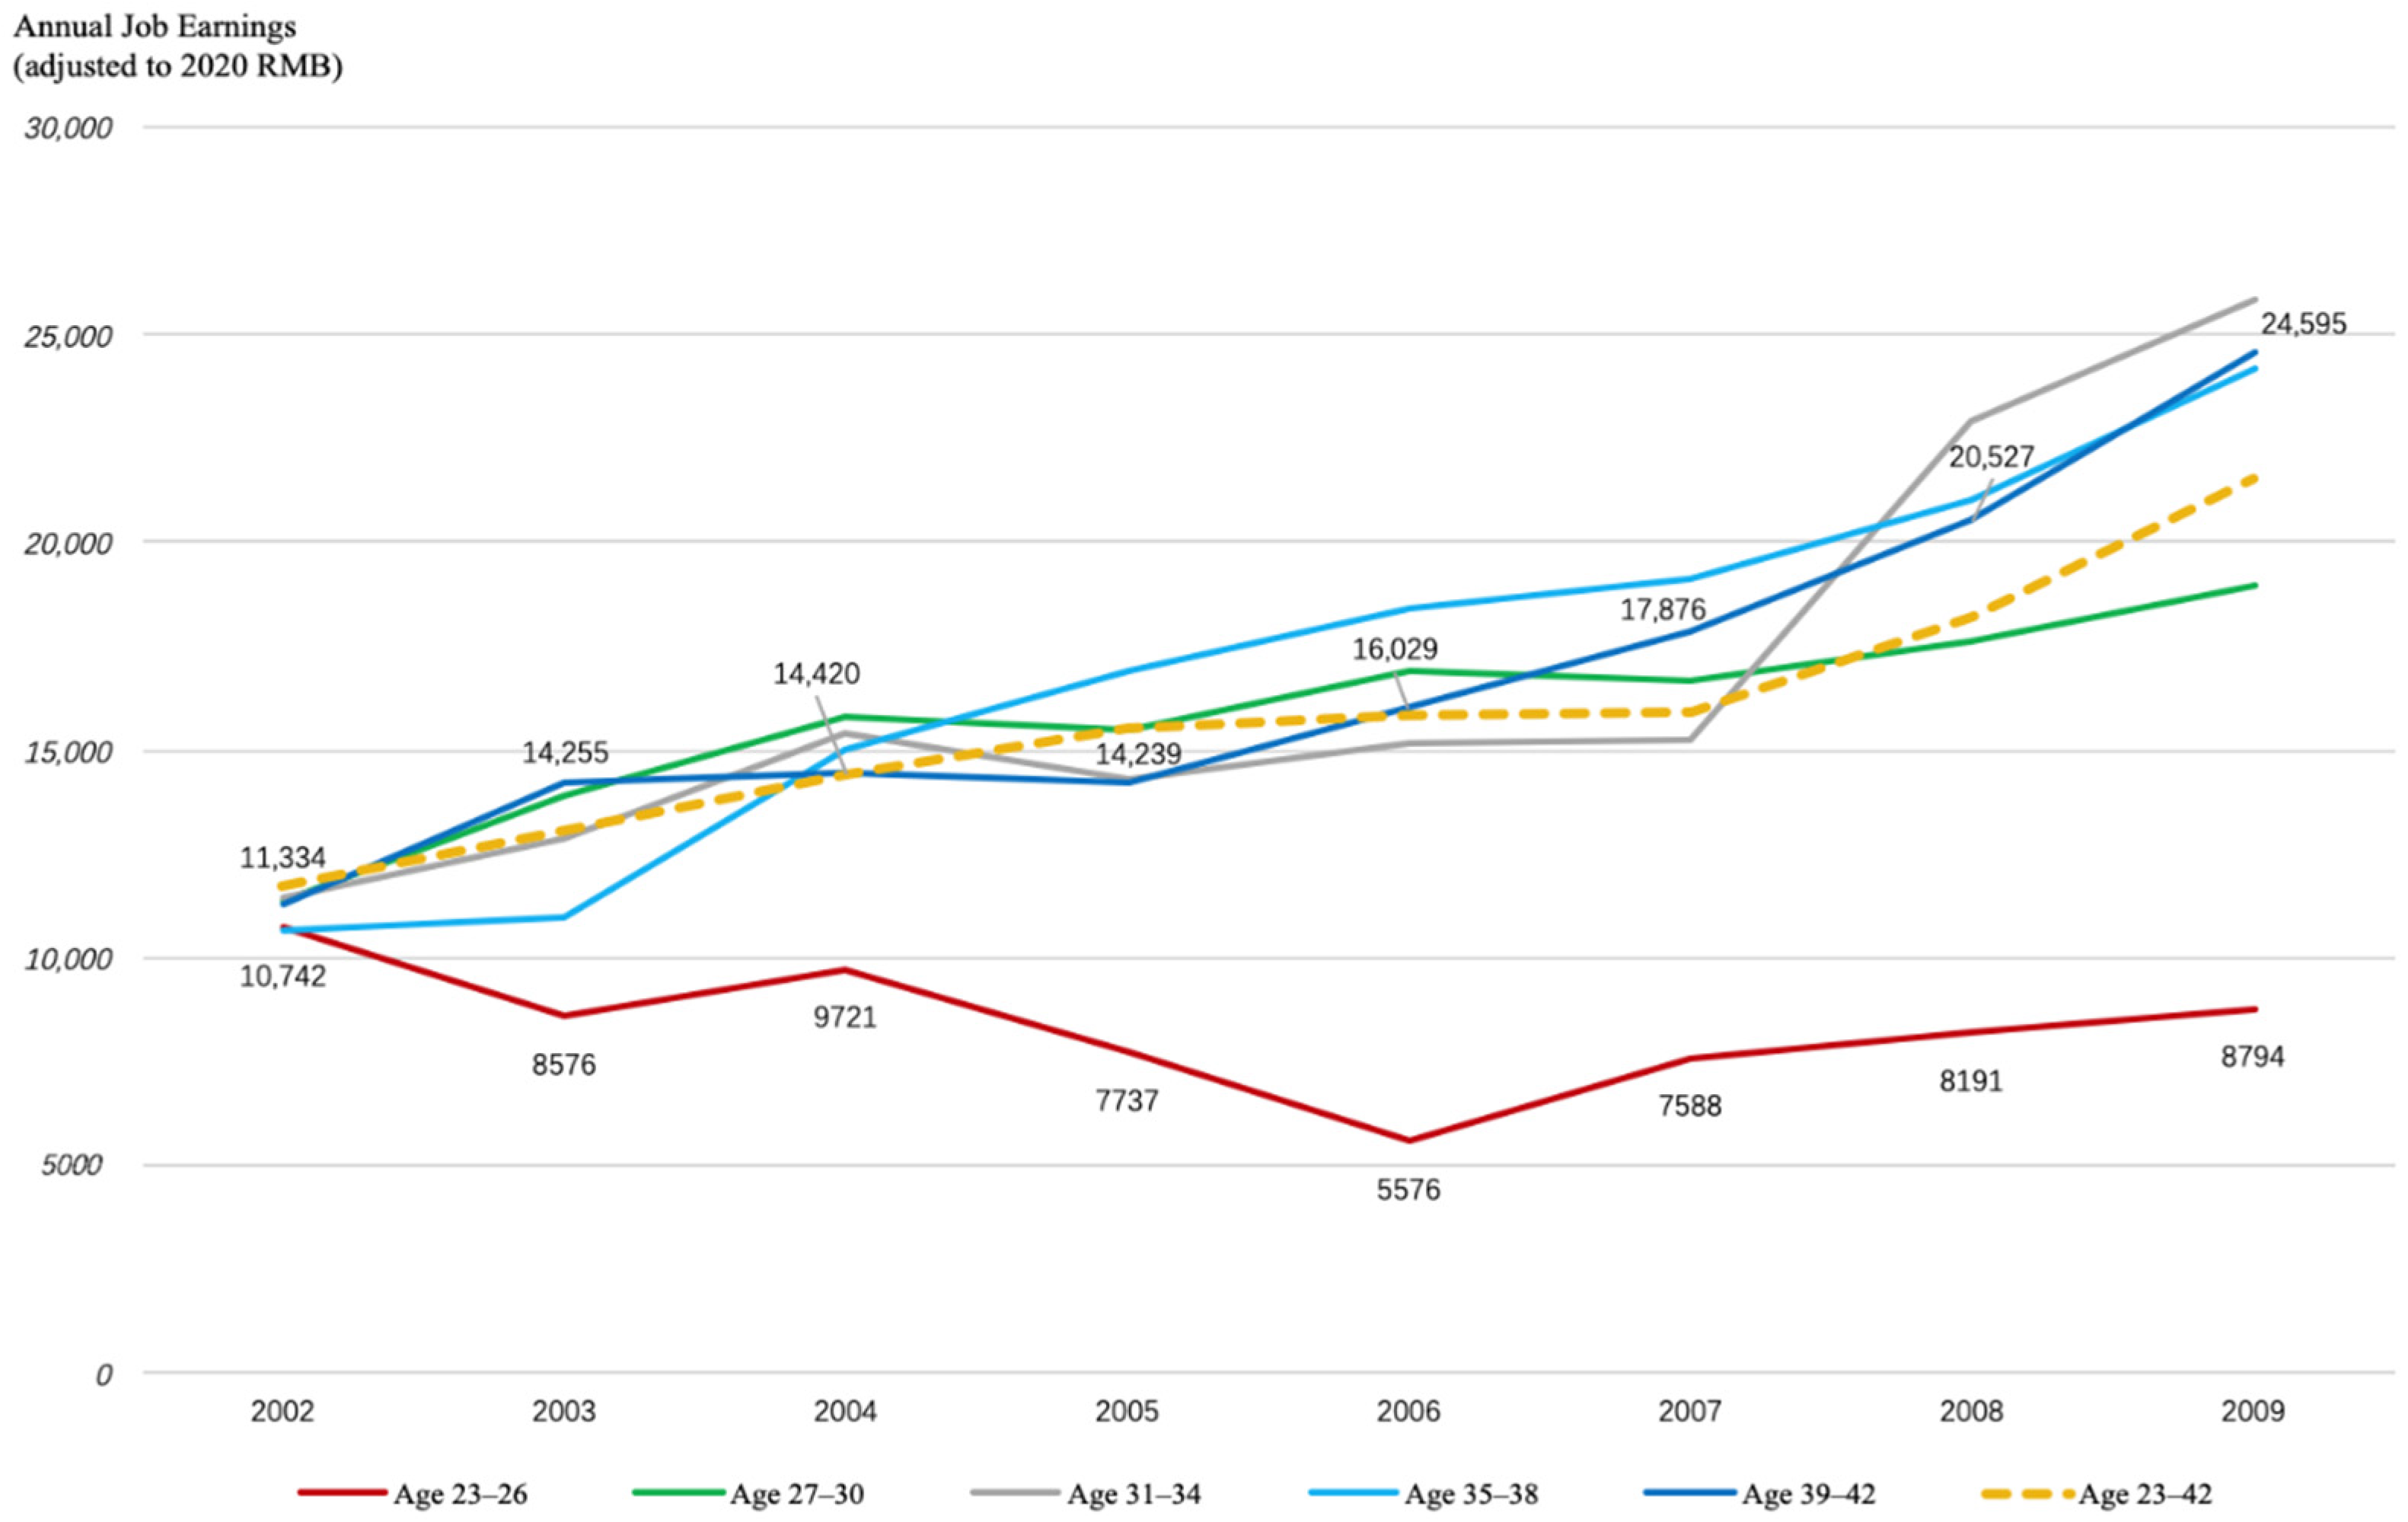
| 2002 | 2003 | 2004 | 2005 | 2006 | 2007 | 2008 | 2009 | |
|---|---|---|---|---|---|---|---|---|
| Age 23–26 | 10,742 | 8576 | 9721 | 7737 | 5576 | 7588 | 8191 | 8794 |
| Age 27–30 | 11,358 | 13,904 | 15,834 | 15,453 | 16,887 | 16,685 | 17,639 | 18,987 |
| Age 31–34 | 11,421 | 12,898 | 15,431 | 14,316 | 15,181 | 15,272 | 22,907 | 25,838 |
| Age 35–38 | 10,656 | 10,994 | 15,008 | 16,894 | 18,395 | 19,110 | 21,049 | 24,151 |
| Age 39–42 | 11,334 | 14,255 | 14,420 | 14,239 | 16,029 | 17,876 | 20,527 | 24,595 |
| Sample Mean (Age 23–42) | 11,754 | 13,078 | 14,429 | 15,548 | 15,862 | 15,955 | 18,222 | 21,497 |
| Number of observations: 52,483 | ||||||||
| 2002 | 2003 | 2004 | 2005 | 2006 | 2007 | 2008 | 2009 | |
|---|---|---|---|---|---|---|---|---|
| Age 23–26 | 0.455 | 0.364 | 0.436 | 0.405 | 0.234 | 0.336 | 0.323 | 0.311 |
| Age 27–30 | 0.621 | 0.595 | 0.616 | 0.584 | 0.625 | 0.602 | 0.593 | 0.595 |
| Age 31–34 | 0.488 | 0.505 | 0.640 | 0.457 | 0.464 | 0.457 | 0.571 | 0.589 |
| Age 35–38 | 0.495 | 0.463 | 0.566 | 0.578 | 0.514 | 0.545 | 0.603 | 0.574 |
| Age 39–42 | 0.502 | 0.556 | 0.557 | 0.538 | 0.509 | 0.524 | 0.625 | 0.610 |
| Sample Mean (Age 23–42) | 0.526 | 0.533 | 0.585 | 0.542 | 0.484 | 0.493 | 0.541 | 0.561 |
| Number of observations: 46,972 | ||||||||
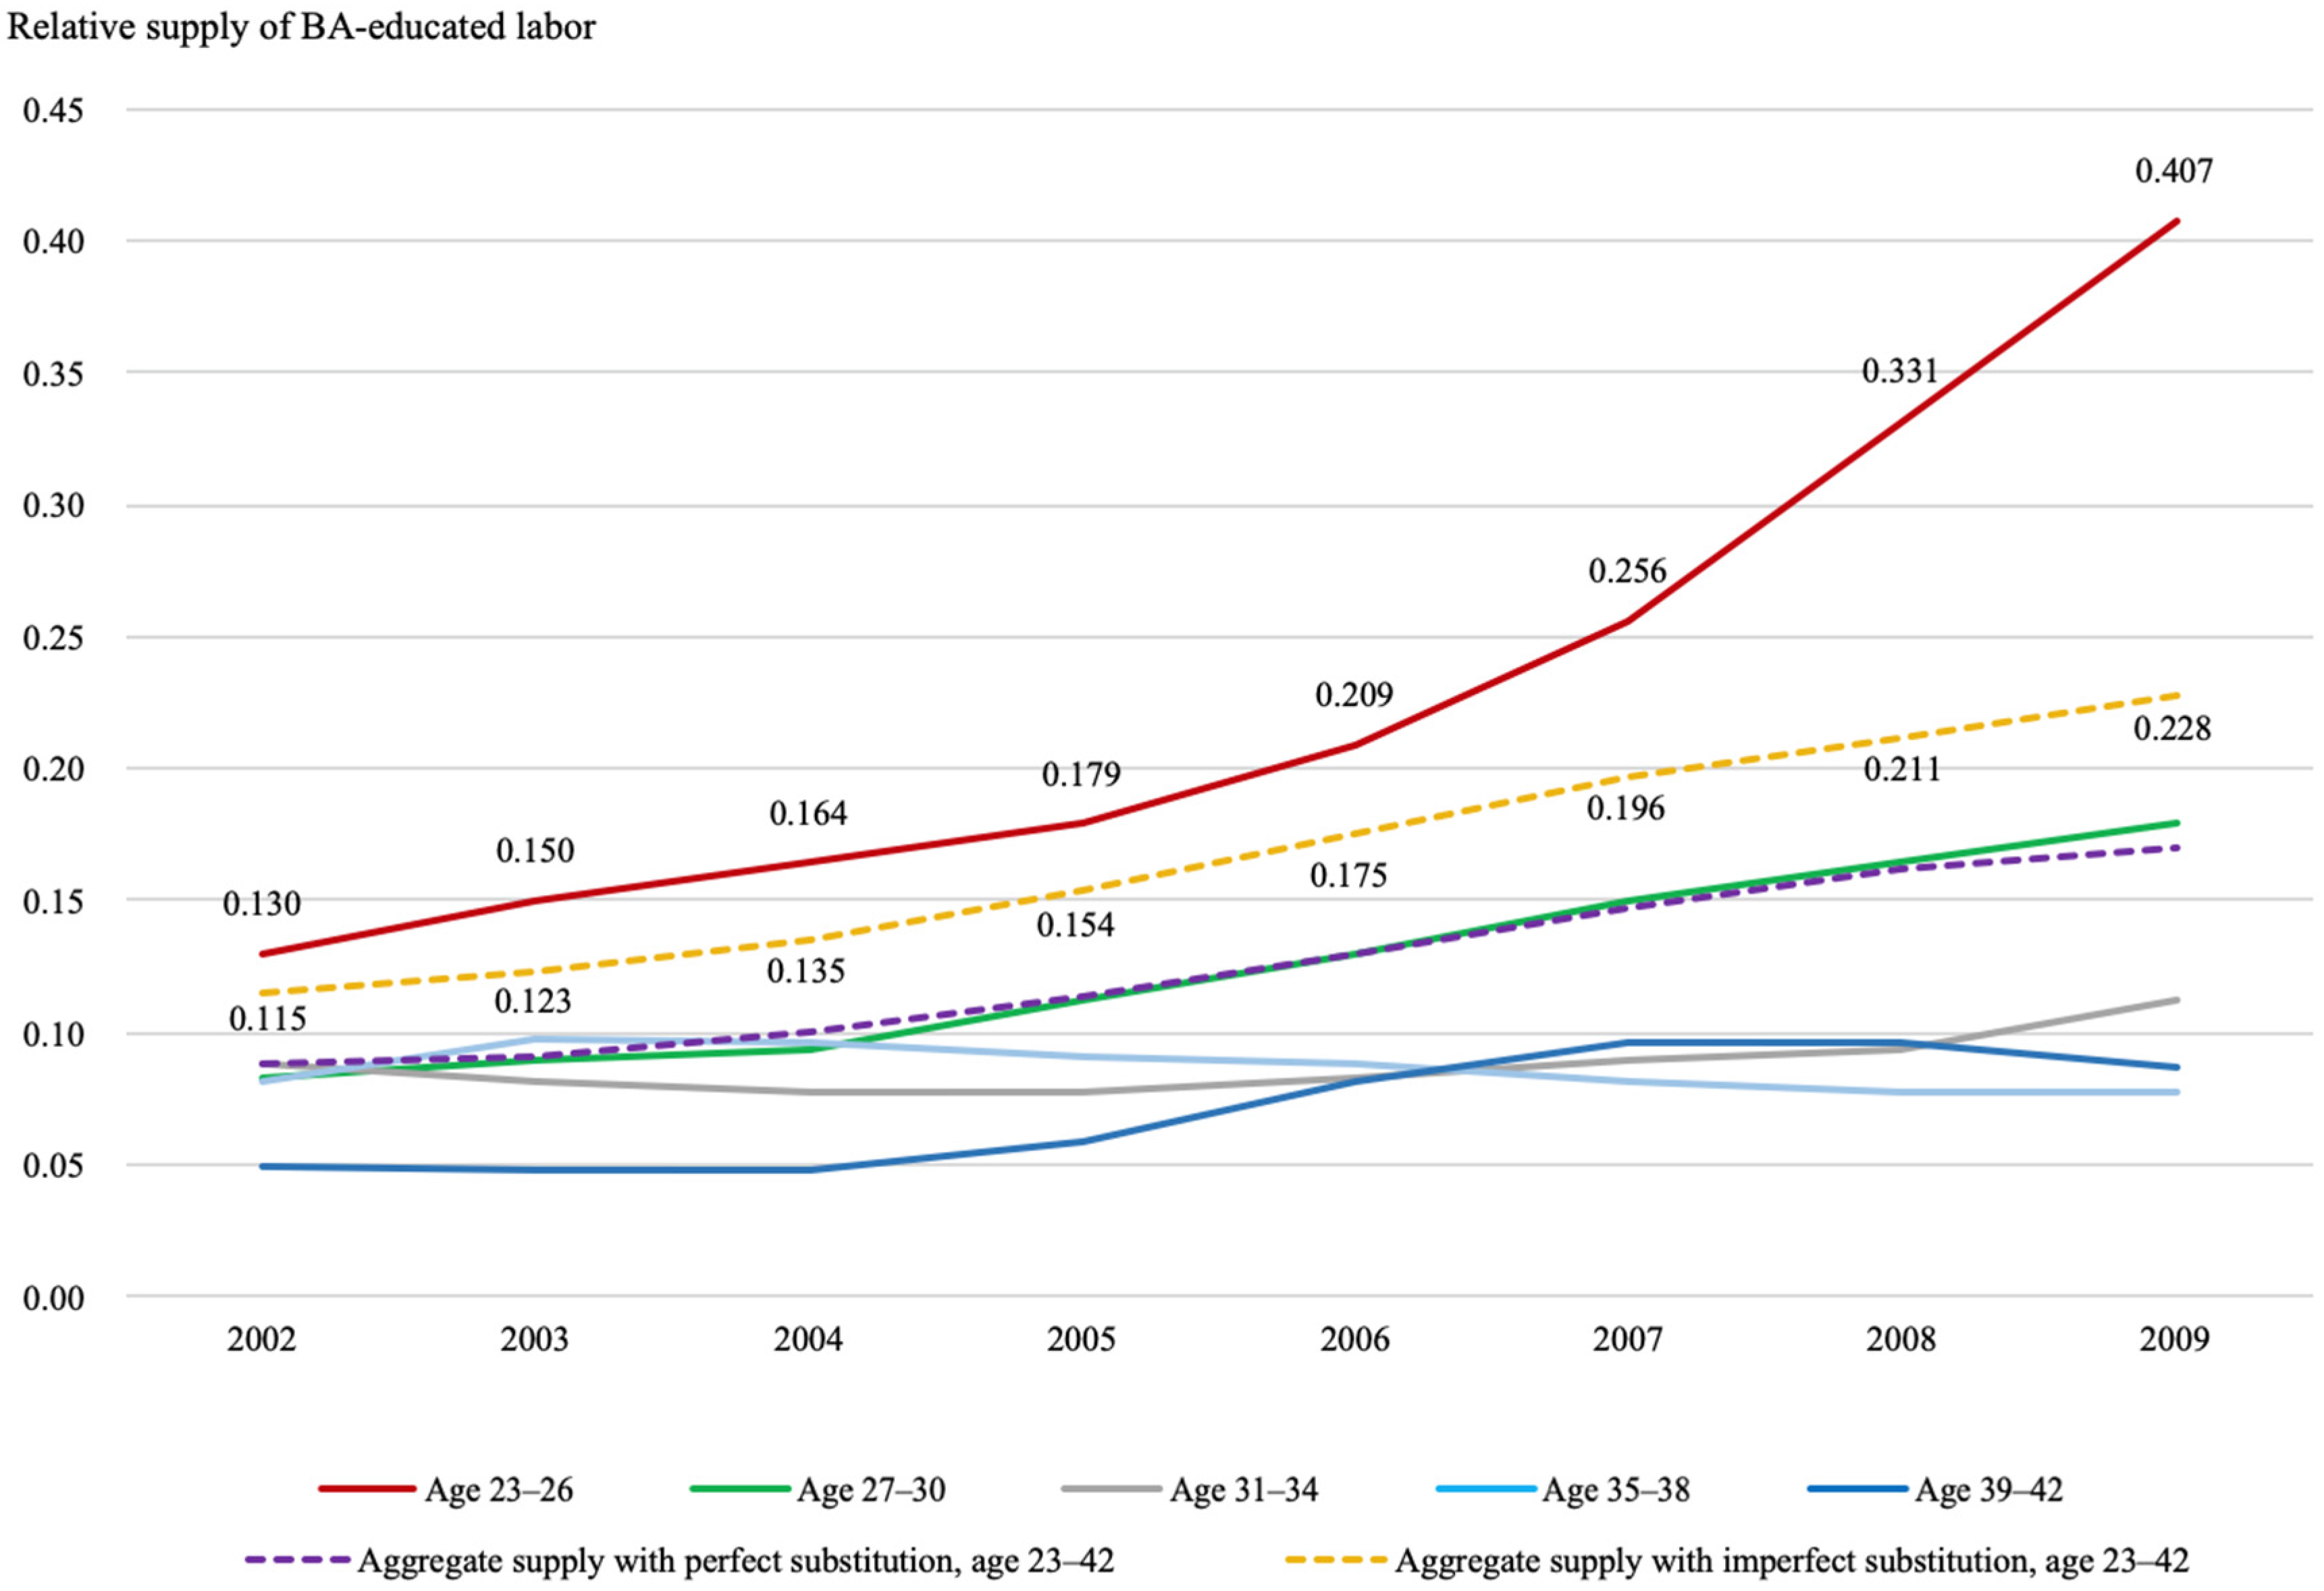
| Measures of Relative Supply of BA/HS Labor | Survey Year | |||||||
|---|---|---|---|---|---|---|---|---|
| 2002 | 2003 | 2004 | 2005 | 2006 | 2007 | 2008 | 2009 | |
| Age-group-specific relative supply: | ||||||||
| Age 23–26 | 0.130 | 0.150 | 0.164 | 0.179 | 0.209 | 0.256 | 0.331 | 0.407 |
| Age 27–30 | 0.083 | 0.089 | 0.094 | 0.113 | 0.130 | 0.150 | 0.164 | 0.179 |
| Age 31–34 | 0.088 | 0.081 | 0.077 | 0.078 | 0.083 | 0.089 | 0.094 | 0.113 |
| Age 35–38 | 0.082 | 0.098 | 0.097 | 0.091 | 0.088 | 0.081 | 0.077 | 0.078 |
| Age 39–42 | 0.050 | 0.048 | 0.047 | 0.058 | 0.082 | 0.096 | 0.097 | 0.086 |
| Aggregate relative supply (aged 23–42): | ||||||||
| with perfect substitution across age groups | 0.089 | 0.091 | 0.101 | 0.114 | 0.130 | 0.147 | 0.162 | 0.170 |
| with imperfect substitution across age groups | 0.115 | 0.123 | 0.135 | 0.154 | 0.175 | 0.196 | 0.211 | 0.228 |
| Model 1 | Model 2 | Model 3 | ||||
|---|---|---|---|---|---|---|
| Age-group-specific relative supply of BA-educated labor | −0.199 | *** | −0.193 | *** | −0.195 | *** |
| (0.005) | (0.005) | (0.005) | ||||
| Aggregate relative supply of BA-educated labor with perfect substitution across age groups | --- | −4.904 | *** | --- | ||
| --- | (0.237) | --- | ||||
| Aggregate relative supply of BA-educated labor with imperfect substitution across age groups | --- | --- | −0.560 | *** | ||
| --- | --- | (0.049) | ||||
| Annual temporal trend | --- | 0.593 | *** | 0.095 | *** | |
| --- | (0.027) | (0.008) | ||||
| Age effects (Age 23–26 as base): | ||||||
| Age 27–30 | 0.411 | *** | 0.413 | *** | 0.412 | *** |
| (0.005) | (0.005) | (0.005) | ||||
| Age 31–34 | 0.395 | *** | 0.398 | *** | 0.397 | *** |
| (0.006) | (0.006) | (0.006) | ||||
| Age 35–38 | 0.398 | *** | 0.403 | *** | 0.401 | *** |
| (0.006) | (0.006) | (0.006) | ||||
| Age 39–42 | 0.270 | *** | 0.274 | *** | 0.274 | *** |
| (0.007) | (0.007) | (0.007) | ||||
| Including survey year fixed effects | YES | NO | NO | |||
| Number of observations | N = 46,972 | |||||
| R-square | 0.510 | 0.781 | 0.890 | |||
| Model 1 | Model 2 | Model 3 | ||||
|---|---|---|---|---|---|---|
| Age-group-specific relative supply of BA-educated labor | −0.156 | *** | −0.180 | *** | −0.163 | *** |
| (0.005) | (0.005) | (0.005) | ||||
| Aggregate relative supply of BA-educated labor with perfect substitution across age groups | --- | −6.894 | *** | --- | ||
| --- | (0.106) | --- | ||||
| Aggregate relative supply of BA-educated labor with imperfect substitution across age groups | --- | --- --- | −0.833 | *** | ||
| --- | (0.091) | |||||
| Annual temporal trend | --- | 0.740 | *** | 0.079 | *** | |
| --- | (0.012) | (0.008) | ||||
| Age effects (age 23–26 as base): | ||||||
| Age 27–30 | 0.364 | *** | 0.357 | *** | 0.363 | *** |
| (0.005) | (0.006) | (0.006) | ||||
| Age 31–34 | 0.369 | *** | 0.352 | *** | 0.369 | *** |
| (0.006) | (0.007) | (0.006) | ||||
| Age 35–38 | 0.371 | *** | 0.352 | *** | 0.372 | *** |
| (0.006) | (0.006) | (0.006) | ||||
| Age 39–42 | 0.258 | *** | 0.234 | *** | 0.258 | *** |
| (0.007) | (0.007) | (0.007) | ||||
| Including survey year fixed effects | YES | NO | NO | |||
| Number of observations | N = 72,494 | |||||
| R-square | 0.441 | 0.762 | 0.854 | |||
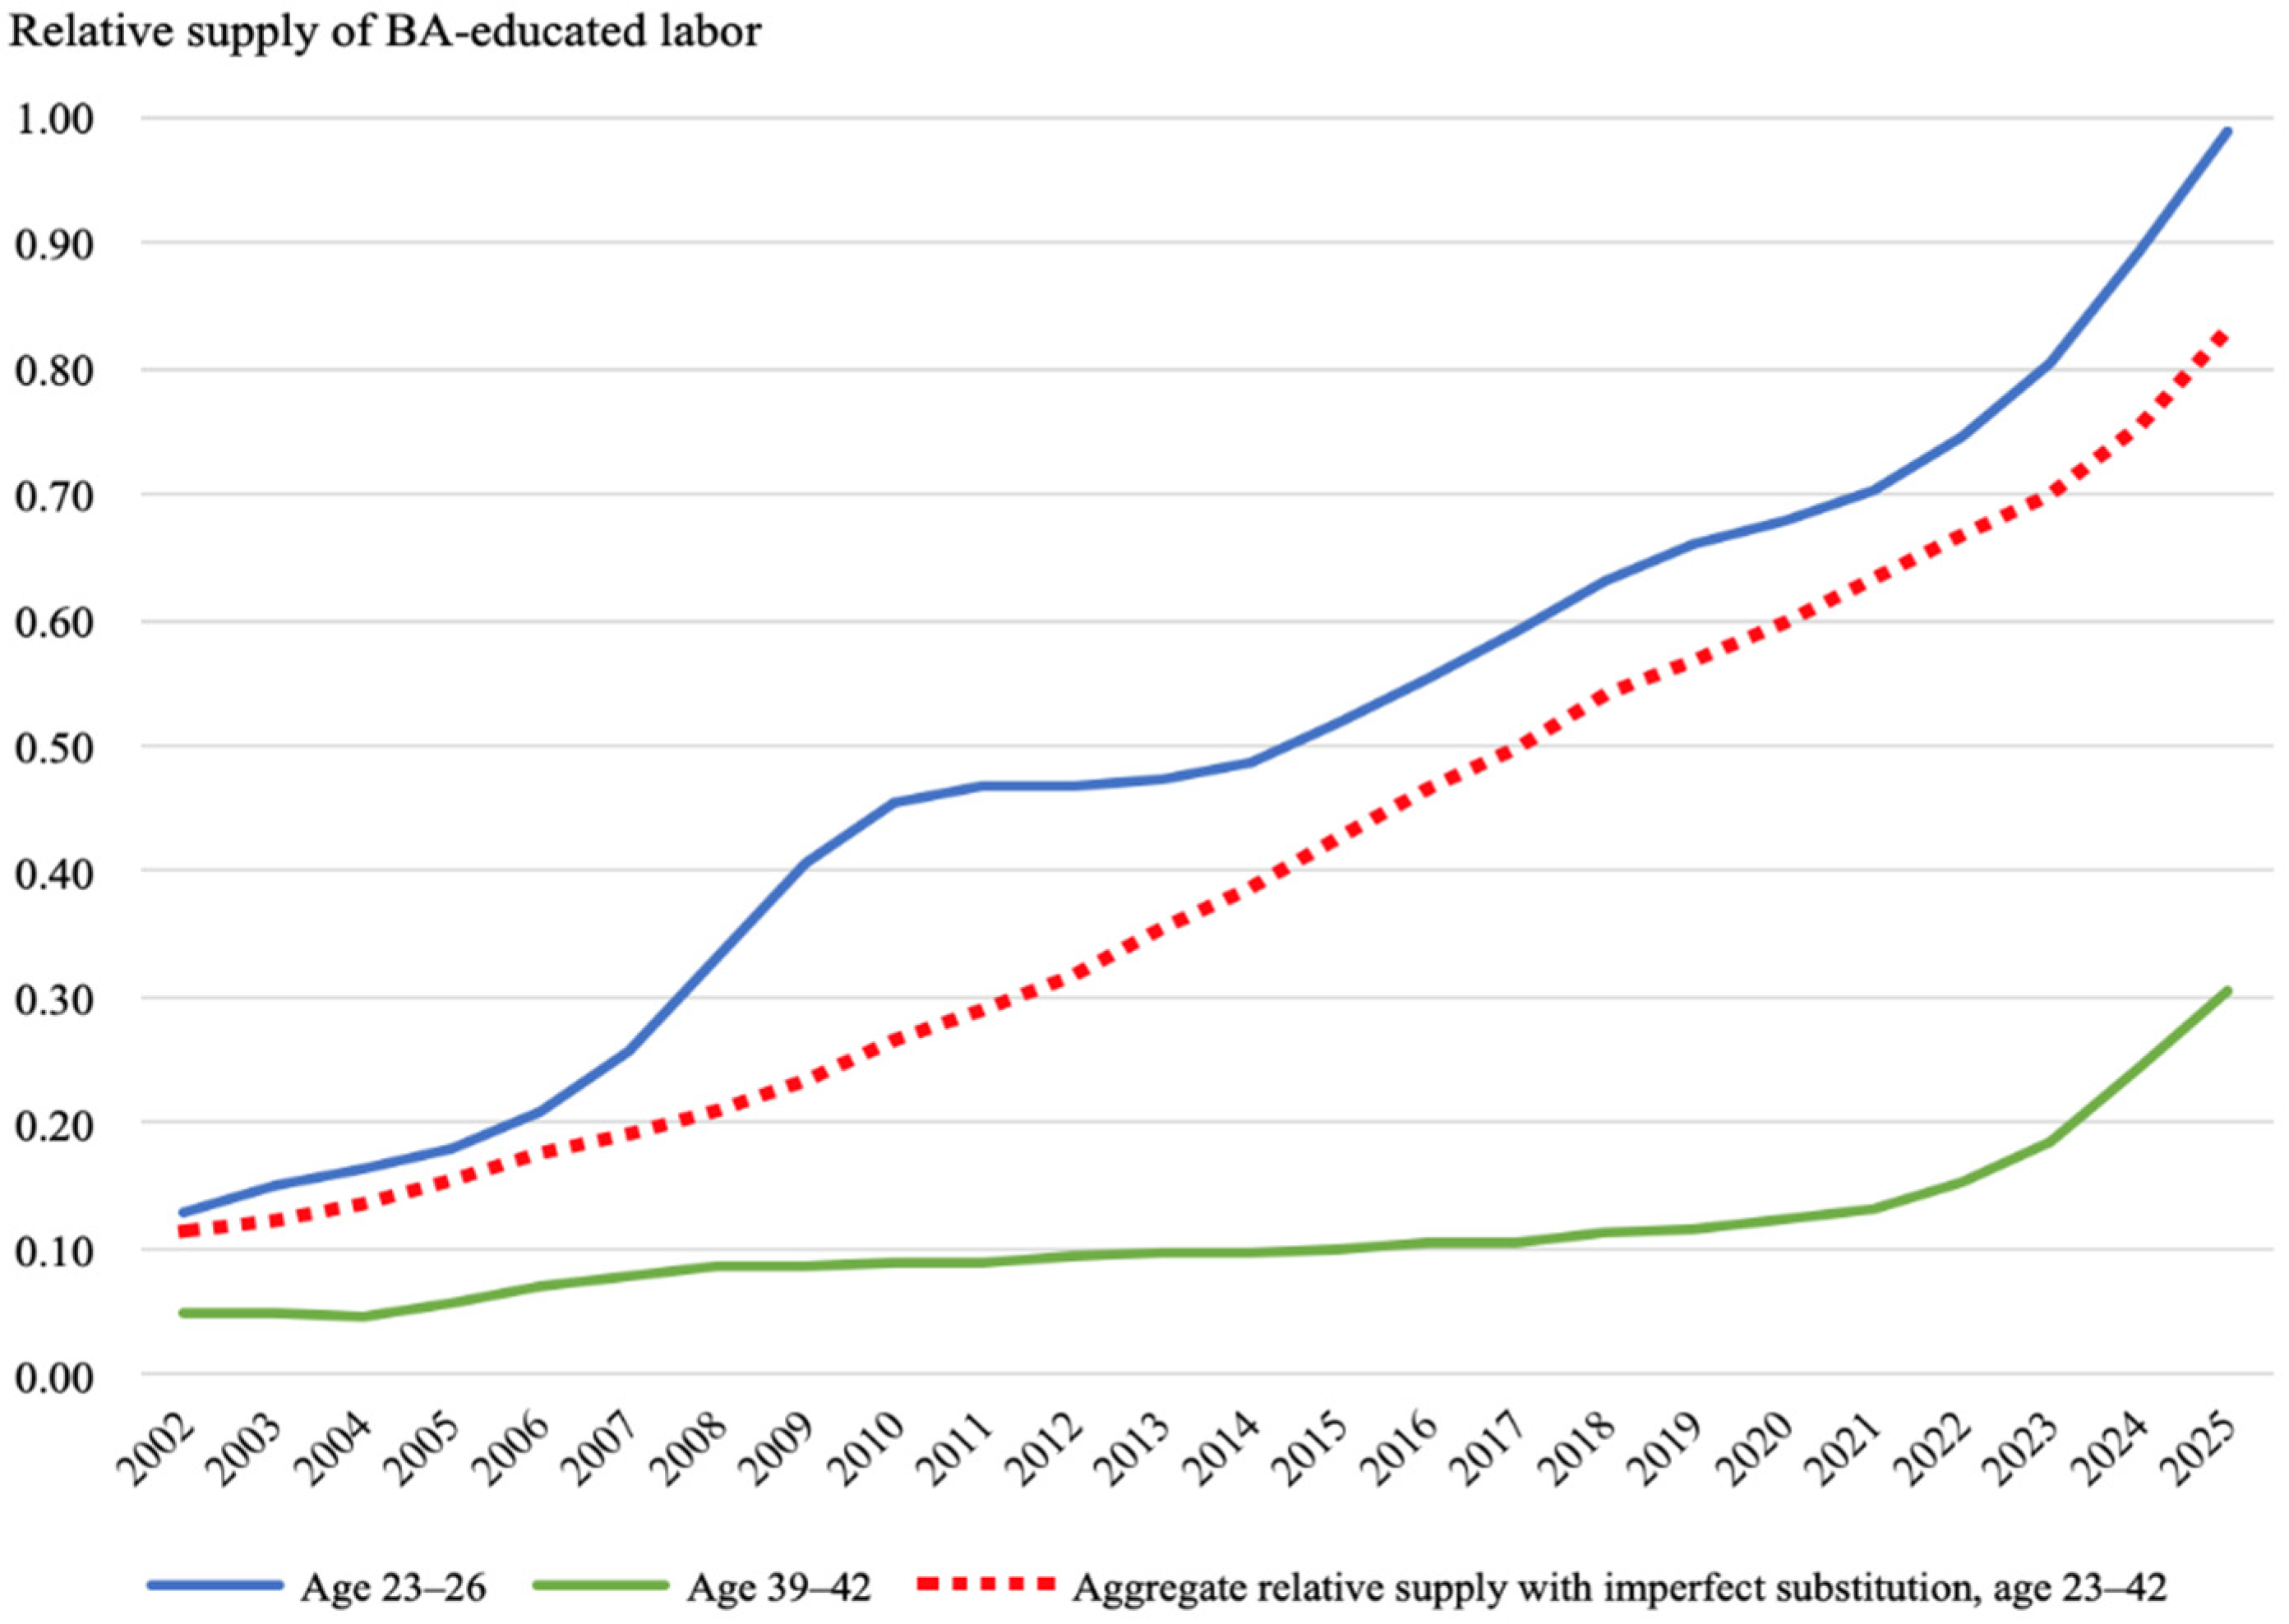
| Survey Year | ||||||||||||||||
|---|---|---|---|---|---|---|---|---|---|---|---|---|---|---|---|---|
| 2010 | 2011 | 2012 | 2013 | 2014 | 2015 | 2016 | 2017 | 2018 | 2019 | 2020 | 2021 | 2022 | 2023 | 2024 | 2025 | |
| Age-group-specific relative supply: | ||||||||||||||||
| Age 23–26 | 0.454 | 0.469 | 0.468 | 0.473 | 0.487 | 0.519 | 0.552 | 0.590 | 0.632 | 0.661 | 0.678 | 0.704 | 0.745 | 0.804 | 0.891 | 0.989 |
| Age 27–30 | 0.206 | 0.251 | 0.331 | 0.414 | 0.454 | 0.443 | 0.424 | 0.412 | 0.426 | 0.430 | 0.434 | 0.464 | 0.488 | 0.517 | 0.552 | 0.610 |
| Age 31–34 | 0.129 | 0.149 | 0.159 | 0.169 | 0.195 | 0.237 | 0.312 | 0.384 | 0.385 | 0.389 | 0.390 | 0.382 | 0.380 | 0.385 | 0.411 | 0.440 |
| Age 35–38 | 0.083 | 0.089 | 0.092 | 0.111 | 0.127 | 0.146 | 0.157 | 0.166 | 0.215 | 0.233 | 0.307 | 0.384 | 0.421 | 0.422 | 0.410 | 0.409 |
| Age 39–42 | 0.088 | 0.090 | 0.095 | 0.097 | 0.098 | 0.101 | 0.104 | 0.106 | 0.114 | 0.116 | 0.124 | 0.132 | 0.152 | 0.185 | 0.244 | 0.304 |
| Aggregate relative supply with imperfect substitution across age groups: | ||||||||||||||||
| Age 23–42 | 0.266 | 0.290 | 0.317 | 0.354 | 0.388 | 0.426 | 0.467 | 0.499 | 0.549 | 0.567 | 0.596 | 0.632 | 0.673 | 0.699 | 0.754 | 0.833 |
| 2009 (as Baseline) | 2013 | 2018 | 2022 | 2025 | |||||||
|---|---|---|---|---|---|---|---|---|---|---|---|
| Wage Gap | Δ Wage Gap | Predicted Wage Gap | Wage Gap Using CHIP Data | Δ Wage Gap | Predicted Wage Gap | Wage Gap Using CHIP Data | Δ Wage Gap | Predicted Wage Gap | Δ Wage Gap | Predicted Wage Gap | |
| Age 23–26 | 0.311 | 0.04 | 0.324 | 0.336 | −0.05 | 0.295 | 0.302 | −0.10 | 0.280 | −0.36 | 0.201 |
| Age 27–30 | 0.595 | −0.19 | 0.482 | 0.479 | −0.33 | 0.399 | 0.375 | −0.28 | 0.428 | −0.55 | 0.267 |
| Age 31–34 | 0.589 | −0.03 | 0.573 | 0.565 | −0.40 | 0.353 | 0.387 | −0.41 | 0.349 | −0.65 | 0.207 |
| Age 35–38 | 0.574 | −0.01 | 0.567 | 0.573 | −0.29 | 0.410 | 0.401 | −0.81 | 0.108 | −0.92 | 0.048 |
| Age 39–42 | 0.610 | 0.04 | 0.637 | 0.606 | −0.06 | 0.572 | 0.542 | −0.09 | 0.556 | −0.58 | 0.257 |
| Age 23–42 | 0.561 | −0.13 | 0.488 | 0.497 | −0.26 | 0.414 | 0.403 | −0.38 | 0.348 | −0.65 | 0.196 |
Publisher’s Note: MDPI stays neutral with regard to jurisdictional claims in published maps and institutional affiliations. |
© 2022 by the author. Licensee MDPI, Basel, Switzerland. This article is an open access article distributed under the terms and conditions of the Creative Commons Attribution (CC BY) license (https://creativecommons.org/licenses/by/4.0/).
Share and Cite
Wen, Q. Trends in College–High School Wage Differentials in China: The Role of Cohort-Specific Labor Supply Shift. Sustainability 2022, 14, 16917. https://doi.org/10.3390/su142416917
Wen Q. Trends in College–High School Wage Differentials in China: The Role of Cohort-Specific Labor Supply Shift. Sustainability. 2022; 14(24):16917. https://doi.org/10.3390/su142416917
Chicago/Turabian StyleWen, Qiao. 2022. "Trends in College–High School Wage Differentials in China: The Role of Cohort-Specific Labor Supply Shift" Sustainability 14, no. 24: 16917. https://doi.org/10.3390/su142416917
APA StyleWen, Q. (2022). Trends in College–High School Wage Differentials in China: The Role of Cohort-Specific Labor Supply Shift. Sustainability, 14(24), 16917. https://doi.org/10.3390/su142416917


