Article

The Dynamic Evolution of the Material Flow of Lithium Resources in China

School of Resources and Safety Engineering, Central South University, Changsha 410083, China
*
Authors to whom correspondence should be addressed.
Sustainability 2022, 14(24), 16928; https://doi.org/10.3390/su142416928
Submission received: 20 November 2022 / Revised: 4 December 2022 / Accepted: 15 December 2022 / Published: 16 December 2022
(This article belongs to the Section Economic and Business Aspects of Sustainability)

Abstract

:
As a strategic emerging mineral resource, lithium is widely used in new energy, new materials and other emerging industries. There exists a changing trend of the material flow, consumption and evolution of lithium resources in the market. Thus, this research constructed a material flow analysis system for lithium resources based on the trade correlation of the whole life cycle. The study used the material flow analysis method to analyze the supply, flow and stock of lithium resources in China from 2007 to 2020. The research shows that during that timeframe, China’s cumulative consumption of lithium resources equivalent to lithium carbonate reached 309.9348 kiloton (kt). The consumption of lithium in traditional and lithium electric fields increased from 14.3653 kt and 8.08228 kt in 2007 to 49.53125 kt and 90.75866 kt in 2020, respectively. From 2007 to 2011, the consumption of lithium in the traditional sector was greater than that in the lithium electric sector. From 2012 to 2020, with the innovation of network technology and the boom in the New energy vehicles (NEV) market, the market for consumer lithium and power lithium grew rapidly, and the field of lithium with power batteries as the main driving force gradually became the major contributor to the consumption of lithium resources. With the rapid increase in the consumption demand for lithium resources, the supply structure of lithium resources in China has changed from domestic supply to international import. The external dependence of lithium resources has increased from 29.74% in 2007 to 70.75% in 2020. With increasing lithium consumption, the storage of lithium batteries increased from 20.69721 kt in 2007 to 341.6322 kt in 2020. At the same time, the scrap volume of lithium batteries increased rapidly, but the recycling volume of lithium resources was far lower than the scrap volume. The resource recycling potential is huge, and there is still a lot of room for the development of the sequential utilization of waste lithium-ion batteries.

1. Introduction

Lithium is the lightest metallic element. For a long time lithium was used as an industrial raw material for the production of grease, glass, ceramics, etc. because of its physical and chemical properties such as low density, high hardness, high melting point, and high reactivity. But since 2000, the market for lithium batteries in mobile information and communication technologies has been growing and lithium has received more attention. After 2015, with the development of electric vehicles and the development of a new generation of information technology, lithium has become more and more versatile. As an emerging industrial [1] and strategic resource [2], lithium mineral resources are widely used in various emerging strategic industrial fields [3,4], and they are among the strategic mineral resources first released in China during the 14th Five-Year Plan period. According to the latest classification of strategic and emerging industries released by the National Bureau of Statistics, lithium mineral resources are mainly used in the manufacturing of high energy storage materials in the field of the new-generation information technology industry; the glass and ceramic manufacturing industry in the field of new materials industry; the artificial crystal manufacturing industry; the inorganic salt manufacturing industry in the manufacturing of secondary battery materials; and the lithium-ion battery manufacturing industry in the field of new energy vehicle industry, among others [3,4]. The application of lithium mineral resources is related to the development of strategic emerging industries of the country, this also means that the consumption of lithium is growing rapidly.
The total amount of lithium resources currently available for exploitation worldwide is abundant and highly concentrated. According to the US Geological Survey, by the end of 2021, the global lithium resources identified were 89 million tonnes. South America is the richest in lithium resources, accounting for 58% of the world’s lithium resources. Lithium resources in South America are concentrated in the “Lithium Triangle” region, mainly in the brine type lithium resources, mainly in the Uyuni Salt Lake Lithium Mine, Potosi Province, Bolivia, with proven lithium reserves of 5.5 million tons and lithium oxide resources of about 18 million tons; Atacama Salt Lake Lithium Mine, Antofagasta Province, Chile, with lithium oxide resources of about 5.3 million tonnes; Litho saline lithium mine in Rio Tinto, Antofagasta Province, Chile, with a lithium metal content of 502,000 tonnes and a lithium grade of 0.157%; Umbremuelto saline lithium mine in Salta Province, Argentina, with a lithium oxide resource of approximately 850,000 tonnes; Gauchal Olaros saline lithium mine in Jujuy Province, Argentina, with a lithium metal content of 2,740,240 tonnes and a lithium grade of 0.06% and The lithium reserves are 517,120,000 tonnes; the Vida saline-type lithium mine in Catamarca Province, Argentina, has a lithium oxide resource of 1,573,000 tonnes and lithium oxide reserves of 214,000 tonnes. The lithium resources of South America’s salt lakes are not only rich in reserves, but also have the best lithium resource grade in the world, with a generally small Mg2+/Li+. Among them, Chile’s Atacama Salt Lake has the best resource endowment and is the best target for the development of salt lake lithium resources.
China’s lithium resources are dominated by salt lake brine-type lithium ores. The development of Chinese brines has long been plagued by high magnesium to lithium ratios, but with the development of selective adsorbents and membranes, the possibility of recovering lithium from seawater or concentrating seawater desalination to obtain lithium is gradually being realised by people, which brings new avenues for the development of China’s lithium resources [5,6,7,8]. However, it will take some time for the large-scale application of these technologies to be realised yet. Currently, China’s lithium resources are mainly supplemented by imports, and China’s external dependence on lithium resources has increased from 30% in 2007 to 70.8% in 2020. China is a major country in lithium resource production and trade [9,10,11]. In-depth analysis of the flow direction, consumption and evolution of lithium resources in China, as well as grasping future development trends, are of great significance for the sustainable development of the lithium industry.
Material flow analysis is a quantitative analysis method based on the law of conservation of mass, which studies the material flow and stock within the socioenvironmental system with specific space-time boundaries [12]. Material flow analysis reflects the whole life cycle process of resources in socioeconomic systems from exploitation and production, processing and manufacturing, to waste management and final disposal. In recent years, material flow analysis has been applied to various industrial levels, such as iron [13], aluminum [14,15,16], copper [17], zinc [18], silver [19], chromium [20], nickel [21], lead [22] and other mineral resources that are of great significance to the national economy. In terms of the material flow analysis of lithium resources, scholars have also carried out relevant studies on a global scale. For example, Ziemann et al. developed the first global lithium static material flow model based on lithium production, manufacturing and use data in 2007 [23]. Baars et al. developed a material flow analysis model for cobalt in lithium-ion batteries in electric vehicles in the EU in 2017 and found that battery technology reduced the demand for cobalt but increased the demand for nickel [24]. Sun et al. developed a trade-related lithium material flow analysis framework to quantitatively track the international trade of lithium between specific countries in 2014 [25]. Hao et al. analyzed the static lithium elemental flow in China in 2015 and showed that China accounted for half of the total global consumption of lithium carbonate in 2015 and that the stock of lithium use in the socioeconomic system is mainly in electronic products such as computers and cell phones [26]. Although these studies reveal lithium flows at multiple levels, they only consider short time periods (usually one year), but do not provide a clear picture of trends in lithium flows. Some scholars have conducted a dynamic analysis of lithium material flow analysis. Lu et al. used material flow analysis to conduct a dynamic analysis of lithium stocks and flows in China from 2007 to 2014 [27]. However, after 2015, when the Chinese electric vehicle market started to explode on a large scale and the lithium storage gradually developed, the demand for lithium resources in China grew significantly and the lithium consumption situation changed greatly, and the existing studies have not conducted a dynamic analysis of lithium material flow in China for the emergence of these new situations, so it is necessary to update the material flow analysis of lithium resources in China.
Therefore, this study establishes a life-cycle lithium resource material flow analysis system to analyze the dynamic material flow of China’s lithium resources from 2007 to 2020. In addition, the study examines the evolution process of China’s lithium resource consumption and analyzes the reasons for the change in its consumption structure.

2. Materials and Methods

2.1. System Boundary and Analysis System

The research system boundary of mass flow analysis includes the space and time boundary [28]. The spatial boundary of this study is mainland China, and the time boundary is from 2007 to 2020. The analytical framework of the material flow of lithium resources can be divided into four parts: (1) the mining stage, (2) the production and processing stage, (3) the manufacturing and use stage, and (4) the waste treatment stage, as shown in Figure 1. In this paper, the final product application of lithium is reflected in glass ceramics, air treatment, lithium grease, medicine and lithium batteries. Due to the lack of data, for the material flow situation of other lithium products, the specific breakdown data are not given, but are uniformly included in other applications.

2.2. Analysis Process

Dynamic material flow is used to analyze the flow and in-use stock of lithium products in China from 2007 to 2020. Lithium products comply with the law of mass conservation in flow engineering [29], and the in-use stock of lithium products is calculated using Equation (1):
S t o c k i , t l i = t o t A C i , t l i R i , t l i
where, S t o c k i , t l i ,   A C i , t l i and R i , t l i are the in-use stock, apparent consumption and waste amount of lithium-containing products, respectively, measured by the mass of lithium carbonate in year t. The waste amount is calculated by Equation (2) as follows:
R i , t l i = t o t L i ( t , t ) × A C i , t l i
L i ( t , t ) is a lifetime distribution function defined in discrete time series [0,1,2,…,t,…], which represents the probability that the in-use stock of class i generated in year t = 0 will be abandoned in year t. In L i ( t , t ) , t is the time step in years, and t is the specific year in the new traffic input system. To facilitate calculation, the units of each variable are converted to tLCE units according to the conversion coefficient.

2.2.1. Mining Stage

Lithium mining mainly includes two categories: solid lithium mining and salt-lake lithium extraction. Solid-type lithium ore is composed of granite-type lithium ore and sedimentary rock-type lithium ore, of which granite-type lithium ore is the main development object. Sedimentary rock-type lithium ore belongs to the new trend of lithium resource development. The raw material supply of lithium resources in China is divided into two parts: domestic exploitation and foreign import. Domestic lithium mineral resource reserves are abundant, accounting for 5.88% of global reserves [30]. However, the resource endowment is low, the solid-type lithium ore grade is lower than the average grade abroad lithium ore, and the ratio of magnesium to lithium in salt-lake brines is much higher than the high level. Lithium resource distribution is focused on natural conditions, the ecological environment is a fragile region in western China, and the production cost is higher than the average cost abroad [31]. Therefore, at present, China’s lithium resources are mainly imported from spodumene in Australia [32].
The data on lithium consumption, lithium salt production and lithium ore production came from the Lithium Branch of the China Nonferrous Metals Industry Association [33]. Some data on the global lithium resource consumption structure and lithium ore production came from the United States Geological Survey [34]. Lithium salt import and export data are from the United Nations Commodity Trade Database [35]. The calculation formula of domestic lithium ore and lithium salt output is shown in Equations (3) and (4):
A C m , t l i = P m , t l i + I m , t l i E m , t l i
A C m l c e , t l i = A C m , t l i × γ
In the formula, A C m , t l i , P m , t l i , I m , t l i , E m , t l i , A C m l c e , t l i are the domestic consumption, production, import, export and domestic consumption of lithium salt measured by the quality of lithium carbonate in year t, respectively. γ is the conversion coefficient of lithium salt. The conversion coefficient of lithium salt is shown in Table 1 below:

2.2.2. Chemical Production and Product Manufacturing Use

The main chemicals of lithium resources include lithium carbonate, lithium hydroxide, lithium chloride, lithium metal and their derivatives. Lithium oxide facilitates melting. Adding spodumene to glass and ceramic ingredients can reduce the melting temperature and melt viscosity, thus simplifying the glass and ceramic production process and reducing energy consumption. Industrial grade lithium hydroxide can be used to produce lithium grease. Industrial grade lithium chloride, after deep processing into lithium compounds, can be used in medicine, as catalysts, metal smelting and other fields. Lithium chloride is reduced to obtain lithium metal, which can be used to prepare primary batteries and lithium alloys or to process into butyl lithium. Lithium amine is used in medicine and new materials. The production data of lithium grease and glass ceramics came from the “China Light Industry Statistical Yearbook” [36]. The calculation of lithium consumption A C i n d , t l i in the traditional field is shown in Equation (5):
A C i n d , t l i = P i n d , t l i × C i n d , t p
where P i , t l i and C i , t p are the domestic output of class i lithium products measured by the mass of lithium carbonate and the mass percentage of lithium carbonate in lithium products in year t, respectively. The content of lithium carbonate in the traditional lithium consumption field is shown in Table 2.
Lithium salts, such as lithium carbonate and lithium hydroxide, are deeply processed to make cathode materials or electrolyte materials for batteries. At present, lithium-ion cathode materials mainly include lithium cobalt oxide, lithium nickel cobalt manganese oxide, lithium nickel cobalt aluminate, lithium manganese oxide, lithium iron phosphate and other types. Among them, lithium cobalt acid is mainly used in 3C consumer lithium-ion batteries. Lithium nickel cobalt manganate, lithium nickel cobalt aluminate and lithium iron phosphate are mainly used in power batteries and energy storage batteries. Lithium titanate can be used as an anode material in lithium batteries. Lithium hexafluorophosphate is used as an electrolyte in lithium-ion batteries. Lithium manganate is mainly used in low-speed electric vehicles. The output data of mobile phones, tablets, notebook computers, digital cameras and smart wearable devices are from the public data of the National Bureau of Statistics [37], the Ministry of Industry and Information Technology [38] and “China Electronic Information Industry Statistical Yearbook” [39]. The power consumption data of small power tools came from GGII [40]. The data of two-wheeled vehicles came from the website of the China Bicycle Association [41] and “China Light Industry Statistical Yearbook”. The production data of new energy vehicles came from the China Association of Automobile Manufacturers [42] and the China Auto Market Yearbook [43]. The energy consumption data in the energy storage field came from the energy storage research platform [44]. The output data of lithium batteries came from official data platforms, such as the Ministry of Industry and Information Technology and GGII, as well as from industry market reports and relevant references. The lithium consumption of a power battery A C E V , t l i is calculated by a top-down method, and its calculation formula is as follows:
A C E V , t l i = P E V , t l i × δ × μ × ε
where P E V , t l i is the domestic output of new energy vehicles measured by the quality of lithium carbonate in year t, δ is the proportion of installed cathode materials, μ is the weight of the cathode material, and ε is the lithium content in the cathode material. The amount of lithium used in the cathode material is shown in Table 3, and the proportion of the installed cathode material is shown in Table 4 below.

2.2.3. Waste Treatment Stage

Waste management of lithium products mainly includes two aspects: disassembly/recycling and landfill incineration. In traditional industrial products, the content of lithium is small, recovery is difficult, the cost of resource recovery is high, and the value is very small. Therefore, the dismantling and recovery of lithium is mainly applied in the field of lithium electricity. Lithium batteries are used in consumer batteries and energy storage batteries. After reaching battery life, some of them are dismantled for recycling, and the rest are directly treated as waste. In the application of power batteries, when the capacity of lithium batteries decays to 80%, it is no longer suitable to use in the vehicle. Retired power batteries can continue to play their residual role through being utilized in the field of energy storage.
The estimation of the scrapped amount of lithium battery is calculated using the usage stock and the life distribution function of lithium battery. In this paper, the Weibull life distribution function [28,45] widely used in mechanical, electronic, electrical and other products is applied to estimate the life of lithium batteries, and its probability density function is as follows:
L i ( t ; α , β ) = { β α ( t α ) β 1 e ( t α ) β               t 0 0                                                                     t < 0
t is the service life of the lithium battery, α is the scale parameter, and β is the shape parameter. The distribution function of the Weibull distribution is:
K ( t ) = 1 e ( t α ) β
If tmax is set as the longest service life of the lithium battery and tave is set as the average service life of the lithium battery, corresponding to the median value of the Weibull distribution density function curve, then:
t a v e t m a x β = β 1 β · ln 0.01
α = t a v e · 1 1 β 1 β
At present, the scrap life of Chinese cars is 12–15 years, which is greater than the service life of power batteries. All new energy vehicles that need to be replaced without scrapping the batteries continue to be put into use. In year t , the number of new energy vehicle power batteries M t includes annual sales volume S t in the year and power battery replacement volume E t in the year.
M t = S t + E t
The calculation formula of power battery replacement in the current year is:
E t = t L t × ( S t t + E t t )
where L_t is the life distribution function of the power battery, S t t is the sales volume of new energy vehicles in t t years, and E t t is the number of new energy vehicles requiring battery replacement in   t t years. Therefore, the scrap amount of the new energy vehicle power battery is:
B t = t L t × M t t
According to Equations (7)–(10), the calculation results of the parameters under different products of the lithium battery life distribution model are obtained, as shown in Table 5:
The life probability distribution under different lithium battery parameters is shown in Figure 2.

3. Results

3.1. Traffic Analysis

This paper summarized the dynamic material analysis flow chart of cumulative lithium resources in China from 2007 to 2020. A material flow chart based on the whole life cycle of lithium resources was produced, and the research made a specific analysis of the flow and stock of resource exploitation, chemical production, manufacturing and use, and waste management in the life cycle of lithium resources (Figure 3).

3.1.1. Mining Stage

Mining and chemical production has changed from domestic supply-led to import-led. As shown in Figure 4, from 2007 to 2020, the annual output of lithium mines in China took a changing form, with some stability at first and then rapid growth. From 2007 to 2014, benefiting from the recovery of demand for 3C consumer products, the production of lithium ore led by domestic lithium ore supply increased steadily from 23.4 kt in 2007 to 61.9 kt in 2014. However, the proportion of domestic lithium ore supply continued to decline from 68.46% in 2007 to 51% in 2013. At the beginning of 2014, methyl card spodumene, the largest spodumene mine in China, was forced to stop production due to environmental pollution, which directly led to a significant reduction in the supply of spodumene in China. The domestic supply of lithium ore accounted for only 41.52% of the total production of lithium salt in that year. In 2015, the boom of new energy vehicles and the blowout of downstream demand drove the demand for lithium salt. The output of lithium ore in China increased from 87 kt in 2016 to 288.6 kt in 2020. The increasing demand for lithium salt stimulates lithium salt producers to improve the lithium extraction technology of salt lakes, reduce the production cost of lithium salt, which greatly improved the quality of lithium salt products. From 2018 to 2019, major breakthroughs were made in mica lithium extraction technology in China, and the comprehensive cost decreased significantly, further driving an increase in domestic lithium supply. However, the domestic lithium supply increment is limited, and the increase speed is far less than the growth of demand for lithium. After 2015, the demand for lithium in the field of new energy vehicles increased greatly, and the proportion of the domestic supply of lithium continued to decline. By 2020, the domestic lithium supply accounted for only 24.53% of lithium production. The lithium resource gap is growing, and the supply of lithium resources has changed to import-led.

3.1.2. Chemical Production Stage

Domestic lithium salt products are mainly lithium carbonate, lithium hydroxide and lithium chloride, of which the production of lithium carbonate reached 869.3 kt, accounting for 63.32% of the total production of lithium salt products, while lithium hydroxide and lithium chloride production are 420.3 kt and 153.429 kt, respectively. In the import and export of lithium salt products, lithium carbonate and lithium chloride are mainly imported, with net imports of 174.7 kt and 17.7 kt, respectively. Lithium hydroxide is mainly exported, with net exports of 172.82 kt. Lithium carbonate is the most basic lithium salt product and the basic material for the production of secondary lithium salt and metal lithium products, thus becoming the largest lithium product in the lithium industry. From 2007 to 2014, the output of lithium carbonate increased from 14.1 kt to 40.7 kt, with a relatively stable growth rate. In this stage, lithium carbonate was mainly used in traditional industrial fields, such as glass and ceramics, and in the field of lithium electricity, it was mainly used in the production of lithium cobalt oxide as batteries for 3C consumer products. After 2015, due to the boom of new energy vehicles, the demand for lithium carbonate increased significantly, driving the increase in lithium carbonate production from 42 kt in 2015 to 125 kt in 2018. With the arrival of the 5G era in 2019, a large number of 5G base stations were built, further driving the demand for lithium carbonate. By 2020, the output of lithium carbonate reached 187 kt.
China is the world’s largest lithium hydroxide production base, which is mainly used to manufacture lithium grease, high nickel ternary cathode material and other products. Before 2017, lithium hydroxide was mainly used in traditional industrial fields. China’s lithium hydroxide output increased from 9.064 kt to 22 kt, and the export volume increased from 3.98624 kt to 9.82521 kt. After 2017, the launch of overseas support policies for the NEV industry led to a significant increase in demand for high-quality battery-grade lithium hydroxide in Europe, Japan and South Korea, driving the production and export volume of lithium hydroxide in China. From 2017 to 2020, China’s lithium hydroxide output increased from 30.8 kt to 81.576 kt. The export volume increased from 19.40043 kt to 56.59298 kt. In the domestic new energy vehicle market, new energy vehicle power batteries are mainly lithium iron phosphate, and the high nickel ternary material market demand is lower. Lithium chloride is mainly used for electrolytic preparation of lithium metal, aluminum flux and air treatment, as well as pharmaceutical preparation. Its output is relatively stable, increasing from 0.23604 kt in 2007 to 20.033 kt in 2020 (Figure 5).

3.1.3. Manufacturing and Use Stage

The consumption field of lithium can be divided into the traditional industry and the lithium electric industry. From 2007 to 2020, the consumption of lithium in China increased from 22.8 kt to 241.985 kt, and the external dependence of lithium resource consumption showed an overall rising trend. The overall change in the annual stock of lithium resources was similar to that of consumption. The changing consumption structure of lithium resources is shown in Figure 6. Lithium is mainly used in glass and ceramics, grease, air treatment, medicine and other industries in the traditional consumption field. The annual consumption of lithium in the traditional field is shown in Figure 6, which increased from 14.3653 kt in 2007 to 49.53125 kt in 2020. Among them, glass ceramics and lithium grease were the main components of the traditional lithium consumption field. The lithium consumption of the lithium grease and air treatment industries was relatively stable, and the annual lithium consumption fluctuated between 5 kt–8 kt and 1 kt–4 kt, respectively. Glass ceramics is the industry with the largest proportion of lithium consumption in the traditional field. The amount of lithium used in glass ceramics fluctuated between 4 kt and 10 kt from 2007 to 2017, presenting a trend of steady growth as a whole. In the “Strategic Emerging Industry Classification (2018)” released by the National Bureau of Statistics in 2018, glass ceramics were used in the manufacture of special glass, and ceramics in the new material industry, and as high energy storage and key electronic materials in the new generation information technology industry. This further promoted the demand growth of glass ceramics, driving the increase in the consumption of lithium in the field of glass ceramics from 8.729 kt in 2017 to 21.77865 kt in 2020. In the pharmaceutical industry, lithium is mainly used as a catalyst in the production of statin lipid-lowering drugs and for the production of antiviral drugs, such as efavirenz.
The lithium battery industry is the field with the fastest growth in lithium consumption, which increased from 8.1 kt in 2007 to 90.8 kt in 2020, with a total cumulative lithium consumption of 530.9 kt. The consumption of lithium batteries is divided into three categories: 3C consumer batteries, power batteries and energy storage batteries. The cumulative consumption of lithium resources was 261.9769 kt, 242.2177 kt and 26.706 kt, respectively. Before 2015, the 3C consumer battery was the main consumption field of lithium batteries, which increased from 8.0263 kt in 2007 to 24.1 kt in 2014. The lithium consumption of power batteries and energy storage batteries was relatively small at this stage. Since 2015, the amount of lithium used in consumer batteries has basically remained stable, while the amount of lithium used in power batteries has increased significantly due to the influence of new energy vehicle policies, from 5.288 kt in 2014 to 58.3 kt in 2020. The amount of lithium used in energy storage batteries grew slowly at an early stage, from 44 t in 2011 to 473.175 t in 2014. As the cost of lithium battery energy storage decreased to 50% in 2016, the consumption of energy storage lithium batteries increased from 1.091 kt in 2015 to 2.177 kt in 2017. In 2017, the lithium energy storage battery market benefited from a rich overlay of application scenarios, which led to the rapid growth of terminal demand. The energy storage of lithium batteries grew relatively large, from 2.177 kt in 2017 to 4.795 kt in 2018. In 2019, due to the commercialization of 5G, a large number of 5G base stations were built, which has driven the continuous growth of lithium consumption of energy storage batteries on the grid side.
The cathode materials used in lithium battery production are divided into four types: lithium iron phosphate, ternary material, lithium manganese oxide and lithium cobalt oxide. Before 2012, lithium cobalt oxide was the main cathode material for lithium battery production, and the output of lithium cobalt oxide batteries increased from 4.1525 kt in 2007 to 13.59 kt. Lithium manganate, ternary cathode material and lithium iron phosphate cathode materials have increased significantly since 2015. With the advantages of low cost and the long life of lithium iron phosphate products, as well as the popularity of new energy buses, the output of lithium iron phosphate has grown rapidly, from 5 kt in 2013 to 459.1 kt in 2020. Since 2016, the booming development of new energy vehicles has raised the energy density requirements for driving power batteries, and the consumption of ternary materials in the field of passenger cars has increased significantly, from 23 kt in 2013 to 440.5 kt in 2020. The production of lithium manganate has increased rapidly due to the increase in lithium electric permeability in small power tools.
From 2007 to 2020, while the consumption of lithium-ion batteries increased rapidly, the consumption structure of lithium-ion batteries changed greatly. Among consumer battery products, mobile phones and laptops were the main factors in the growth of lithium-ion battery consumption from 2007 to 2012. In 2013, within the Chinese mobile phone market as 4G smartphones began to take off, the amount of lithium used in mobile phones continued to grow steadily, while tablet computers developed on a large scale in the domestic market around the same time. Due to the development of the mobile phone function, as well as the emergence of tablet computers, the production of laptops and digital cameras declined, and their lithium use also started to decline, whereas the overall lithium consumption of consumer batteries maintained a steady growth trend. From 2014 to 2019, the amount of lithium used in mobile phones, laptops and tablets remained stable. In 2020, due to the epidemic, the increase in working at home led to an increase in the production of laptops and tablets, which promoted an increase in lithium used in consumer batteries.
In terms of power battery products, the market for pure electric and plug-in vehicles did not pick up from 2007 to 2014, and lithium batteries used less than 2 kt of lithium. Affected by policies in 2015, the lithium consumption of new energy vehicle batteries began to grow rapidly, from 9.9 kt in 2015 to 43.82732 kt in 2020. The steady increase in lithium battery penetration in electric two-wheelers and power tools was also driving the growth in lithium consumption in the power battery field. In the field of energy storage battery application, the installed volume of energy storage lithium batteries was mainly on the user-side from 2011 to 2017. During 2018–2020, the consumption of lithium energy storage in power generation increased from 28.1% to 60.2%, while the installed share of the user side decreased continuously. The installed volume of energy storage lithium batteries accounted for only 2% in 2020.

3.1.4. Waste Management Stage

Based on Equations (2) and (7)–(13), this study estimated the scrap amounts of lithium-ion batteries in China from 2007 to 2020. As shown in Figure 7, from 2007 to 2020, the annual scrap amount of lithium-ion batteries equivalent to lithium carbonate increased from 3.095712 kt to 33.32826 kt. The total scrap amount equivalent to lithium carbonate was 226.5435 kt. In scrap lithium-ion batteries, consumption of lithium-ion batteries accounted for the largest proportion, and the cumulative scrap amount equivalent to lithium carbonate was 195.6431 kt. The second was the power lithium-ion battery, whose cumulative scrap equivalent to lithium carbonate was 30.63099 kt. The energy storage type lithium-ion battery had a long life and the least scrap amount, which was equivalent to 0.269 kt of lithium carbonate in cumulative scrap. In terms of specific lithium products, mobile phones are the most discarded, followed by laptops. In power battery products, electric two-wheelers and power tools are major contributors. The first year of the new energy vehicle power battery retirement wave was in 2018, becoming the largest contributor to the scrap volume in the power battery field.
At present, China’s lithium battery recovery industry is still in the early stages of development, and the recovery rate is low. In 2020 and 2019, the recovered waste lithium batteries were 196 kt and 129 kt, respectively. The recovery and extraction rates of lithium were calculated to be 90%, equivalent to 2.7693 kt and 2.0844 kt of lithium carbonate, respectively. In 2019, the step utilization batteries only accounted for 3.3% of the recovered waste lithium-ion batteries, namely, 4257 t, which is equivalent to 46.827 t of lithium carbonate. Therefore, there is still much room for development in the recycling and sequential utilization of waste lithium-ion batteries in China.

3.2. Stock Analysis

Based on Equations (1), (2) and (7)–(13), this study calculated the in-use stock of lithium-ion batteries in China from 2007 to 2020, as shown in Figure 8. The in-use storage of lithium in the field of lithium batteries increased from 20.69721 kt in 2007 to 341.6322 kt in 2020. From 2007 to 2015, laptops were the largest component of lithium-ion batteries in active use, with mobile phones slightly behind laptops in terms of in-use inventory. In 2016, the mobile phone stock in use overtook that of laptops and accounted for the largest share of lithium stock in use. After 2017, pure electric vehicles became the largest contributor to the lithium in-use stock, and in 2020, the contribution rate of pure electric vehicles to the lithium in-use stock reached 51.93%. Before 2015, consumer lithium-ion batteries accounted for more than 80 percent of the lithium stock in use. After 2015, with the rapid growth of the demand for power batteries and energy storage batteries, the proportion of consumer batteries in the lithium stock in use gradually declined. In 2015, the shares of consumer batteries, power batteries and energy storage batteries in the lithium in-use stock were 81%, 17.6% and 1.4%, respectively, compared with 30%, 62.4% and 7.6%, respectively, in 2020 (Figure 9).

4. Conclusions

In this paper, the dynamic material flow analysis system of lithium resources in China based on the whole life cycle was constructed, and the material flow and stock of lithium resources in China from 2007 to 2020 were studied. The main conclusions are as follows:
(1)
The production and consumption of lithium resources in China are growing rapidly and continuously. The growth rate of the domestic lithium ore supply cannot meet the increasing demand for lithium consumption. The supply of lithium resources in China is gradually shifting from domestic supply to international import, and the external dependence of lithium resources is expanding year by year. From 2007 to 2020, China’s external dependence on lithium resources increased from 29.7% to 70.75%.
(2)
Among the lithium salt products, lithium carbonate is the main lithium salt product, with a cumulative output of 869,300 tons, accounting for 63.32% of the total cumulative output of lithium salt. The second is lithium hydroxide, with a cumulative output of 420,300 tons, of which 201,900 tons were exported abroad. However, with the development of high nickelization of electric vehicle batteries, the domestic use and share of lithium hydroxide is gradually increasing. Lithium chloride and its processed products are mainly used in traditional industrial and pharmaceutical fields with the smallest and most stable output.
(3)
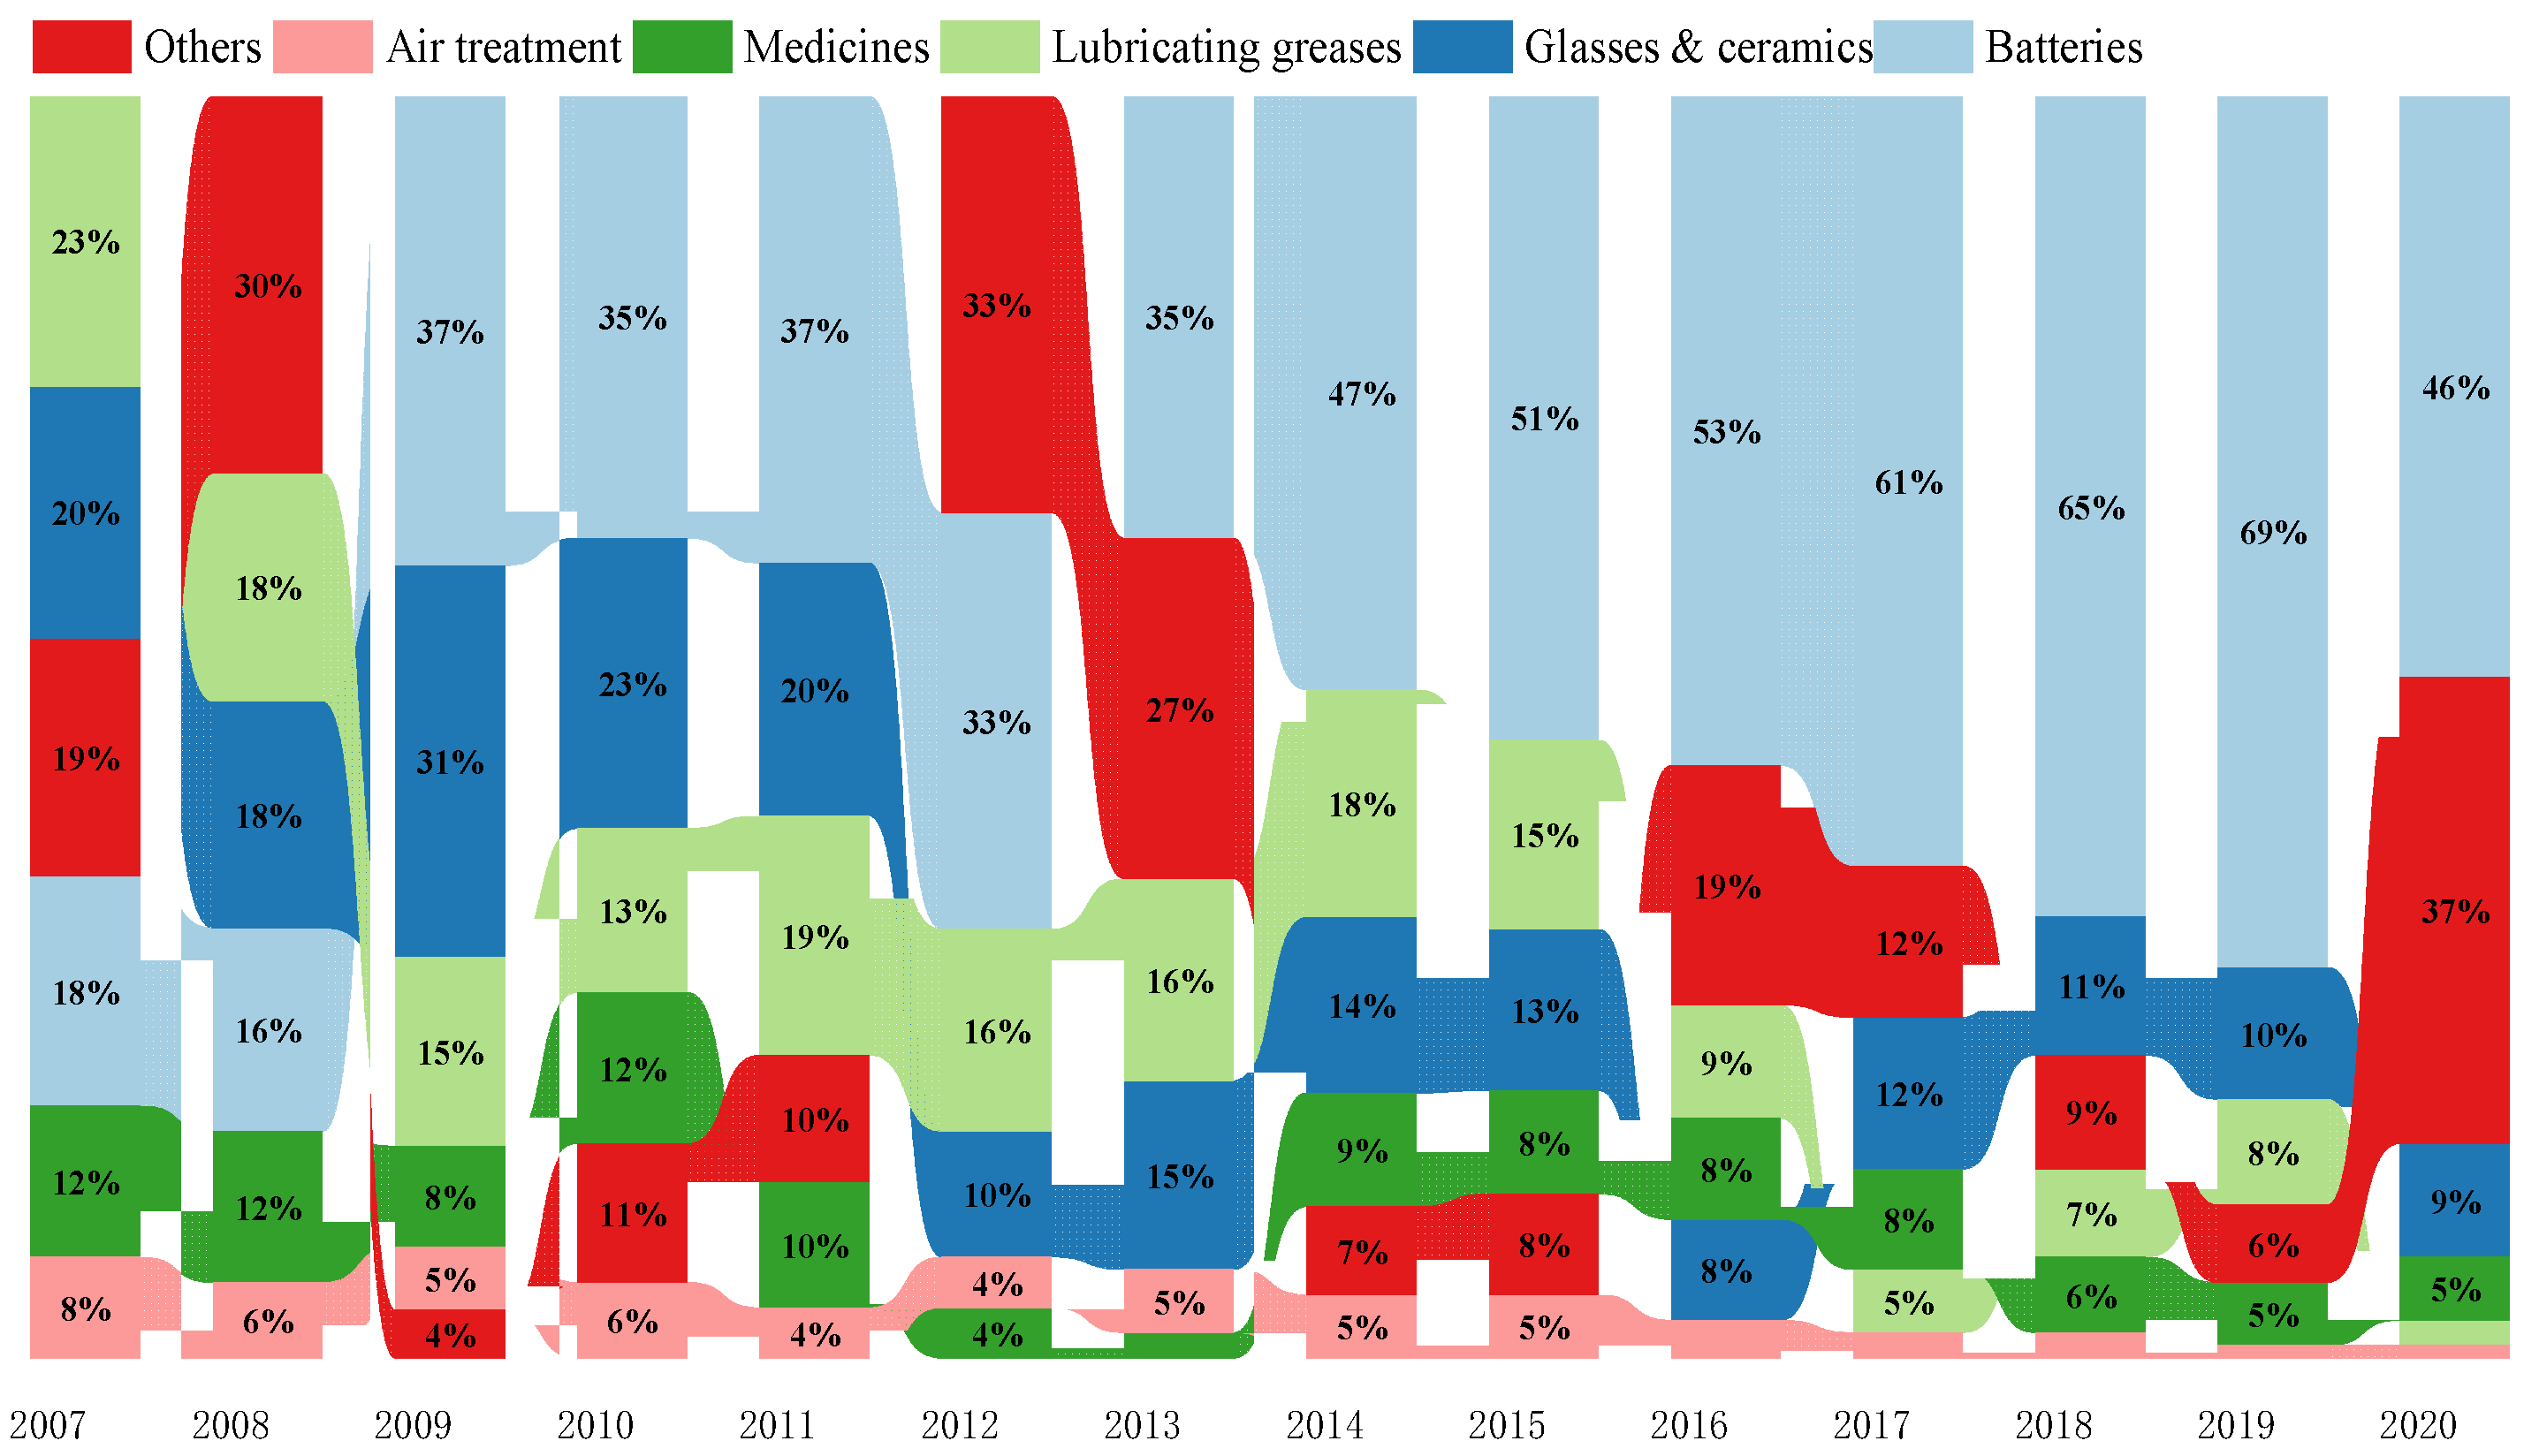
In the field of lithium consumption, from the perspective of the overall consumption pattern of lithium resources, the dominant consumption area shifted from the traditional consumption area to the lithium consumption area; lithium consumption in traditional industries is relatively stable, with a cumulative lithium consumption of 309.9348 kt from 2007 to 2020. Glass ceramics are the main contributor to lithium consumption in traditional industries, accounting for 45.9%, followed by lithium grease, accounting for 30.8%. In the field of lithium batteries, the cumulative lithium consumption from 2007 to 2020 was 530.9006 kt. The consumption of lithium-ion batteries in China experienced stable growth initially, followed by rapid development. From 2007 to 2014, the cumulative lithium consumption of China’s lithium batteries was 141.4689 kt. After 2015, influenced by the national new energy policy and market drive, the consumption of lithium batteries increased sharply, and the cumulative lithium consumption of lithium batteries reached 389.4317 kt from 2015 to 2020. With the rapid growth of the consumption of lithium batteries, the consumption structure of lithium-ion batteries is also changing, from consumer lithium batteries to power lithium batteries. The overall energy storage and lithium battery market is still in the gestation period, and the consumption of lithium resources is far less than that in the other two fields.
(4)
In terms of the in-use stock of lithium-ion batteries, the reuse stock of lithium batteries keeps growing steadily with the increase in the consumption of lithium batteries; however, in the proportion of storage, the consumer battery, as the dominant battery, has gradually become power battery dominant. In 2015, the shares of lithium in consumer batteries, power batteries and energy storage batteries in lithium in-use stocks were 81%, 17.6% and 1.4%, respectively, compared with 30%, 62.4% and 7.6%, respectively, in 2020.
(5)
The recycling of waste lithium-ion batteries needs to be further improved. The scrap volume of lithium resources is far higher than resource recycling volume. In 2020, the theoretical scrap volume of waste lithium-ion batteries in China was 355,000 tons, and the actual resource recycling volume was 129,000 tons. Only 4257 tons of waste lithium batteries were recycled for gradient utilization, accounting for only 3.3% of the recycling volume. The recycling potential of waste lithium-ion batteries is large, with much room for development in the gradient utilization of waste lithium-ion batteries.

Author Contributions

Conceptualization, Z.Z., J.H., M.L. and Y.L.; methodology, Z.Z. and J.H.; software, Z.Z. and J.H.; validation, Z.Z.; formal analysis, Z.Z. and J.H.; investigation, Z.Z., J.H., M.L. and Y.L.; resources, Z.Z., J.H., M.L. and Y.L.; data curation, Z.Z., J.H., M.L. and Y.L.; writing—original draft preparation, Z.Z. and J.H.; writing—review and editing, Z.Z. and J.H.; visualization, Z.Z. and J.H.; supervision, Z.Z.; project administration, Z.Z. All authors have read and agreed to the published version of the manuscript.

Funding

This study is supported by the Fundamental Research Funds for the Central Universities of Central South University (2022ZZTS0489).

Institutional Review Board Statement

Not applicable.

Informed Consent Statement

Informed consent was obtained from all subjects involved in the study.

Data Availability Statement

Not applicable.

Conflicts of Interest

The authors declare no conflict of interest.

Abbreviations

i Categories of products containing lithium
S t o c k i , t l i The in-use stock of lithium-containing products in year t
A C i , t l i Apparent consumption of lithium-containing products in year t
R i , t l i The waste amount of lithium-containing products in year t
L i ( t , t ) lifetime distribution function defined in discrete time series [0,1,2,…,t,…]
t The specific year in the new traffic input system
A C m , t l i Domestic consumption of lithium salt in year t
P m , t l i Domestic production of lithium salt in year t
I m , t l i Lithium salt imports in China in year t
E m , t l i Lithium salt exports from China in year t
A C m l c e , t l i Domestic consumption of lithium salts measured by lithium carbonate mass in year t
γ Conversion coefficient of lithium salts
A C i n d , t l i The calculation of lithium consumption
P i , t l i The domestic output of class i lithium products measured by the mass of lithium carbonate
C i , t p The mass percentage of lithium carbonate in lithium products in year t, respectively
A C E V , t l i The lithium consumption of power battery
P E V , t l i The domestic output of new energy vehicles measured by the quality of lithium carbonate in year t
δ The proportion of installed cathode materials
μ The weight of the cathode material
ε The lithium content in the cathode material
αThe scale parameter
βThe shape parameter
L t The life distribution function of the power battery
MThe number of new energy vehicle power batteries
EPower battery replacement volume
B t The scrap amount of the new energy vehicle power battery

References

  1. The State Council of the People’s Republic of China. Notice of the State Council on Issuing the “Made in China (2025)”. 2015. Available online: http://www.gov.cn/zhengce/content/2015-05/19/content_9784.htm (accessed on 13 October 2022).
  2. Ministry of Natural Resources of the People’s Republic of China. National Mineral Resources Plan (2016–2020). 2016. Available online: http://mnr.gov.cn/gk/ghjh/201811/t20181101_2324927.html (accessed on 13 October 2022).
  3. National Bureau of Statistics of China. Classification of Strategic Emerging Industries. 2018. Available online: http://www.stats.gov.cn/tjgz/tzgb/201811/t20181126_1635848.html (accessed on 13 October 2022).
  4. Chinese Institute of Engineering Development Strategies. Report on the Development of China’s Strategic Emerging Industries; Science Press Ltd.: Beijing, China, 2021. [Google Scholar]
  5. Xu, S.S.; Song, J.F.; Bi, Q.Y.; Chen, Q.; Zhang, W.M.; Qian, Z.X.; Lei, Z.; Xu, S.; Tang, N.; He, T. Extraction of lithium from Chinese salt-lake brines by membranes: Design and practice. J. Membr. Sci. 2021, 635, 119441. [Google Scholar] [CrossRef]
  6. Lu, Z.; Wu, Y.; Ding, L.; Wei, Y.Y.; Wang, H.H. A Lamellar MXene (Ti3C2Tx)/PSS Composite Membrane for Fast and Selective Lithium-Ion Separation. Angew. Chem. 2021, 133, 22439–22443. [Google Scholar] [CrossRef]
  7. Chaban, M.O.; Rozhdestvenska, L.M.; Palchyk, O.V.; Dzyazko, Y.S.; Dzyazko, O.G. Structural characteristics and sorption properties of lithium-selective composite materials based on TiO2 and MnO2. Appl. Nanosci. 2019, 9, 1037–1045. [Google Scholar] [CrossRef]
  8. Seip, A.; Safari, S.; Pickup, D.M.; Chadwick, A.V.; Ramos, S.; Velasco, C.A.; Cerrato, J.M.; Alessi, D.S. Lithium recovery from hydraulic fracturing flowback and produced water using a selective ion exchange sorbent. Chem. Eng. J. 2021, 426, 130713. [Google Scholar] [CrossRef]
  9. Xing, J.Y.; Peng, H.; Zhang, Y.F.; Chen, Q.S. Global lithium demand and supply. Resour. Sci. 2015, 37, 988–997. [Google Scholar]
  10. Zhu, L.L.; Jin, Q.H.; Yang, X.S. Analysis of China’s status in international lithium hydrate trade based on complex network. China Min. Magazine. 2016, 25, 49–52. [Google Scholar]
  11. Zhu, L.L.; Zhou, P.; Yang, X.S. Modeling and analysis of international lithium carbonate trade based on complex network. China Min. Mag. 2016, 25, 52–56. [Google Scholar]
  12. Brunner, P.H.; Rechberger, H. Practical handbook of material flow analysis. Int. J. Life Cycle Assess. 2004, 9, 337–338. [Google Scholar] [CrossRef]
  13. Wang, T.; Muller, D.B.; Graedel, T.E. Forging the anthropogenic iron cycle. Environ. Sci. Technol. 2007, 41, 5120–5129. [Google Scholar] [CrossRef]
  14. Chen, W.Q.; Shi, L. Analysis of aluminum stocks and flows in mainland China from 1950 to 2009: Exploring the dynamics driving the rapid increase in China’s aluminum production. Resour. Conserv. Recycl. 2012, 65, 18–28. [Google Scholar] [CrossRef]
  15. Cullen, J.M.; Allwood, J.M. Mapping the Global Flow of Aluminum: From Liquid Aluminum to End-Use Goods. Environ. Sci. Technol. 2013, 47, 3057–3064. [Google Scholar] [CrossRef] [PubMed] [Green Version]
  16. Liu, G.; Mueller, D.B. Mapping the Global Journey of Anthropogenic Aluminum: A Trade-Linked Multilevel Material Flow Analysis. Environ. Sci. Technol. 2013, 47, 11873–11881. [Google Scholar] [CrossRef] [PubMed]
  17. Graedel, T.E.; Van, B.D.; Bertram, M. Multilevel Cycle of Anthropogenic Copper. Environ. Sci. Technol. 2004, 38, 1242–1252. [Google Scholar] [CrossRef] [PubMed]
  18. Graedel, T.E.; Van, B.D.; Bertram, M. The multilevel cycle of anthropogenic zinc. J. Ind. Ecol. 2005, 9, 67–90. [Google Scholar] [CrossRef]
  19. Johnson, J.; Jirikowic, J.; Bertram, M. Contemporary Anthropogenic Silver Cycle:  A Multilevel Analysis. Environ. Sci. Technol. 2005, 39, 4655–4665. [Google Scholar] [CrossRef]
  20. Johnson, J.; Schewel, L.; Graedel, T.E. The contemporary anthropogenic chromium cycle. Environ. Sci. Technol. 2006, 40, 7060–7069. [Google Scholar] [CrossRef]
  21. Reck, B.K.; Müller, D.B.; Rostkowski, K. Anthropogenic Nickel Cycle: Insights into Use, Trade, and Recycling. Environ. Sci. Technol. 2008, 42, 3394–3400. [Google Scholar] [CrossRef]
  22. Mao, J.S.; Dong, J.; Graedel, T.E. The multilevel cycle of anthropogenic lead: II. Results and discussion. Resour. Conserv. Recycl. 2008, 52, 1050–1057. [Google Scholar] [CrossRef]
  23. Ziemann, S.; Weil, M.; Schebek, L. Tracing the fate of lithium-the development of a material flow model. Resour. Conserv. Recycl. 2012, 63, 26–34. [Google Scholar] [CrossRef]
  24. Baars, J.; Domenech, T.; Beischwitz, R. Circular economy strategies for electric vehicle batteries reduce reliance on raw materials. Nat. Sustain. 2021, 4, 71–79. [Google Scholar] [CrossRef]
  25. Sun, X.; Hao, H.; Zhao, F. Tracing global lithium flow: A trade-linked material flow analysis. Resour. Conserv. Recycl. 2017, 124, 50–61. [Google Scholar] [CrossRef]
  26. Hao, H.; Liu, Z.; Zhao, F. Material flow analysis of lithium in China. Resour. Policy 2017, 51, 100–106. [Google Scholar] [CrossRef]
  27. Lu, B.; Liu, J.; Yang, J. Substance flow analysis of lithium for sustainable management in mainland China: 2007–2014. Resour. Conserv. Recycl. 2017, 119, 109–116. [Google Scholar] [CrossRef]
  28. Müller, E.; Hilty, L.M.; Widmer, R. Modeling Metal Stocks and Flows: A Review of Dynamic Material Flow Analysis Methods. Environ. Sci. Technol. 2014, 48, 2102–2113. [Google Scholar] [CrossRef]
  29. Harper, E.M.; Kavlak, G.; Graedel, T.E. Tracking the Metal of the Goblins: Cobalt’s Cycle of Use. Environ. Sci. Technol. 2012, 46, 1079–1086. [Google Scholar] [CrossRef]
  30. Li, J.K.; Liu, X.F.; Wang, D.H. The Metallogenetic Regularity of Lithium Deposit in China. Acta Geol. Sin. 2014, 88, 2269–2283. [Google Scholar]
  31. Ma, Z.; Li, J.W. Analysis of China’s lithium resources supply system: Status, issues and suggestions. China Min. Mag. 2018, 27, 1–7. [Google Scholar]
  32. Liu, X.H. The guarantee of strategic mineral resources is related to the overall security of the country. China Mining News, 11 January 2021; 1. [Google Scholar] [CrossRef]
  33. China Nonferrous Metals Industry Association (CNMIA). Productions of Lithium Resource and Lithium Chemicals in China. 2020. Available online: http://www.chinali.org/ (accessed on 13 October 2022).
  34. U.S. Geological Survey. Mineral commodity summaries 2021: U.S. Geological Survey. 2021. Available online: https://doi.org/10.3133/mcs2021 (accessed on 13 October 2022).
  35. UN Comtrade. Trade Data. United Nations Comtrade. 2020. Available online: https://comtrade.un.org/data/ (accessed on 13 October 2022).
  36. China Economic and Social Big Data Research Platform. China Light Industry Statistical Yearbook 2020. 2020. Available online: https://data.cnki.net/yearbook/Single/N2021110122 (accessed on 13 October 2022).
  37. National Bureau of Statistics (NBS). China Statistical Yearbook 2021. 2021. Available online: https://data.cnki.net/yearbook/Single/N2021110004 (accessed on 13 October 2022).
  38. Ministry of Industry and Information Technology of the People’s Republic of China (MIIT). Productions of Rechargeable Batteries, Electric Vehicles, Mobile Phones, Laptop Computers, Tablet Computers in China. 2021. Available online: https://www.miit.gov.cn/gxsj/index.html (accessed on 13 October 2022).
  39. China Economic and Social Big Data Research Platform. China Electronic Information Industry Yearbook. 2020. Available online: https://data.cnki.net/yearbook/Single/N2021060074 (accessed on 13 October 2022).
  40. GGII. Lithium battery research report. Available online: http://www.gg-ii.com/report-7-2.html (accessed on 13 October 2022).
  41. China Bicycle Association (CBA). Analysis of Economic Operation of China Bicycle Industry in China. Available online: http://www.china-bicycle.com/news/index/34?cid=24 (accessed on 13 October 2022).
  42. China Association of Automobile Manufacturers (CAAM). China Automobile Production and Sales Data. 2021. Available online: http://www.caam.org.cn/chn/4/cate_31/list_1.html (accessed on 13 October 2022).
  43. China Economic and Social Big Data Research Platform. China Automotive Market Yearbook. 2021. Available online: https://data.cnki.net/yearbook/Single/N2022010189 (accessed on 13 October 2022).
  44. CNESA. White Paper on Energy Storage Industry Research. Available online: http://www.esresearch.com.cn/report/?category_id=26 (accessed on 13 October 2022).
  45. Song, X.; Hu, S.; Chen, D. Estimation of Waste Battery Generation and Analysis of the Waste Battery Recycling System in China. J. Ind. Ecol. 2017, 21, 57–69. [Google Scholar] [CrossRef]
Figure 1. Material flow analysis system of lithium resources in China.
Sustainability 14 16928 g001
Figure 2. Life probability distribution of lithium batteries with different parameters.
Sustainability 14 16928 g002
Figure 3. Material flow chart of lithium resources in China from 2007 to 2020 (unit: kt).
Sustainability 14 16928 g003
Figure 4. Production and supply ratio of lithium ore in China.
Sustainability 14 16928 g004
Figure 5. (a) China’s lithium salt production; (b) China’s lithium salt import and export volume.
Sustainability 14 16928 g005
Figure 6. Evolution of the lithium resource consumption structure in China.
Sustainability 14 16928 g006
Figure 7. (a) China’s lithium consumption and inventory from 2007 to 2020; (b) China’s lithium consumption in different fields from 2007 to 2020; (c) China’s lithium consumption in traditional fields from 2007 to 2020; (d) China’s lithium consumption of different lithium battery products from 2007 to 2020; (e) China’s lithium consumption in the field of lithium batteries from 2007 to 2020; (f) China’s lithium battery cathode material output from 2007 to 2020.
Sustainability 14 16928 g007aSustainability 14 16928 g007b
Figure 8. (a) Scrap volume of lithium batteries in China from 2007 to 2020; (b) Scrap volume of lithium battery products in China from 2007 to 2020.
Sustainability 14 16928 g008
Figure 9. Lithium battery products in use.
Sustainability 14 16928 g009
Table 1. Conversion coefficient of lithium salts *.
Lithium CarbonateLithium Hydroxide MonohydrateLithiumLithium OxideLithium ChlorideLithium Concentrate
Lithium carbonate10.885.3222.4730.8718
Lithium hydroxide monohydrate1.13616.03662.8120.9889.088
Lithium chloride0.870.9886.1452.84616.96
Note: * The conversion coefficient of lithium salts in Table 1 indicates the number of lithium salts that can be prepared per unit of lithium material. For example, 1 ton of lithium can prepare 5.322 tons of lithium carbonate, or 6.0366 tons of lithium hydroxide monohydrate, or 6.145 tons of lithium chloride.
Table 2. Lithium content in the traditional consumption field.
ProductGlassSanitary CeramicsCeramics for Daily UseCeramic TileLithium Grease
Lithium carbonate demand24.8 g/weight box6.572 g/piece0.00988%/kt1.4838 g/m21.32%/kt
Table 3. Power change and lithium usage of cathode material.
Anode MaterialLithium Iron PhosphateTernary MaterialLithium Manganese Oxide Lithium Nickel cobalt Manganese Oxide
1 GWh2500 t1800 t1200 t1860 t
1tLithium carbonate4 t2.632 t4.897 t2.65 t
Table 4. Power battery positive grade material installed proportion.
YearLithium Iron PhosphateTernary MaterialLithium Manganese Oxide
20200.38299970.610.006
20190.32480030.650.0241
20180.41590.560.0202
20170.50788060.450.04333
20160.73789940.230.0348
20150.67790090.270.056201
20140.75679940.240
2013100
2012100
2011100
2010100
Table 5. Parameters of the lithium battery life distribution model under different products.
Product TypeProductLifeShape ParameterβScale Parameterα
Consumer batteryCell phonetave = 3
tmax = 5
3.5943.2849
Notebooktave = 5
tmax = 8
3.8835.3985
Tablettave = 5
tmax = 8
3.8835.3985
Digital cameratave = 3
tmax = 5
3.5943.2849
Power batteryPower tooltave = 3
tmax = 5
3.5943.2849
Two-wheelertave = 3
tmax = 5
3.5943.2849
Lithium iron phosphate batterytave = 7
tmax = 8
12.087.0503
Ternary lithium batterytave = 6
tmax = 8
5.9486.1886
Lithium manganate batterytave = 3
tmax = 5
3.5943.2849
Energy storage batteryEnergy storage lithium batterytave = 10
tmax = 15
4.40210.603
Publisher’s Note: MDPI stays neutral with regard to jurisdictional claims in published maps and institutional affiliations.

