Abstract
The resource allocation efficiency of the energy industry in the Yangtze River economic belt is related to the green and high-quality development of the region. This study constructed a quantitative model which modified from the traditional HK model to evaluate the efficiency of energy industry resource allocation. This paper makes a quantitative evaluation of the efficiency of inter-industrial and inter-regional resource allocation of the energy industry in the Yangtze River economic belt from 2000 to 2019. The results show that: the average annual loss of total factor productivity of the energy industry in the Yangtze River economic belt is as high as 25.11% due to the misallocation of resources among the energy industries, capital misallocation, labor misallocation, and intermediate input misallocation were 12.32%, 7.08%, and 5.08%, respectively. The misallocation of resources among the energy industries of the provinces in upper, middle, and lower reaches is gradually increasing in turn. The average annual loss of total factor productivity (TFP) in the energy industry of the Yangtze River economic belt is 6.5% due to the misallocation of resources between regions. Capital misallocation, labor misallocation, and intermediate input misallocation were 2.48%, 3.40%, and 0.63%, respectively. In the upper, middle, and lower reaches of the Yangtze River, the labor force, capital, and intermediate input of each province’s energy industry were misallocated to a different extent. According to the trend of resource input in the energy industry of various provinces and cities, the middle and lower reaches of the Yangtze River also show different characteristics.
1. Introduction
As the golden economic belt with the widest coverage and the greatest comprehensive influence in China, the Yangtze River Economic Belt is the main battlefield of ecological priority and green development, the main artery of smoothing the Double-circulation, and the main force of leading high-quality economic development. Under the guidance of the strategic orientation of “to step up conservation of the Yangtze River and stop its overdevelopment,” green and high-quality development will become the main direction of future economic and social development of the Yangtze River Economic Belt. The scientific and orderly intensive development based on the premise of “conservation of the Yangtze River” means that the Yangtze River Economic Belt must change the extensive economic development path of high input and high energy consumption in the past and accelerate the transformation to the total factor productivity-driven economic development model [1], so as to achieve a “win-win” development pattern in which high-quality economic development and green high-quality development go hand in hand. The promotion path of economic or industrial total factor productivity mainly includes the following two ways: First, market players promote the marginal output of production factors in the production process through technological innovation to achieve their own total factor productivity and then promote the overall total factor productivity of economic or industrial sectors [2]; The second is to improve the overall total factor productivity by optimizing the allocation efficiency of production factors among different economic or industrial sectors [3]. According to the research by Yang [4], the improvement of total factor productivity of China’s economy will increasingly rely on the improvement of resource allocation efficiency in the future. Therefore, when discussing the total factor productivity of the Yangtze River Economic Belt, we need to pay full attention to the efficiency of resource allocation in the Yangtze River Economic Belt.
As an important basic industry, the energy industry plays an important supporting role in the economic development of the Yangtze River Economic Belt. However, because the energy industry has the attributes of high pollution, high energy consumption, and high emission, the industrial intensity in the Yangtze River Economic Belt is very high. Therefore, under the background of “to step up conservation of the Yangtze River,” the energy industry in the Yangtze River Economic Belt especially needs to accelerate the pace of transformation and upgrading, promote the total factor productivity through green technological innovation and resource allocation efficiency and then promote the scientific, orderly and intensive development of the energy industry in the Yangtze River Economic Belt, embark on the road of total factor productivity-driven development as soon as possible, and serve the economic and social development of the Yangtze River Economic Belt with a more green and efficient attitude. According to the existing research, China’s energy industry is facing serious resource allocation distortions due to local protectionism [5], industry monopoly [6], factor price distortions [7], and excessive government intervention [8]. It has seriously restricted the improvement of the total factor productivity of the Yangtze River Economic Belt and even the national energy industry. Therefore, an in-depth analysis of the resource allocation efficiency of the energy industry in the Yangtze River Economic Belt will be of great practical significance to the transformation, upgrading, and green development of the energy industry in the Yangtze River Economic Belt, as well as the smooth realization of the strategic objectives of the whole Yangtze River Economic Belt.
2. Literature Review
According to the existing literature, the research related to the theme of this paper mainly includes the following two aspects: The first is the research on the loss of total factor productivity caused by resource misallocation. Existing studies have shown that the resource misallocation of China’s economy has multiple dimensions, among which the imbalance of industrial structure, ownership discrimination, and regional market segmentation are the three important structural factors leading to the distortion of China’s resource allocation. As far as inter-industry distortions are concerned, the analysis of Yuan and Xie [9] based on the Aoki model [10] pointed out that the distorted allocation of resources between the agricultural sector and the non-agricultural sector led to the loss of TFP between 2% and18%. Chen and Hu [11], based on the analysis of the Aoki model, pointed out that the misallocation of resources among sub-industries in China’s manufacturing industry led to an output loss of 15%. However, Han and Zheng’s [12] analysis based on the HK model (Hsieh & Klenow, 2009) pointed out that the distortion of resource allocation among sub-industries in the manufacturing industry only led to a loss of 4.72% in TFP. As far as the distortion between regions is concerned, based on the analysis of the extended HK model, Brandt et al. [13] pointed out that the distortion of factor allocation between provinces led to an 8% loss of TFP (referred to as the BTZ model). Jin [14] integrated the HK model and BTZ model to estimate that the inter-provincial resource misallocation in China led to an average annual loss of 9.71%; As far as the distortion of ownership structure is concerned, Chen [15] calculation based on DSGE model points out that the distortion of factor allocation among different ownership sectors leads to 19% loss of TFP, and Jin et al. [16] analysis based on HK model using micro-enterprise data of China’s industrial enterprise database found that ownership discrimination led to 200% loss of TFP. The analysis of Zhang and Zhang [17] based on the HK model pointed out that the distortion of factor allocation under the difference of ownership only led to the loss of TFP by 7.4%. With the deepening of research, some other scholars began to focus on the misallocation of a specific region, a specific industry, and a specific factor in China. For example, Bai and Yang [18] measured the allocation efficiency of capital and labor in the Yangtze River Delta region and found that the distorted allocation of factors in Jiangsu, Zhejiang, and Shanghai showed a significant downward trend. Jin et al. [19] extended the research on the misallocation of traditional production factors to the research on innovation factors and found that the inter-regional misallocation of innovation factors in China is the most serious, followed by the inter-sector misallocation of ownership. Xie [20] brought human capital into the research framework of resource misallocation, and the quantitative evaluation results showed that there were serious human capital misallocation problems in all provinces of China, especially in Eastern China. Liu and Wu [8] focused on the energy industry using the micro-enterprise data of China’s industrial enterprise database from 1998 to 2007 and found that when examining the resource allocation efficiency of China’s energy industry, the resource misallocation of intermediate products could not be ignored, and if the resource misallocation of intermediate products was ignored, the loss of TFP would be underestimated by more than 33%.
The second is the study of the quantitative evaluation of energy efficiency and influencing factors. Most of the existing studies examined energy utilization efficiency and its influencing factors from the demand side. As far as energy efficiency research is concerned, Chen Zhao and Chen [21] examined the heterogeneity of energy efficiency in Chinese industrial enterprises from a micro perspective and found that the heterogeneity of energy efficiency in Chinese industrial enterprises was not conducive to the improvement of overall energy efficiency. Gao and Yue [22] further divided the energy consumption of enterprises into direct energy consumption and implicit energy consumption and found that the energy saving of Chinese enterprises in the future would mainly rely on the potential of implicit energy consumption. Other studies have examined China’s energy efficiency from a regional perspective. Hu et al. [23] studied the environmental and economic effects of a resource tax and carbon tax. Wei and Shen [24] used provincial panel data from 1995 to 2004 and the DEA method to calculate the results, which showed that the energy efficiency of each province in China showed a significant trend of first rising and then falling, and the energy efficiency of Northeast China was the highest. Chen and Zheng [25] conducted a quantitative assessment of the energy utilization efficiency in the Yangtze River Basin and found that the adjustment of industrial structure is an important path to improve the energy utilization efficiency in the Yangtze River Basin and the role of technological progress and institutional optimization could not be ignored. Fu and Wu [26] calculated the energy efficiency of six provinces in Central China and found that the provinces with abundant energy resources in Central China had lower energy efficiency. Guan et al. [27] focused on the Yellow River Basin region to investigate the spatial-temporal evolution characteristic of energy efficiency in the region and found that the energy efficiency in the Yellow River Basin region showed a U-shaped change over time, with significant spatial differences. On the basis of the above research contents, some other scholars further investigate the deep-seated reasons behind China’s energy efficiency status quo, including financial development [28], industrial structure [29], factor market distortions [30], and other market factors. It also examines the impact of energy subsidy policy [31], emission trading policy [32], and environmental pollution regulation policy [33] on energy efficiency.
The above researches provide profound and rich insights for an in-depth understanding of China’s resource allocation efficiency, energy utilization efficiency, and its influencing factors, but its main regret is that: First, the existing research on the loss of total factor productivity caused by resource misallocation is less focused on the resource allocation efficiency of the energy industry. Moreover, the quantitative evaluation model of resource allocation efficiency seldom involves intermediate products, mostly from the perspective of capital, labor, land, and other factors of production. Second, although Liu and Wu [8] quantitatively evaluated the resource allocation efficiency of China’s energy industry by using the data of energy enterprises in the database of China’s industrial enterprises, they were constrained by the model of three structures (enterprises, industries, the whole energy industries), and the study could only use micro-enterprise data for calculation. As a result, its data period is only from 1998 to 2007, which has been seriously lagging behind and cannot reflect the latest changes in resource allocation efficiency of China’s energy industry, and its calculation model mainly measures the resource allocation efficiency among energy enterprises but does not study the resource allocation efficiency of the current energy industry among industries and regions. In addition, most of the existing studies examine the resource allocation efficiency or energy efficiency from the national level, and there is basically no quantitative evaluation and analysis of the resource allocation efficiency of the energy industry in the Yangtze River Economic Belt.
As the main battlefield of the golden economic belt with the greatest comprehensive influence and the green development of ecological priority in China, the energy industry, as the basic pillar industry of economic development, will directly affect the efficiency of energy products on the supply side of the Yangtze River Economic Belt and the high quality of other industries in the middle and lower reaches. It has a profound impact on the environmental quality and green development of the region as well. At the same time, combined with the existing research, the efficiency of resource allocation of the energy industry in the Yangtze River Economic Belt is rarely involved. Therefore, it is necessary to quantitatively evaluate and analyze the resource allocation efficiency of the energy industry in the Yangtze River Economic Belt. This paper intends to build a quantitative evaluation model of the resource allocation efficiency of the energy industry in the Yangtze River Economic Belt by incorporating intermediate products into the analysis framework and simultaneously investigate the inter-industry and inter-regional resource allocation efficiency of the energy industry in the Yangtze River Economic Belt under the same model framework, to compare and analyze the level of resource allocation efficiency in different dimensions. In addition, one must then find the focus for the future deepening of the supply-side structural reform of the energy industry in the Yangtze River Economic Belt.
The possible marginal innovations of this paper are as follows: Firstly, on the basis of the traditional HK model, the structure of the quantitative evaluation model of resource allocation efficiency is simplified into two levels, namely, the department level and the overall level, so that the model calculation can use the industry or regional level data, which is more available and timely than the enterprise micro-data. It is more convenient to calculate and reflect the latest characteristics of China’s structural resource allocation efficiency. At the same time, the theoretical model can be applied to measure the structural resource allocation efficiency of different dimensions (inter-regional, inter-industry, inter-ownership sector, etc.), which makes the calculated structural resource allocation efficiencies of different dimensions comparable. Secondly, different from the previous studies, which only examine the allocation efficiency of capital and labor, this paper brings the intermediate input into the theoretical model framework to avoid the measurement bias caused by ignoring the intermediate input. Thirdly, this paper focuses on the energy industry in the Yangtze River Economic Belt instead of the national perspective, which enriches the literature on the green and high-quality development of the Yangtze River Economic Belt.
3. Theoretical Model
The model of factor allocation efficiency for the energy industry constructed in this paper changes the assumption that the production function is the constant return to scale in the previous literature. According to the production characteristics of the energy industry, the production function of the energy industry is set as the form of variable returns to scale. This model construction method is more flexible than other literature and more in line with the actual economic situation.
It is assumed that the overall output of the energy industry is produced by N sectors (this paper mainly examines the structural resource allocation efficiency of the energy industry in the Yangtze River Economic Belt from the perspective of industry and region). The production function of the whole energy industry is in the form of CES.
where Y represents the final output, represents the output of the ith department. , measures the weight of the output of sector I in the production process of the total output of the energy industry, and its specific value can be obtained endogenously through the derivation of the following model. The sum of the sectoral input factors is assumed to be the sum of the production factors of the energy industry, that is, , where L is labor, K is capital, and M is intermediate input. It is assumed that the total output of the energy industry is the function of labor, capital, and intermediate input, , the form of this function breaks through the hypothesis of constant returns to scale in the quantitative evaluation of resource allocation efficiency in previous literature, meanwhile, considering the production characteristics of the energy industry, the intermediate input is introduced into the production function. At the same time, the output of the energy industry of the subdivision department is the function of labor, capital, and intermediate input, . Therefore, the formula for calculating the TFP of each department is
In this article, represents the actual financing cost of department i, namely, the price of capital, where represents the coefficient of distortion of the capital price between departments. In the same way, we use , to represent the actual labor costs and intermediate input costs for department i, where and represents the distortion coefficients of labor prices and intermediate inputs prices between departments.
Referring to the existing relevant literature, this paper uses the loss of TFP to measure the loss caused by resource misallocation. The formula for calculating TFP loss due to resource misallocation is:
where A* is TFP without factor price distortion, and A is TFP with factor price distortion. From the above assumptions, it can be seen that to calculate the degree of resource misallocation, the most important thing is to calculate the proportion of factor input of each department li, ki, mi in the distorted state (namely the actual state) and in the undistorted state.
The problem of maximizing the overall profit of the energy industry can be expressed as
where Pi represents the product price of the ith department. The first order condition is,
As can be deduced from this, , combining the definition of Y in Formula (1),
The industry profit maximization problem can be expressed as:
The first order condition is:
As can be deduced from this,
It can be obtained by bringing Formula (11) back to Formula (10),
The same can be obtained from the expressions of and Mi,
is also the price elasticity of demand for various differentiated products, so there is . Combined with (2), (12), (13), and (14), it can be obtained
where .
Substituting (11) into , it can be obtained
where .
By combining (1), (6), (15), and (16), . Because , when intersectoral distortions exist, the proportion of labor, capital and intermediate input factors in the department i are, respectively,
Then, in the undistorted state between departments, the proportion of factor input of the department is
Substituting formulas (17)–(20) into Formula (2), respectively, the total factor productivity (A) of the energy industry in the state of resource misallocation and the total factor productivity (A*) of the energy industry in the state of no misallocation can be obtained, and the degree of resource misallocation in the energy industry can be calculated according to Formula (3). Then, let, respectively, , , equal to 1, the total factor productivity of the energy industry after correcting capital misallocation (Ak*), labor misallocation (Al*) and intermediate input misallocation (Am*), respectively, can be calculated. The capital misallocation (dk*), the labor misallocation (dl*), and the intermediate input misallocation (dm*) of the energy industry can be obtained, respectively, by using the calculation method of Formula (3).
4. Parameter Calibration and Data Processing
4.1. Calibration of Main Parameter Values
It can be obtained from the first order condition of maximizing the departmental profit: , , , of which, is the nominal output of department i. Calculated by the first-order condition of the overall profit maximization of the energy industry, it can be obtained that , is the output price index of industry I in year t. Additionally, this paper refers to the method in Brandt et al. [13]; we substitute interdepartmental elasticity of output to the value 1/3. The elasticity of the output of capital, labor, and intermediate input in the energy industry is obtained by the linear regression method. In this paper, the total output, capital, labor, and intermediate input of the energy industry in each province in China are taken as logarithms, respectively, and the results of mixed regression are shown in Table 1. We mainly use the two-way fixed effect model to estimate the output elasticity of capital, labor, and intermediate inputs. It can be seen from Table 1 that after only controlling the time effect, industry effect, and regional fixed effect, the output elasticity of the capital factor is 0.300, the output elasticity of the labor factor is 0.1171, and the output elasticity of the intermediate input is 0.5188, and the above output elasticity coefficients are all significant at the 1% significance level. In addition, since the sum of the output elasticity of the three factors is less than 1, this paper conducts a Wald test to confirm the returns to scale of the energy industry. The test results show that the energy industry has the nature of diminishing returns to scale, which is consistent with the conclusions of Liu and Wu [8].

Table 1.
Estimation of the elasticity of production factor output in the energy sector.
4.2. Data Processing and Data Source Description
Through the above model derivation and calculation process, it can be seen that to calculate the inter-industry and inter-region resource allocation efficiency of energy industries in the Yangtze River Economic Belt, the data of total output value, capital stock, intermediate input, and labor force of subdivision industry of energy industry in each province of the Yangtze River Economic Belt are needed. Referring to the existing research experience [34], this paper selects four subdivision industry of the energy industry in the provinces of the Yangtze River Economic Belt as the research objects, namely, mining and washing of the coal industry, extraction of petroleum and natural gas industry, processing of petroleum, coal and other fuels industry, and production and distribution of electricity and heating power industry. Among them, this paper uses the total industrial output value of each subdivision to measure the output Y and uses the price index of the energy industry to deflate it to get the actual output of each subdivision industry of the energy industry. The intermediate input of the industry is measured by the total industrial output value minus the industrial added value. Due to the lack of data on the added value of some industries, considering that the annual change of the added value rate of the energy industry is very small, this paper uses the added value rate of the industry in the same region in recent years multiplied by the total output value of that year to get the estimated value of its industry added value. The annual average balance of net fixed assets is used to represent the capital stock, and the number of employees in the industry is used as the labor input. The data used in this paper are mainly from the statistical yearbooks of each province.
5. Analysis of Quantitative Assessment Results and Characteristics
5.1. Quantitative Evaluation Results and Characteristics Analysis of Inter-Industrial Resource Allocation Efficiency of Energy Industries in the Yangtze River Economic Belt
In this paper, the data of the four major energy subdivision industries in the Yangtze River Economic Belt are summed up to obtain the data of the four major energy subdivisions in the Yangtze River Economic Belt (namely, the total output value, capital input, labor input and intermediate product input of the industry data), and the level of resource misallocation among the energy industries and the level of resource misallocation among the sub-factors in the energy industries of the Yangtze River Industrial Zone from 2000 to 2019 are calculated based on the theoretical model. The calculation results are shown in Table 2. From 2000 to 2019, the average annual loss of total factor productivity of the energy industry in the Yangtze River Economic Belt caused by resource misallocation among the energy industries was as high as 25.11%, and in 2019, it was as high as 27.20%. From the perspective of resource misallocation among the sub-factors, the average annual loss of total factor productivity of the energy industry in the Yangtze River Economic Belt is 12.32%, while the average annual loss of total factor productivity caused by labor misallocation and intermediate input misallocation is 7.08% and 5.08%, which is much lower than that caused by capital misallocation. Therefore, to alleviate the misallocation of resources among the energy industries in the Yangtze River Economic Belt, how to speed up the flow of capital elements from inefficient energy industries to efficient energy industries is very important to improve the efficiency of resource allocation among the energy industries in the Yangtze River Economic Belt.
Table 2.
The level of resource misallocation between energy industry industries in the Yangtze River Economic Belt.
To more clearly observe the changing trend of resource misallocation among energy industries in the Yangtze River Economic Belt, this paper continues to draw Figure 1 based on the data in Table 2. It can be seen from Figure 1 that capital misallocation is the main cause of resource misallocation among energy industries in the Yangtze River Economic Belt, so its change trend is highly consistent with the changing trend of total misallocation among industries. From 2000 to 2019, the total misallocation of resources and capital misallocation among energy industries in the Yangtze River Economic Belt can be divided into three stages according to the changing trend. The first stage is from 2000 to 2004, in which the level of misallocation among energy industries fluctuates horizontally. The second stage was from 2005 to 2013, in which the level of misallocation between energy industries was increasing year by year. The third stage is from 2014 to 2019, in which the level of misallocation among energy industries is easing year by year. Labor misallocation and intermediate input misallocation are relatively stable and at a low level, of which labor misallocation is significantly higher than intermediate input misallocation before 2006, but the misallocation level gap shows a convergence trend year by year, and the level of labor misallocation and intermediate input misallocation has been basically similar after 2007.
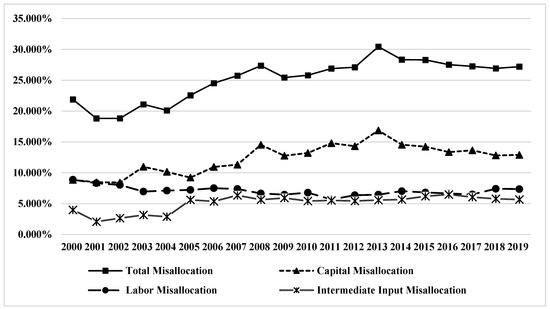
Figure 1.
Schematic diagram of the change in the level of resource misallocation between energy industries in the Yangtze River Economic Belt from 2000 to 2019.
Considering that among the 11 provinces in the Yangtze River Economic Belt, there are great differences in basic conditions such as resource endowment, the orientation of key development industries, and environmental governance capacity, there may be great differences in resource allocation efficiency among the energy industries. Therefore, on the basis of calculating the level of resource misallocation among energy industries in each province, this paper divides the 11 provinces in the Yangtze River Economic Belt into upstream, midstream, and downstream regions and further examines the regional heterogeneity of resource misallocation among energy industries in the Yangtze River Economic Belt, as shown in Figure 2.
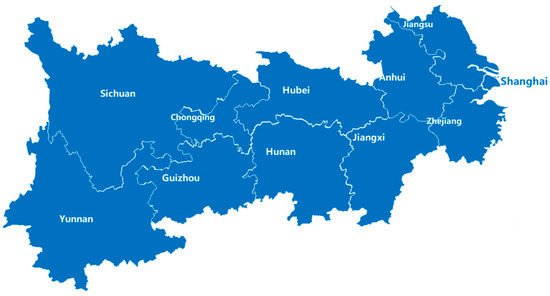
Figure 2.
Eleven provinces in the Yangtze River Economic Belt.
It can be seen from Table 3 that from 2000 to 2019, the resource misallocation among the energy industries in the upper, middle, and lower reaches of the Yangtze River Economic Belt has significant regional heterogeneity. Among them, the resource misallocation among the upstream, midstream, and downstream provinces is increasing in turn; that is, the resource misallocation level of the downstream provinces is the highest, followed by the midstream, and the upstream is the lowest. The capital misallocation in the midstream and upstream provinces is significantly higher than the labor misallocation and the intermediate input misallocation, while the capital misallocation in the downstream provinces is lower than the labor misallocation in 2001, and since 2011, the capital misallocation has exceeded the labor misallocation. Among the downstream provinces, the resource misallocation among the energy industries in Shanghai is the most serious, and its total misallocation, capital misallocation, and intermediate input misallocation are increasing year by year, while the labor misallocation is easing year by year. At the same time, the intermediate input misallocation has also risen rapidly since 2011 and exceeded the capital misallocation and labor misallocation, which has become the main cause of resource misallocation among energy industries in downstream provinces, while the intermediate input misallocation in midstream and upstream provinces has always been at a low level. Among the provinces in the Yangtze River Economic Belt, only the resource misallocations among the energy industries in Hunan and Chongqing have been alleviated year by year, while the rest of the provinces have been increasing or fluctuating horizontally year by year, which fully demonstrates the necessity and urgency of correcting the resource misallocation between the energy industries in the Yangtze River Economic Belt.
Table 3.
The misallocation of energy industry resources in the upper, middle, and lower reaches of the Yangtze River Economic Belt from 2000 to 2019.
To more clearly reflect the changing trend and heterogeneity characteristics of resource misallocation among energy industries in the upper, middle, and lower reaches of the Yangtze River Economic Belt, this paper draws a line graph of Figure 3. From the upper left of Figure 3, it can be seen that the resource misallocation among energy industries in the upper reaches can be divided into three stages according to its evolution trend characteristics. The period from 2000 to 2005 is a stage of stable evolution at a low level. In this stage, the total misallocation level remained between 10% and 15%. The period from 2005 to 2010 is a stage of rapid ascent. In this stage, the total misallocation level increased rapidly, from about 10% in 2005 to 20.82% in 2010. The period from 2011 to 2019 is a stage of stable evolution at a high level. In this stage, the level of resource misallocation among energy industries in the upstream region steadily continued the high trend in 2010. Until 2019, the total misallocation level is stable at about 20%. The inter-industry misallocation of the energy industry in the downstream region can be roughly divided into two stages. The first stage is the fluctuation climbing stage; that is, from 2000 to 2013, the inter-industry resource misallocation of the energy industry in the downstream region increased from 22.42% in 2001 to 40.38% in 2013 after several fluctuations climbing. The second stage is from 2013 to 2019. After the supply-side structural reform in China, the resource misallocation among the energy industries in the downstream regions began to decline year by year, but after 2017, there was an upward trend. The level of resource misallocation among energy industries in the midstream region is roughly between the upstream region and the downstream region and basically fluctuates between 20% and 30% in the sample period.
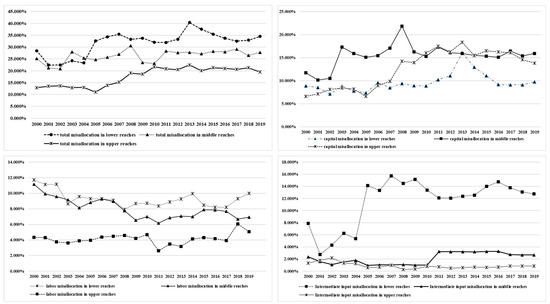
Figure 3.
Schematic diagram of the mean change of resource misallocation between energy industries in the upper, middle, and lower reaches of the Yangtze River Economic Belt.
The upper right of Figure 3 shows the trend of capital misallocation among energy industries in the upper, middle, and lower reaches of the Yangtze River Economic Belt. The capital misallocation in the middle and lower reaches shows a trend of rising first and then declining, with the inflection point year in the middle reaches being 2008 and that in the lower reaches being 2013. The capital misallocation in the upstream region showed a trend of rising first, then stabilizing and fluctuating gently, which also reached the highest value of 18.376% in 2013, and then was stable with a slight decline. The lower left of Figure 3 shows the changing trend of labor misallocation among energy industries in the upper, middle, and lower reaches of the Yangtze River Economic Belt. It can be seen that although the level of labor misallocation in the middle and lower reaches fluctuates and declines year by year, it is significantly higher than that in the upper reaches. The level of labor misallocation in the upper reaches is basically below 6%, but it has been rising since 2017.
The lower right of Figure 3 shows the changing trend of intermediate input misallocation among energy industries in the upper, middle, and lower reaches of the Yangtze River Economic Belt. The intermediate input misallocation in the lower reaches is significantly higher than that in the middle and upper reaches. The intermediate input misallocation in the lower reaches increased rapidly around 2005 and has been fluctuating at a high level since then. The level and evolution trend of intermediate input misallocation in the midstream and upstream regions were basically the same before 2010. After 2010, the intermediate input misallocation in the midstream region rose rapidly to more than 2.5% and exceeded that in the upstream region, while the intermediate input misallocation of the upstream region maintained its evolution trend at a low level. From 2000 to 2019, it basically fluctuated slightly between 1% and 2%. It can be seen that the resource misallocation among the energy industries in the Yangtze River Economic Belt has strong regional heterogeneity and factor heterogeneity. To optimize the resource misallocation among the energy industries in the Yangtze River Economic Belt, one is to pay attention to the downstream areas where the misallocation level is more serious, and the other is to consider that the capital misallocation is an important factor leading to the resource misallocation among the energy industry in the Changjiang River Economic Zone. In the future, we need to focus on correcting capital misallocation and promoting the free and efficient allocation of capital elements among industries by breaking the monopoly of the energy industry.
5.2. Quantitative Evaluation Results and Characteristics Analysis of Inter-Regional Resource Allocation Efficiency of Energy Industry in the Yangtze River Economic Belt
As mentioned above, in addition to the imbalance of industrial and industrial structure, regional market segmentation and local protection are also important structural factors leading to the distortion of resource allocation in China. Under the background of accelerating the reform of energy marketization and the construction of a unified national market, the inter-regional allocation efficiency of the energy industry in the Yangtze River Economic Belt is directly related to the realization of the goal of building a unified energy market in the Yangtze River Economic Belt. Therefore, it is necessary to conduct in-depth research on the inter-regional resource misallocation efficiency in the Yangtze River Economic Belt to find the focus for the energy market reform and the construction of a unified energy market in the Yangtze River Economic Belt.
The inter-regional resource misallocation of the energy industry in the Yangtze River Economic Belt is estimated as shown in Table 4.
Table 4.
The level of resource misallocation of energy industry between areas in the Yangtze River Economic Belt.
From 2000 to 2019, the average annual loss of total factor productivity caused by the inter-regional resource misallocation of the energy industry in the Yangtze River Economic Belt was 6.5%, which is much lower than the inter-industrial resource misallocation. Among them, the average annual loss of total factor productivity caused by capital misallocation, labor misallocation, and intermediate input misallocation is 2.48%, 3.40%, and 0.63%, that is, the inter-regional misallocation of the energy industry in the Yangtze River Economic Belt is mainly caused by labor misallocation, which is different from the serious situation of inter-industrial capital misallocation. Therefore, the focus of correcting the inter-regional misallocation of resources in the energy industry of the Yangtze River Economic Belt should be on promoting the free and efficient flow and allocation of labor among regions.
To more clearly understand the characteristics of the changing trend of inter-regional resource misallocation of the energy industry in the Yangtze River Economic Belt, this paper continues to draw a line graph of Figure 4 based on the data in Table 4. As can be seen from Figure 4, the inter-regional resource misallocation of the energy industry in the Yangtze River Economic Belt was basically stable at about 6% before 2010, and the total misallocation level increased from 6.012% to 8.091% between 2011 and 2015. After the release of the Outline of Yangtze River Economic Belt Development Plan, by optimizing the spatial layout of economic and social development in the Yangtze River Economic Belt, the misallocation of resources among regions in its energy industry has been reduced to 6.045% in 2019. The trend of capital misallocation is basically consistent with that of total misallocation. Labor misallocation was significantly higher than capital misallocation before 2014, and after 2014, the level of capital misallocation began to be higher than labor misallocation, which became the main factor of inter-regional misallocation, but it also began to decline year by year, and finally dropped to a level similar to labor misallocation in 2019. The level of intermediate input misallocation has remained at a low level, basically between 0 and 1% from 2000 to 2019.
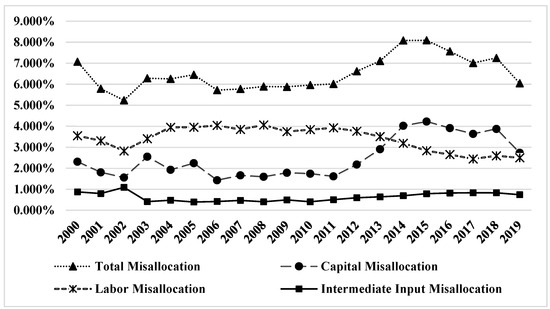
Figure 4.
Schematic diagram of the change in the level of resource misallocation of the energy industry between regions in the Yangtze River Economic Belt from 2000 to 2019.
The above study only examines the overall TFP loss of the energy industry in the Yangtze River Economic Belt caused by the misallocation of resources among the regions of the energy industry in the Yangtze River Economic Belt, while the above study cannot answer which provinces have allocated too many resources, which provinces have allocated insufficient resources, and which provinces should be allocated to the future energy industry. Based on this, this paper continues to use the above theoretical model, using the proportion of factor input in the distorted state calculated in the model: ki, li, mi and the proportion of factor input in the undistorted state: , , . By calculating the proportion of the factor input in the distorted state and in the effective state, pki = ki/, pli = li/, and pmi = mi/, we can measure the excessive or insufficient degree of energy industry factor input of each province. The closer pki, pli, and pmi to 1, the closer the factor input of province’s the energy industry is to the effective level. If pki, pli, and pmi are larger than 1, it will indicate that the resource input of the province’s energy industry is in an excessive state, and if pki, pli, and pmi are less than 1, it will indicate that the resource input of the province’s energy industry is in an insufficient state.
Table 5 shows the proportion of resources input into the energy industry in each province of the Yangtze River Economic Belt from 2000 to 2019.
Table 5.
Resource input efficiency of the energy industry in various provinces of the Yangtze River Economic Belt from 2000 to 2019.
It can be seen from Table 5 that in the lower reaches, the labor, capital, and intermediate input of the energy industry in Anhui are in an excessive state in 2019, while the labor and capital input of Jiangsu, Zhejiang, and Shanghai are insufficient, and the intermediate input is in an excessive state. In the middle reaches, the heterogeneity of energy industry factor input is stronger. In Hubei, the labor and intermediate input are insufficient, and the capital input is excessive, while in Hunan, the capital input is insufficient, and the labor and intermediate input are in the state of excessive input. In Jiangxi, the state of excessive input has gradually evolved into insufficient input, and the gap of capital factor input has been expanding year by year.
The labor and capital factors in the upstream provinces are in a state of excessive input, and the intermediate input in Sichuan, Guizhou, and Chongqing is in a state of insufficient input, except for Yunnan, whose overall input efficiency of the intermediate input is at a high level, and the input deviation is less than 10%. From the perspective of the evolution trend of resource input status in the upper, middle, and lower reaches, the state of labor, capital, and intermediate input in the lower reaches was insufficient in 2000 and 2010, and the gap of capital and labor input in the lower reaches was closed in 2019, but it was still in a state of insufficient. Intermediate input has evolved from insufficient state to excessive state, and the level of excessive input has reached 10.5%. The resource input efficiency of the three provinces in the middle reaches has strong heterogeneity. The resource input efficiency of the energy industry in Hubei Province has been improving continuously from 2000 to 2019, and the labor, capital, and intermediate input are all significantly close to the effective state. From 2000 to 2019, the labor and intermediate input in Hunan Province was in an excessive state, and the degree of excessive input showed an increasing trend, while the capital input remained insufficient, with a capital input gap of 11.7% as of 2019. The proportion of capital, labor, and intermediate input in Jiangxi Province has been declining year by year, among which labor and intermediate input have evolved from excessive input to insufficient input in 2019, while capital input has remained insufficient, and its gap of input has been expanding year by year, and its gap of capital input has expanded to 38.9% by 2019. The input of labor and capital in the four provinces in the upstream region has always maintained an excessive state, although their excessive level has decreased over time; however, as of 2019, the input of capital and labor are still excessive by 54.8% and 48.3%, respectively, and the input efficiency of the four provinces in the upstream region has been significantly improved year by year. Although the input status has changed from excessive (2000) to insufficient (2010 and 2019), the dispersion level of intermediate input deviation in the four upstream provinces has decreased significantly, and the input deviation of intermediate input is less than 10%. As of 2019, there is an average gap of only 1.6% in the intermediate input of the four upstream provinces, which is very close to the effective input state.
6. Conclusions
The resource allocation efficiency of the energy industry in the Yangtze River Economic Belt is related to green and high-quality development. By constructing a quantitative evaluation model of the resource allocation efficiency of the energy industry, this paper quantitatively evaluates the resource allocation efficiency of the energy industry among industries and regions in the Yangtze River Economic Belt. The calculation results show that:
- (1)
- From 2000 to 2019, the annual average loss of total factor productivity of the energy industry caused by the inter-industrial resource misallocation in the Yangtze River Economic Belt was as high as 25.11%. Among them, the capital misallocation is 12.32%, the labor misallocation and the intermediate input misallocation are 7.08% and 5.08%, respectively, which are much lower than the capital misallocation. Therefore, the focus of correcting the misallocation of resources among the energy industries in the Yangtze River Economic Belt should be on promoting the free flow and efficient allocation of capital among Energy Industry subdivisions by breaking the industry monopoly.
- (2)
- The resource misallocation among the provinces in the upper, middle, and lower reaches of the Yangtze River Economic Belt has significant regional heterogeneity. Among them, the resource misallocation among the upstream, midstream, and downstream provinces is increasing in turn; that is, the resource misallocation level of the downstream provinces is the highest, followed by the midstream, and the upstream is the lowest.
- (3)
- From 2000 to 2019, the average annual loss of total factor productivity caused by inter-regional resource misallocation among the energy industry in the Yangtze River Economic Belt was 6.5%, which is much lower than that of resource misallocation among industries. Among them, capital misallocation, labor misallocation, and intermediate input misallocation are 2.48%, 3.40%, and 0.63%, respectively, that is to say, the inter-regional misallocation of the energy industry in the Yangtze River Economic Belt is mainly caused by labor misallocation. Therefore, the focus of correcting the misallocation of resources among regions in the energy industry of the Yangtze River Economic Belt should be on promoting the free and efficient flow and allocation of labor among regions.
- (4)
- By calculating the resource input efficiency of the energy industry in the Yangtze River Economic Belt from 2000 to 2019, it is found that in the lower reaches, the labor, capital, and intermediate input of the energy industry in Anhui are in an excessive state, while the labor and capital input of Jiangsu, Zhejiang, and Shanghai are insufficient, and the intermediate input is in an excessive state. In the middle reaches, the heterogeneity of energy industry factor input is stronger. In Hubei, the labor and intermediate input of the energy industry are insufficient, and the capital input is excessive, while in Hunan, the capital input is insufficient, the labor and intermediate input are excessive, and in Jiangxi, the labor and intermediate input are gradually changed from excessive input to insufficient input. The gap of insufficient input of capital is expanding year by year. The labor and capital in the upstream provinces are in a state of excessive input, and the intermediate input in Sichuan, Guizhou, and Chongqing is in a state of insufficient input except for Yunnan, but the overall input efficiency of the intermediate input is at a high level, and the deviation of input is less than 10%.
- (5)
- From the evolution trend of resource input in the upper, middle, and lower reaches, the input of capital and labor of the energy industry in the lower reaches is always in a state of shortage, but the gap has been bridged, while the intermediate input has evolved from insufficient to excessive. The resource input efficiency of the three provinces in the middle reaches has strong heterogeneity, and the labor, capital, and intermediate input of the energy industry in Hubei Province are significantly close to the effective state. The resource input efficiency of the energy industry in Hunan and Jiangxi shows no obvious signs of improvement and even shows a deteriorating trend in some sub-factors. Labor and capital in the four provinces in the upstream region have always maintained a state of excessive investment, although the level of excessive investment has decreased over time, but as of 2019, capital and labor’s input are excessive by 54.8% and 48.3%, respectively, and the efficiency of intermediate investment has been significantly improved year by year. There is an average gap of only 1.6% in the intermediate input of the four upstream provinces, which is very close to the effective input state.
Author Contributions
Conceptualization, B.Z. and W.D.; methodology, B.Z. and J.Y.; software, W.D. and J.Y.; validation, B.Z., W.D. and J.Y.; formal analysis, B.Z. and W.D.; investigation, B.Z., W.D. and J.Y.; resources, W.D. and J.Y.; data curation, J.Y.; writing—original draft preparation, B.Z. and W.D.; writing—review and editing, W.D. and J.Y.; visualization, B.Z. and W.D.; supervision, B.Z. and W.D.; project administration, B.Z. and W.D.; funding acquisition, B.Z. and W.D. All authors have read and agreed to the published version of the manuscript.
Funding
The work was supported by the National Social Science Foundation of China [17ZDA114]; the Shanghai Philosophy Society Planning Youth Project [2020EJB006]; Shanghai Pujiang Program [18PJC085]; the 2022 CPC History and Party Building Project of Fujian Agriculture and Forestry University [22FAFUDJ002].
Institutional Review Board Statement
Not applicable.
Informed Consent Statement
Not applicable.
Data Availability Statement
The data presented in this study are available on request from the corresponding author.
Conflicts of Interest
The authors declare no conflict of interest.
References
- Cai, F. How can Chinese economy achieve the transition toward total factor productivity growth? Soc. Sci. China 2013, 1, 56–71+206. [Google Scholar]
- Tang, W.B.; Fu, Y.H.; Wang, Z.X. Technology innovation, technology introduction and transformation of economic growth pattern. Econ. Res. J. 2014, 49, 31–43. [Google Scholar]
- Hsieh, C.T.; Klenow, P.J. Misallocation and Manufacturing TFP in China and India. Q. J. Econ. 2009, 124, 1403–1448. [Google Scholar] [CrossRef]
- Yang, R.D. Study on the total productivity of Chinese manufacturing enterprises. Econ. Res. J. 2015, 61–74. [Google Scholar]
- Song, M.L.; Jin, P.Z. Regional protection, resource misallocation and environmental welfare performance. Econ. Res. J. 2016, 51, 47–61. [Google Scholar]
- Liu, M.P. The energy industry should implement a “negative list” system for market access. Macroecon. Manag. 2015, 53–55+60. [Google Scholar]
- Yuan, P. A decomposition analysis on the change of energy demand in China. J. Quant. Tech. Econ. 2014, 31, 70–85. [Google Scholar]
- Liu, Z.M.; Wu, Z.Q. Will intermediate product market distortion hinder the improvement of total factor productivity in energy industry—A theoretical and empirical research based on micro-enterprise data. China Ind. Econ. 2019, 8, 42–60. [Google Scholar]
- Yuan, Z.G.; Xie, D.D. The effect of labor misallocation on TFP: China’s evidence 1978—2007. Econ. Res. J. 2011, 7, 4–17. [Google Scholar]
- Aoki, S. A Simple Accounting Framework for the Effect of Resource Misallocation on Aggregate Productivity. MPRA paper No. 12506. 2009. Available online: https://www.sciencedirect.com/science/article/pii/S0889158312000354 (accessed on 13 December 2022).
- Chen, Y.W.; Hu, W.M. Distortions, Misallocation and losses: Theory and application. China Econ. Q. 2011, 10, 1401–1422. [Google Scholar]
- Han, J.; Zheng, Q.L. How does government intervention lead to regional resource misallocation—Based on decomposition of misallocation within and between industries. China Ind. Econ. 2014, 11, 69–81. [Google Scholar]
- Brandt, L.; Tombe, T.; Zhu, X. Factor Market Distortions across Time, Space and Sectors in China. Rev. Econ. Dyn. 2013, 16, 39–58. [Google Scholar] [CrossRef]
- Jin, L.Q. Analysis of resources misallocation among regions from 1992 to 2015. Soc. Sci. Beijing 2018, 1, 57–66. [Google Scholar]
- Chen, S.Y. Misallocation, economic growth performance and the market entry of firms: A dual perspective of state and non-state sectors. Acad. Mon. 2017, 49, 42–56. [Google Scholar]
- Jin, L.Q. Analysis of the financial resources misallocation caused by ownership discrimination. Econ. Perspect. 2015, 36–44. [Google Scholar]
- Zhang, T.H.; Zhang, S.H. Biased policy, resource allocation and aggregate productivity. Econ. Res. J. 2016, 51, 126–139. [Google Scholar]
- Bai, P.W.; Yang, Z.C. Research on the distortion of labor capital allocation and its influence factors for the Yangtze River Delta. Bus. Manag. J. 2016, 38, 29–46. [Google Scholar]
- Jin, L.Q.; Hu, S.C.; Zhang, B.C. Study on structural misallocation degree of innovation resources in China. Stud. Sci. Sci. 2019, 37, 545–555. [Google Scholar]
- Xie, J. Research on human capital mismatch across provinces in China. Chin. J. Popul. Sci. 2019, 6, 84–96+128. [Google Scholar]
- Chen, Z.; Chen, Q.Y. Energy efficiency of Chinese firms: Heterogeneity, influencing factors and policy implications. China Ind. Econ. 2019, 12, 78–95. [Google Scholar]
- Gao, P.; Yue, S.J. Measurement of total-factor embodied energy efficiency of China’s industry sectors. J. Quant. Tech. Econ. 2020, 37, 61–80. [Google Scholar]
- Wei, C.; Shen, M.H. Energy efficiency and energy productivity: A comparison based on the panel data by province. J. Quant. Tech. Econ. 2007, 9, 110–121. [Google Scholar]
- Hu, H.S.; Dong, W.H.; Zhou, Q. A comparative study on the environmental and economic effects of a resource tax and carbon tax in China: Analysis based on the computable general equilibrium model. Energy Policy 2021, 156, 11. [Google Scholar] [CrossRef]
- Chen, K.; Zheng, C. ON The Yangtze valley energy use efficiency. Resour. Environ. Yangtze Basin 2009, 18, 969–975. [Google Scholar]
- Fu, C.; Wu, X.J. Regression analysis model and case study on the impact factors of energy efficiency. Resour. Environ. Yangtze Basin 2010, 19, 1107–1110. [Google Scholar]
- Guan, W.; Xu, S.T.; Gup, X.Y. Spatiotemporal change and driving factors of comprehensive energy efficiency in the Yellow River Basin. Resour. Sci. 2020, 42, 150–158. [Google Scholar] [CrossRef]
- Shen, B.; Li, X. Financial development, industrial structure upgrading and energy efficiency improvement. Inq. Into Econ. Issues 2020, 12, 131–138. [Google Scholar]
- Xiong, G.Q.; Shi, D.Q. Do industrial transfer demonstration zones improve energy efficiency? China Popul. Resour. Environ. 2021, 31, 27–36. [Google Scholar]
- Lin, B.Q.; Du, K.R. The energy effect of factor market distortion in China. Econ. Res. J. 2013, 48, 125–136. [Google Scholar]
- Lin, B.Q.; Liu, C. Chinese energy subsidy reform and effective energy subsidies. Soc. Sci. China 2016, 10, 52–71+202–203. [Google Scholar]
- Shi, D.; Li, S.L. Emissions trading system and energy use efficiency—Measurements and empirical evidence for cities at and above the prefecture level. China Ind. Econ. 2020, 9, 5–23. [Google Scholar]
- Wu, C.Q.; Dong, X. Research on time and space disparities of total factor energy efficiency in the Yangtze River Economic Belt under the constrained environment. Resour. Environ. Yangtze Basin 2015, 24, 1646–1653. [Google Scholar]
- Wang, P.; Wu, Y.T. The market distortions and total factor productivity of Chinese energy industry. Econ. Res. J. 2014, 49, 142–155. [Google Scholar]


Publisher’s Note: MDPI stays neutral with regard to jurisdictional claims in published maps and institutional affiliations. |
© 2022 by the authors. Licensee MDPI, Basel, Switzerland. This article is an open access article distributed under the terms and conditions of the Creative Commons Attribution (CC BY) license (https://creativecommons.org/licenses/by/4.0/).