Article

Sensitivity of EPA of Ground Motion to Soil Slope Dynamic Response

1
School of Urban Geology and Engineering, Hebei GEO University, Shijiazhuang 050031, China
2
Hebei Technology Innovation Center for Intelligent Development and Control of Underground Built Environment, Shijiazhuang 050031, China
3
Zhongjin Environmental Technology Co., Ltd., Taiyuan 030021, China
4
College of Geological Engineering, Institute of Disaster Prevention, Sanhe 065201, China
*
Authors to whom correspondence should be addressed.
Sustainability 2022, 14(24), 16985; https://doi.org/10.3390/su142416985
Submission received: 14 October 2022 / Revised: 2 December 2022 / Accepted: 15 December 2022 / Published: 18 December 2022
(This article belongs to the Special Issue Slope Stability Monitoring and Evaluation)

Abstract

:
To study the influence law of effective peak acceleration (EPA) on the seismic response of soil slope, the finite element method was used to simulate the slope response under earthquake action with 100 actual seismic records were selected, the influence law of the EPA under four different definitions commonly used in domestic and foreign codes on the soil slope seismic response was discussed, and which was compared with the influence law of the peak acceleration (PGA). The results showed that the deformation and the maximum principal stress of soil slope both increased with the EPA and PGA, which had an obvious linear relationship, but the correlation degree were different with the parameters of PGA and EPA by the different definitions. EPA1 by the first definition has the highest correlation with the soil slope seismic response, followed by PGA, which was close to EPA1. Other parameters in order of correlation coefficient were EPA2, EPA3 and EPA4. In this example, EPA1 and PGA could better describe the response degree of soil slope in earthquake. The results are expected to provide a basis for the selection of seismic parameters in soil slope seismic stability evaluation.

1. Introduction

Effective peak acceleration (EPA) is defined differently in national norms, but it is generally obtained by dividing the average spectral value of a periodic point on the acceleration response spectrum or the average spectral value of a periodic segment by the average dynamic amplification coefficient β. The maximum value of the seismic acceleration time history given in the current GB 50011-2010 “Code for Seismic Design of Buildings” [1] is EPA, not the peak ground motion acceleration (PGA). Long et al. [2] used the seismic acceleration records in 2008 Wenchuan earthquake to compare the EPA and PGA and concluded that the correlation between EPA and earthquake intensity is stronger than that between PGA and earthquake intensity. In addition, Chang et al. [3] pointed out that seismic records adjustment for structural dynamic time history analysis should be based on EPA rather than PGA. Chen et al. [4] analyzed the attenuation relationship based on 154 horizontal strong earthquake records with magnitudes greater than 4.5 recorded on bedrock in the western United States. They concluded that PGA was not an ideal seismic design parameter to reflect seismic effects, and EPA is proposed to replace PGA. An et al. [5] proposed an improved EPA adjustment method is proposed, which can be applied to all types of seismic waves by using a unified expression, and it is verified that the improved method can evaluate the ground vibration intensity more reasonably. In addition, Biswajit Basu et al. [6] studied the dependence of EPA on several control parameters, and the results showed that although EPA was highly dependent on the time period, it was possible to obtain the “periodic average” EPA value of some ground motion processes in the project, which provided a reasonable basis for obtaining the EPA of a given ground motion. Cao et al. [7] performed a statistical analysis of the EPA definition and related parameters in the code based on the response spectra of acceleration records from 222 sets of actual earthquakes, and the results show that the dispersion degree of EPA calculated by EPA = Sa(T′)/βmax(T′) is larger than that calculated by the EPA = Sa(0.1–0.5)/β(0.1–0.5). Zhong et al. [8], respectively, took PGA and EPA as parameters to analyze the seismic hazards of I2 engineering sites in the Jinsha River Basin, and obtained the bedrock PGA and EPA values of each site under different annual exceeding probability. Yi et al. [9] used the characteristics of EPA in the compilation of the fourth-generation “China Earthquake Parameter Zoning Map”, combined with the advantages of probabilistic and deterministic methods, and proposed the principles and methods, which determine the scenario earthquake of major engineering sites. Guo et al. [10] introduced the definition background of PGA and EPA and researched the relationship between EPA and PGA under bedrock site conditions. Zhang et al. [11,12] investigated the correlation between PGA, EPA and the deformation displacement and acceleration amplification coefficients of soil slopes, believed that they have positive correlation characteristics. Furthermore, other ground motion parameters are taken into account, such as the distance to fault, earthquake magnitude, and so on [13,14,15]. Based on the analysis of the above parameters, some prediction models with deep learning–based algorithm are proposed for landslide susceptibility prediction [16,17].
Throughout the current studies, there are many studies on the correlation between ground motion parameters and landslides [18,19,20,21,22,23,24], but few studies on the influence law of EPA on the seismic response of soil slope. The EPA corresponds to the period interval 0.1–0.5 s, which theoretically corresponds to the self-oscillation period of 1–6 storey industrial and civil buildings and is more closely related to the degree of seismic damage and seismic protection of buildings as a ground vibration parameter. In this paper, 100 ground motion records were selected to explore the correlation between EPA and the seismic response of soil slope, and several EPA definitions commonly used in the current domestic and foreign codes were used to study and analyze the influence law of EPA on the dynamic response of slope, which provides the foundations and basis for the selection of parameters for the analysis of seismic dynamic response of slope.

2. Methods

2.1. Calculation Method

2.1.1. Finite Element Analysis of Seismic Response of Soil Slope

The finite element numerical simulation method uses the actual ground motion input to truly reflect the dynamic response characteristics of the slope under the earthquake action, and is not limited by the geologic conditions, geometric configuration and other factors of the slope, which can solve the problem that is difficult to be solved by analytical method, and more realistically and reasonably evaluate the dynamic stability of the slope under the earthquake action, when studying and analyzing the slope stability under the earthquake action. Therefore, the finite element numerical simulation method is widely and deeply applied in solving the seismic stability problem of slope.
The following balance equation is used to calculate the seismic dynamic finite element (1) [25,26].
[ M ] { u ¨ } + [ C ] { u ˙ } + [ K ] { u } = { F ( t ) }
In this equation, [M] is the mass matrix of the structure, [C] is the damping matrix of the structure, [K] is the stiffness matrix of the structure,   { u ¨ } is the acceleration array of the structure, { u ˙ } is the velocity array of the structure, { u } is the displacement array of the structure, and { F ( t ) } is the nodal load array of the structure.
For solving the dynamic problem under earthquake action, the dynamic load is the seismic. Therefore, the basic mechanical equation for solving the seismic dynamic stability problem can be expressed in Equation (2):
[ M ] { u ¨ } + [ C ] { u ˙ } + [ K ] { u } = [ M ] { u ¨ g ( t ) }
In this equation, { u ¨ g ( t ) } is the time histories of ground motion acceleration.
Earthquake is a kind of complex load that changes completely with time. The slope rock and soil mass will often enter the elastic-plastic state under the action of earthquake action, and then the analytical solution cannot be obtained, and the analytical method is no longer applicable, but the numerical solution of the structural dynamic reaction can be obtained by numerical calculation. The common methods include the piecewise analysis method, the central difference method, the average constant acceleration method, the linear acceleration method, the Newmark- β method and the Wilson- θ method. The central idea of these methods is to assume that the structure exhibits a linear elastic reaction at every tiny time step, which is then solved by the step-by-step integration in the time domain. The ABAQUS software used in this paper is divided into two types of algorithms, implicit and explicit, where the implicit algorithm is based on the Newmark-β method, while the explicit module uses the central difference method to solve the dynamics problem. The implicit algorithm was used in this paper.

2.1.2. Definition of Effective Peak Acceleration

In the evaluation of slope seismic stability, it is very important to select the ground motion intensity index reasonably. Due to the subjectivity of EPA, there are differences in the definition and correlation value of EPA, and the main difference lies in the selection of cycle segments. The selection of different cycle ranges determines the sensitivity of EPA to different periodic structures. In order to fully study the influence of EPA on slope dynamic response under different definitions, this paper chooses the following definition methods of EPA commonly used at home and abroad for research, as listed in Equations (3)–(6):
Definition 1. 
“Sample Code for Seismic Design of Structures” (ATC-3) [27] in the US, in which the acceleration response spectrum with damping ratio of 5% was averaged to a constant value Sa between periods of 0.1–0.5 s.
EPA 1 = S a ( 0.1 0.5 ) 2.5
Definition 2. 
According to the “Code for Seismic Design of Buildings” (GB 50011-2010) [1] in China, the normalized acceleration response spectrum with a damping ratio of 5% was averaged to a constant value Sa between periods 0.1–Tg (Tg is the characteristic period of the response spectrum).
EPA 2 = S a ( 0.1 T g ) 2.5
Definition 3. 
“Seismic ground motion parameters zonation map of China (GB18306-2015) [28], the maximum value of the acceleration response spectrum of the normalized ground motion with 5% damping ratio is 1/2.5 times that of Sa.
EPA 3 = S a ( T d ) 2.5
Definition 4. 
In “Earthquake hazard Zoning map of the United States” (MSHM) [29], EPA is obtained by dividing the spectral value Sa at 0.2 s corresponding to the acceleration response spectrum by the dynamic amplification factor.
EPA 4 = S a ( 0.2 ) 2.5
It can be known from the above that the different amplification factors stipulated by different codes lead to differences in the final calculation results of EPA. Countries also have different regulations regarding the high frequency band of the accelerated response spectrum. For example, the American earthquake resistant code stipulates that the fixed selection is 0.1–0.5 s. The Chinese seismic design specification does not select this platform segment, but according to each reaction spectrum, and the U.S. specification value is determined, only the spectrum of the excellent cycle of the most built (structure) construction, which can lead to the selection of the EPA method suitable for the different structure.

2.1.3. Correlation Calculation Method

Reasonable ground motion intensity index should be able to effectively reflect the degree of seismic response of slope, in the seismic stability evaluation of slope. In this paper, the influence weight of ground motion parameters on the seismic response of slope is determined by the Pearson correlation coefficient, thus the reasonable parameters for evaluating the seismic stability of slope are obtained. The Pearson correlation coefficient is a kind of index to express the mutual relationship between two variables, which was put forward by British statistician Pearson in the 1880s. It is a dimensionless index from −1.0 to 1.0 that examines the degree of correlation between two things. Subsequently, it is widely used in the research to calculate the correlation degree between the two factors [30]. The specific calculation process is as follows:
Step 1. Mark the PGA or EPA of the i th ground motion as Ii;
Step 2. The finite element method is used to calculate the maximum slope response value Ri under the i th ground motion input;
Step 3. Repeat steps 1 and 2 to obtain all the ground motion records Ii and Ri;
Step 4. All recorded calculation results were plotted in the R-I coordinate system, and Pearson’s correlation coefficient R between R and I was obtained by calculation, as shown in Equation (7) below.
r = i = 1 100 ( Ri R ¯ ) ( Ii I ¯ ) i = 1 100 ( Ri R ¯ ) 2 i = 1 100 ( Ii I ¯ ) 2
In the formula, r is the influence weight of each ground motion parameter, and the closer R is to 1.0, the better its correlation is.

2.2. Modeling

In order to study the influence of EPA on the dynamic displacement response and stress response of slope under earthquake action, a two-dimensional soil slope model (Figure 1) has been established by reference to the layout control of slope monitoring points [31]. Five displacement observation points D1-D5 have been set up along the slope surface, and three stress observation points S1-S3 have been set up vertically. The length of the model is 170 m, the height is 70 m, the slope Angle is 34°, the slope height is 30 m, and the length of the rear edge of the slope top is 80 m. According to the research results of Lysmer et al. [32,33], the mesh size of the rock and soil mass model is controlled by the shortest wavelength of the input seismic wave, and the maximum mesh size should be less than 1/8–1/10 of the shortest wavelength. Furthermore, the constitutive model is an ideal elastic-plastic constitutive model, and the yield criterion is the Mohr-Coulomb strength criterion, which is suitable for geotechnical physical behavior. In order to fully study the influence of law of slope under earthquake action, the model material is assumed to be homogeneous material, and the physical and mechanical parameters of slope soil are shown in Table 1 [34,35]. The soil properties studied here are those of southwest China.
When simulating and analyzing the dynamic problems of semi-infinite bodies such as slopes, in order to prevent the superposition effect caused by the seismic wave propagating to the boundary of the model and reflecting back to the model, it is usually necessary to set the artificial boundary to simulate the scattering effect of the scattered wave to the semi-infinite space domain. In the analysis and calculation of this paper, the viscoelastic boundary [36,37] has been set at the artificial boundary of the model, namely, the spring and damping unit have been set at the boundary, and the Rayleigh damping form commonly used in engineering was used as the damping of the model.
In this paper, a total of 100 original ground motion records were randomly selected from the database of Pacific Earthquake Research Engineering Center (PEER) to study the applicability of different ground motion intensity parameters, and the baseline correction of the original ground motion records was performed before use. By the calculation, the strength range of PGA is 0.0041~1.2259 g, EPA1 is 0.002436~0.576058 g, EPA2 is 0.008410221~2.196830.06 g, EPA3 is 0.004532~1.231672 g, EPA4 is 0.003~0.923136 g. The ground motion acceleration was applied to the bottom of the model by horizontal input.

3. Results

Input the 100 ground motion records selected above, and the earthquake’s final displacement deformation and stress response of the slope have been obtained by simulation calculation. The influence law of EPA on the seismic response of slope will be discussed by taking the final deformation displacement and maximum principal stress of the Slope observation point as the representative values of slope response.

3.1. Influence Law of EPA on Slope Seismic Deformation Response

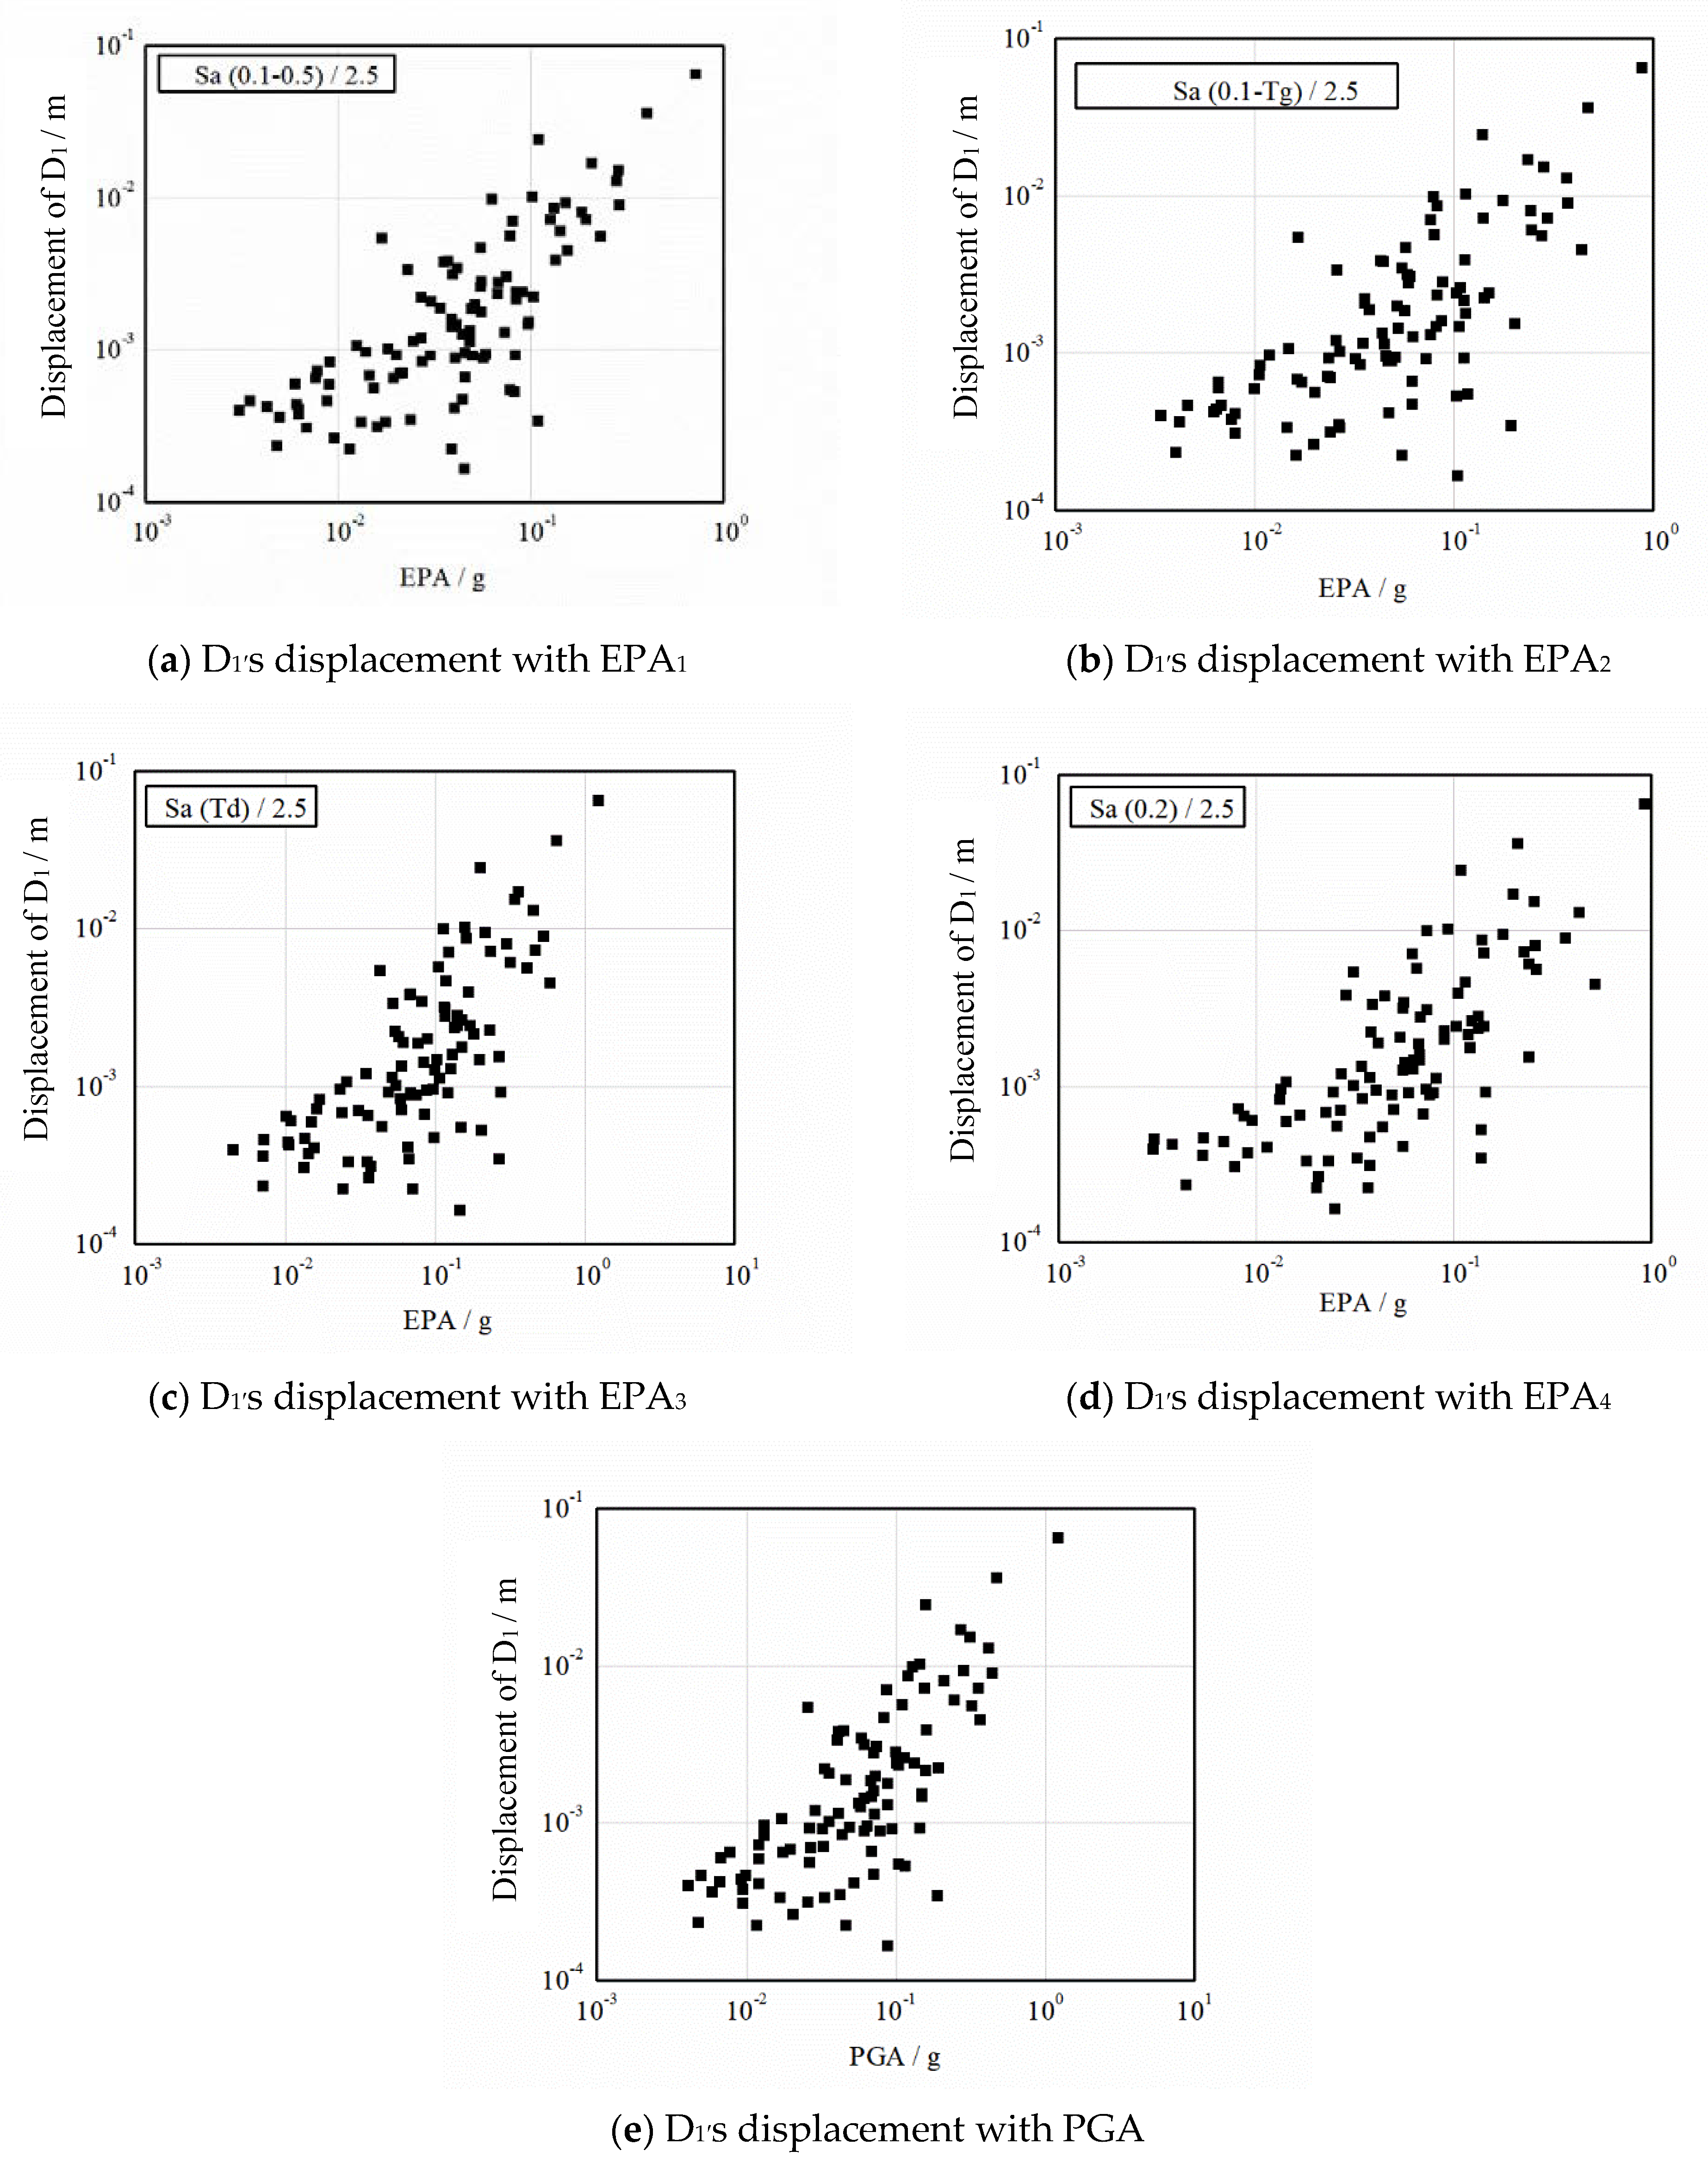
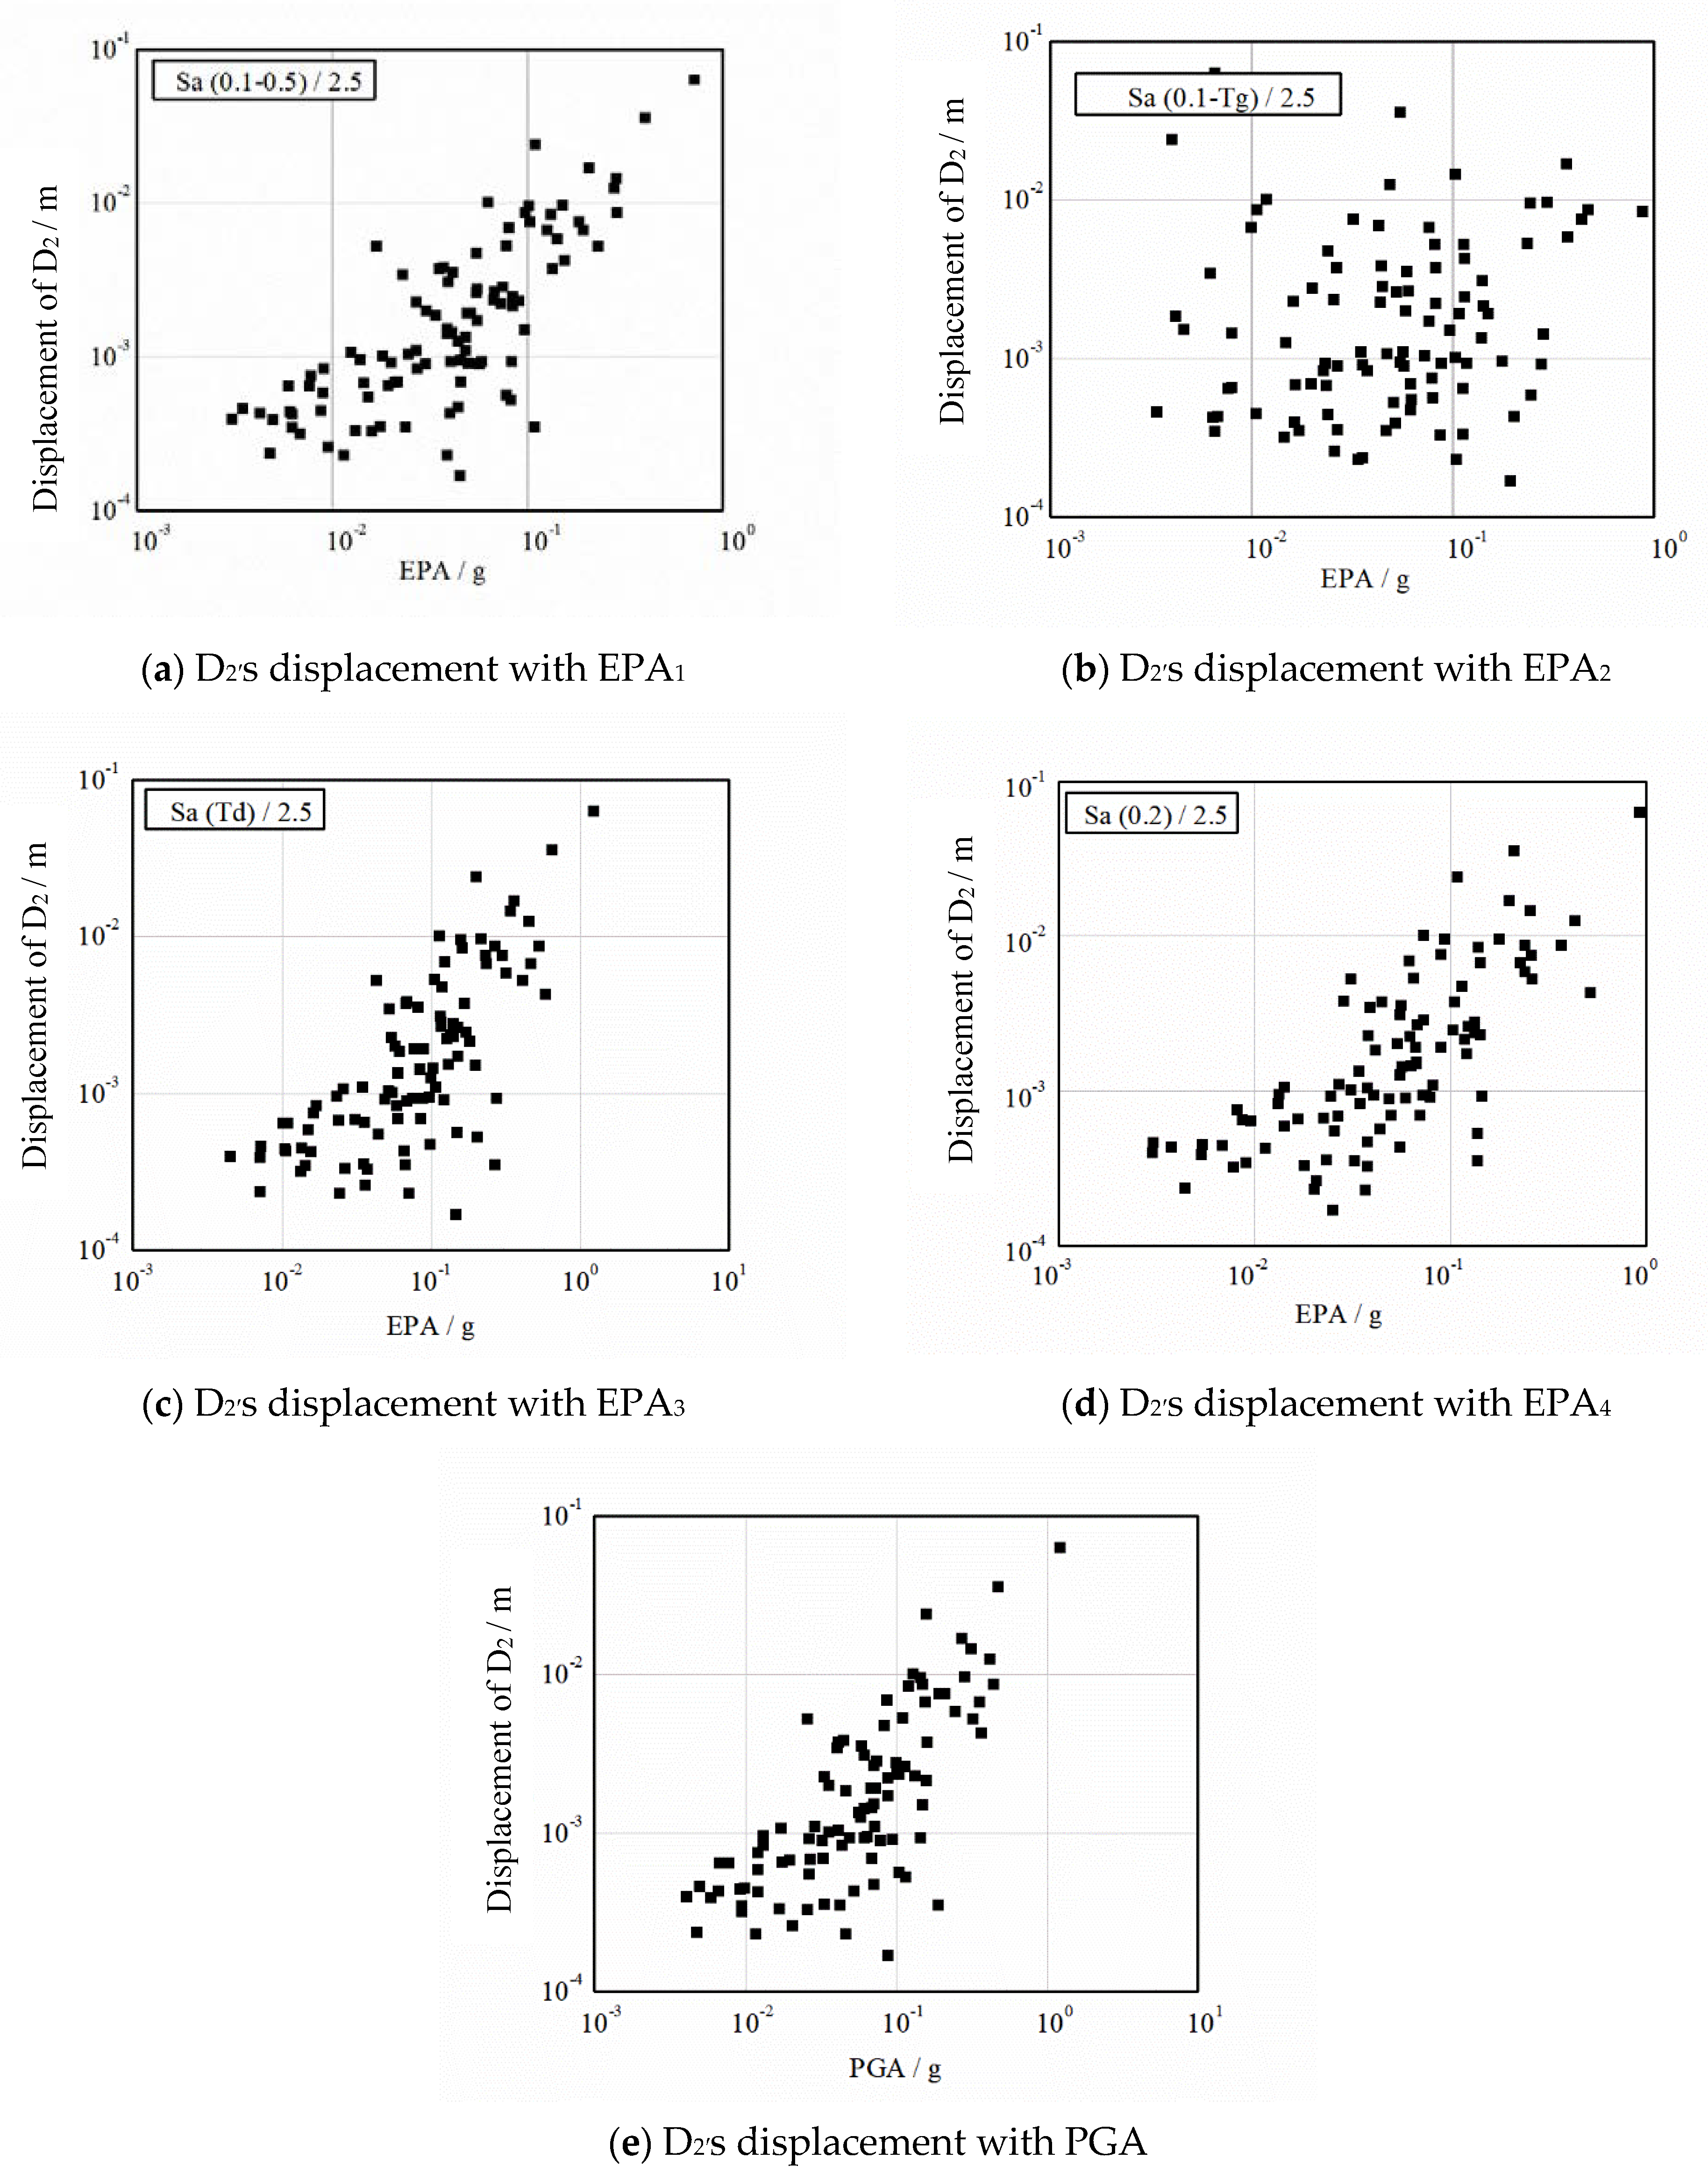
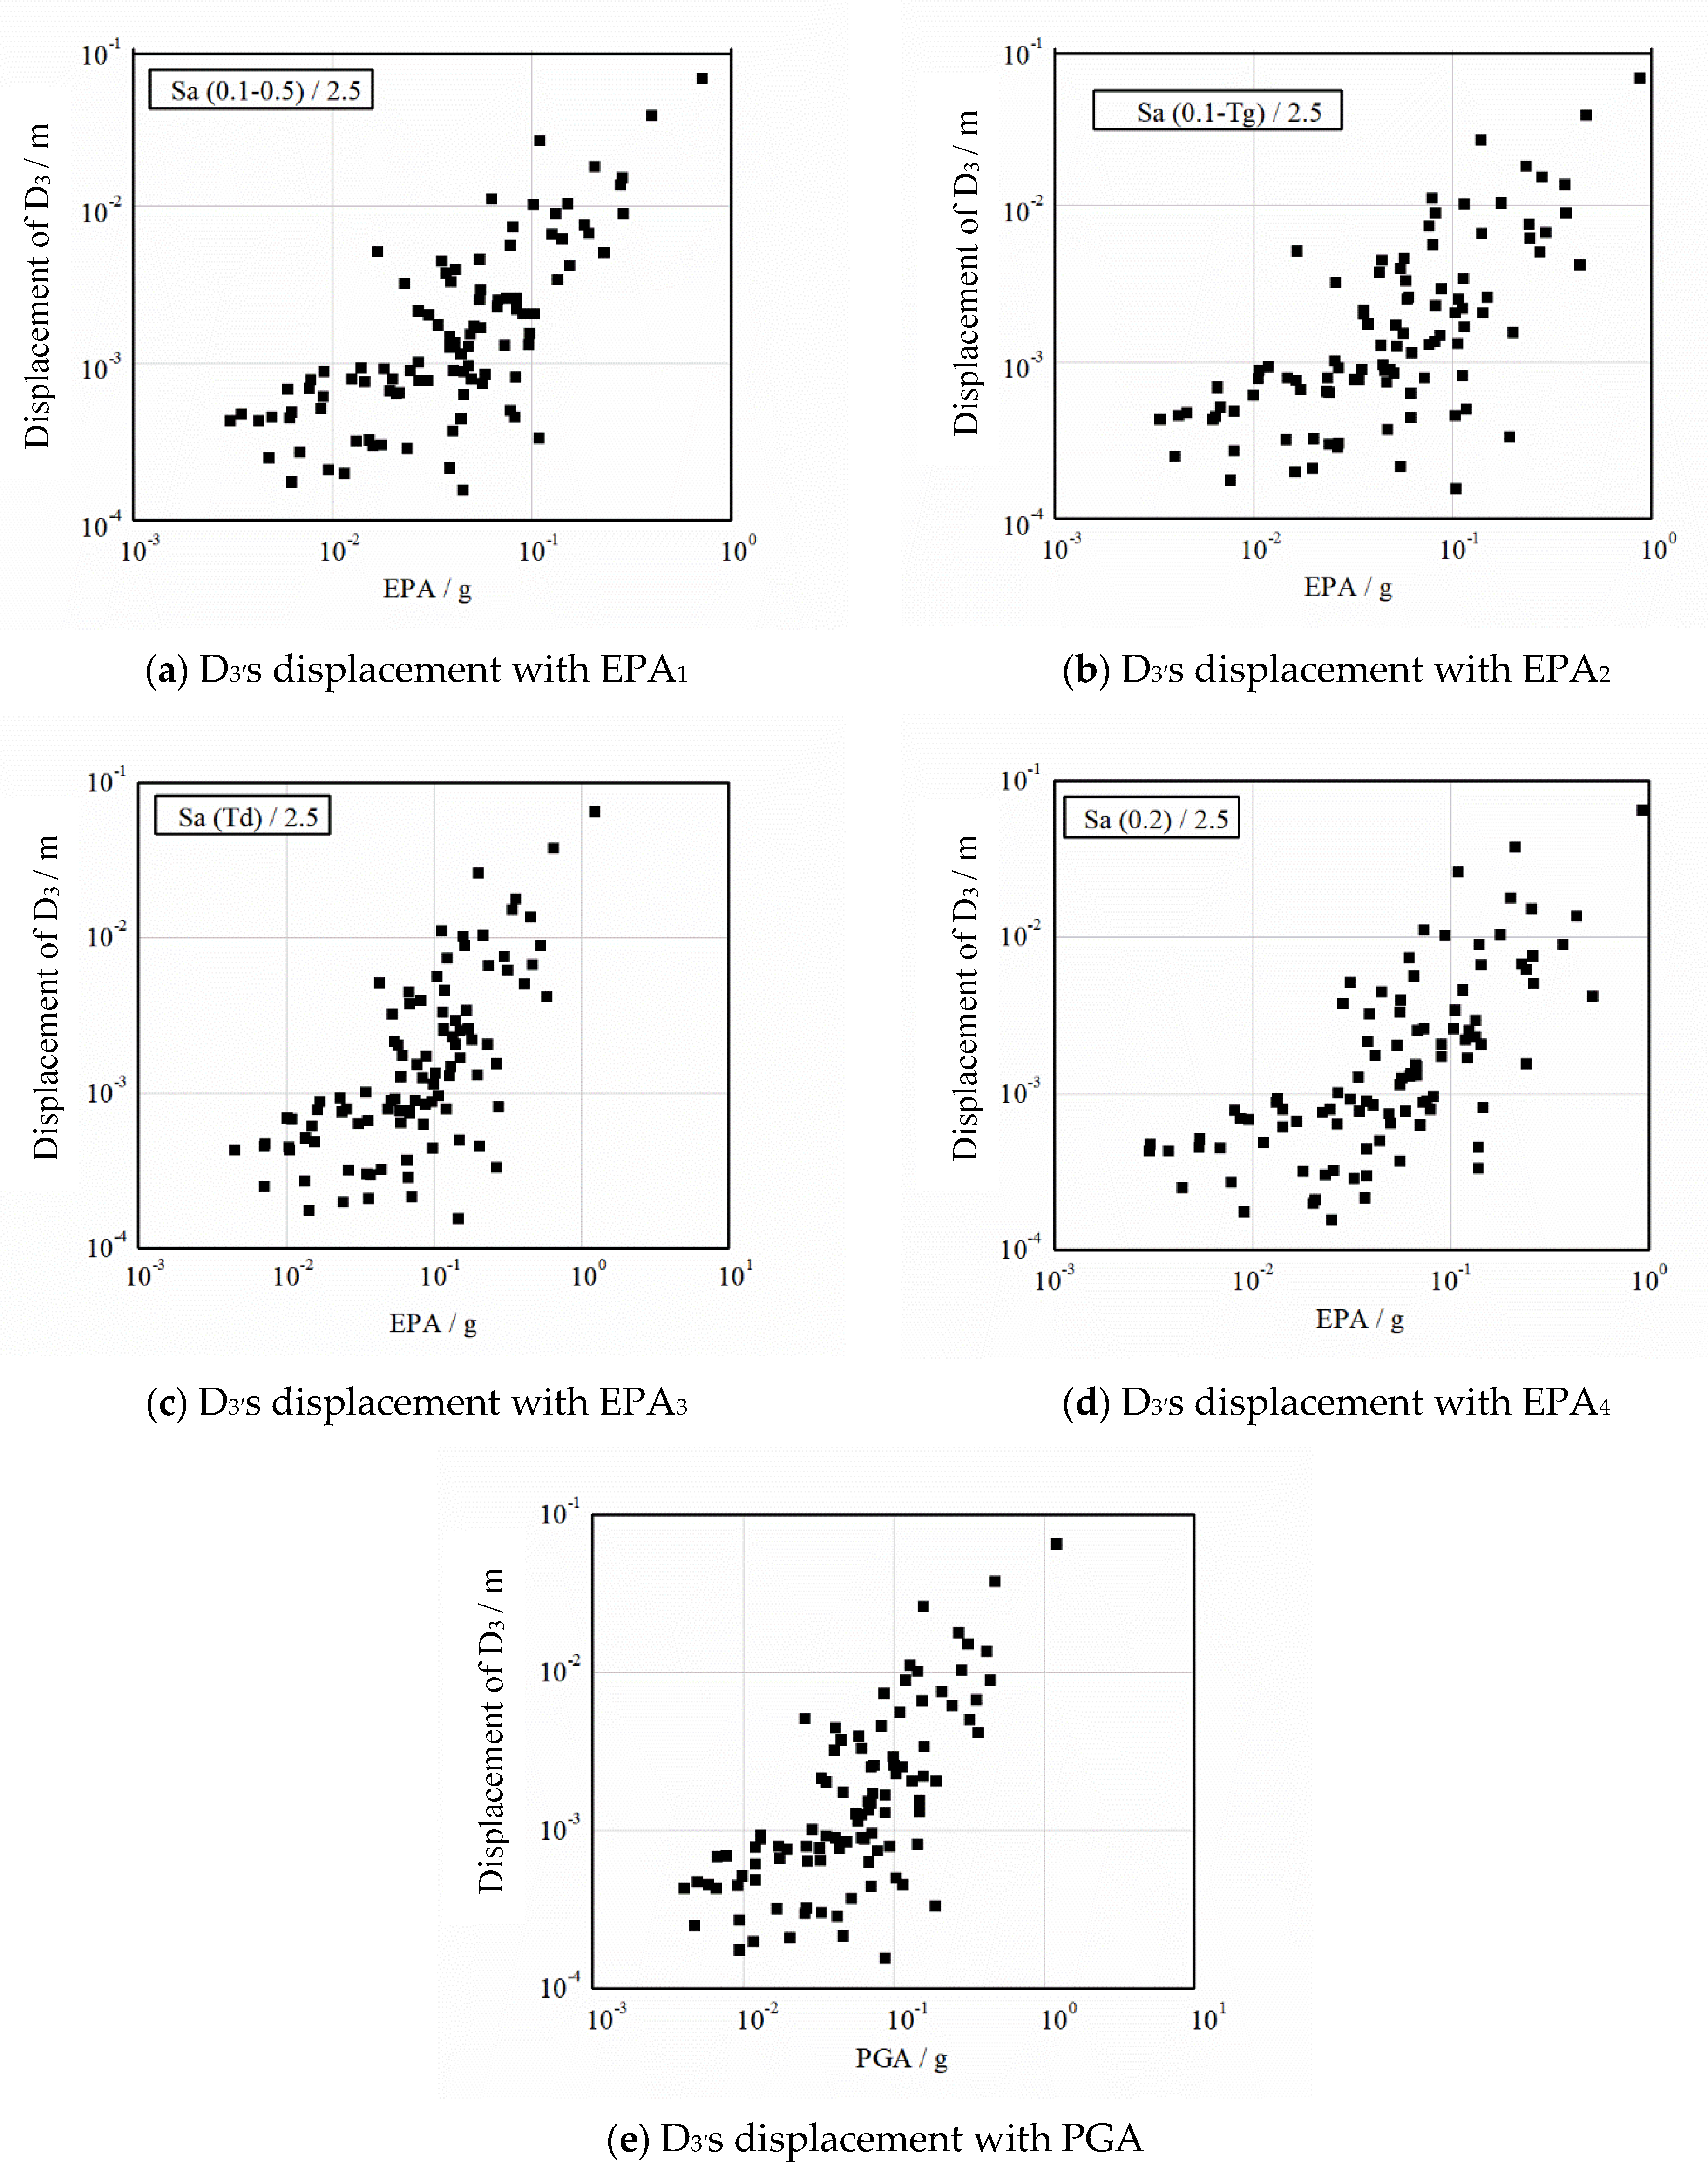
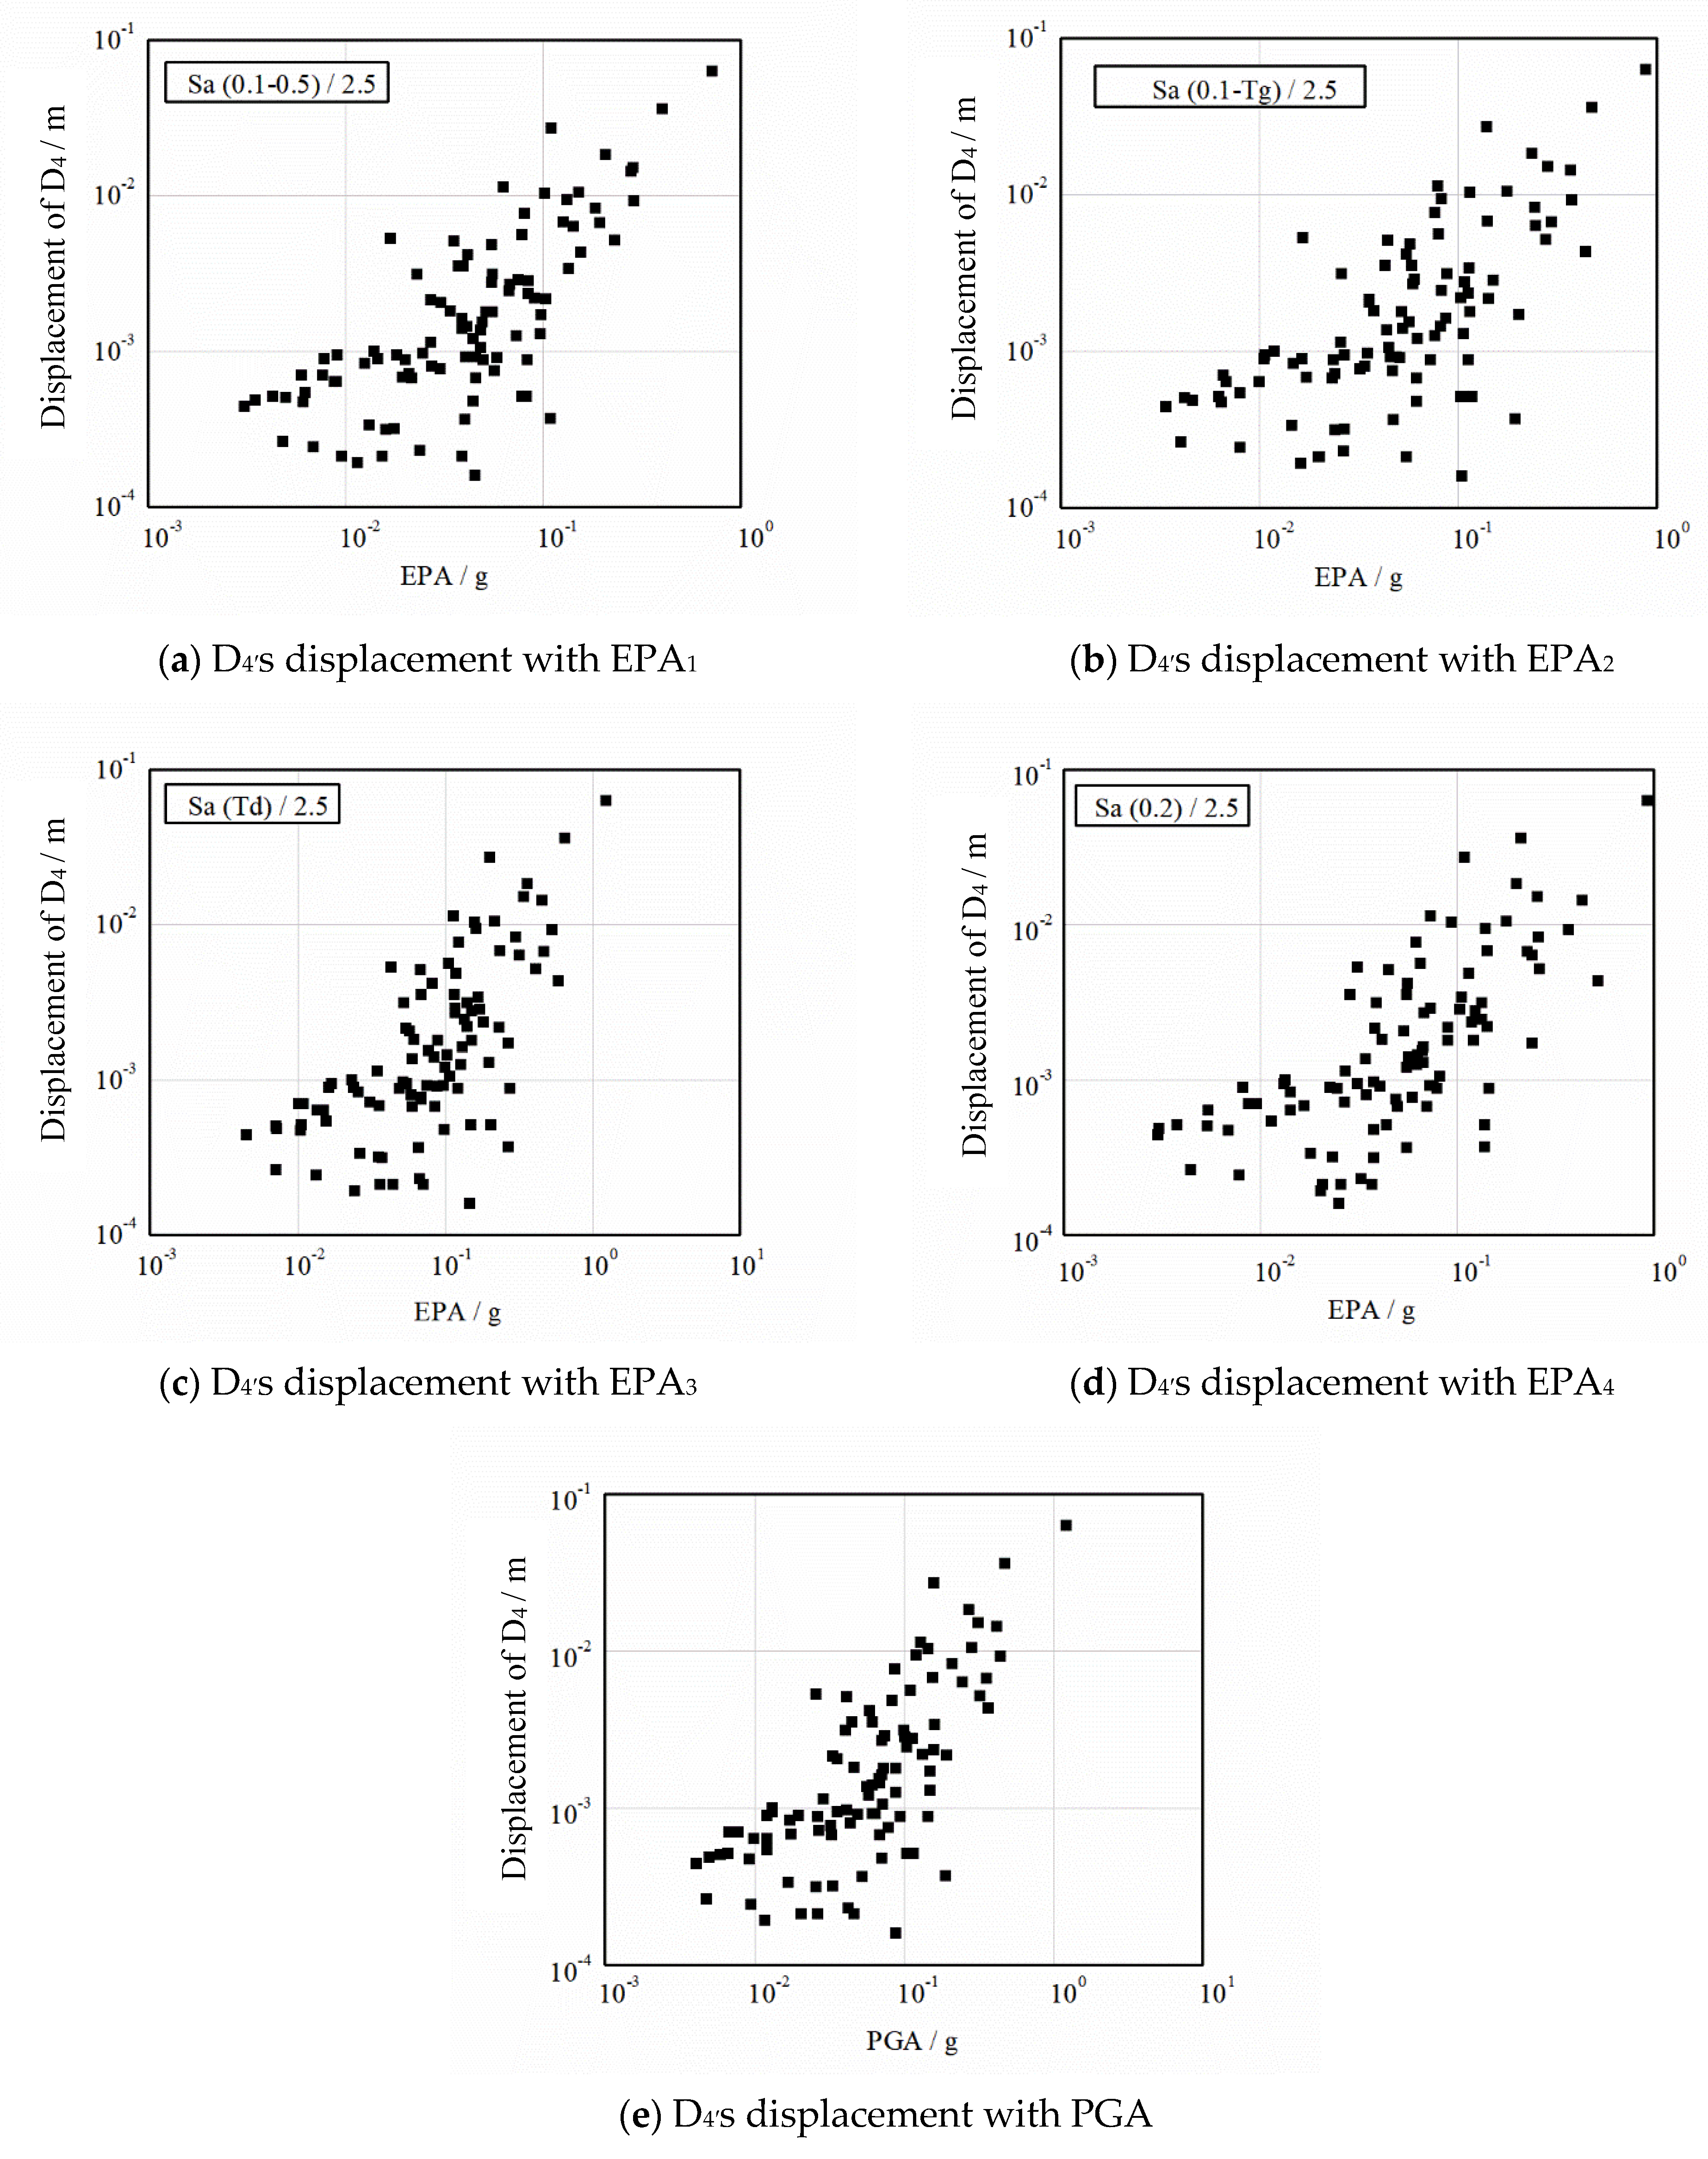
The final displacements of the 5 displacement observation points D1-D5 in the slope under the corresponding ground motion were extracted, and their corresponding relationships with PGA and EPA under the four definitions were made, as shown in Figure 2, Figure 3, Figure 4, Figure 5 and Figure 6, to study their change rule with EPA and PGA.
It can be seen from Figure 2, Figure 3, Figure 4, Figure 5 and Figure 6 that the deformation displacement response of different monitoring points has certain degree of linear relationships with EPA and PGA, the linear relationships between PGA, EPA of the same definition and the deformation displacement of different monitoring sites is almost the same, and it increases with the increase in EPA and PGA, showing a positive correlation overall. Moreover, by comparing the response images under PGA and different EPA definitions, it is not difficult to find that EPA1, EPA3 and PGA have the most obvious linear relationship with the slope displacement response, and their change rules are also the most similar.
Furthermore, in order to analyze the correlation degree further quantitatively between EPA and soil slope deformation, the correlation coefficient between them was calculated, as shown in Table 2. EPA1 and PGA have the highest correlation with the displacement deformation response of soil slope surface, and their average correlation coefficients with the displacement of the five monitoring points are 0.886 and 0.868, respectively, followed by EPA2, EPA3 and EPA4 in high and low order, with the average correlation coefficients of 0.824, 0.820 and 0.727.

3.2. Influence Law of EPA on Seismic Stress of Slope

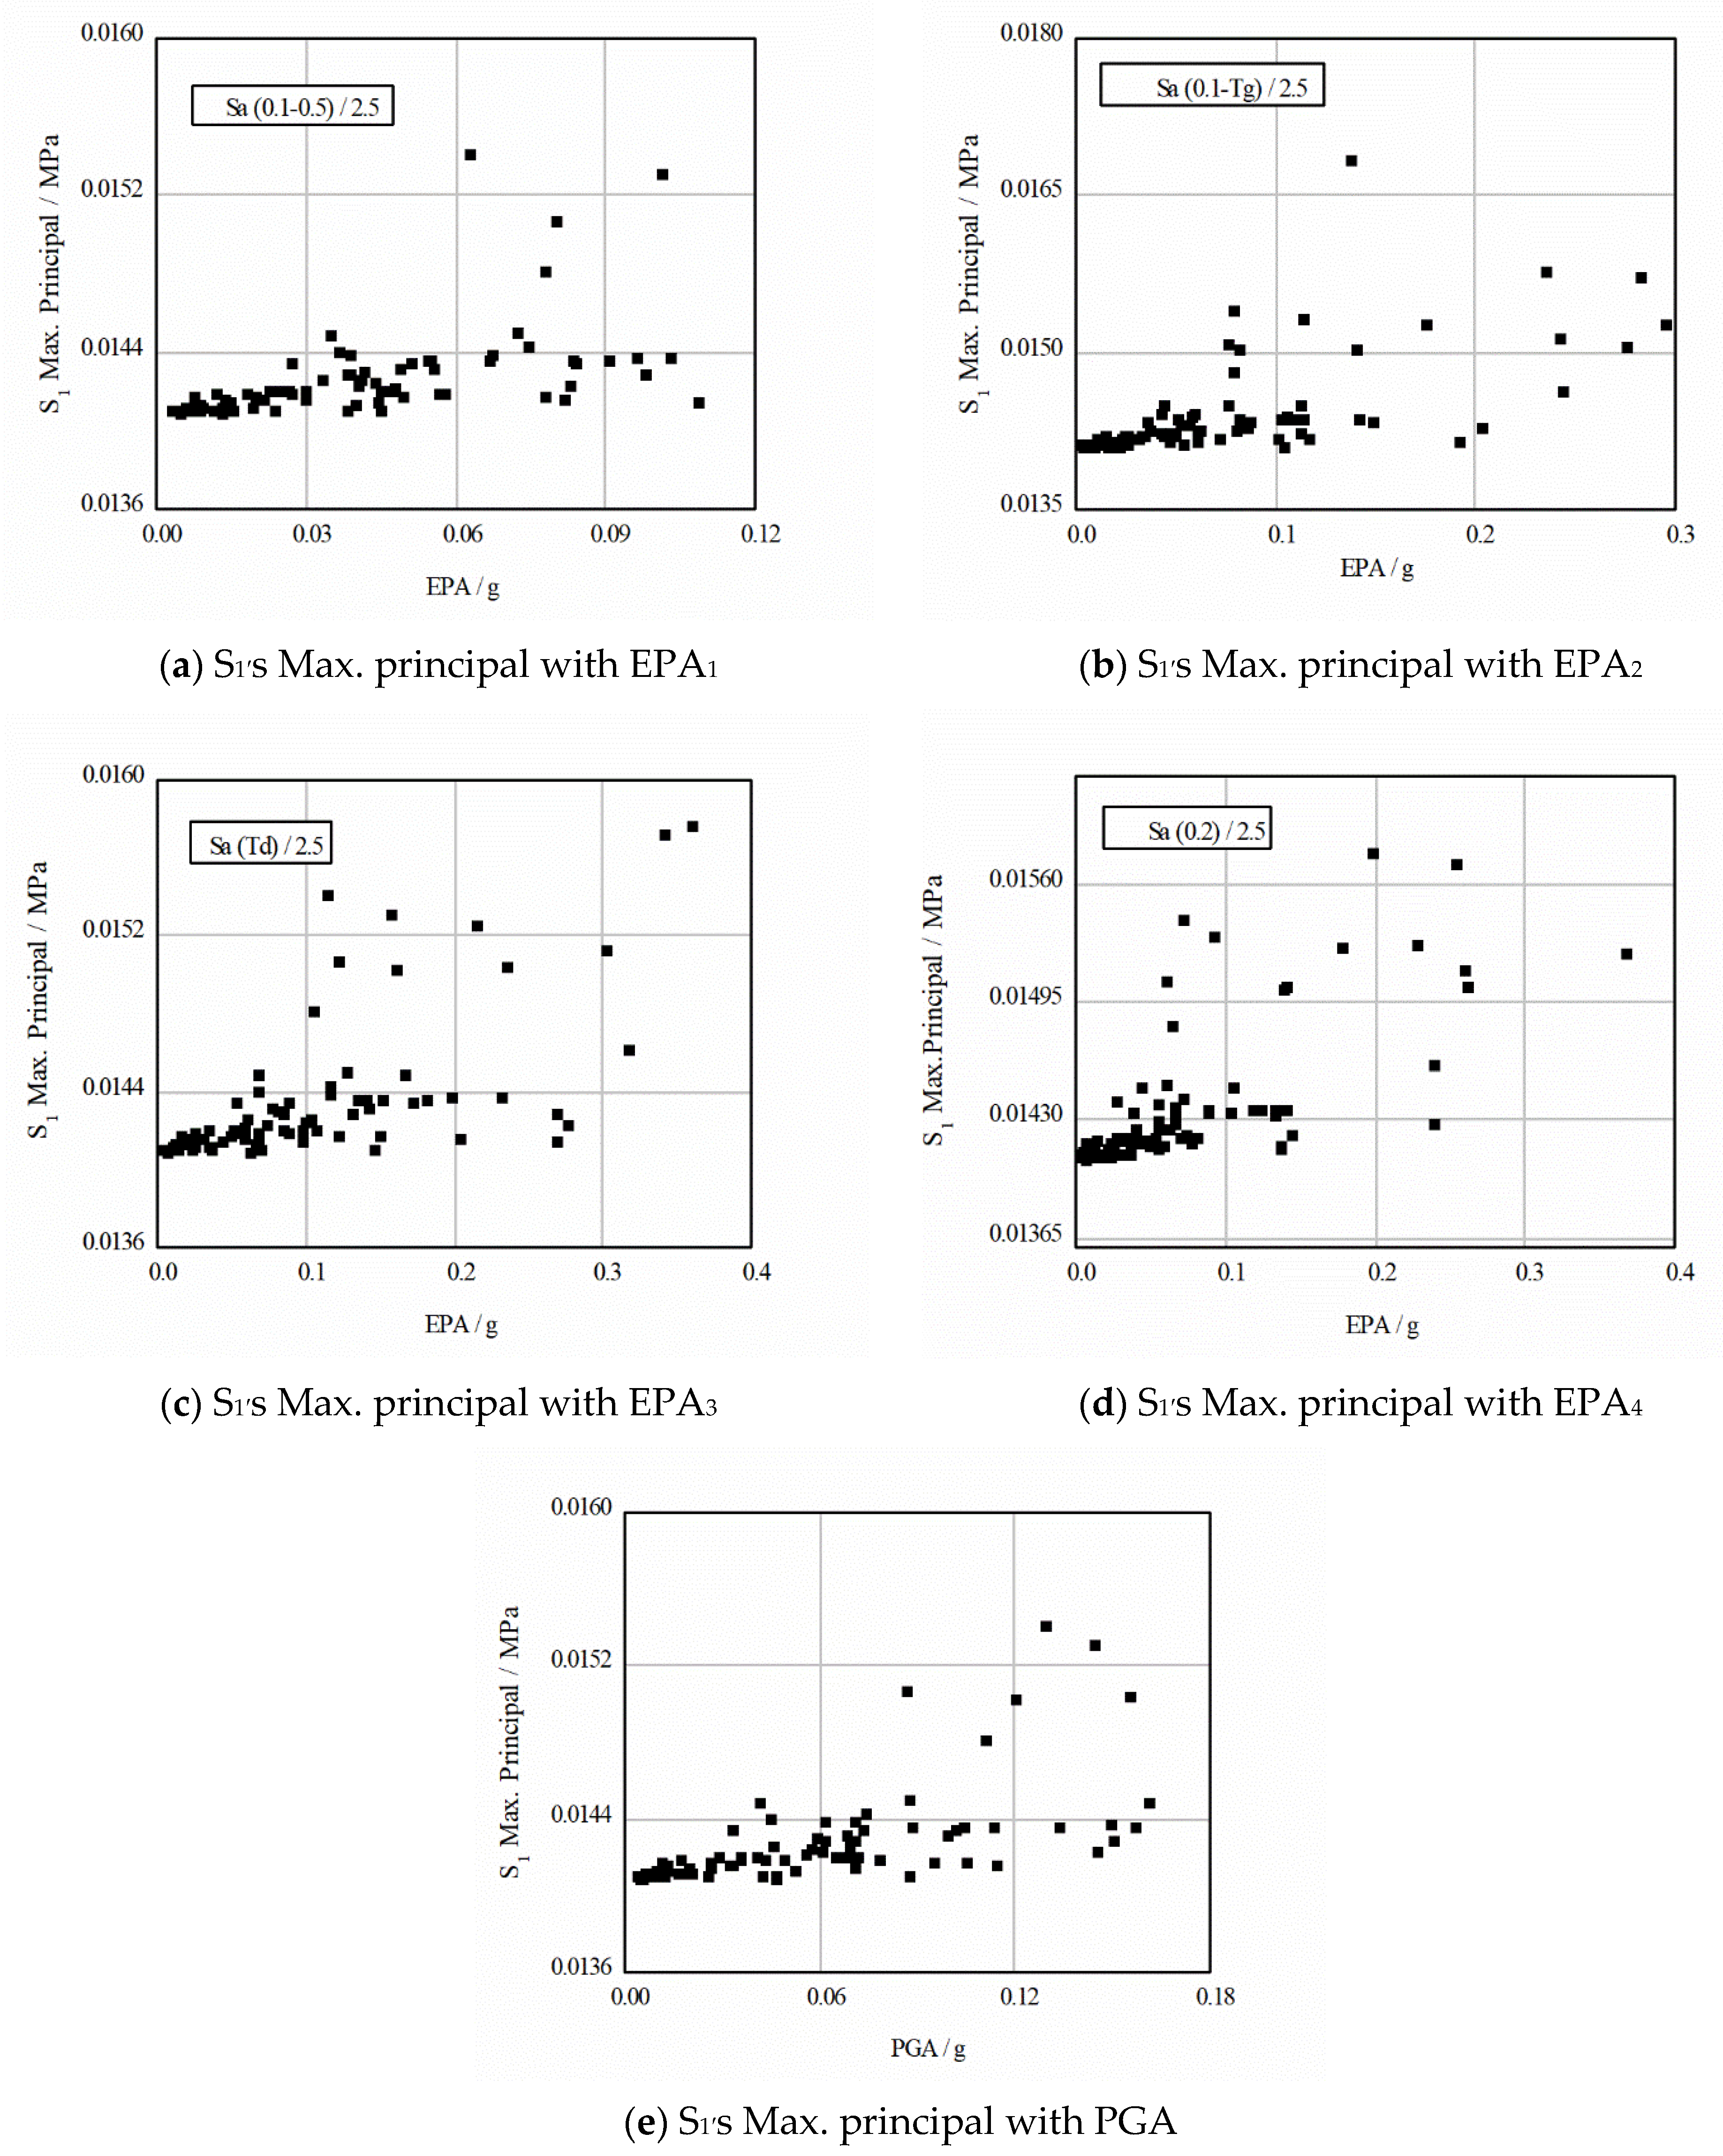
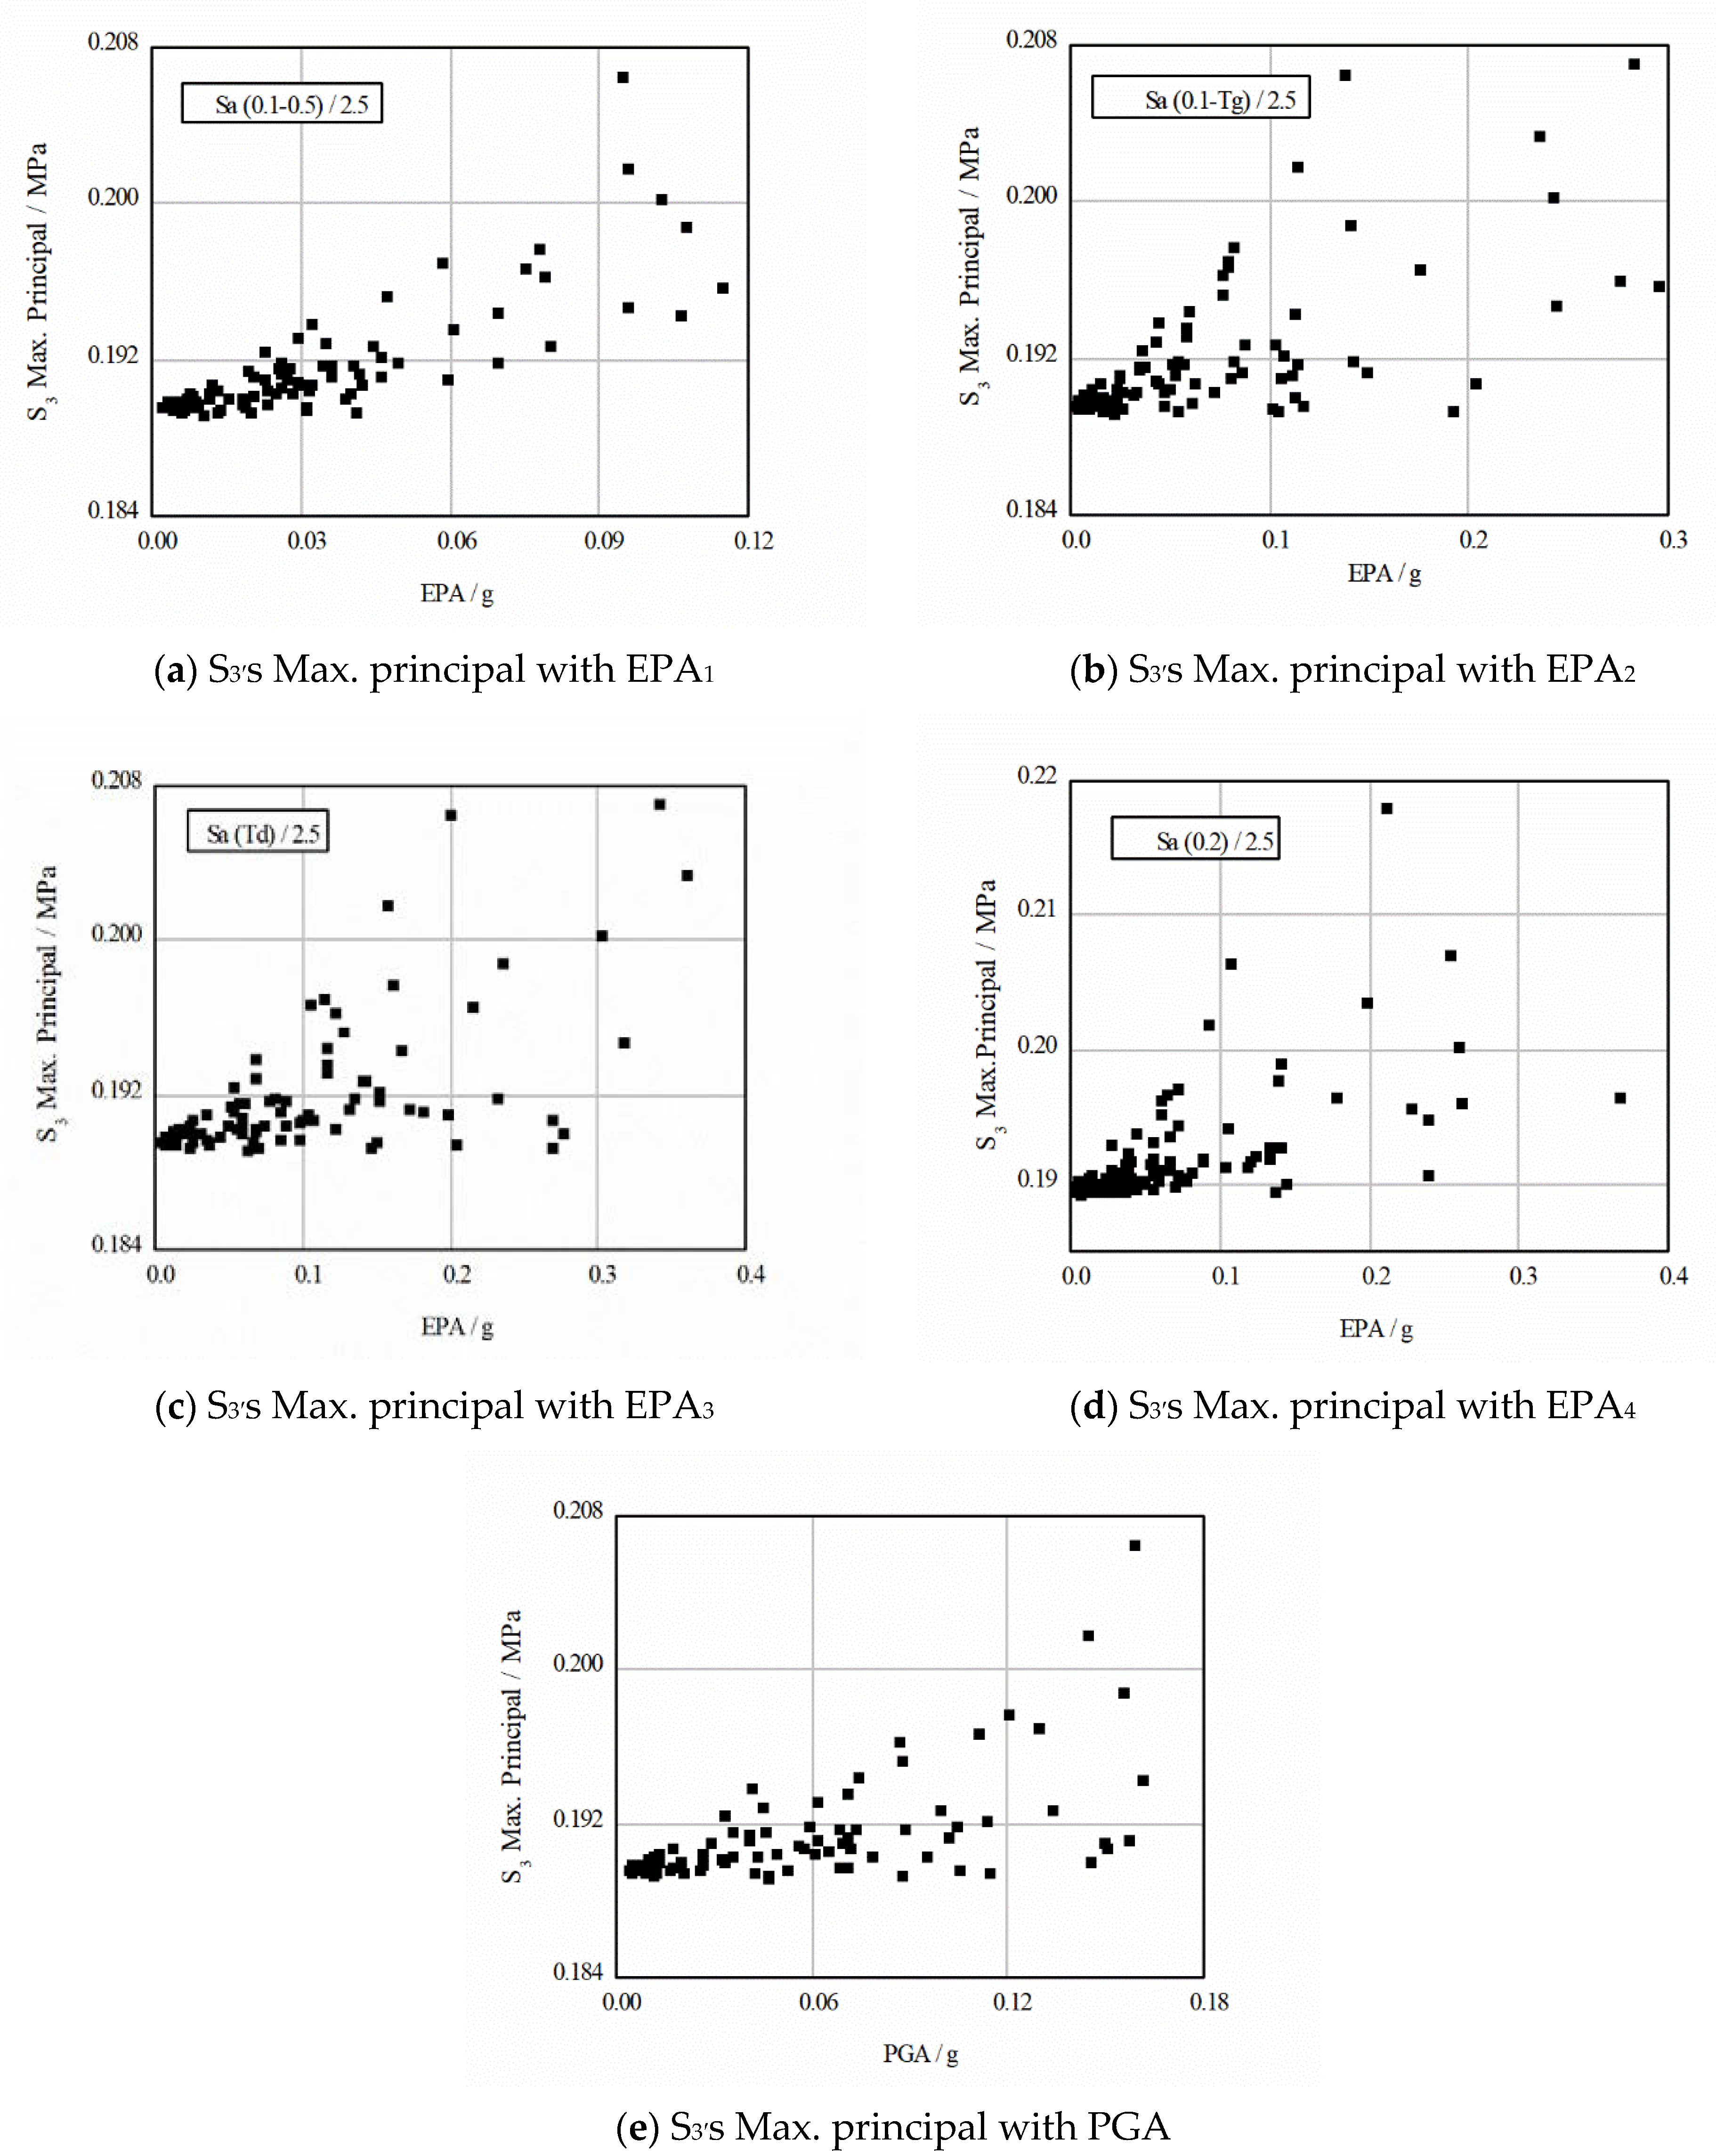
The maximum principal stress of three stress observation points S1, S2 and S3 under corresponding ground motion was extracted, and their corresponding relationships with PGA and EPA under four definitions have been made, as shown in Figure 7, Figure 8 and Figure 9, in order to study its change rule with EPA and PGA.
It can be seen from Figure 7, Figure 8 and Figure 9 that the stress response of different monitoring points has a certain degree of linear relationship with EPA and PGA, and the maximum principal stress of different monitoring points has almost the same obvious linear relationship with PGA and the same defined EPA, which increases with the increase in EPA and PGA overall, showing a positive correlation. The stress response also has a law of divergence with the increase in EPA and PGA, compared with the change law of slope displacement. From the figure, when EPA is less than 0.1 g, the linear relationship between them seems to be more obvious.
In order to further quantitatively analyze the correlation between EPA and soil slope stress, the correlation coefficient between EPA and soil slope stress was calculated, as shown in Table 3. EPA1 and PGA have the highest correlation with the displacement deformation response of soil slope surface, and their average correlation coefficients with the displacement of the five monitoring points are 0.897 and 0.857, respectively, followed by EPA2, EPA3 and EPA4 in high and low order, with the average correlation coefficients of 0.833, 0.825 and 0.727.

4. Discussion

By comparing and analyzing the correlation between soil slope displacement and stress with EPA and PGA, it is shown that EPA1 and PGA have the highest correlation with the slope’s response, which is that they can best reflect the slope response degree under earthquake.
In the definition of EPA1, Sa(0.1–0.5) is the average value of the plateau segment of acceleration response spectrum from 0.1–0.5 s. The value of the plateau segment is fixed and conforms to the law of statistical average. In the definition of EPA2, Sa(0.1 − Tg) is the average value from 0.1 s to Tg (Tg is the predominant period of the reaction spectrum), which conforms to the law of statistical average. However, the value of the plateau is not fixed, so the value of Tg is subjective and more flexible, which can be applied to different projects. Td in EPA3 is the periodic point corresponding to the maximum value of the reaction spectrum, which is representative of a particular wave, but the high-frequency wave with very short duration may not cause structural failure. The 0.2 s period in EPA4 roughly corresponds to the remarkable period of bedrock, but the study object of this paper is soil slope, and Sa(0.2) can take any value of acceleration response spectrum in theory, which is not necessarily representative when it is specific to a seismic wave.
PGA is one of the most widely used indicators in engineering, which is convenient to obtain and can describe the strength of ground motion to a great degree. However, PGA has the characteristics of randomness and dispersion, the selection of PGA may interfere with the judgment of the actual energy of ground motion due to the instantaneous pulse peak, so when PGA is used as the strength indicator to study the stability of soil slope, the spectrum characteristics of ground motion should be considered. Athough EPA is not affected by the influence of excessively large peak acceleration controlled by high-frequency components and the resonance effect at the natural vibration frequency of the structure, it can describe the strength of ground motion to a great degree.

5. Conclusions

In this paper, slope responses under 100 ground motions were simulated and calculated, and the influence laws of PGA and EPA under the four common definitions on slope displacement and stress response were analyzed and discussed. The following conclusions are obtained:
(1)
As a whole, the displacement and stress responses of slope under earthquake action increase with the increase in PGA and EPA under different definitions, showing a positive linear relationship.
(2)
In the quantitative analysis, the linear correlation coefficients of PGA and EPA under different definitions on soil slope deformation displacement and stress response are different. Among them, EPA1 and PGA have the highest correlation coefficients with soil slope deformation displacement and stress response, followed by EPA2, EPA3 and EPA4.
In summary, it is suggested that PGA and EPA1 should be given priority as strength parameter indexes in the study of seismic response of soil slope, and the other four ground motion parameters can also be integrated to comprehensively consider the analysis results. It is worth pointing out that the natural vibration characteristics of the slope model are not considered in this study, and the influence of the slope model on seismic response of soil slope will be focused on the future.

Author Contributions

J.Z. and Y.S., Methodology, Software, Investigation, Writing—Original Draft; T.L. and Y.Y., Editing, Supervision, Data Curation, Conceptualization; C.Z., Formal analysis, Visualization, Data processing. All authors have read and agreed to the published version of the manuscript.

Funding

This research was funded by the National Natural Science Foundation of China (No. 51908176), Special Fund of Fundamental Scientific Research Business Expense for Higher School of Central Government (Projects for Innovation teams, No. ZY20160110), and Hebei Technology Innovation Center for Intelligent Development and Control of Underground Built Environment.

Institutional Review Board Statement

Not applicable.

Informed Consent Statement

Not applicable.

Data Availability Statement

In this study, the data were mainly obtained from the Pacific Earthquake Research Engineering Center (PEER).

Acknowledgments

The authors would like to thank the editors and experts for their comments and suggestions which were most useful in revising the paper. The authors also would like to thank the anonymous reviewers for their insightful comments and suggestions.

Conflicts of Interest

The authors declare there is no conflict of interest regarding the publication of this paper.

References

  1. GB 50011-2010; Code for Seismic Design of Buildings. Construction Industry Press: Beijing, China, 2010.
  2. Long, C.; Lai, M.; Yu, H.; Li, D.H. Correlation between effective peak acceleration and seismic intensity. Earthq. Res. Sichuan 2011, 2, 26–31. [Google Scholar]
  3. Chang, L.; Liao, Y.; Wang, Y. EPA-based adjustment method of seismic ground motion record and its application. Build. Struct. 2020, 50, 13–17. [Google Scholar]
  4. Chen, H.; Guo, M. Selection of ground motion parameters for design of major engineering sites. In Advances in Modern Earthquake Engineering; Southeast University Press: Nanjing, China, 2020; pp. 25–39. [Google Scholar]
  5. An, D. Comparative analysis and improvement of different adjustment methods of effective peak acceleration. J. Build. Struct. 2020, 41 (Suppl. 1), 417–424. [Google Scholar]
  6. Basu, B.; Gupta, V.K. A damage-based definition of effective peak acceleration. Earthq. Eng. Struct. Dyn. 1998, 27, 503–512. [Google Scholar] [CrossRef]
  7. Cao, S.; Wang, Y.; Li, Z. Statistical analysis of seismic effective peak acceleration. Build. Struct. 2019, 49, 73–76. [Google Scholar]
  8. Zhong, J.; Hu, X.; Yi, L.; Wu, S.X. Study on relations of effective peak acceleration and peak ground acceleration. World Earthq. Eng. 2006, 22, 34–38. [Google Scholar]
  9. Yi, L.; Hu, X.; Zhong, Y. Major engineering design seismic determination based on EPA. J. Seismol. Res. 2004, 27, 271–276. [Google Scholar]
  10. Guo, M.; Zhang, J.; Tang, B. The relationship between bedrock seismic peak acceleration and effective peak acceleration was studied. In Proceedings of the 7th National Academic Conference on Earthquake Engineering (I), Guangzhou, China, 16–19 November 2006; pp. 83–88. [Google Scholar]
  11. Zhang, J.; Li, X.; Qi, J.; Wang, Y.S.; He, Q.M. Effect of influence weights of ground motion parameters on soil slope seismic response. J. Vib. Shock. 2018, 37, 225–230. [Google Scholar]
  12. Zhang, J.; Chen, S.; Wang, T.; Wu, F. Study on correlation between ground motion parameters and soil slope seismic response. Bull. Eng. Geol. Environ. 2022, 81, 226. [Google Scholar] [CrossRef]
  13. Huang, F.; Cao, Z.; Guo, J.; Jiang, S.; Guo, Z. Comparisons of heuristic, general statistical and machine learning models for landslide susceptibility prediction and mapping. CATENA 2020, 191, 104580. [Google Scholar] [CrossRef]
  14. Chang, Z.; Du, Z.; Zhang, F.; Huang, F.; Chen, J.; Li, W.; Guo, Z. Landslide Susceptibility Prediction Based on Remote Sensing Images and GIS: Comparisons of Supervised and Unsupervised Machine Learning Models. Remote Sens. 2020, 12, 502. [Google Scholar] [CrossRef] [Green Version]
  15. Huang, F.; Zhang, J.; Zhou, C.; Wang, Y.; Huang, J.; Zhu, L. A deep learning algorithm using a fully connected sparse autoencoder neural network for landslide susceptibility prediction. Landslides 2020, 17, 217–229. [Google Scholar] [CrossRef]
  16. Huang, F.; Cao, Z.; Guo, J.; Jiang, S.; Zhou, C.; Guo, Z. Landslide susceptibility prediction based on a semi-supervised multiple-layer perceptron model. Landslides 2020, 17, 2919–2930. [Google Scholar] [CrossRef]
  17. Jiang, S.; Huang, J.; Huang, F.; Yang, Y.; Yao, C.; Zhou, C. Modelling of spatial variability of soil undrained shear strength by conditional random fields for slope reliability analysis. Appl. Math. Model. 2018, 63, 374–389. [Google Scholar] [CrossRef]
  18. Yuan, R.; Xu, X.; Chen, G.; Tan, X.B.; Klinger, Y.; Xing, H.L. Ejection Landslide at Northern Terminus of Beichuan Rupture Triggered by 2008 Mw 7.9 Wenchuan Earthquake. Bull. Seismol. Soc. Am. 2010, 100, 2689–2699. [Google Scholar] [CrossRef]
  19. Xu, C.; Xu, X.W.; Yu, G.H.; Wu, X.Y. Susceptibility Analysis of Impact Factors of Landslides Triggered by Yushu Earthquake. Sci. Technol. Rev. 2012, 30, 18–24. [Google Scholar]
  20. Tian, Y.Y.; Xu, C.; Xu, X.W.; Chen, J. Analysis of Parameters of Landslides Triggered by the Minxian-Zhangxian Ms 6.6 Earthquake. China Earthq. Eng. J. 2013, 35, 616–626. [Google Scholar]
  21. Chang, Z.; Catani, F.; Huang, F.; Liu, C.; Meena, S.; Huang, J.; Zhou, C. Landslide susceptibility prediction using slope unit-based machine learning models considering the heterogeneity of conditioning factors. J. Rock Mech. Geotech. Eng. 2022; in press. [Google Scholar] [CrossRef]
  22. Du, W. Effects of directionality and vertical component of ground motions on seismic slope displacements in Newmark sliding-block analysis. Eng. Geol. 2018, 239, 13–21. [Google Scholar] [CrossRef]
  23. Huang, F.; Tao, S.; Li, D.; Lian, Z.; Catani, Z.; Huang, J.; Li, K.; Zhang, C. Landslide susceptibility prediction considering neighborhood characteristics of landslide spatial datasets and hydrological slope units using remote sensing and GIS technologies. Remote Sens. 2022, 14, 4436. [Google Scholar] [CrossRef]
  24. Huang, F.; Chen, J.; Liu, W.; Huang, J.; Hong, H.; Chen, W. Regional rainfall-induced landslide hazard warning based on landslide susceptibility mapping and a critical rainfall threshold. Geomorphology 2022, 408, 108236. [Google Scholar] [CrossRef]
  25. Hu, Y. Earthquake Engineering, 2nd ed.; Seismological Press: Beijing, China, 2006; pp. 104–109. [Google Scholar]
  26. Liu, J.; Du, X. Structural Dynamics; Mechanical Industry Press: Beijing, China, 2004; pp. 98–104. [Google Scholar]
  27. Applied Technology Council, and Structural Engineers Association of California. Tentative Provisions for the Development of Seismic Regulations for Buildings: ATC-3; Applied Technology Council: Palo Alto, CA, USA, 1978. [Google Scholar]
  28. GB 18306-2015; Seismic Ground Motion Parameters Zonation Map of China. Standards Press: Beijing, China, 2015.
  29. Frankel, A.; Mueller, C.; Barnhard, T.; Perkins, D.; Leyendecker, E.V.; Dickman, N.; Hanson, S.; Hopper, M. National Seismic Hazard Maps-Documentation; Geological Survey Open-File Report 96-532; USGS: Reston, VA, USA, 1996; pp. 96–532.
  30. Li, X.; Li, Y.; Wu, D. Correlation between ground motion intensity and structural seismic response. J. Vib. Shock. 2014, 33, 184–189. [Google Scholar]
  31. Zhang, J.; Li, X.; Wang, X.; Chi, M.; Wang, Y. Method for judging seismic stability state of soil slopes. Chin. J. Geotech. Eng. 2018, 40, 2096–2102. [Google Scholar]
  32. Lysmer, J.; Kuhlemeyer, R. Finite dynamic model for infinite media. J. Eng. Mech. Div. 1969, 95, 859–877. [Google Scholar] [CrossRef]
  33. Li, B.; Gui, Y. Study on dynamic response of homogeneous cutting slope under finite element-based earthquake action. Front. Earth Sci. 2020, 10, 45–48. [Google Scholar] [PubMed]
  34. Liu, H.; Chen, S. Research advances in dynamic constitutive models and dynamic analysis of soils. In Proceedings of the Yong Specialists in Geotechnical Engineering Academic Forum; Construction Industry Press: Beijing, China, 1998; pp. 29–42. [Google Scholar]
  35. Editorial Board of Engineering Geology Manual. Engineering Geology Manual, 4th ed.; China Construction Industry Press: Beijing, China, 2006; pp. 22–28. [Google Scholar]
  36. Li, X.; Liao, Z.; Du, X. An explicit finite difference method for viscoelastic dynamic problem. J. Earthq. Eng. Eng. Vib. 1992, 9, 74–80. [Google Scholar]
  37. Deeks, A.; Randolph, M. Axisymmetric time domain transmitting boundaries. J. Eng. Mech. 1994, 120, 25–42. [Google Scholar] [CrossRef]
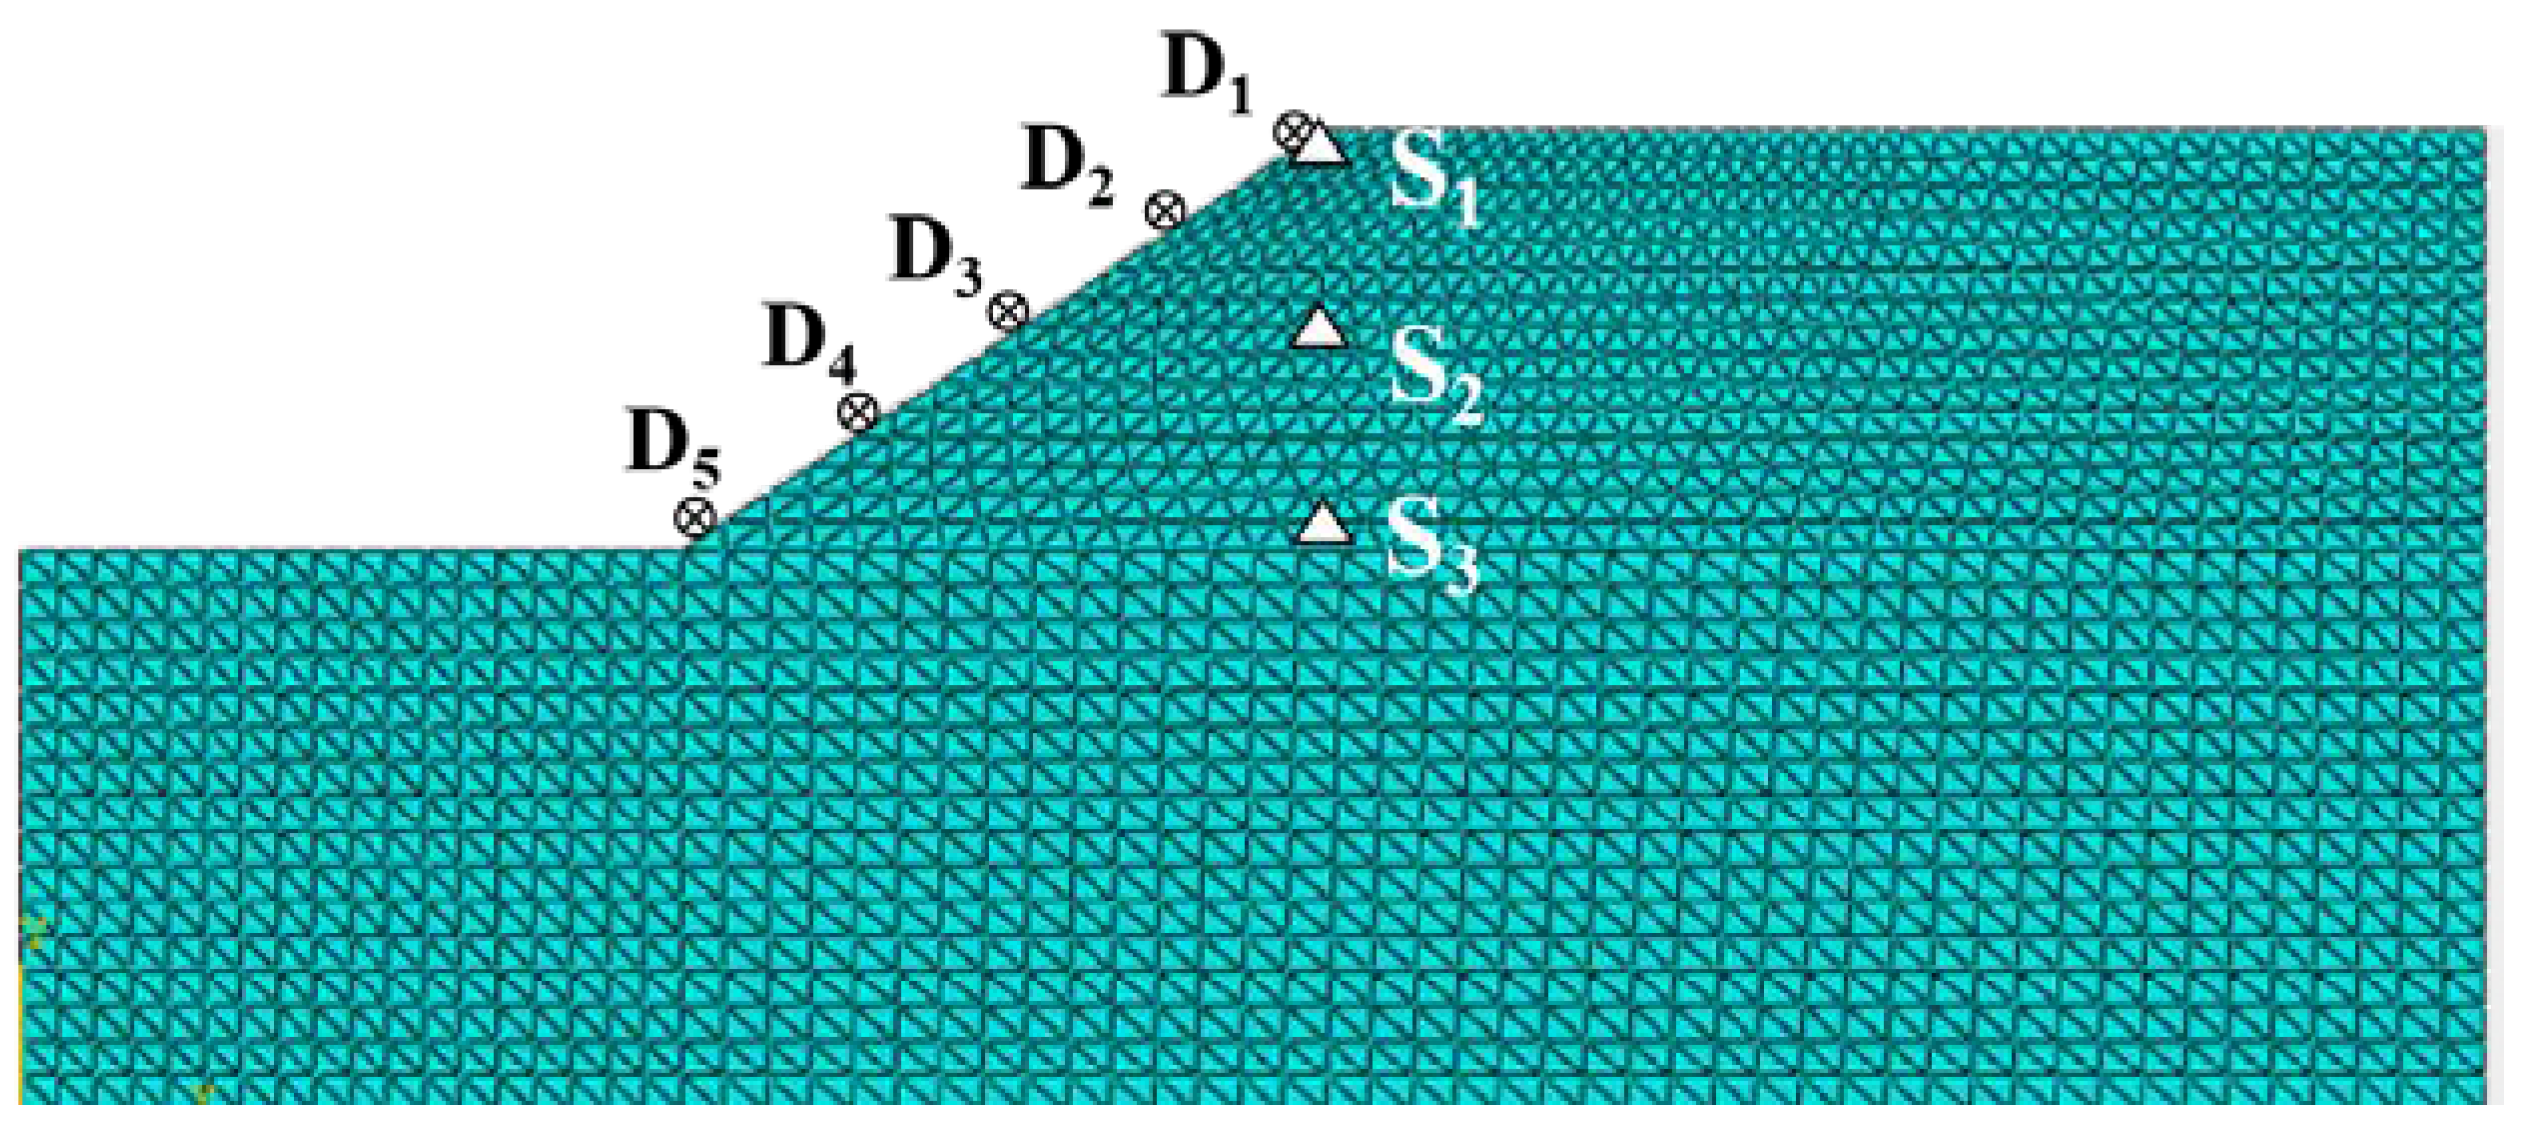
Figure 1. Finite element mesh.
Sustainability 14 16985 g001
Figure 2. Variation of D1 displacement with EPA and PGA.
Sustainability 14 16985 g002
Figure 3. Variation of D2 displacement with EPA and PGA.
Sustainability 14 16985 g003
Figure 4. Variation of D3 displacement with EPA and PGA.
Sustainability 14 16985 g004
Figure 5. Variation of D4 displacement with EPA and PGA.
Sustainability 14 16985 g005
Figure 6. Variation of D5 displacement with EPA and PGA.
Sustainability 14 16985 g006
Figure 7. Variation of S1 Max. principal with EPA and PGA.
Sustainability 14 16985 g007
Figure 8. Variation of S2 Max. principal with EPA and PGA.
Sustainability 14 16985 g008
Figure 9. Variation of S3 Max. principal with EPA and PGA.
Sustainability 14 16985 g009
Table 1. Parameters for slope soil.
ParametersDensity/
(kg·m−3)
Dynamic Modulus of Elasticity/MPaPoisson’s RatioCohesive Force/kPaInternal Friction Angle/°
Number207090.80.313.9925
Table 2. Relevant coefficients of EPA, PGA, and the slope deformation displacement response.
Slope Responses EPA1EPA2EPA3EPA4PGA
D1 displacement0.8900.8260.8230.7320.869
D2 displacement0.8890.8320.8280.7370.861
D3 displacement0.8810.8170.8130.7200.863
D4 displacement0.8800.8170.8120.7200.874
D5 displacement0.8900.8270.8220.7300.873
Mean value0.8860.8240.8200.7270.868
Table 3. Relevant coefficients of the EPA, PGA, and the seismic stress response of the side slope.
Slope ResponsesEPA1EPA2EPA3EPA4PGA
S1 Max. Principal0.8900.8280.8240.7170.858
S2 Max. Principal0.8950.8280.8190.7160.845
S3 Max. Principal0.9110.8430.8320.7470.869
Mean value0.8970.8330.8250.7270.857
Publisher’s Note: MDPI stays neutral with regard to jurisdictional claims in published maps and institutional affiliations.