Article

Study on Failure Mechanism of Soil–Rock Slope with FDM-DEM Method

1
School of Civil Engineering, Central South University, Changsha 410075, China
2
State Key Laboratory of Simulation and Regulation of Water Cycle in River Basin, China Institute of Water Resources, Beijing 100048, China
3
Huaneng Lancang River Hydropower Co., Ltd., Kunming 650214, China
4
China Power Construction Group Kunming Survey, Design and Research Institute Co., Ltd., Kunming 650051, China
5
Hunan Tieyuan Civil Engineering Testing Co., Ltd., Changsha 410075, China
*
Author to whom correspondence should be addressed.
Sustainability 2022, 14(24), 17015; https://doi.org/10.3390/su142417015
Submission received: 10 November 2022 / Revised: 12 December 2022 / Accepted: 15 December 2022 / Published: 19 December 2022
(This article belongs to the Special Issue The Development of Underground Projects in Urban Areas)

Abstract

:
A discrete-continuous coupling analysis method based on FLAC2D/PFC2D is established with the help of the program’s own FISH language and Socket O/I data transfer interface. According to the statistical characteristics of the mesostructure of the slope site, the computer stochastic simulation method is used to construct the mesostructure model of the soil–rock mixture in the discrete domain. The deformation and failure mechanism of the SRM slope is studied by using the established discrete-continuous coupled analysis method. The results show that the statistical distribution of the mesoscopic contact characteristics (such as contact direction and contact force) between soil and rock particles inside the slope changes and adjusts significantly. Among them, the main direction of the statistical distribution is adjusted most significantly, and the main direction is finally adjusted to being basically the same as the sliding direction of the slope. The change in the mesoscopic contact characteristics between soil and rock particles is the internal driving factor for the macroscopic deformation of the slope and the adjustment of the stress state.

1. Introduction

It is evident that soil materials are significantly different from rock materials in physical and mechanical properties. The soil–rock mixture (SRM) is mainly composed of soft soil material and rock material with higher stiffness and is widely distributed in Southwest China [1,2]. In particular, a lot of SRM slopes exist in the hydropower station reservoir area, dam site, and other key parts of the significant projects [3]. It is a great potential threat to the construction and operation of hydropower stations in this area. Hence, investigation of the failure mechanism of the SRM slope and proposing reinforcing measures for the landslide areas are of great importance.
In evaluating the stability of slopes, limit equilibrium methods have been widely used. The limit equilibrium methods (LEMs) mainly include Sarma [4], Spencer [5], Bishop [6], Swedish slip circle [7], and other methods to decompose the complete slope. The LEM has many limitations in terms of the calculation model, determination of sliding surface, slope type, etc. In particular, the study on the determination of critical sliding surfaces for three-dimensional slopes is rare. At the same time, it cannot reflect the internal stress–strain constitutive relationship of the geomaterials and cannot judge the failure mode of the slope from the calculation results. To overcome the defects of the LEM, numerical simulation methods have been proposed. The most representative is the finite element method (FEM), which was used to determine the Fos (factor of safety) of a slope with the strength reduction technique [8,9]. Apart from the FEM, other numerical methods including the DEM (discrete element method) [10], FDM (finite difference method) [11], XFEM (extended finite element method) [12], and DDA (discontinuous deformation analysis) [13] have also been employed to identify the stability and failure mechanism of slopes. Although the above-mentioned numerical methods have made great achievements in dealing with continuum media such as intact rock or pure soil, they cannot reflect the complex soil–rock interaction in the deformation and failure process of SRM slopes as the correction length of an SRM may be small and an immense number of elements may be required.
Laboratory and in situ tests have shown that the SRM has complex mechanical properties such as strength anisotropy, strain localization, state-dependence, non-coaxiality, and liquefaction [14,15]. Present studies about landslides that consist of SRMs can be described as follows. The first is to determine the strength and deformation parameters of the SRM through large-scale laboratory tests or in situ tests. Then, LEM or FEM is employed to investigate the Fos with appropriate constitutive models [16,17,18]. These methods are direct and effective. However, the constitutive models, such as the widely used Mohr–Coulomb model and Cam-clay model, cannot reflect the failure mechanism of the soil–rock interaction of SRMs. Moreover, the stone content and distribution influence the mechanical behavior of the SRM significantly. To determine such an effect on the mechanical properties of the SRM, a great number of in situ and laboratory tests should be performed, which will require a considerable amount of manpower and financial resources. On the other hand, the DEM has been widely used to investigate the mechanical properties of the SRM [19,20]. However, when simulating actual engineering problems, tens of thousands of particles are often needed, resulting in unacceptable computational efficiency.
To take advantage of each simulation scheme as well as reduce the computational resources, Nakashima and Oida [21] developed a combined FE–DE analysis code to analyze an agricultural tire-soil interaction problem. After that, this method was introduced to solve geotechnical engineering problems. For example, Cai et al. [22] used the FLAC/PFC coupled numerical method to study excavation-induced AE activities in the underground cavern. Saiang [23] investigated the blast-induced damage zone (BIDZ) around a tunnel boundary with coupled continuum–discontinuum method FLAC and PFC2D. Jia et al. [24] studied the macro-and micro-mechanisms of dynamic compaction of granular soils with the PFC/FLAC coupled method.
To consider the microscopic structure of SRM slope in the discrete domain, the computer stochastic simulation method is used to construct the microscopic structure model of SRM in this study The PFC/FLAC coupled method is used to investigate the failure mechanism of the SRM slope. The particle size and number are greatly reduced with the coupled method, which enables quantitatively describing the evolution of meso-contact characteristics between soil and rock particles in the process of slope failure.

2. FDM-DEM Coupled Simulation Method

2.1. FDM-DEM Coupled Theory

The FLAC/PFC coupling is achieved by embedding the PFC particle model into the FLAC finite difference grid and achieving mutual contact positions in different domains through segments and controlled particles (Figure 1). The continuous-domain coupling boundary is composed of a series of edges of the internal boundary grid. Each edge corresponds to a segment in the discrete domain, and the endpoints of the segment correspond to the nodes of the grid edges. The coupling boundary of the discrete domain is composed of boundary particles in the discrete domain. These particles are called boundary control particles (red particles in Figure 1), and other particles are located inside the boundary control particles. In the coupling process, FLAC can map the boundary element node velocity to the PFC boundary control particle through the segment, and PFC can map the reaction force of the control particle to the FLAC boundary element node through the boundary control particle. In the calculation process, the mapping relationship is repeated alternately.
Therefore, the core of FLAC/PFC coupling is to process the interaction between the coupling boundaries of different domains and realize the mutual mapping between different domain data. It mainly includes mapping the control particle reaction force to the node of the segment and mapping the end velocity of the segment to the control particle.

2.1.1. Theory of Mapping Control Particle Force to Segment Node

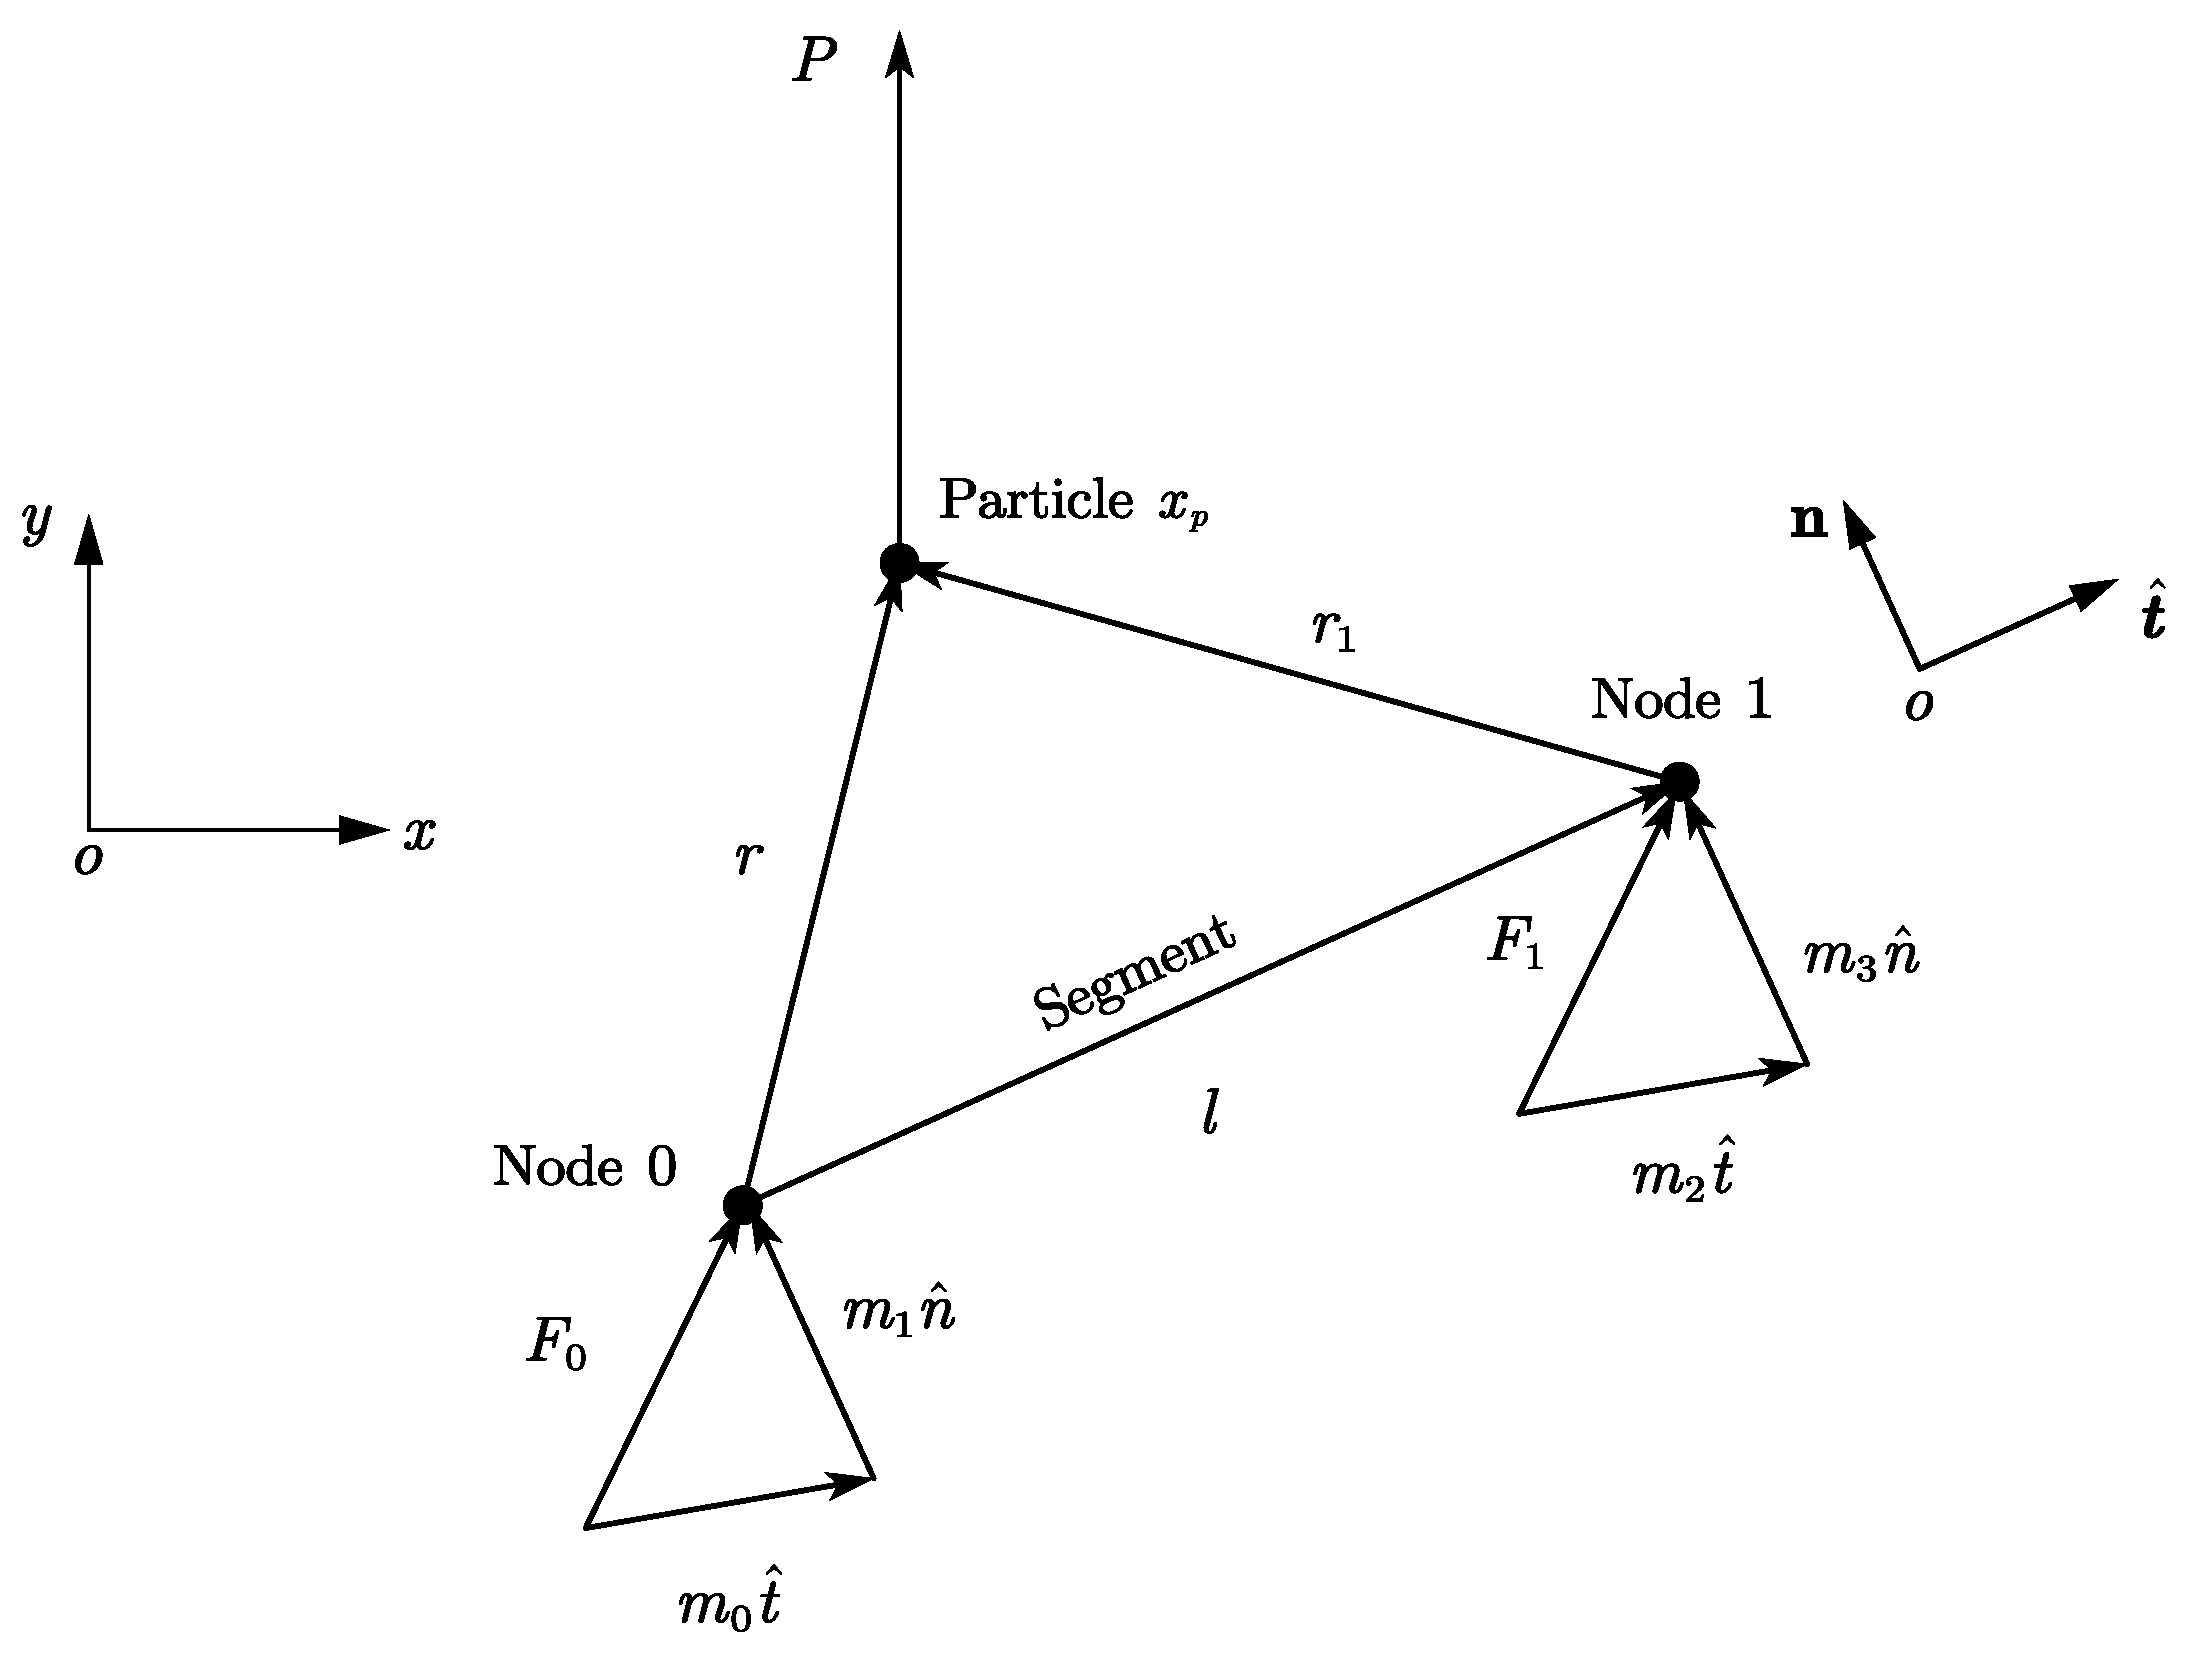
Figure 2 illustrates the theory of mapping the control particle force to a segment node. x 0 and x 1 are the positions of the two nodes of a boundary segment, and l is the length of the segment. x n is the center position of the control particle and P is the reaction force applied to the controlled particle. Therefore, the forces ( F 0 and F 1 ) mapping to the nodes of the boundary segment can be divided into a shear part and normal part:
F 0 = m 0 t ^ + m 1 n ^ F 1 = m 2 t ^ + m 3 n ^
where n ^ and t ^ are the normal and shear direction vectors, respectively. m 0 , m 1 , m 2 , and m 3 are four parameters that satisfy the rule as follows.
(1) If the shear part of the particle reaction force mapped to each node of the boundary segment is determined according to the distance from the center of the particle to the two nodes, m 0 can be expressed as:
m 0 = ( | r 1 | | r | + | r 1 | ) ( P t ^ )
where r and r 1 are the distance between the control particle to the two nodes of the segment.
(2) The particle reaction force and the nodal force mapped to the node should produce the same moment. Taking x 0 as the center of moment, the following formula is satisfied:
r × P = l t ^ × F 1 = l t ^ × ( m 2 t ^ + m 3 n ^ )
r × P = l m 2 ( t ^ × t ^ ) + l m 3 ( t ^ × n ^ )
( r x P y r y P x ) k ^ = l m 3 k ^
where k ^ = t ^ × n ^ ; r x , r y , P x , and P y are the distance from the particle to the segment and the component of the particle reaction force in the x-direction and y-direction, respectively.
According to Equations (1)–(5), we can obtain:
m 3 = ( r x P y r y P x ) l
(3) According to the principle of force decomposition, the sum of the nodal forces mapped to the segment nodes should be equal to the particle reaction force, namely:
P = F 0 + F 1
Expanding Equation (7) in the xoy coordinate system, one obtains the following:
P x = ( m 0 + m 2 ) t x ( m 1 + m 3 ) t y P y = ( m 0 + m 2 ) t y ( m 1 + m 3 ) t x
where the united shear-direction vector is n ^ = ( t y , t x ) .
According to Equation (8), m 1 and m 2 can be written as
m 1 = ( P y m 3 t x m 0 t y ) t x + ( P x m 3 t y m 0 t x ) t y
m 2 = { P x + ( m 1 + m 3 ) t y m 0 t x t x , | t y | < 0.1 P y + ( m 1 + m 3 ) t x m 0 t y t y , otherwise
When the above mapping principle is applied to each control particle, it can ensure that the force acting on the boundary of the finite-difference grid is equal to the reaction force acting on the boundary particles, to realize the mutual equivalence of the forces between the discrete domain and the continuous domain.

2.1.2. Theory of Mapping Segment Velocity to Control Particles

The method of mapping the segment velocity to the control particles is that the velocity of the control particles is obtained through interpolation. In the mapping, it is assumed that the velocity field changes linearly on the segment, and at the same time, the center of the control particle is projected onto the segment, and then the velocity of the control particles is interpolated according to the projection point. The spatial position of the segment can be determined by the end positions x 0 and x 1 . If v 0 and v 1 are the velocities of the two endpoints of the segment, the speed of the control particles can be determined according to the following equation:
v ( ξ ) = v 0 + ξ ( v 1 v 0 )
where ζ is the local coordinate of the projection point of the control particle center on the segment, which can be calculated from:
ξ = r · t ^ l , r = x p x 0 , t ^ = x 1 x 0 l

2.2. Realization of PFC/FLAC Coupled Method

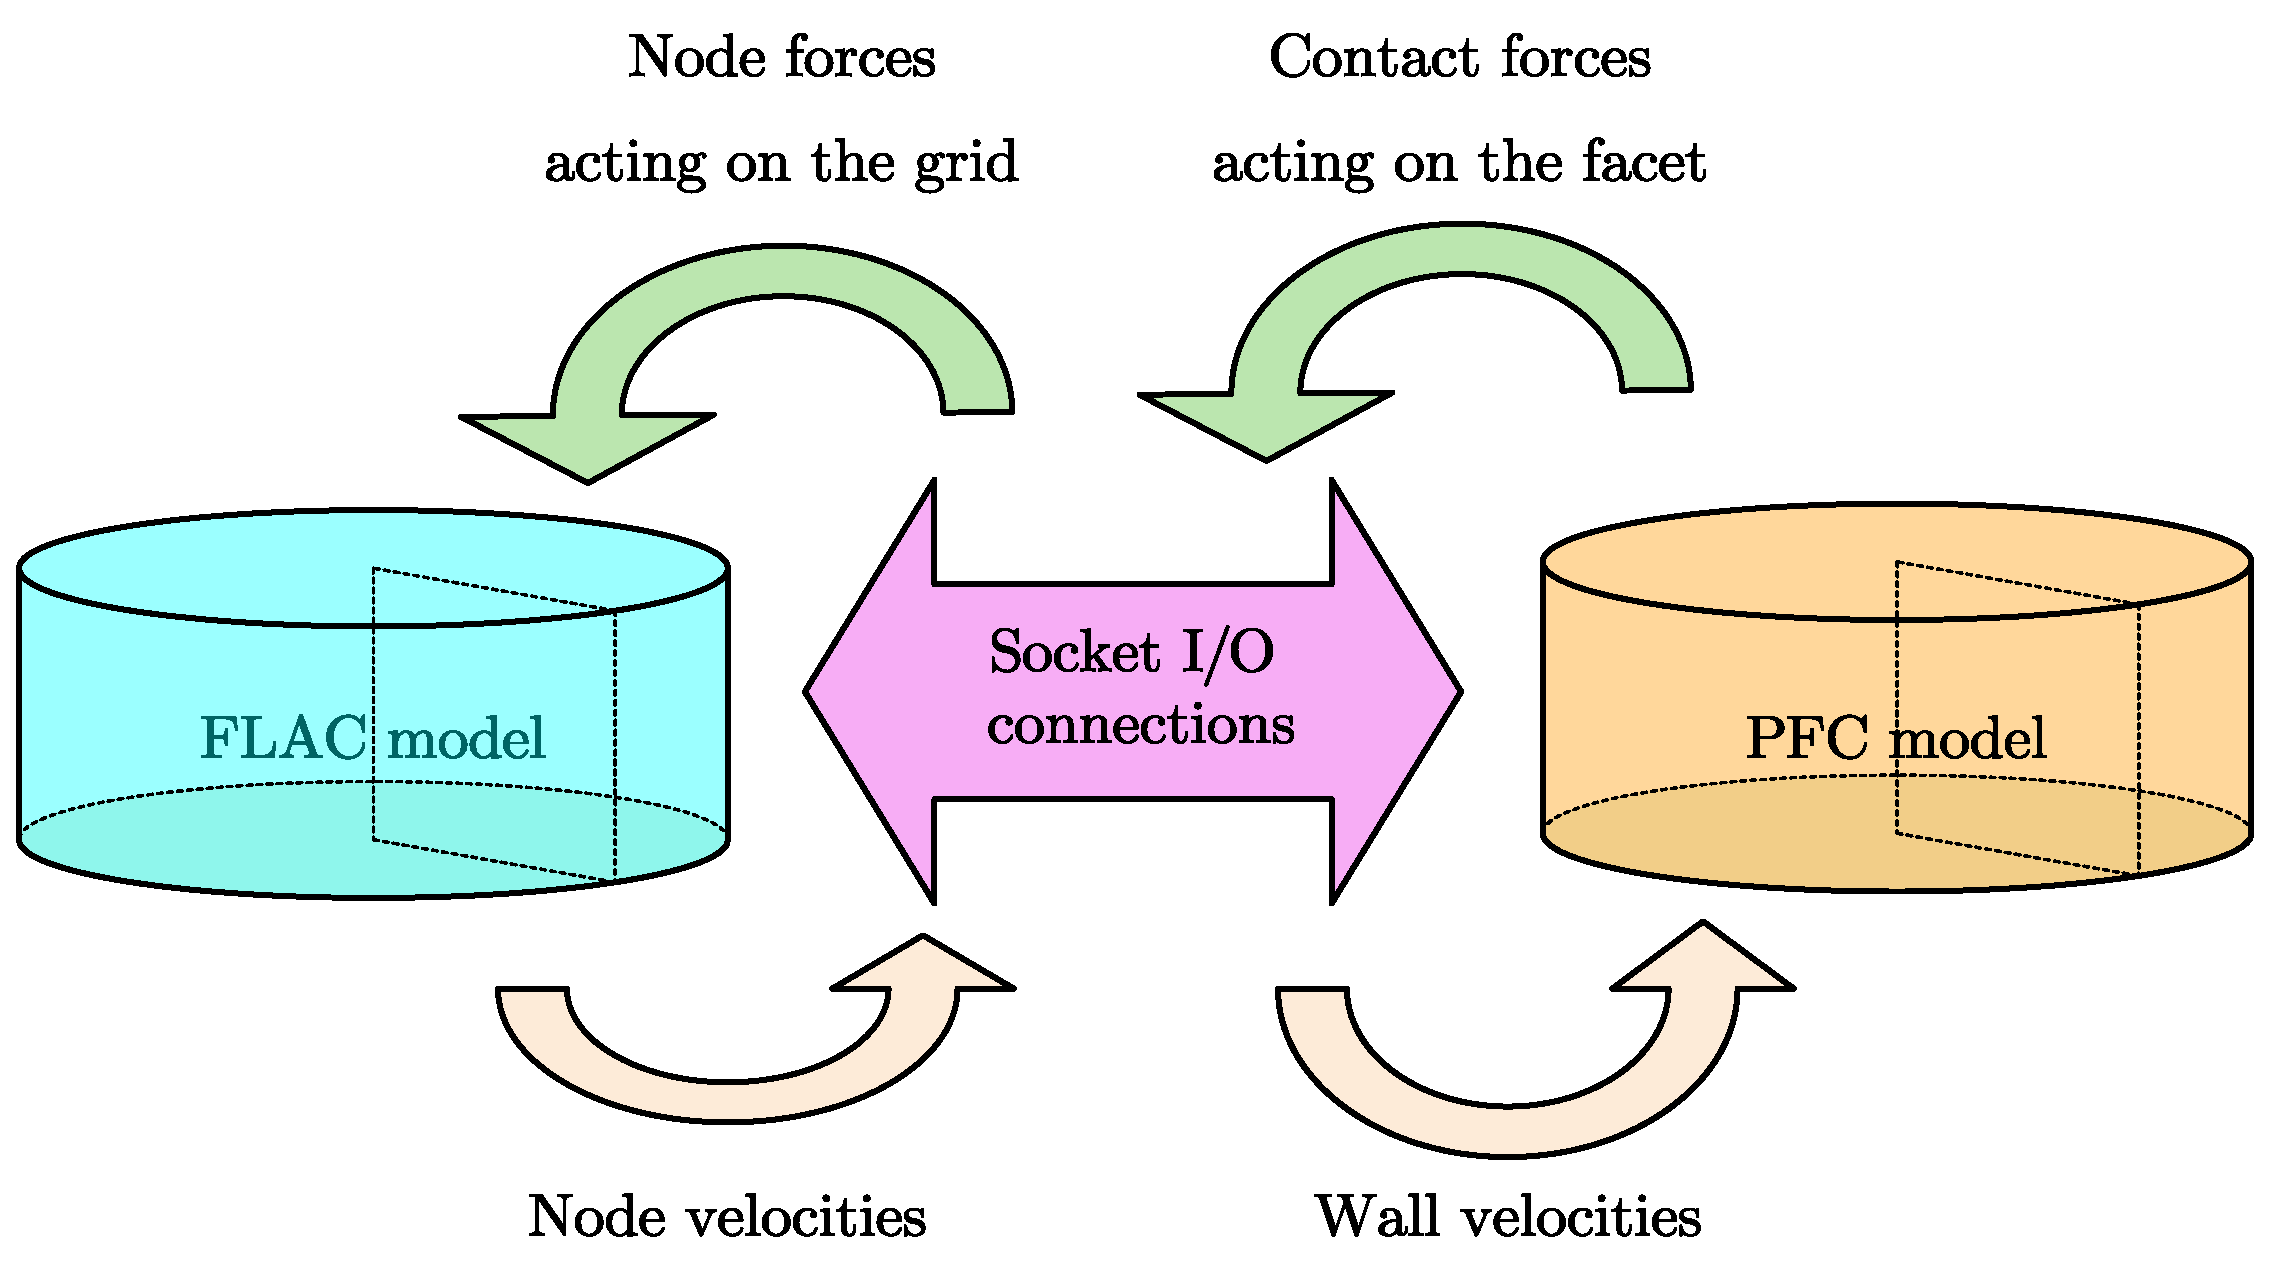
In the FLAC/PFC coupled method, FLAC is used to simulate the mechanical behavior of the medium in the continuous domain from the macro-scale, and PFC is used to simulate the mechanical behavior of the medium in the discrete domain from the microscopic view. The coupling between the two methods occurs at the contact boundary between the continuous domain and the discrete domain, and the data between different domains are transmitted and exchanged with each other by the Socket O/I interface. The continuous domain transmits boundary node speed information to the discrete element, and the discrete domain transmits force information to the continuous domain. Figure 3 shows the transfer and exchange of data between FLAC and PFC. Socket O/I is similar to the TCP/IP network transmission protocol, which can ensure that the two programs are carried out on the same computer or different computers under the same network. In addition, the data transmission and exchange between the two are carried out in binary mode, so the accuracy of the data will not be lost during the transmission and exchange process.
In each step, FLAC first calculates the cycle for one step. After the calculation is completed, the boundary element node velocity is sent to the endpoint of the corresponding segment in the PFC, and the boundary-controlled particle velocity is obtained through the theory of velocity mapping. Then, the PFC cycle calculates one step, updates the position of the particles in the discrete domain, sends the force on the boundary control particle to FLAC, and obtains the force applied on the boundary element node through the force mapping principle. Then FLAC calculates one step again, updates the grid node position and velocity, sends the boundary element node velocity to the end of the corresponding segment in the PFC again, and obtains the boundary control particle velocity through a similar principle. Then, the PFC recirculates and calculates one step, updates the position of the particles in the discrete domain, and sends the force on the boundary control particles to FLAC again. By analogy, the coupling is calculated step by step until the calculation meets the requirements.
The coupling analysis based on FLAC/PFC usually includes the following steps:
(1) According to the scope of the study area, establish a continuous-domain finite-difference mesh model, assign the model material parameters and boundary conditions, and calculate the initial stress state of the continuous-domain model.
(2) Determine the discrete domain range in the continuous domain, establish a discrete element model according to the selected area range, assign the model material meso-parameters, and adjust the model stress state to the stress state in the continuous domain.
(3) Set the continuous-domain mesh model corresponding to the discrete domain as the Null model and set the node number of the continuous-domain boundary mesh model. Determine the node number of the coupling boundary segment according to the segment node arrangement rules and establish the continuous-domain coupling boundary segment.
(4) Set the same calculation time step (set dt = dscale) and perform the initial coupling calculation to ensure that the stress is continuous at the coupling boundary between the continuous domain and the discrete domain, and that the initial coupling state is obtained.
(5) Based on the initial coupling state, follow-up coupling analysis, such as excavation and loading, is carried out according to the actual situation of the project.

3. Generation of Irregular Stone Blocks

Stones are the basic building blocks of the mesostructure of an SRM. Therefore, the structure of the stone is the core of the random mesoscopic model of the SRM. According to some statistical characteristics of the stones on site [25], this study uses random methods to generate irregular stone blocks.

3.1. Development of Irregular Stone Blocks

(1) Stone shape
The rocks in the SRM onsite are of various shapes, are uneven, and show great randomness. Therefore, randomly constructed irregular convex–concave polygons are used to replace the real rocks on site. As shown in Figure 4, for a polygon composed of N sides, the position of each vertex can be represented by the two parameters θ i and r i in polar coordinates. To construct a polygonal stone of any shape, θ i and r i can be defined as two mutually opposed random variables, both of which obey a uniform random distribution. The random variable r i can be expressed as [26]:
r i = r 0 + ( 2 ξ 1 1 ) Δ r
where ξ 1 is a pseudo-random number that is between [0, 1]. r 0 is the average value of r i . Δ r is the variation in r i .
The random variable Δ θ i is defined as the difference between the pole angle of the two adjacent vertices ( Δ θ i = θ i + 1 - θ i ). It can be determined as:
Δ θ i = 2 π N + ( 2 ξ 2 1 ) δ 2 π N
where ξ 1 is a pseudo-random number that is between [0, 1]. The variable δ is equal to 0.3. The summary Δ θ i is generally not equal to 2 π . To ensure that the developed stones are closed polygons, a correction of Δ θ i should be made as follows:
Δ θ ¯ i = Δ θ i 2 π / i = 1 N Δ θ i
Finally, the pole angle θ i of the vertex of a polygon block can be determined by the following equation:
θ i = j = 1 i Δ θ ¯ j
The positions of the vertices of the above randomly generated stones are indicated in polar coordinates. It can be written in Cartesian coordinates as follows:
{ x i = x 0 + r i cos ( θ i ) y i = y 0 + r i sin ( θ i )
where ( x 0 , y 0 ) is the central coordinate position of the stone.
The profile of the stones is similar to the oval and, therefore, needs to be extended on the initial generated stone foundation to obtain the stones with some flattening.
The outline of the onsite stone is similar to an ellipse, so it is necessary to expand and contract based on the initially generated stone to obtain a stone with a certain degree of flatness. In the two-dimensional case, the flatness of a stone can be defined as the ratio of the long axis to the short axis. As shown in Figure 5, the initially generated rock can be stretched along its long axis or compressed along its short axis to obtain rocks with different flatness.
(2) Stone size and distribution
Although the stones inside the SRM at different parts of the site are of different shapes and sizes, a large number of statistical analyses of the stones on the site found that the size of the stones conforms to a lognormal distribution, and its probability density function can be expressed as follows [27]:
f ( λ ; μ , σ ) = 1 λ 2 π σ 2 exp [ ( ln λ μ ) 2 σ 2 ] , 0 < λ <
where λ is the size of the stone; μ and σ are the mean and variance values of the natural log of stone size, respectively.
The size of the initial stones generated by the above method is arbitrary. To ensure that the size distribution of the generated stones can meet the specific lognormal distribution requirements, while keeping the shape of the stone unchanged, the initial stone size is changed to a predetermined value. After that, the new coordinates ( x i , y i ) of the vertices of the stone can be determined by the following equation:
{ x i = η x i y i = η y i
where η = λ / λ , λ is the initial size of the stone, and λ is the determined size.
(3) Spatial distribution of the stones
The spatial distribution of the stones can be described by the center position of the stones and the spatial orientation of the stones. As the distribution of stones in the SRM is very random, when establishing the mesostructure model, it can be assumed that the center position of the stones obeys a uniform random distribution in the discrete domain. The center position ( x 0 , y 0 ) of each stone can be determined by the following equation:
{ x 0 = x min + η x ( x max x min ) y 0 = y min + η y ( y max y min )
where x m i n , x m a x , y m i n , and y m a x are minimum and maximum coordinate values of the discrete domain in the x- and y-axis directions, respectively. η x and η y are independent random variables that range between 0 and 1.
The spatial orientation of rock indicates the placement of the rock in its center, which can be described by a spatial azimuth α . As shown in Figure 5, the spatial orientation of a stone can be defined as the angle between the long axis of the rock and the positive horizontal axis. Due to the randomness of the spatial distribution of stones, when establishing the random mesostructure of the SRM, this paper assumes that the spatial azimuth α of the stones obeys a uniform random distribution, and its value is uniformly random in [ 0 , 2 π ] .
(4) Content of the stones in SRM
In the two-dimensional case, the stone content C can be defined as the ratio of the total area occupied by all stones generated in the discrete domain to the total area occupied by the discrete domain, namely:
C = i = 1 n A i / A
where A i is the area of the ith block in the discrete domain and A is the total area.
(5) Judgment of stone intrusion
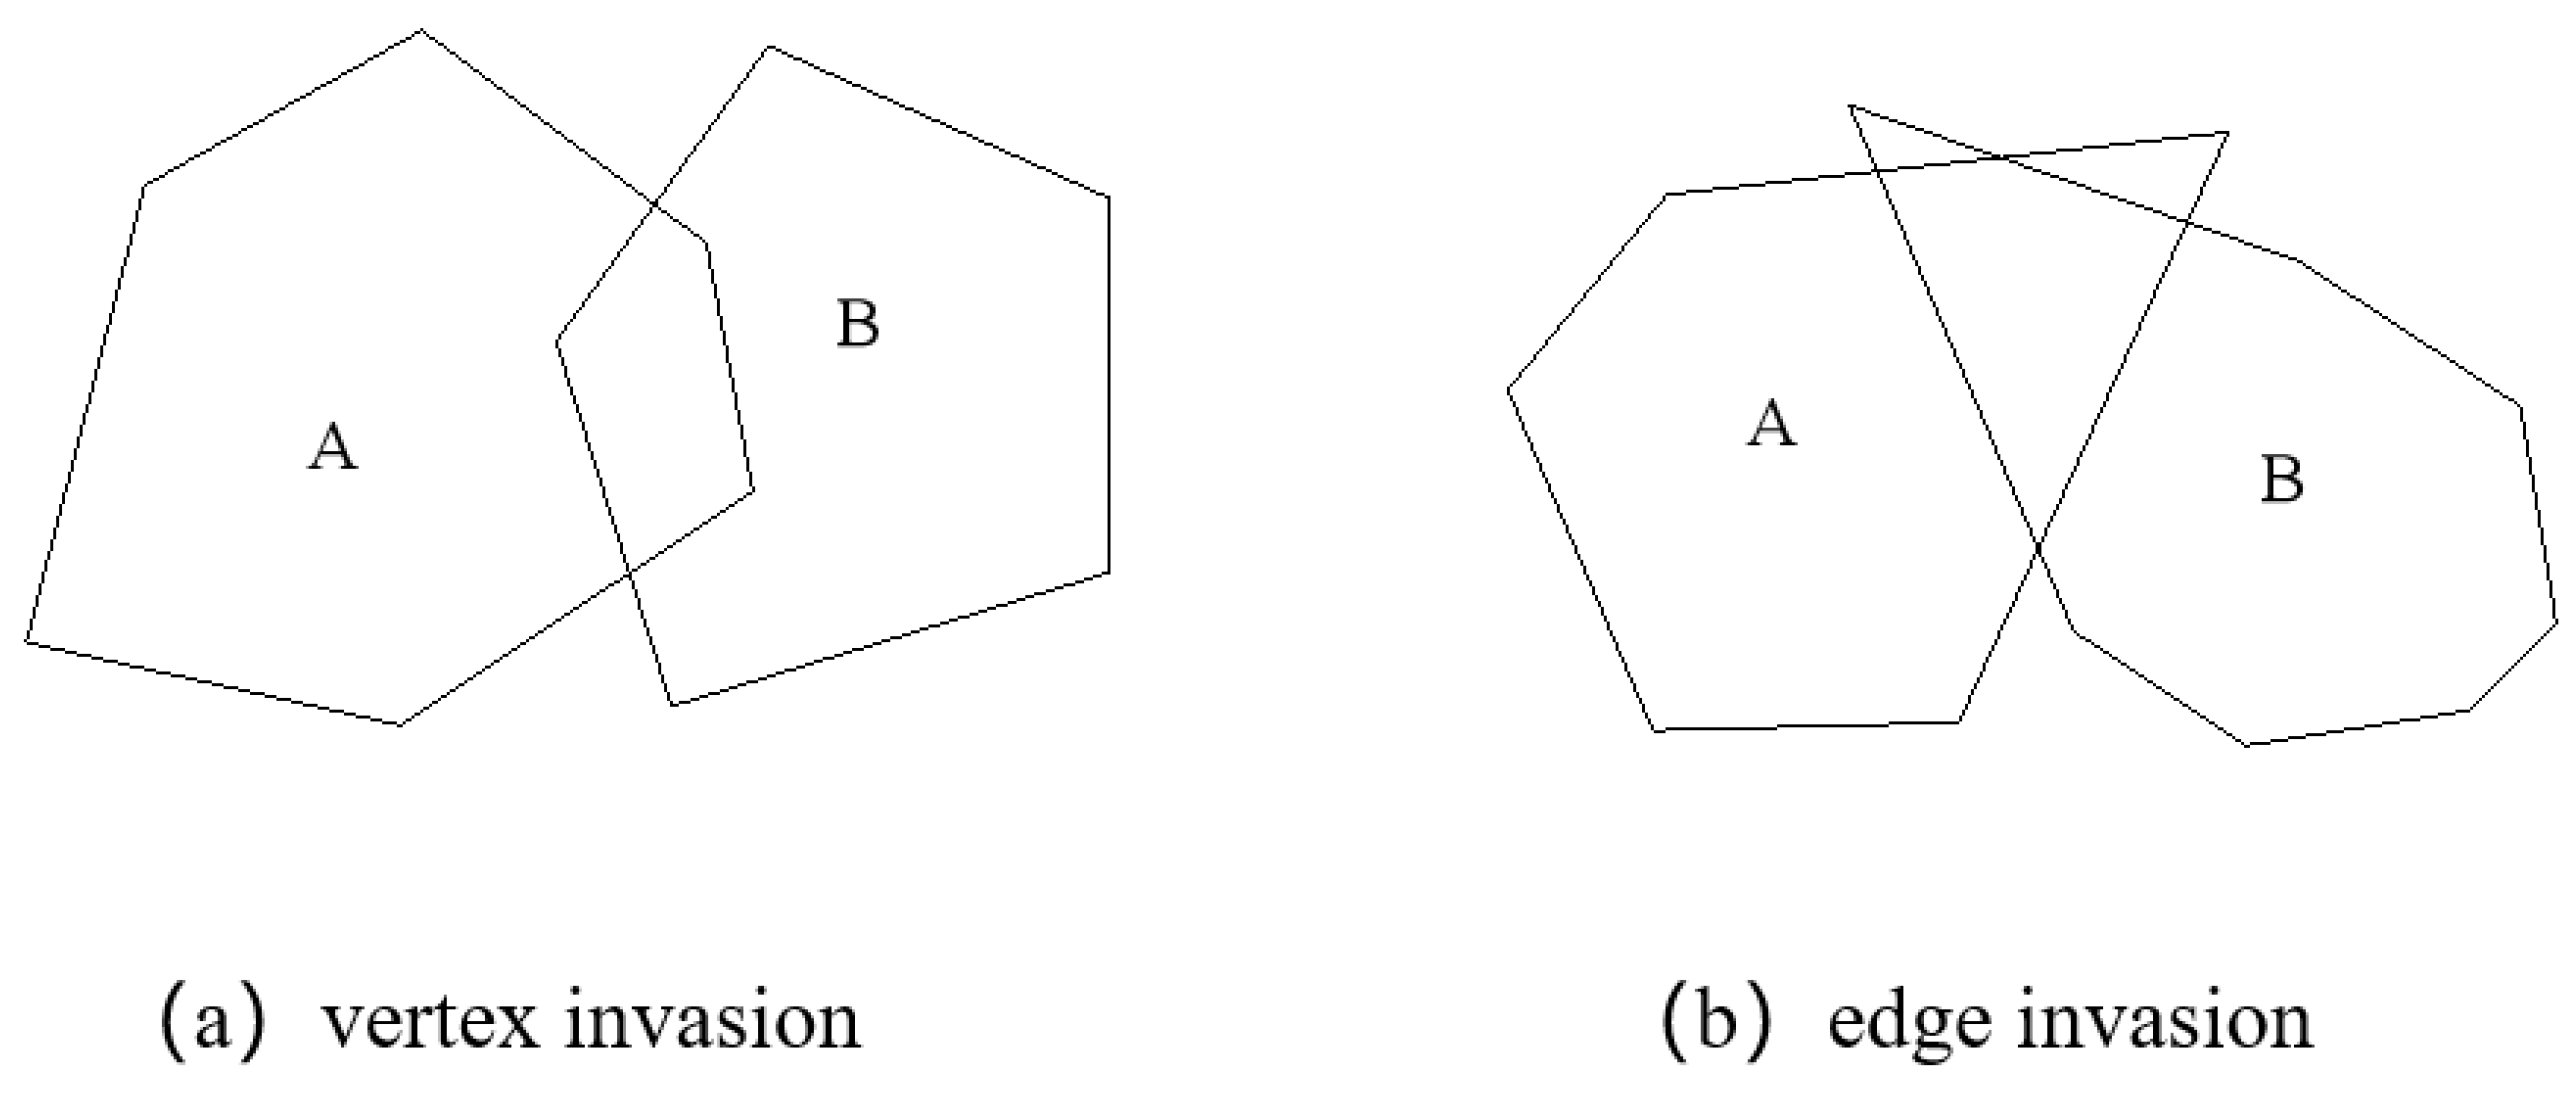
The initial position of the center of the generated stone is at the origin of the coordinate system. After generating each random stone, it is necessary to put the stones one by one into the discrete domain to generate a random mesostructure. At this time, it is necessary to judge the intrusion of the stones to ensure that the stones placed in the discrete domain are completely located in the discrete domain, and that the stones do not overlap with each other. The specific judging method is to judge whether all the vertices of the stone are located inside the boundary of the discrete domain. If there is a vertex located outside the boundary of the discrete domain, the stone will invade the boundary; otherwise, the stone is completely located inside the discrete domain.
As shown in Figure 6, there are two situations of stone invasion: vertex invasion and edge invasion. For the vertex invasion situation, the number of intersections between the vertex of one stone and the edge of another stone can be judged. If the number of intersections is an odd number, the two stones will have a vertex intrusion; if the number of intersections is an even number, the stone does not have a vertex intrusion, and the next step of edge intrusion judgment is required.
For the vertex invasion situation shown in Figure 6, the number of intersections between the vertex of one stone and the edge of another stone can be judged. If the number of intersections is an odd number, the two stones will have a vertex intrusion; otherwise, the stones do not have a vertex intrusion, proceeding to the next step of edge intrusion judgment. If there are two stones with individual edges intersecting each other, then the two stones have an edge invasion; otherwise, there is no edge invasion.

3.2. Construction Process of Random Mesostructure

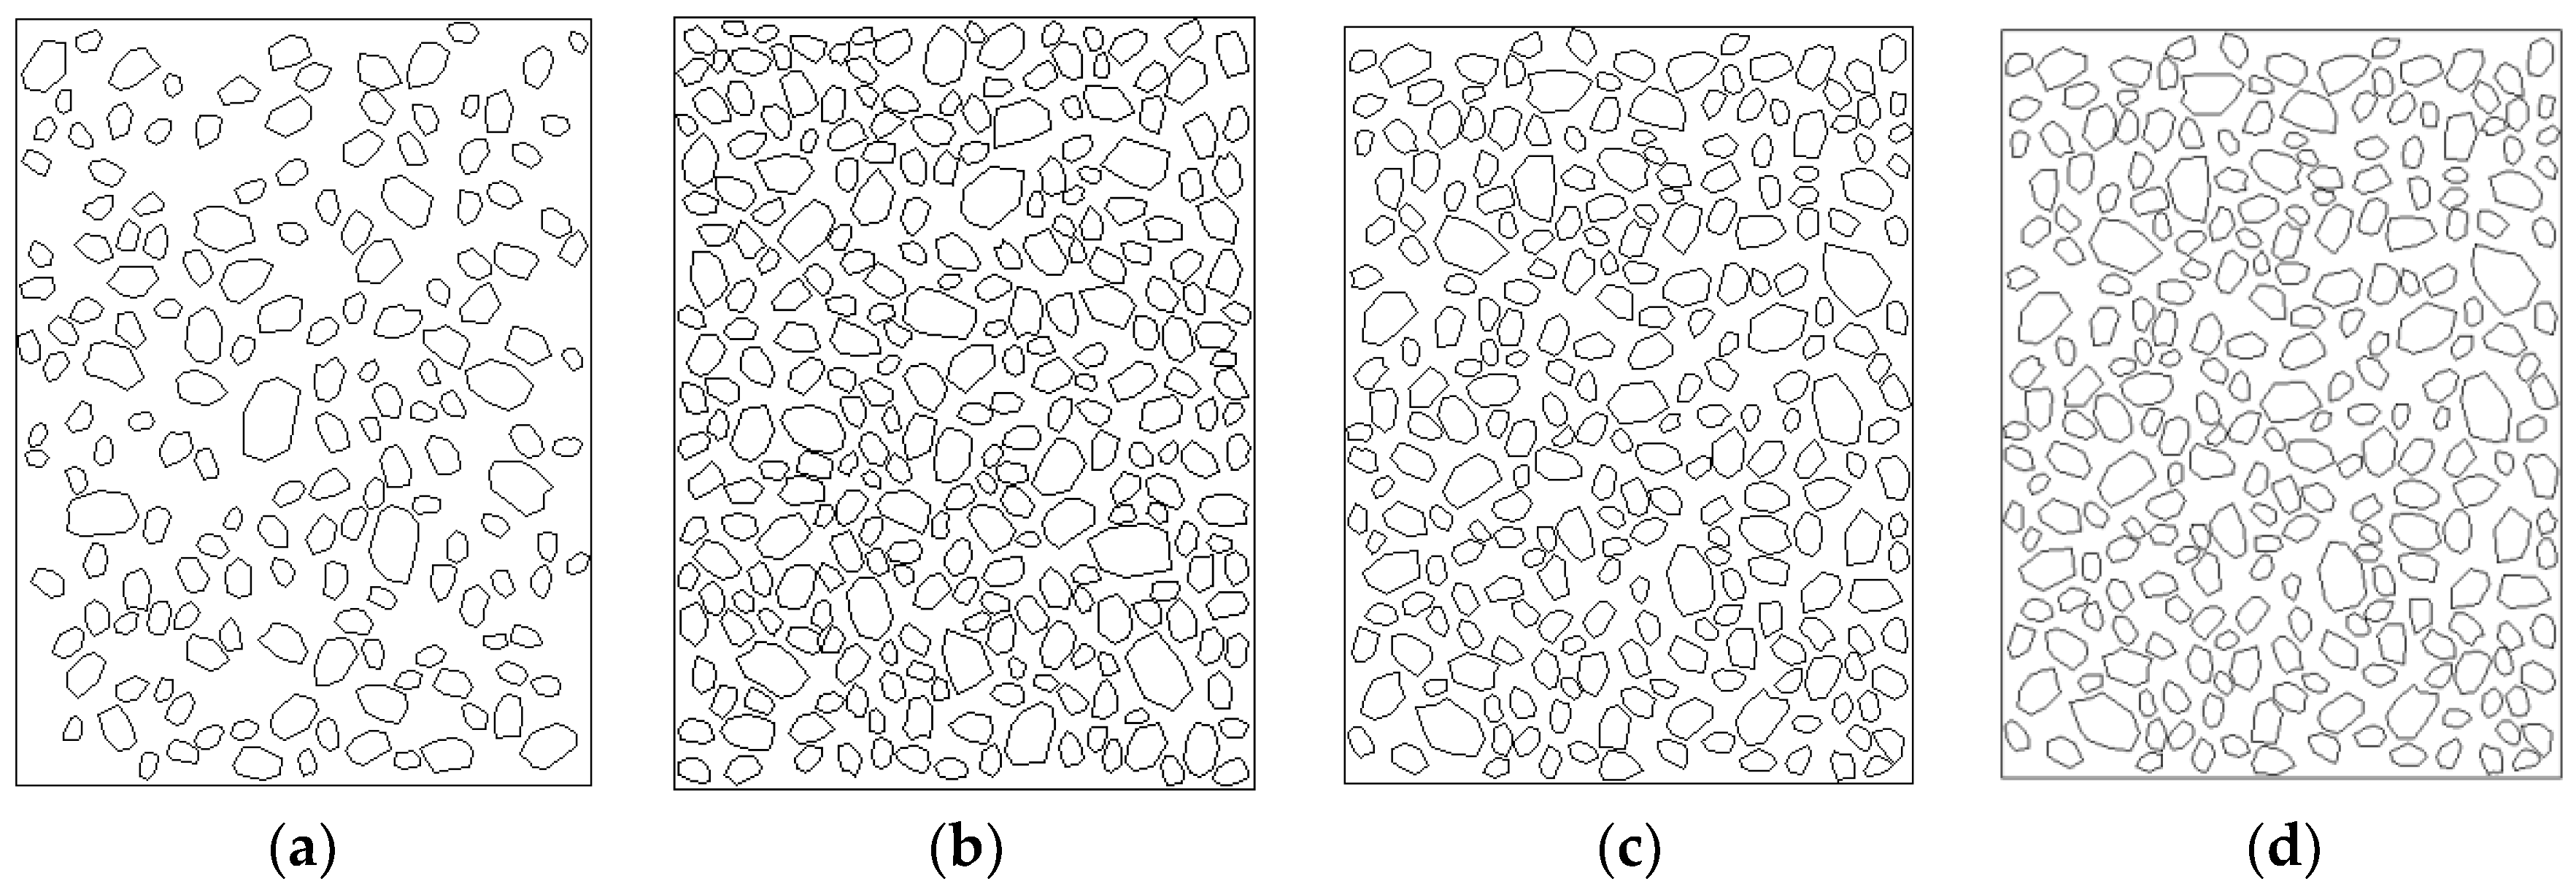
A two-dimensional mesostructure random construction system (RMS2D) is developed with the help of the Fortran programming language. With this system, the random mesostructure of the SRM can be constructed in the selected discrete domain. Using the self-developed RMS2D, the random mesostructure of the SRM with different characteristics can be constructed in the selected discrete domain. Figure 7 establishes random mesostructure models of SRMs with different rock content and spatial distribution.

4. Numerical Simulation

4.1. Calibration of Micro- and Macro-Parameters

To calibrate the parameters for numerical simulation, direct shear tests are conducted on SRM samples in our laboratory and the results have been published in the literature [3]. In the continuum domain, the Mohr–Coulomb is chosen to describe the macroscopic constitutive relationship of the SRM. The macroscopic parameters are determined directly from the laboratory and the results are shown in Table 1.
Unlike the macroscopic parameters such as Young’s modulus, Poisson’s ratio, internal friction angle, and cohesion, mesoscopic parameters of the DEM model cannot be determined directly from laboratory tests [28]. In this paper, the mesoscopic parameters of “soil” particles and “stone” particles are obtained by calibrating the curves of the direct shear tests and the method proposed by [29] respectively. The meso-mechanical parameters of the soil–rock meso-model are shown in Table 2.

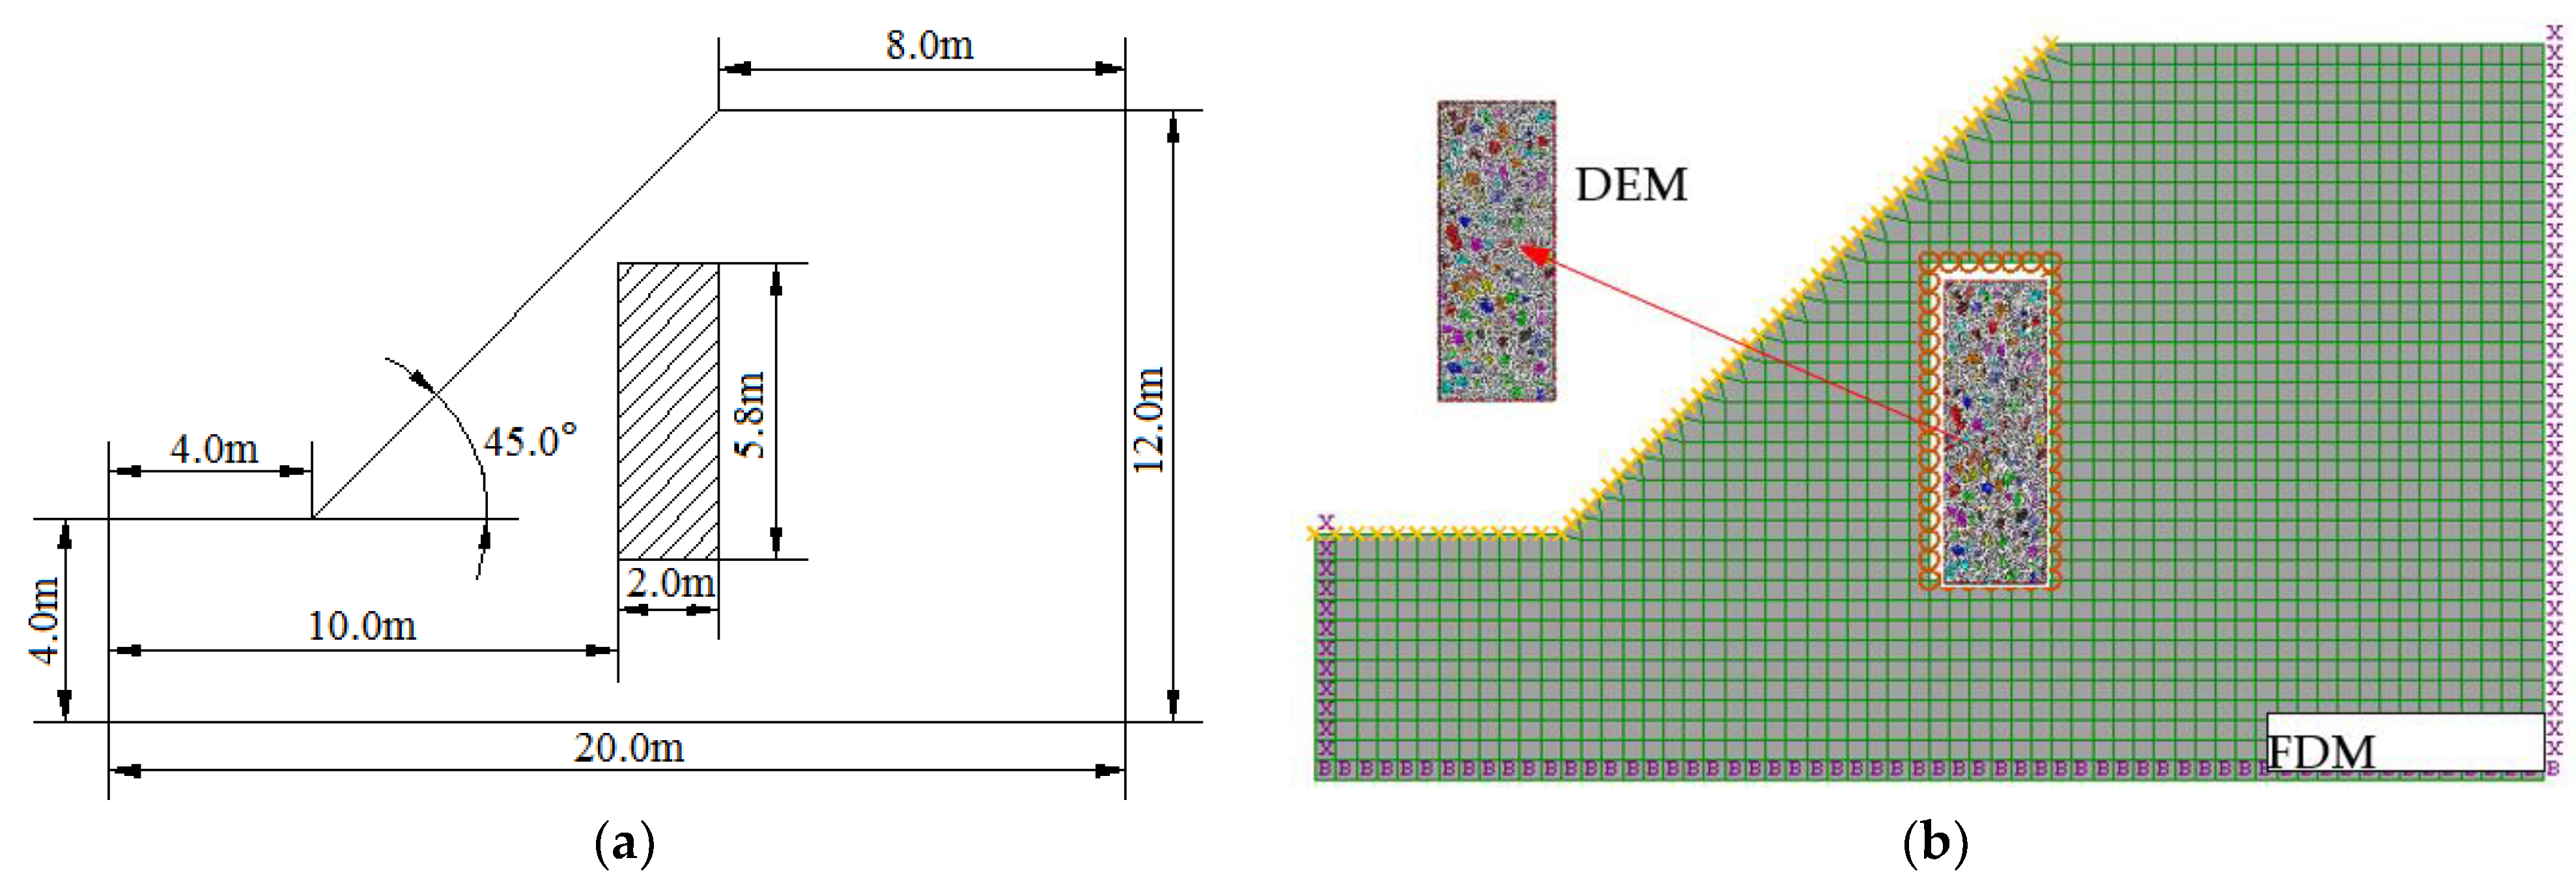
4.2. Establishment of FDM-DEM SRM Slop Model

To validate the FDM-DEM coupling method, a homogeneous slope shown in Figure 8a is considered. The model has a length of 20.0 m, a height of 12.0 m, and a slope angle of 45.0°. To analyze the evolution law of the meso-contact characteristics of the internal soil–rock particles during the deformation and failure process of the SRM slope, a numerical simulation is conducted with the FDM method to determine the shear band location and area first. Then, a square area with a length of 2.0 m and a height of 5.8 m is selected as a discrete area in the coupled analysis. We ensure that the shear band is across the discrete area. Other areas are analyzed as continuous domains. Figure 8b shows the established continuous-domain numerical model. The continuous domain in the model is divided into 24 triangular mesh elements and 1596 quadrilateral mesh elements. The discrete domain coupling boundary is composed of a circle of closed boundary control particles (red particles in the figure), the continuous-domain coupling boundary is composed of the edges and nodes of the boundary element, and each edge corresponds to a segment in the discrete domain.
It should be noted that the process of establishing a discrete domain numerical model is shown in Figure 9. The process mainly includes three steps: (1) Use the proposed boundary inward filling method to generate a circular particle model in the discrete domain. (2) Use the developed RSM2D system to construct a random mesostructure of the SRM in the discrete domain. (3) Superimpose the previous two models to determine the round particles contained in each rock in the mesostructure. The round particles included in each stone block are formed into a round particle cluster to simulate a stone block.

5. Results and Discussion

5.1. Validation of the Model

Figure 10 shows the stress distribution of the slope after the initial static calculation and initial coupling calculation. After the initial coupling calculation, the stress between the discrete domain and the continuous domain maintains continuity. The stress distribution on the continuum has not been adjusted greatly, which is the same as the initial static calculation. After the initial coupling state is obtained, self-weight overload is performed on the discrete domain and the continuous domain, and the coupling analysis is performed. To ensure that the slope is unstable under self-weight overload, the self-weight overload factor should be greater than the safety factor of the slope.
It can be seen from the displacement contours that the displacement maintains good continuity and consistency on the boundary of the discrete domain and the continuous domain, and there is no sudden change in displacement, indicating that the coupling analysis effect is good (Figure 11). In addition, the upper particles in the discrete domain have been displaced, and the lower particles remain unchanged at zero displacements, which indicates that the shear band formed inside the slope has passed through the middle part of the discrete domain after failure.
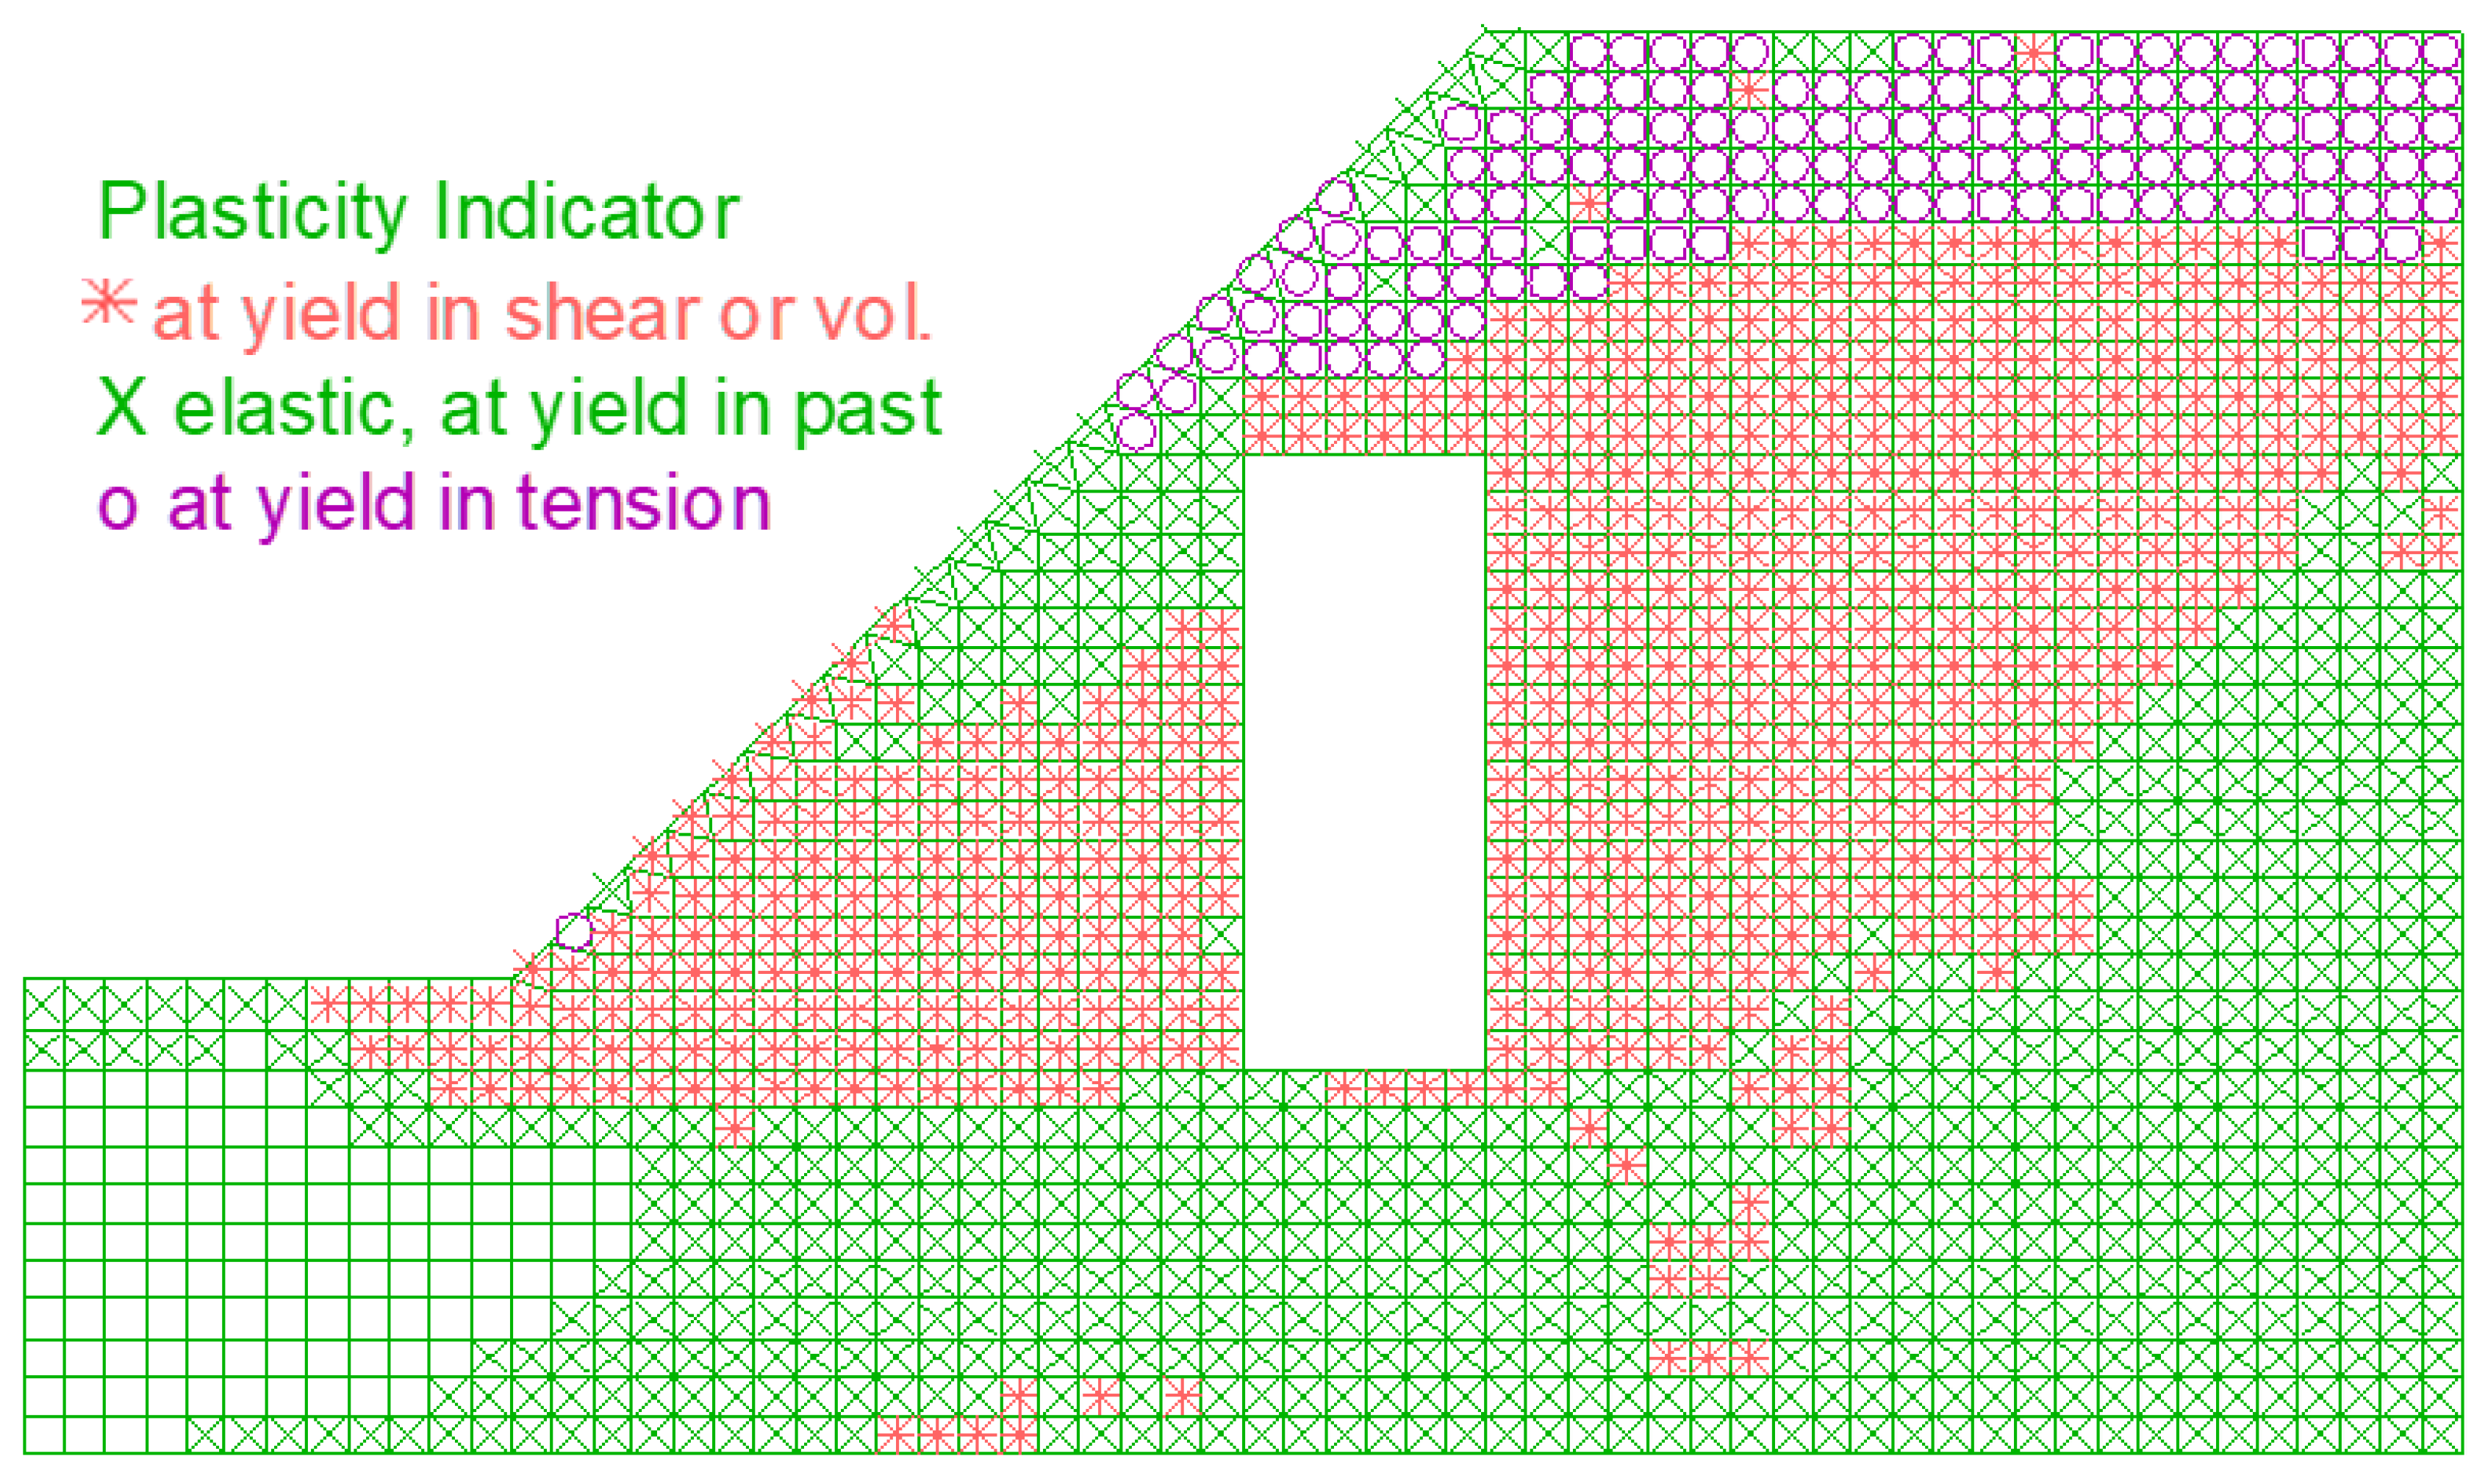
The plastic zone of the continuous domains after failure is shown in Figure 12. It is obvious that the slope failure is mainly a shear mode, and there is a certain tensile crack failure in the top area. The entire shear failure zone passes through the discrete domain, and the failure type is approximately a circular arc failure mode.

5.2. Failure Process of Slope

To understand the evolution law of the meso-contact characteristics between the soil and stone particles in the SRM during the formation and evolution of the shear band, four key intermediate calculation states are selected for analysis, and the results are shown in Figure 13. The shear band begins to develop from the position of the slope angle and gradually develops until it completely penetrates to the top of the slope.
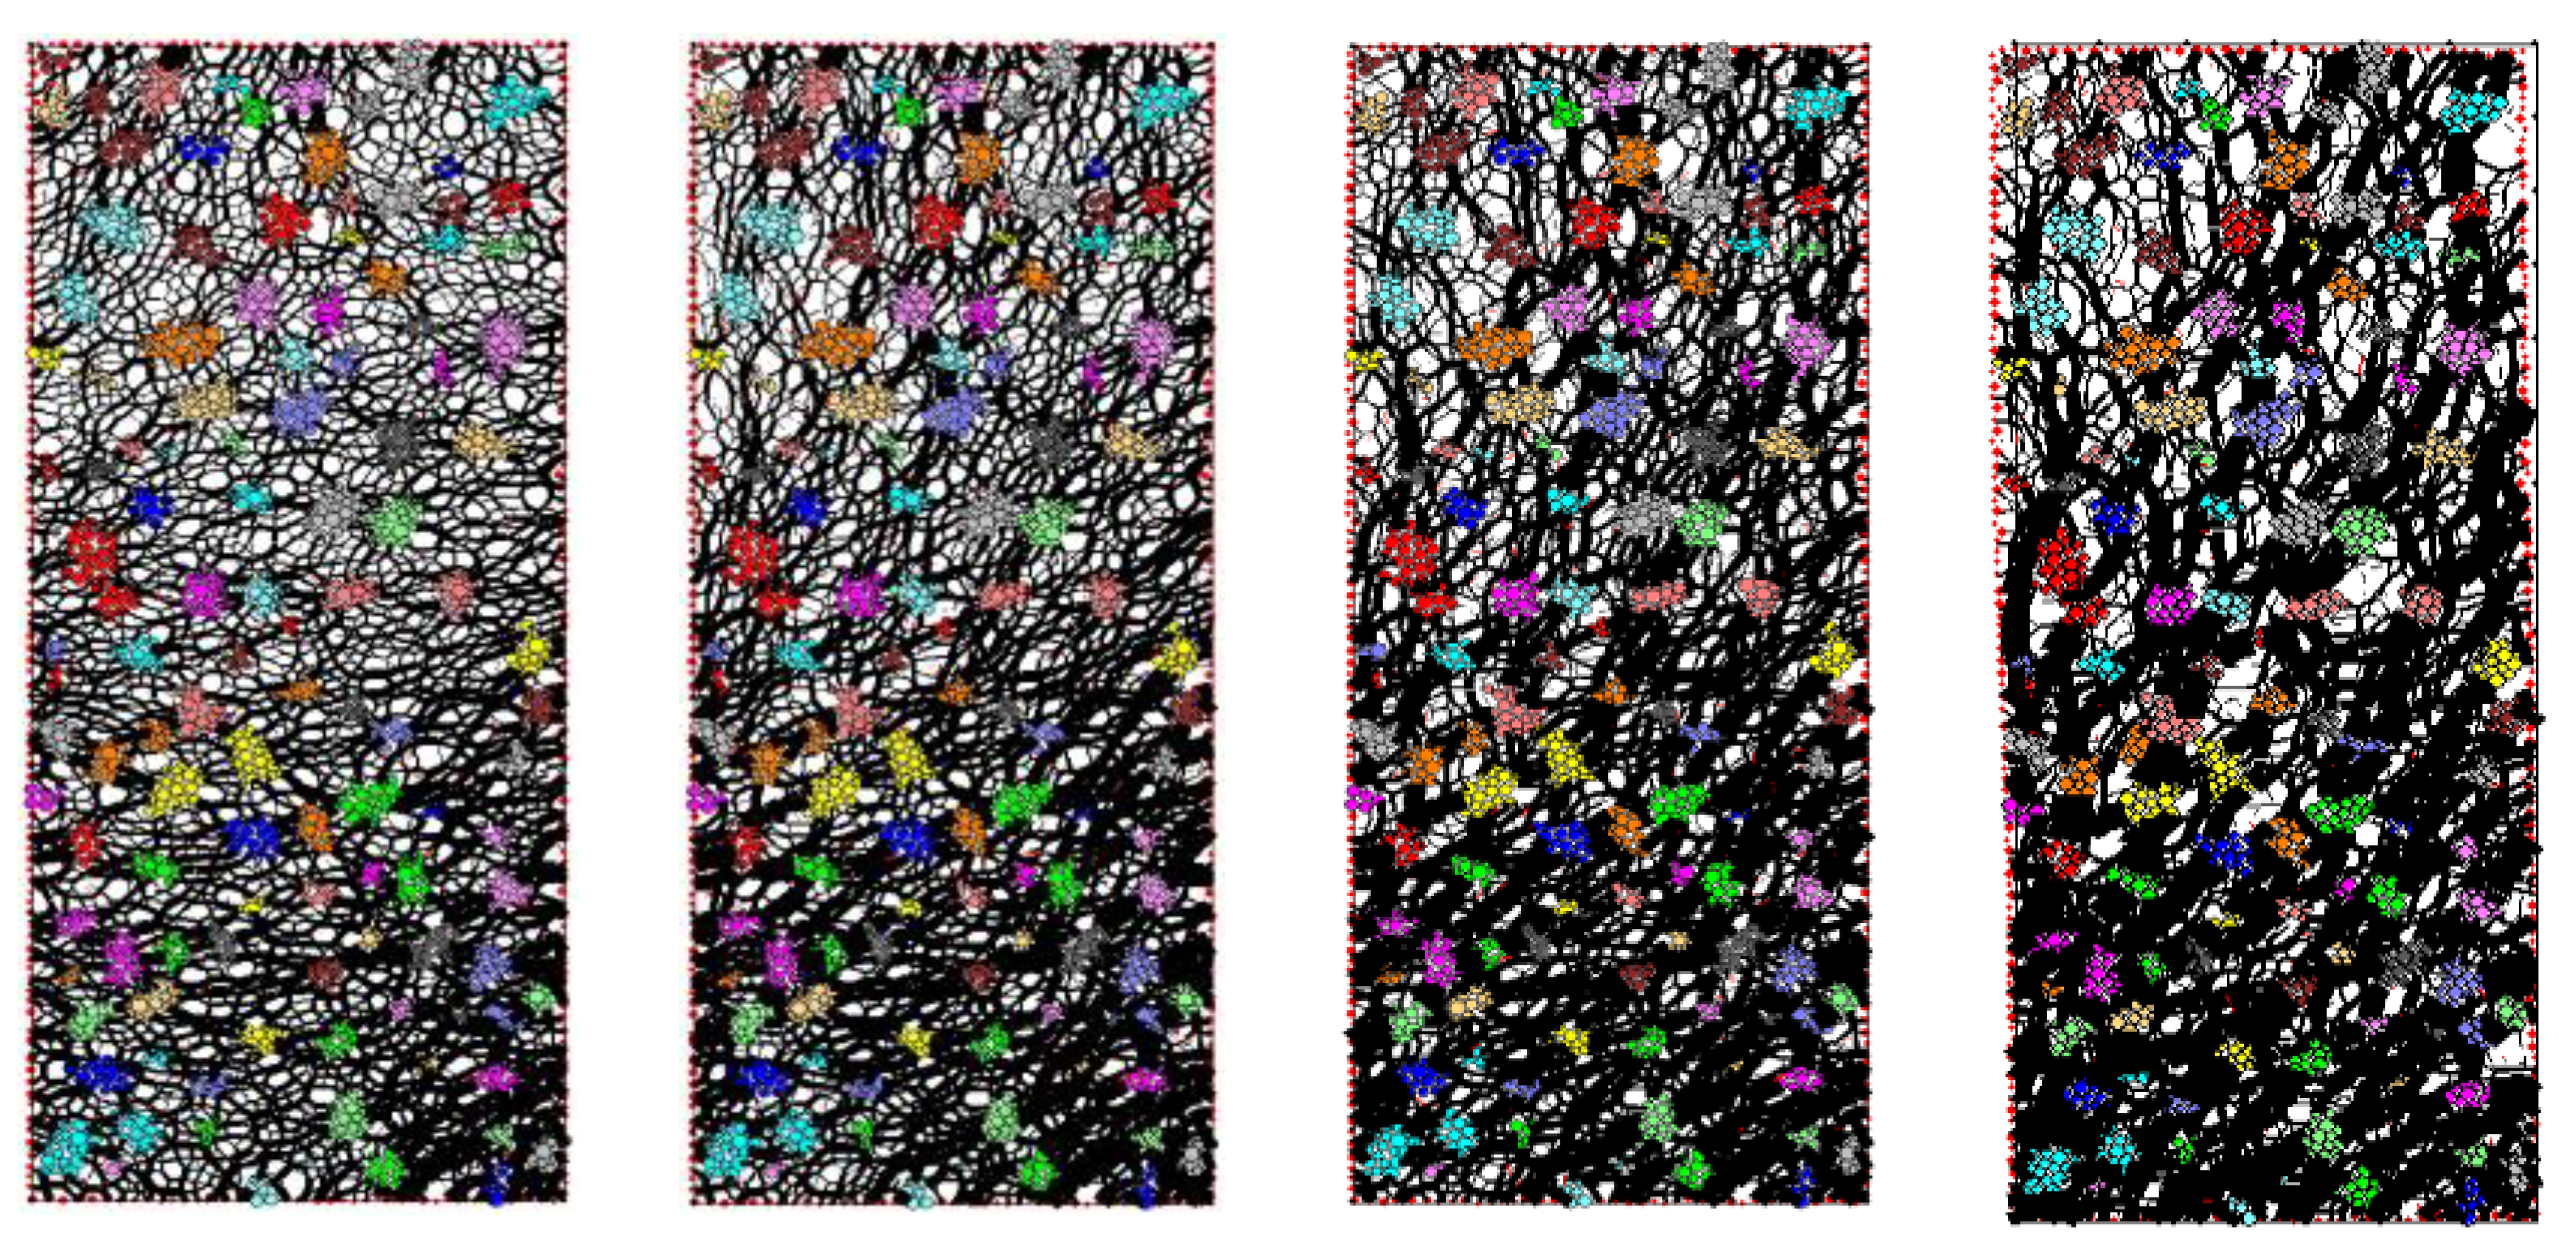
Figure 14 shows the distribution of the contact force chain between particles in the discrete domain at the four evolution stages. During the formation of the shear band of the slope, the magnitude and direction of the contact force between the soil and stone particles in the discrete domain have been significantly adjusted, which is manifested as a gradual change in the internal stress state of the slope in the macroscopic view. From the perspective of the change in the direction of the contact force, the slope is undergoing a process from deformation to failure, and the direction of the contact force between soil and stone particles is gradually adjusted to the direction of slope instability and sliding. From the perspective of the change in the value of the contact force, the force chain of the contact force between the rocks is gradually becoming thicker, indicating that the contact force borne by the stones is gradually increasing. Figure 15 shows the particle displacement vector, and it indicates that the change in the contact force between the soil and stone particles results in the movement of stones. This is macroscopically expressed as the sliding of the slope, and the moving direction of the stone particles in the direction of the slope sliding.

5.3. Evolution of Meso-Contact between Stone Particles

To quantitatively analyze the contact force distribution and evolution, the contact normal direction between particles can be approximated by the following second-order Fourier series [30]:
E ( θ ) = 1 2 π [ 1 + a cos 2 ( θ θ a ) ]
where E ( θ ) is the normal contact direction distribution function. θ is the normal contact angle. a is the coefficient of average contact force anisotropies and θ a is the corresponding principal direction.
Similarly, the normal contact force anisotropy can be described by:
f n ( θ ) = f 0 [ 1 + a n cos 2 ( θ θ n ) ]
where f n ( θ ) is the normal contact force distribution function. f 0 is the average normal contact force and θ n is the principal direction of normal contact force anisotropy. a n is the Fourier series coefficient, also known as the anisotropy parameter, and its value reflects the development degree of the anisotropy of the normal contact force between particles in the discrete domain.
The direction and magnitude of the contact force between soil and stone particles have changed significantly during the process of the slope shear zone from initial formation to penetration. Figure 16 plots the statistical distribution of the contact normal between particles in the four different evolution stages of the shear zone. With the development of the shear zone, the normal distribution shape of the contact between the soil and stone particles changes significantly. When the shear zone does not pass through the discrete domain (Figure 16a), the contact between soil and stone particles is basically in an isotropic contact state. When the shear zone gradually begins to pass through the discrete domain (Figure 16b), its distribution changes from the initial circle shape to the oval shape. It indicates that the contact between soil and stone particles changes from an isotropic contact state to an anisotropic contact state, the anisotropy parameter increases from 0.02 to 0.06, and the main anisotropy direction is adjusted from the initial 0.0° to 35.0°. Since then, as the shear zone gradually develops until it is completely penetrated (Figure 16c,d), the anisotropy of the contact state between the particles is more significant due to the movement and interaction of the soil and stone particles. The anisotropy parameter α finally increases from 0.06 to 0.26. The main anisotropy direction is finally adjusted from 35.0° to 62.0°, which is adjusted to be more consistent with the sliding direction of slope instability.
Figure 17 is the statistical distribution of the normal contact force between particles at different evolution stages of the slope. The magnitude and direction of the normal contact force between soil and stone particles have also been significantly adjusted. The most obvious one is the main direction adjustment of the normal contact force distribution, which is manifested macroscopically as the adjustment of the internal stress state of the slope. Specifically, when the shear zone does not pass through the discrete domain (Figure 17a), the normal contact force between particles is in an isotropic state. When the shear zone gradually begins to pass through the discrete domain (Figure 17b), the normal contact force distribution changes significantly, and the anisotropy parameter increases from 0.27 to 0.35. The main anisotropy direction is adjusted from 18.0° to 38.0°. Since then, the normal contact force distribution adjusts to the sliding direction of the slope instability.

5.4. Macro and Meso Deformation and Failure Mechanism of SRM Slope

Based on the above analysis, it can be concluded that during the deformation and failure process of the SRM slope, the meso-contact characteristics such as the contact force and the contact direction between the soil and stone particles undergo significant changes and adjustments. This macroscopically corresponds to the adjustment of the slope stress state, which, in turn, leads to deformation, sliding, and even instability of the slope. Therefore, the changes in the microscopic contact characteristics between the soil and stone particles inside the SRM slope are the internal driving factors for the macroscopic deformation of the slope and the adjustment of the stress state.
Figure 18 shows the macro- and meso-scale deformation and failure mechanism of SRM slopes. When the slope undergoes deformation and failure, it is manifested in the mesoscale view as the change in the contact normal and contact force between the internal particles, which causes the movement of soil and stone particles. This corresponds to the adjustment of the internal stress state of the slope in the macroscopic view, which leads to the deformation or even sliding of the SRM slope.

6. Conclusions

Based on FLAC2D and PFC2D programs, this paper establishes a discrete-continuous coupling analysis method with the help of FISH language and the Socket O/I data transfer and exchange interface. A two-dimensional mesostructure stochastic construction system (RMS2D) is developed and SRM random mesostructures are constructed in the selected discrete domain. This method is used to study the deformation and failure mechanism of the SRM slope. The conclusions are as follows:
(1) The comparison between the particle displacement cloud map in the discrete domain and the node displacement cloud map in the continuous domain shows that the displacement maintains a good continuity and consistency on the boundary, and there is no sudden change in displacement, indicating that the discrete-continuous coupling analysis can describe the deformation of the slope well.
(2) In the process of deformation and failure of the SRM slope, with the formation and development of the shear zone until it is completely penetrated, the statistical distribution of the meso-contact characteristics (such as contact direction, contact force) between soil and rock particles inside the slope undergoes obvious changes and adjustments. Among them, the main direction of the statistical distribution is adjusted most significantly, and the main direction is finally adjusted to being basically the same as the sliding direction of the slope.
(3) There is obvious interaction between soil and rock particles inside the slope, which is manifested as the change in the mesoscopic contact characteristics between the particles. This is the internal driving factor for the macroscopic deformation of the slope and the adjustment of the stress state. When the slope is deformed and damaged, it is manifested as the change in the contact direction and contact force between the internal particles in the microscopic view, resulting in the displacement of the particles. Macroscopically, the change in the stress state of the slope leads to the deformation of the slope, which may lead to instability failure.
(4) In the follow-up, the discrete-continuous coupling analysis method established in this paper will be used to conduct in-depth research on the stability of soil–rock mixture slopes. The influence of meso-particle changes such as the distribution and content of stones in the SRM on the slope stability will be analyzed.

Author Contributions

Conceptualization, Y.Z. and H.Z.; methodology, C.J.; software, L.Z.; validation, Z.L.; formal analysis, Q.H.; investigation, Y.Z.; data curation, L.Z.; writing—original draft preparation, Y.Z.; writing—review and editing, Y.Z.; supervision, C.J.; funding acquisition, Y.Z. All authors have read and agreed to the published version of the manuscript.

Funding

The research was funded by the Central South University Autonomous Exploration Project (No. 2021zzts0233), the National Natural Science Foundation of China (Grant Nos. 52008403, U1934211, and U1965204), the Natural Science Foundation of Hunan Province (Grant No. 2020JJ5732), and the IWHR Research program (GE110145B0022021 and IWHR-SKL-KF202016).

Institutional Review Board Statement

Not applicable.

Informed Consent Statement

Not applicable.

Data Availability Statement

Not applicable.

Conflicts of Interest

The authors declare no conflict of interest.

References

  1. Jia, C.; Zhang, Q.; Lei, M.; Yu, J.; Wang, R.; Liu, J. Study on the mechanical properties of outwash deposits with random structure method. Transp. Saf. Environ. 2021, 3, tdab014. [Google Scholar] [CrossRef]
  2. Lin, Y.; Yin, Z.-Y.; Wang, X.; Huang, L. A systematic 3D simulation method for geomaterials with block inclusions from image recognition to fracturing modelling. Theor. Appl. Fract. Mech. 2022, 117, 103194. [Google Scholar] [CrossRef]
  3. Yu, J.; Jia, C.; Xu, W.; Zhang, Q.; Wu, C. Granular discrete element simulation of the evolution characteristics of the shear band in soil–rock mixture based on particle rotation analysis. Environ. Earth Sci. 2021, 80, 213. [Google Scholar] [CrossRef]
  4. Sarma Sarada, K. Stability Analysis of Embankments and Slopes. J. Geotech. Eng. Div. 1979, 105, 1511–1524. [Google Scholar] [CrossRef]
  5. Spencer, E. A Method of analysis of the Stability of Embankments Assuming Parallel Inter-Slice Forces. Geotechnique 1967, 17, 11–26. [Google Scholar] [CrossRef]
  6. Bishop, A.W.; Morgenstern, N. Stability Coefficients for Earth Slopes. Geotechnique 1960, 10, 129–153. [Google Scholar] [CrossRef]
  7. Taylor, D.W. Stability of earth slopes. J. Boston Soc. Civ. Eng. 1937, 24, 197–247. [Google Scholar]
  8. Matsui, T.; San, K.-C. Finite Element Slope Stability Analysis by Shear Strength Reduction Technique. Soils Found. 1992, 32, 59–70. [Google Scholar] [CrossRef] [Green Version]
  9. Dawson, E.M.; Roth, W.H.; Drescher, A. Slope stability analysis by strength reduction. Geotechnique 1999, 49, 835–840. [Google Scholar] [CrossRef]
  10. Wang, H.; Liu, S.; Xu, W.; Yan, L.; Qu, X.; Xie, W.-C. Numerical investigation on the sliding process and deposit feature of an earthquake-induced landslide: A case study. Landslides 2020, 17, 2671–2682. [Google Scholar] [CrossRef]
  11. Zhou, J.-W.; Cui, P.; Yang, X.-G. Dynamic process analysis for the initiation and movement of the Donghekou landslide-debris flow triggered by the Wenchuan earthquake. J. Asian Earth Sci. 2013, 76, 70–84. [Google Scholar] [CrossRef]
  12. Wang, X.; Yu, P.; Yu, J.; Yu, Y.; Lv, H. Simulated Crack and Slip Plane Propagation in Soil Slopes with Embedded Discontinuities Using XFEM. Int. J. Geomech. 2018, 18, 04018170. [Google Scholar] [CrossRef]
  13. Wang, W.; Yin, K.; Chen, G.; Chai, B.; Han, Z.; Zhou, J. Practical application of the coupled DDA-SPH method in dynamic modeling for the formation of landslide dam. Landslides 2019, 16, 1021–1032. [Google Scholar] [CrossRef]
  14. Vallejo, L.E.; Mawby, R. Porosity influence on the shear strength of granular material–clay mixtures. Eng. Geol. 2000, 58, 125–136. [Google Scholar] [CrossRef]
  15. Zhang, Z.-L.; Xu, W.-J.; Xia, W.; Zhang, H.-Y. Large-scale in-situ test for mechanical characterization of soil–rock mixture used in an embankment dam. Int. J. Rock Mech. Min. Sci. 2016, 86, 317–322. [Google Scholar] [CrossRef]
  16. Huang, S.; Ding, X.; Zhang, Y.; Cheng, W. Triaxial Test and Mechanical Analysis of Rock-Soil Aggregate Sampled from Natural Sliding Mass. Adv. Mater. Sci. Eng. 2015, 2015, 238095. [Google Scholar] [CrossRef] [Green Version]
  17. Dong, H.; Peng, B.; Gao, Q.-F.; Hu, Y.; Jiang, X. Study of hidden factors affecting the mechanical behavior of soil–rock mixtures based on abstraction idea. Acta Geotech. 2021, 16, 595–611. [Google Scholar] [CrossRef]
  18. Zhang, J.-C.; Li, Y.; Xu, B.; Meng, Q.-X.; Zhang, Q.; Wang, R.-B. Testing and constitutive modelling of the mechanical behaviours of gravelly soil material. Arab. J. Geosci. 2020, 13, 523. [Google Scholar] [CrossRef]
  19. Lin, Y.; Wang, X.; Ma, J.; Huang, L. A systematic framework for the 3D finite-discrete modelling of binary mixtures considering irregular block shapes and cohesive block-matrix interfaces. Powder Technol. 2022, 398, 117070. [Google Scholar] [CrossRef]
  20. Lin, Y.; Wang, X.; Ma, J.; Huang, L. A finite-discrete element based appoach for modelling the hydraulic fracturing of rocks with irregular inclusions. Eng. Fract. Mech. 2022, 261, 108209. [Google Scholar] [CrossRef]
  21. Nakashima, H.; Oida, A. Algorithm and implementation of soil–tire contact analysis code based on dynamic FE–DE method. J. Terramech. 2004, 41, 127–137. [Google Scholar] [CrossRef]
  22. Cai, M.; Kaiser, P.K.; Morioka, H.; Minami, M.; Maejima, T.; Tasaka, Y.; Kurose, H. FLAC/PFC coupled numerical simulation of AE in large-scale underground excavations. Int. J. Rock Mech. Min. Sci. 2007, 44, 550–564. [Google Scholar] [CrossRef]
  23. Saiang, D. Stability analysis of the blast-induced damage zone by continuum and coupled continuum–discontinuum methods. Eng. Geol. 2010, 116, 1–11. [Google Scholar] [CrossRef]
  24. Jia, M.; Yang, Y.; Liu, B.; Wu, S. PFC/FLAC coupled simulation of dynamic compaction in granular soils. Granul. Matter 2018, 20, 76. [Google Scholar] [CrossRef]
  25. Meng, Q.; Wang, H.; Cai, M.; Xu, W.; Zhuang, X.; Rabczuk, T. Three-dimensional mesoscale computational modeling of soil-rock mixtures with concave particles. Eng. Geol. 2020, 277, 105802. [Google Scholar] [CrossRef]
  26. Wang, Z.M.; Kwan, A.K.H.; Chan, H.C. Mesoscopic study of concrete I: Generation of random aggregate structure and finite element mesh. Comput. Struct. 1999, 70, 533–544. [Google Scholar] [CrossRef]
  27. He, J.; Li, X.; Li, S.; Gu, J.; Yin, Y. Numerical Study of Rock-Soil Aggregate by Discrete Element Modeling. In Proceedings of the 2009 Sixth International Conference on Fuzzy Systems and Knowledge Discovery, Tianjin, China, 14–16 August 2009. [Google Scholar]
  28. Coetzee, C.J.; Els, D.N.J. Calibration of granular material parameters for DEM modelling and numerical verification by blade–granular material interaction. J. Terramech. 2009, 46, 15–26. [Google Scholar] [CrossRef]
  29. Leung, C.F.; Zhou, Y. Rock Mechanics in Underground Construction-Proceedings of the 4th Asian and International Rock Mechanics Symposium 2006 (with Cd-Rom); World Scientific Publishing Company: Singapore, 2006; Available online: https://books.google.com.hk/books?id=x6nICgAAQBAJ (accessed on 8 November 2022).
  30. Rothenburg, L.; Bathurst, R. Analytical study of induced anisotropy in idealized granular materials. Geotechnique 1989, 39, 601–614. [Google Scholar] [CrossRef]
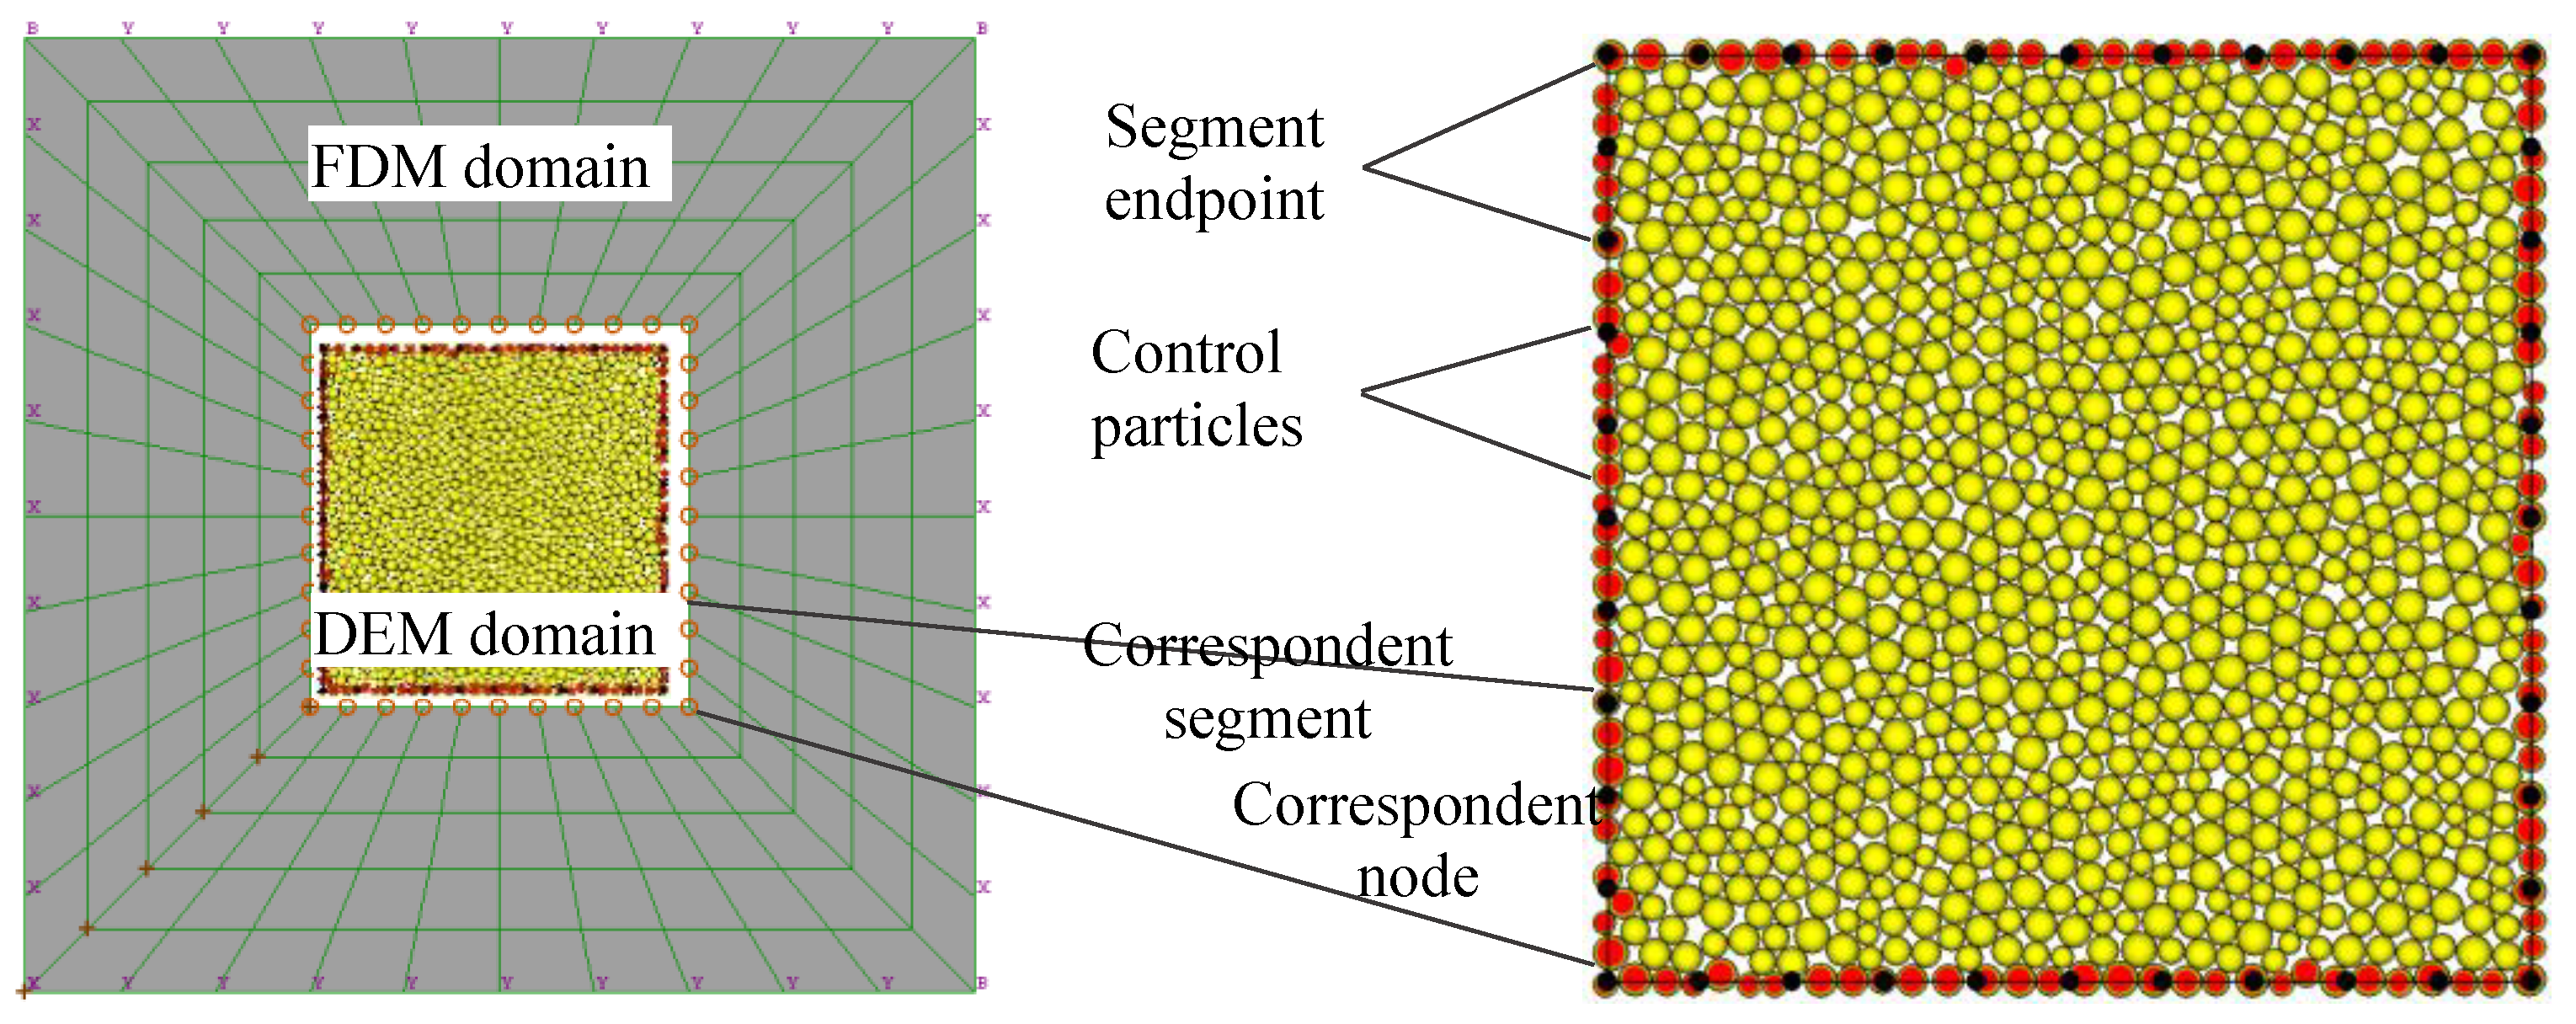
Figure 1. Coupling boundaries between FLAC and PFC models.
Sustainability 14 17015 g001
Figure 2. Mapping reaction forces of controlled particles to endpoints of segments.
Sustainability 14 17015 g002
Figure 3. Data transmission and exchange between FLAC and PFC.
Sustainability 14 17015 g003
Figure 4. Generation of random stones.
Sustainability 14 17015 g004
Figure 5. Stretch of the outline of initially generated stones.
Sustainability 14 17015 g005
Figure 6. Types of invasions between stones.
Sustainability 14 17015 g006
Figure 7. Random meso-structures of SRM with different stone contents and spatial distribution. (a) C = 30%. (b) C = 60%. (c) Spatial distribution 1 (C = 45%). (d) Spatial distribution 2 (C = 45%).
Sustainability 14 17015 g007
Figure 8. (a) Slope geometry model and (b) numerical models for discrete and continuous domains.
Sustainability 14 17015 g008
Figure 9. The process of establishment of a numerical model for discrete domain.
Sustainability 14 17015 g009
Figure 10. Stress distribution contours of slope: (a) initial static calculation and (b) initial coupling calculation.
Sustainability 14 17015 g010
Figure 11. Displacement contours of discrete and continuous domains of slope after failure.
Sustainability 14 17015 g011
Figure 12. The plastic zone of slope after failure.
Sustainability 14 17015 g012
Figure 13. Shear strain rate contours of continuous domain at different evolution stages of shear band: (a) shear band does not pass through discrete domain, (b) shear band begins to pass through discrete domain, (c) shear band passes through discrete domain, and (d) shear band is in complete connection.
Sustainability 14 17015 g013
Figure 14. Force chain distributions of contacts between particles in the discrete domain at different evolution stages of shear band.
Sustainability 14 17015 g014
Figure 15. Displacement of particles in the discrete domain at different evolution stages of shear band.
Sustainability 14 17015 g015
Figure 16. Statistical distribution charts of normal contacts between particles in the discrete domain at different evolution stages of shear band: (a) a = 0.02, θ a = 0°; (b) a = 0.06, θ a = 35° (c) a = 0.1, θ a = 60°; (d) a = 0.26, θ a = 62°.
Sustainability 14 17015 g016
Figure 17. Statistical distribution charts of normal contact forces between particles in the discrete domain at different evolution stages of shear band: (a) a n = 0.27, θ n = 18°; (b) a n = 0.35, θ n = 38° (c) a n = 0.42, θ n = 56.5°; (d) a n = 0.56, θ n = 60°.
Sustainability 14 17015 g017
Figure 18. Deformation and failure mechanism of SRM slope.
Sustainability 14 17015 g018
Table 1. Parameters of the constitutive model for continuous domain.
Density
(kg/m3)
Bulk Modulus
(GPa)
Shear Modulus (GPa)Frictional Angle
(°)
Cohesion
(kPa)
Tensile Strength
(kPa)
27000.50.1530.050.00.1
Table 2. Parameters of the constitutive model for discrete domain.
MaterialDensity (kg/m3)Stiffness (N/m)Cohesion (N)Friction Coefficient
ρ k n k s F n b F s b μ
Soil20005.0 × 1072.0 × 1071.5 × 1033.5 × 1030.55
Stone27005.0 × 1085.0 × 1081.0 × 1061.0 × 1061.0
Publisher’s Note: MDPI stays neutral with regard to jurisdictional claims in published maps and institutional affiliations.