1. Introduction
In recent years, environmental pollution has become a major concern in China, with wide-reaching negative effects on not only health and the environment, but also the economy [
1,
2,
3]. In response to the growing deterioration of the environment, the Chinese government is tightening its environmental regulation with the hope that firms will adopt more environmentally friendly technology and produce more responsible greener products. Despite some benefits from the cleanup of the environment, however, worriers argue that the stricter environmental regulation may mirror the loss of comparative advantage, affecting firms’ location and trade flows in the global market, which is called ’pollution haven effect’ (PHE) by Copeland and Taylor [
4]. The growing empirical literatures have set out to estimate the aggregate-level (industrial or regional) variations in response to tightened environmental policies, but little has been revealed about the firm-level adjustments of exporting decisions and its potential mechanism.
The purpose of this article is to address this issue. The existence of the pollution haven effect has important implications for international trade negotiations, when there is debate over whether to expand trade agreements to include cooperation with domestic policies [
5,
6,
7]. Despite the importance of the pollution haven effect, however, empirical studies fail to provide conclusive results on the effects of environmental regulation, with some finding no such effects [
8,
9,
10,
11] and others documenting significant effects [
12,
13,
14,
15,
16,
17,
18,
19,
20]. There are two opposing views on the effects of asymmetric environmental policies on the performance of companies competing in the same market: the conventional view and the Porter hypothesis. The conventional view holds that stringent environmental regulation is detrimental to firm exports, because it imposes additional compliance costs on firms and could undermine their competitiveness, and therefore has a negative impact on firm exports [
21,
22,
23]. In contrast to the conventional view, the Porter hypothesis argues that more stringent environmental policies can actually have a net positive effect on the competitiveness of regulated firms because such policies promote cost-cutting efficiency improvements, which in turn reduce or completely offset environmental regulatory costs, and foster innovation in new technologies that may help firms achieve international technological leadership and expand market share [
24,
25,
26].
In this article, we investigate the exporting decisions and potential mechanisms in response to tightened environmental regulation, using the matched firm-level data of China based on the Cleaner Production Audit (CPA) reports and the Annual Survey of Industrial Firms (ASIF). The implementation of the mandatory Cleaner Production Audit programs, which is a unique environmental regulatory policy of interest in this article, acts as a quasi-natural experiment to deal with the potential endogeneity issue associated with the environmental regulation. Combining the propensity score matching (PSM) and difference-in-differences (DID) approaches, we seek to identify the causal effect of the mandatory Cleaner Production Audit programs on firm exports, by comparing the participants of the mandatory Cleaner Production Audit programs with non-participants. Furthermore, we explore the potential mechanisms through which firms’ exporting performance responds to the environmental regulation, and we also examine the heterogeneous regulatory effects by firm ownership, location and size.
We obtain several novel findings about the environmental regulatory effects on firm-level exporting performance. The mandatory Cleaner Production Audit programs have significantly reduced the firm export values, which is consistent with the pollution haven effect, and this negative effect is stronger and more significant when the implementation of mandatory Cleaner Production Audit programs was substantially improved in the later stage. This result is robust against a series of robustness checks, including the falsification test excluding anticipatory effect of pre-treatment trends, the multiple propensity score matching approaches avoiding estimation bias of single matching method, and the Heckit model dealing with self-selection bias. Moreover, the stringent environmental regulation barely affects state-owned firms, whereas it strongly influences private firms located in the eastern region of China, and has a much larger negative effect on exports of small-size firms relative to large-size firms. In addition, there are both the compliance costs effect and the innovation offsets effect for the impact of environmental regulation on firm exports, but the benefits from the innovation offsets effect do not appear to be large enough to outweigh the compliance costs effect for the regulated firms.
Beyond the aforementioned policy implications, the contributions of this article to the existing literature are from four aspects. Firstly, although there is a large body of research examining the effects of environmental regulations on aggregate trade flows, there is little work examining the effects of environmental regulations on individual exporters. Our article contributes to this literature by providing evidence of the micro foundations underlying these aggregate responses to environmental regulations. Secondly, we seek to tease out the causal relationship between environmental regulation and firms’ exporting performance. The mandatory Cleaner Production Audit programs used in this article act as a unique quasi-natural experiment, providing an opportunity for making a causal inference. Thirdly, compared with other papers that investigate the effects of stricter environmental regulations on exports in China, we go a step further to investigate the detailed mechanisms through which stringent environmental regulations affect firm exports due to the availability of micro-firm-level data. Fourthly, our work contributes to a large literature studying the determinants of exporting. This literature has examined various factors that affect exporting, including exporter characteristics, sunk costs, financial constraints, and experimentation, amongst other factors. We build on this earlier work by showing how environmental regulations affect firm exports.
The remainder of this article is organized as follows.
Section 2 presents the literature review, and discusses the theoretical analyses and research hypotheses.
Section 3 provides the policy background of the mandatory Cleaner Production Audit in China, describes data sources and the construction of the final micro-firm-level dataset for econometric analysis, and presents the empirical methodology.
Section 4 reports the empirical results, including the baseline results, robustness checks, heterogeneous effects and the mechanism analyses. Finally,
Section 5 concludes this article.
2. Literature Review and Hypotheses
2.1. Literature Review
This article contributes to the growing literature about trade and the environment centering around the theoretical and empirical relationship among trade liberalization, environmental regulation and environmental pollution [
11,
12,
13,
14,
15,
16,
17,
18,
19,
20,
27,
28,
29,
30,
31]. Copeland and Taylor [
4] distinguish the impact of trade liberalization on the environment from the impact of environmental regulation on trade. The former is related to the pollution haven hypothesis (PHH), which states that tariff cuts could lead to the relocation of dirty industries from countries with stringent environmental control to countries with lax environmental regulations [
27,
28,
29,
30,
31]. The latter refers to the pollution haven effect (PHE), suggesting that a stringent environmental regulation would affect site choices of firms in the dirty industries and henceforth the direction of trade flows [
11,
12,
13,
14,
15,
16,
17,
18,
19,
20].
Our article is closely related to the literature on the pollution haven effect (PHE), in particular, those related to China. The theory behind the pollution haven effect is simple, which is that more stringent environmental policies raise production costs, and this leads to reduced net exports (or increased net imports) in sectors affected by environmental regulation. Based upon the country or industry-level data, earlier studies adopt pollution abatement costs and expenditures or emission intensity as measures for the stringency of environmental regulation [
5,
12,
32,
33,
34], to investigate the impact of stricter environmental regulation on exports. For example, Ederington and Minier [
5], Levinson and Taylor [
12], and Branger et al. [
34] use instrumental variables to account for the endogeneity of environmental policy and find that more stringent environmental policy reduces net exports. More recent work exploits firm-level data and geography more fully, focuses on specific environmental regulation implemented at the nation-wide scale or regional levels, and seeks to tease out the causal impact of environmental regulation on firms’ location and trade flows in the global market [
16,
17,
18,
19,
20]. For example, Cherniwchan and Najjar [
18] employ Canadian plant-level data to investigate the relationship between environmental regulation and export volumes and the likelihood that plants exit exporting.
The pollution haven effect can also work via foreign direct investment [
14,
15]. This strand of literature broadly examines two distinct questions: first, whether relatively lax policies are a pull factor in attracting incoming manufacturing investments and second, whether stringent policies are a push factor that influences the decision on outward investment flows or relocation decisions. A number of studies use the within-country variation in environmental stringency and find inconclusive evidence on its impact on inward FDI location [
35,
36,
37]. For example, Dean et al. [
36] examine inward FDI in China and find that equity joint ventures in polluting industries are generally not attracted by weak environmental standards. Taking advantage of the Two Control Zones policy as a quasi-natural experiment, Cai et al. [
14] find that stricter environmental regulation leads to less FDI inflow at the firm-level in China. Whether stringent environmental policies encourage firms to increase foreign assets also remains empirically unresolved [
38,
39,
40]. For example, Hanna [
15] uses firm-level data to examine whether exogenous changes in regulatory status under the CAAA caused U.S. multinational firms to increase their foreign assets and foreign output. Overall, the empirical evidence suggests that the existence of a pollution haven effect for foreign investment remains unclear.
To summarize, there is some evidence that environmental policy affects firms’ location and trade flows in the global market, however effects vary across industry and country. By focusing on the micro foundations underpinning how environmental regulations affect trade flows in the context of China, our article is related to work by Hering and Poncet [
16], Shi and Xu [
17], Chen and Xu [
41], who also study the effects of environmental regulations on Chinese exporters. However, all of the above papers study the effects of environmental regulation on aggregate measures of trade rather than individual exporters. In fact, there is surprisingly little evidence of how environmental regulations affect individual exporters, except Cherniwchan and Najjar [
18], and Zhang et al. [
19], but the former paper examines the effect of environmental regulation on individual exporters in the context of Canada, and the latter paper does not explore the potential mechanism though which environmental regulation affects individual exporters. Our article investigates the individual exporting decisions and potential mechanisms in response to environmental regulation in the context of China.
2.2. Research Hypotheses
Motivated by a wealth of evidence from micro data, theoretical research in international trade increasingly emphasizes the decisions of heterogeneous firms in understanding the causes and consequences of aggregate trade [
42]. In fact, participation in international trade is relatively rare and is associated with superior values of productivity and other measures of economic performance. Melitz [
43] shows that only firms that are sufficiently productive can become exporters, as being more productive allows firms to secure a market share that is large enough to cover the fixed cost of exporting. The heterogeneity in firm productivity is systematically related to trade participation, with exporters more productive than non-exporters even prior to entering export markets. Models of firm heterogeneity provide a natural explanation for these and other features of disaggregated trade data that cannot be directly interpreted using representative firm models, whether based on comparative advantage or love of variety. Based on the theories of heterogeneous firms, we next discuss the exporting decisions and potential mechanisms in response to tightened environmental regulations.
There are two opposing views on the effects of asymmetric environmental policies on the performance of companies competing in the same market: the conventional view and the Porter hypothesis [
22]. The conventional view among economists and managers concerning environmental regulations is that they come at an additional cost imposed on firms, which may erode their global competitiveness. Environmental regulations such as technological standards, environmental taxes, or tradable emissions permit force firms to allocate some inputs (such as labor and capital) to pollution reduction, which is unproductive from a business perspective. Technological standards restrict the choice of technologies or inputs in the production process. Taxes and tradable permits charge firms for their emissions pollution, a by-product of the production process that was free before. These fees necessarily divert capital away from productive investments [
21]. Thus, regulatory differences across firms, sectors, or jurisdictions can cause changes in relative production costs. Such changes could arise from differences in direct costs, and increases in relative costs could also result from higher indirect costs caused by policy-induced changes to input costs [
23]. Differences in environmental regulations can hence alter the competition between firms by changing their relative production costs. In other words, we can name the aforementioned conventional view as the ‘compliance costs effect’.
The Porter hypothesis takes the more dynamic perspective that more stringent policies should trigger greater investment in developing new pollution-saving technological innovations. If these technological innovations induce input savings that would not have occurred without the environmental policy, they may offset part of the compliance costs. Porter and van der Linde [
24] go further, arguing that environmental regulations can actually “trigger technological innovation that may more than fully offset the costs of complying with them”, i.e., lowering overall production costs and boosting the competitiveness of firms. This Porter hypothesis outcome may occur if cleaner technologies lead to higher productivity, input savings, and technological innovations, which over time offset environmental regulatory costs and improve export performance and market share [
25]. For example, the existence of learning externalities might prevent the replacement of an old polluting technology by a new, cleaner and more productive technology because firms have a second-mover advantage if they wait for someone else to adopt. In this situation, the introduction of an environmental regulation would induce firms to switch to the new, cleaner technology, which improves environmental quality and eventually increases firm productivity [
26,
44]. Being same as the conventional view, we can name the Porter hypothesis as the ‘innovation offsets effect’.
To summarize, the influencing effect of environmental regulations on firm exports, which is called ‘pollution haven effect’ (PHE) by Copeland and Taylor [
4], depends on the relative magnitude of the ‘compliance costs effect’ and the ‘innovation offsets effect’. Specifically, if there is only compliance costs effect but without innovation offsets effect; or if there are both compliance costs effect and innovation offsets effect, for the impact of environmental regulation on firm exports, but the benefits from the innovation offsets effect do not appear to be large enough to outweigh the compliance costs effect for the regulated firms, then we can propose Hypothesis 1a. On the contrary, if there are both compliance costs effect and innovation offsets effect, and moreover the benefits from the innovation offsets effect appear to be large enough to outweigh the compliance costs effect for the regulated firms, then we can propose Hypothesis 1b.
Hypothesis 1a. The mandatory Cleaner Production Audit,a unique environmental regulatory policy in China, will negatively affect the firm exports.
Hypothesis 1b. The mandatory Cleaner Production Audit,a unique environmental regulatory policy in China, will positively affect the firm exports.
3. Background and Empirical Strategy
3.1. Policy Background
Cleaner production has been prevalent in many developed countries, such as the U.S., Japan, Canada, Sweden, and others, by means of voluntary participation before it began in China. China started the promotion of cleaner production by establishing national and local policies and institutions of promotional centers and by carrying out some pilot projects in designated provinces and industries successively in the 1990s. However, all these cleaner production measures produced limited effects due to the lack of institutional capacity and incompatibility with the then-prevailing end-of-pipe treatment approach [
45]. On the basis of these previous pilot projects, China became the first country to make the implementation of cleaner production practices mandatory for firms by issuing ‘The Cleaner Production Promotion Law’ in June 2002 [
46,
47].
The implementation of cleaner production can be roughly divided into two stages from the enactment of ‘The Cleaner Production Promotion Law’, which is the first relevant environmental law focusing on pollution prevention in China. It regulated two kinds of firms that have to carry out the Cleaner Production Audit. One type is firms that exceed the quotas of pollutant discharge or do not reach standards of pollutant discharge. The other type is firms that use or discharge toxic or hazardous materials. Its adoption provides the definition and scope for cleaner production and marks that China has a legal basis in the implementation of the mandatory Cleaner Production Audit.
The implementation of the mandatory Cleaner Production Audit programs did not proceed substantially until ‘The Interim Measures on Cleaner Production Audit’ by the National Development and Reform Commission and the Ministry of Environmental Protection of China in August 2004, which proposed for the first time the mandatory Cleaner Production Audit, making it clear how to generate, confirm, and publish firms that have to carry out the mandatory Cleaner Production Audit projects. In December 2005, the Ministry of Environmental Protection of China issued the ‘Administrative Procedures for Conducting Cleaner Production Audit in Key Enterprises’, detailing requirements and working procedures of the mandatory Cleaner Production Audit, laying a solid foundation for the operability and implementation of the mandatory Cleaner Production Audit programs. By 2005, regulations guiding firms to conduct the mandatory Cleaner Production Audit projects had been nearly complete.
The concrete implementation procedures are as follows [
47,
48]. (1) Prefecture-level environmental departments select and submit to the superior authority a list of firms as candidates for the mandatory Cleaner Production Audit. Provincial-level environmental departments confirm and publish the list of key firms (listed firms) to carry out the mandatory Cleaner Production Audit projects. (2) Listed firms shall disclose environmental information, including energy consumption and major pollutants within one month after publication of the list. Aside from disclosure of relevant information, firms on the list shall complete the Cleaner Production Audit projects on their own or be guided by external consultants employed by private or government organizations. They have to launch the Cleaner Production Audit projects within two months after publication of the list and finalize the CPA report, which shall be submitted to the local government to wait for assessment after completing the Cleaner Production Audit projects within one year. (3) The evaluation and acceptance inspections of the Cleaner Production Audit are conducted by environmental protection authorities or entrusted institutions. However, the documents did not have any detailed and uniform passing criteria for the evaluation and acceptance inspections until 2008. The effectiveness of the cleaner production laws and policies is limited, owing to the lack of uniform passing criteria, and the implementation of the mandatory Cleaner Production Audit is largely dependent on the provincial or local circumstances at this stage.
In July 2008, the Ministry of Environmental Protection of China issued ‘The Administrative Procedures for Evaluation and Acceptance of Cleaner Production Audit in Key Enterprises’, which added relevant contents of the Cleaner Production Audit assessment and acceptance inspections of key firms on the basis of the previous acts. The evaluation is mainly for checking the low-cost cleaner production options that have been carried out as well as an assessment of the plausibility and feasibility of all medium and high-cost cleaner production options based on the Cleaner Production Audit report [
47,
48]. The issue of this act solves the problems of discrepancy and deficiency in the implementation of the Cleaner Production Audit programs, and definitely improves the quality and effectiveness of implementation of the mandatory Cleaner Production Audit. After 2008, more specified and localized implementation policies and rules were introduced, and the conduction of the CPA programs entered into a new era [
47,
49].
The mandatory Cleaner Production Audit, as an integral part of cleaner production, plays an important role in achieving energy conservation and pollution reduction targets. It also promotes cleaner production as an important and effective tool to specifically implement various national plans such as ‘The Atmospheric Pollution Prevention and Control Action Plan’ [
50,
51]. Its practice can overall be mainly divided into three stages. In the first stage (before 2004), the promotion of cleaner production was piloted in some provinces and its effectiveness was limited, because there was no relevant legal basis. The second stage (2004–2008) started with the Cleaner Production Promotion Law, and then more acts were stipulated and specified Cleaner Production Audit implementation procedures and standards that firms should meet. However, a lack of detailed and uniform passing criteria for the evaluation and acceptance inspections made the effectiveness of the mandatory Cleaner Production Audit not as good as expected. The third stage (2009–2012) accurately started by the establishment of the Cleaner Production Audit evaluation and acceptance system in June 2008. Acceptance inspections is carried out when all options have been implemented, and firms conducting the Cleaner Production Audit projects have to pass the evaluation and acceptance inspections. The provincial governments localize the regulation and execution of the updated CPA framework in this stage [
47,
52]. The effectiveness of the implementation of the mandatory Cleaner Production Audit is clearly better than any other periods before.
3.2. Data and Descriptive Statistics
3.2.1. Data Sources
Our datasets mainly have two sources. The first data source is the Cleaner Production Audit lists. The list of firms participating in the Cleaner Production Audit programs spanning from 2004 to 2012 in 31 regions was released by the Ministry of Environmental Protection of China [
53,
54,
55], of which 17,442 firms are enrolled in the Cleaner Production Audit programs and two types of firms are included in this dataset. One type is voluntary firms (the number of firms is 591), which account for a tiny proportion of all listed firms, and the other type is mandatory firms. The emphasis of this article is to analyze the impact of the mandatory Cleaner Production Audit on firm exports. As the environmental regulation costs and the behavior of these two kinds of firms are significantly different, we only keep firms that are obliged to participate in the Cleaner Production Audit programs. There are six items in this Cleaner Production Audit list: firm name, the type of participation (voluntary or mandatory), the year of publication of the CPA list, the year of submitting the CPA report, the year of evaluation, and the year of passing the acceptance inspections. We have described them above in
Section 3.1. We can find that the number of firms participating in the mandatory Cleaner Production Audit programs by year increases dramatically after 2008, which is the later stage of the implementation of the mandatory Cleaner Production Audit programs.
The second data source is the Annual Survey of Industrial Firms (ASIF) collected by the National Bureau of Statistics of China, from which we obtain the information about firm production and export. The sample period is chosen ranging from 2003 to 2012 in order to match with the Cleaner Production Audit data. The dataset of ASIF covers all state-owned enterprises (SOEs) and all non-state-owned enterprises (non-SOEs) with annual sales of at least five million dollars in Renminbi (RMB). This dataset also provides much detailed firm-level information, including firm identification, such as name, location, postal code, legal representative, industry that the firm belongs to, and all production and operation items, such as employment, value of exports, wage rate, total assets, net value of fixed assets, intermediate input, and so on. We then drop the unqualified observations based on the accounting principles and depreciate all pecuniary variables based on the year of 1998 following Brandt et al. [
56].
We merge the dataset of ASIF with the dataset of mandatory CPA lists by using the name of firms, to construct a new final panel dataset that includes the key variables of firm export values, the status of whether the firm is under regulations, and other control variables. The new panel dataset consists of the merged listed firms, which account for 60.3% of all firms being regulated, and all firms from the dataset of ASIF. Here, 10,164 listed firms participating in the mandatory CPA programs are matched, and the number of all listed firms is 16,851. Firm-year observations belonging to exporters account for 27.8% of all observations in our data period during 2004–2012.
3.2.2. Propensity Score Matching
The amount and statistical disparity of the data between treatment and control groups may be huge. Thus, it is essential to balance two groups by using propensity score matching (PSM), which was proposed by Rosenbaum and Rubin [
57] as a method to alleviate the bias of treatment effects in an estimation of observational datasets. The basic principle of PSM is to find non-treated firms (control group) similar to the treated ones (treatment group) based on the propensity score. Following Heyman et al. [
58], we conduct the propensity score matching approach in two main steps.
We first lag the key covariates that are assumed to affect the firm’s probability of being regulated to form the independent pre-treatment variables (observable characteristics of firms). The key covariates include firm total factor productivity, capital intensity, age, and size, which are regarded as the important factors in explaining the performance of firm exports in the previous literature [
59,
60]. It is worth noting that different industrial firms have varying exposure to be regulated by the mandatory CPA. The more polluted the industry is, the more easily firms of this sector are to be regulated. Moreover, the selection of listed firms is decided by province-level governments, and so the concrete implementation standards and procedures of the mandatory CPA are different more or less and result in different probabilities of firms being regulated in different provinces. Therefore, controlling for the industry and province effects, which lead to different probabilities of firms being regulated, are important in the process of matching. Next, we split the new panel dataset into section datasets year by year and get the sub-datasets during 2004–2012, in order to subsequently compute each firm’s propensity score and match. Additionally, the amount of non-treated firms is far larger than treated firms, and so there is less concern about whether the overlap and the balancing property of the propensity score problems could be fulfilled.
Second, we implement the logit model to estimate the propensity score for each firm and pair the treated firms with the most similar non-treated firms on a propensity score of 1 to 4 via the nearest-neighbor matching method year by year. We then combine the matched section datasets into the panel dataset for subsequent DID analysis. Finally, we conduct the balancing test to examine whether the distribution of observed characteristics of firms is similar between the treatment and control groups.
Table 1 shows the balancing test results before and after matching. Here, we can see that differences of all observed characteristics between treated and non-treated firms are not significant after using the propensity score matching approach, and all covariates between the treatment and control groups are well-balanced.
Figure 1a,b show the propensity score distributions between the treatment groups and control groups before and after propensity score matching (PSM), respectively. The matching principle and method are reasonable for satisfying the balancing property of the propensity score. All these facts prove that the data quality of the control group improves substantially after PSM.
3.2.3. Descriptive Statistics
Table 2 presents the definitions of our variables and descriptive statistics, including the number of observations, means, and standard deviations before and after propensity score matching (PSM). The rows of Non-PSM in
Table 2 tell that firms in the treatment group are more likely to export, and that export value, total factor productivity (TFP), total industrial output value, capital intensity, and age are greater than those of firms in the control group. The rows of PSM provide the summary statistics of our variables after propensity score matching, and we can see that all observable characteristics of firms in the control group are very similar to those from the treatment group.
Figure 2 shows the number of firm-year observations for participants of the mandatory Cleaner Production Audit before and after PSM from 2004 to 2012, respectively. The change in the number of observations over time before and after PSM is the same, which means that the final subsamples of listed firms represent the original samples well. Additionally, firm-year observations belonging to exporters account for 42.8% of all observations after PSM from 2004 to 2012, with 44.5% for the treatment group and 42.2% for the control group, respectively.
3.3. Empirical Methodology
3.3.1. Identification Framework
The main objective of this article is to examine the impact of the mandatory Cleaner Production Audit on firm exports, measured by the logarithm of firm export values. The implementation of the mandatory Cleaner Production Audit programs provides a great natural experiment to conduct the difference-in-differences (DID) analysis by comparing (i) firms before and after participating in the mandatory Cleaner Production Audit programs, and (ii) participants of the mandatory Cleaner Production Audit programs (the treatment group) and non-participants (the control group). We construct a panel dataset consisting of participants and non-participants of the mandatory Cleaner Production Audit programs using the PSM approach. As discussed above, we pair the mandatory Cleaner Production Audit participants with the most similar non-participants that serve as the substitutes for the unobserved counterfactual. All these preparations in advance allow us to employ the DID approach to identify the causal effect of the mandatory Cleaner Production Audit on firm exports. Following Heyman et al. [
58], we set up the following DID model for the logarithm of the value of firm exports:
where
i indexes the firm,
j indexes the 2-digit industry,
p indexes the 2-digit province, and
t indexes the year. We use the dummy variable
Audit to show the regulated status of the firm. The value of
Audit equals 1 when the firm
i in industry
j and province
p has passed the acceptance inspections of the mandatory Cleaner Production Audit at year
t (including year
t), and equals 0 otherwise. The reasons why we stipulate the year of passing the acceptance inspections of the mandatory Cleaner Production Audit as the time when firms are regulated run as follows. The lag between the year of the mandatory CPA list publication and the year when the firm actually launched the cleaner production projects could be two years [
47]. The year when the firm passed the acceptance inspections means that the firm had completed all the cleaner production options, which substantially put the firm under more stringent environmental regulations. There are some missing values for the year of passing the acceptance inspections probably due to a lack of procedures of acceptance inspections in the early stage of the mandatory Cleaner Production Audit. Thus, we replace the value of the acceptance inspections year with the value of the assessment year when the dummy variable
Audit is missing.
The coefficient of interest
on the
Audit variable captures the DID effect of average differential in the change for exports of participants of the mandatory Cleaner Production Audit programs and the change for non-participants. The coefficient
is expected to be negative, implying that environmental regulations are not conducive to the performance of firm exports in the short term. The term
Treat is also a dummy variable that equals 1 if the firm participated in the mandatory Cleaner Production Audit programs (treatment group) during the sample period from 2004 to 2012 and equals 0 if the firm never participated in these programs (control group). It captures constant differences between the two groups. The term
X is a vector of firm-level controls including the firm’s total-factor productivity (TFP, which is estimated by the approach of Head and Ries [
61]), capital intensity, age, and size (indicated by the logarithm of total industrial output value), that control for some key characteristics potentially influencing firm exports in the previous literature [
59,
60]. Parameters
and
are the 2-digit industrial and provincial fixed effects, respectively, capturing all time-invariant industrial and provincial specific factors potentially influencing firm exports. The coefficient
is the year fixed effect, controlling all different unobservable common shocks that may affect exports of all firms in different years. The notation
is the error term clustered at the firm level.
As mentioned above in the
Section 3.1 of policy background, we roughly divide the implementation of the mandatory Cleaner Production Audit into two stages. In order to identify differences of the mandatory Cleaner Production Audit implementation in different stages, we split Equation (1) into two equations to examine whether the gradually well-established law and improved enforcement of the mandatory Cleaner Production Audit programs have more significant impact on firm exports. We classify listed firms into two types. Firms participating in the mandatory Cleaner Production Audit programs during the period of 2004–2008 belong to the first type, and firms during 2009–2012 belong to the other. We set up these two equations as follows:
In Equation (2), we exclude firms that participated in the mandatory Cleaner Production Audit programs during the period 2009–2012. Now, the treatment group consists of firms participating in the mandatory Cleaner Production Audit programs during 2004–2008, and samples of the control group consist of firms that never participated in the mandatory Cleaner Production Audit programs, which is the same as estimated before. The dummy variable Audit equals 1 if the firm had participated in the mandatory Cleaner Production Audit programs at year t (including year t) during 2004–2008 and equals 0 otherwise. The dummy variable Treat equals 1 if the firm belongs to the treatment group and equals 0 if the firm belongs to the control group. In the same way, we only keep firms participating in the mandatory Cleaner Production Audit programs during 2009–2012 in the treatment group in Equation (3), while the control group is still the same as before. It can be seen that, coefficients and capture the impact of the mandatory Cleaner Production Audit on firm exports in different stages of the mandatory Cleaner Production Audit implementation, respectively.
3.3.2. Pre-Treatment Assumption
The validity of the DID approach hinges on the common trends assumption, which requires that the trends of exports between treated firms and non-treated firms are similar before the environmental regulation. To check the pre-treatment assumption, we set up a variation of Equation (1) as following equation:
where the dummy variable of
means the treated firm’s
nth lead (when
n < 0) and the
nth lag (when
n > 0). The dummy variable
equals 1 when
n years have passed since the year of a firm’s participation in mandatory Cleaner Production Audit programs; otherwise, it equals 0. It means
n years before firms participate in the mandatory Cleaner Production Audit programs when
n < 0. The lead terms enable us to examine whether the anticipatory effects and pre-existing time trends exist, which violate the assumption of common trends. The lag terms allow us to pick out the post-treatment effects after the initial implementation of the mandatory CPA [
62,
63].
The primary participants of the mandatory Cleaner Production Audit programs were in 2004, and the latest batch participants were in 2012 in our samples. The most years before and after participating in the mandatory Cleaner Production Audit programs are both eight. The number of participants of the mandatory CPA programs has been increasing largely year by year, and the bulk of them is during 2009–2012 as
Section 3.3 shows. In other words,
n is between −8 and 8, and we merge firms whose
n < −5 into
n = −5 and
n > 5 into
n = 5 in order to balance the number of firms in every dummy term in Equation (4). We choose firms whose
n = −5 as the baseline group, and thus the coefficients
are measures for the impact of environmental regulation on firm exports with the gradual implementation of the mandatory CPA programs. We expect coefficients
to not be significantly different from 0 (when
n < 0), implying that there exists no ex-ante divergent trend between listed firms that had not participated in the mandatory CPA programs in the treatment group and firms in the control group. The treatment effects (when
n > 0) are significantly negative to the lagged dummy variable terms.
Figure 3 shows the results of the event study in which the coefficients of the leads are clearly insignificantly different from 0, and confirm the common trend assumption that firms in the treatment group are similar to firms in the control group before participating in the mandatory Cleaner Production Audit programs, and that environmental regulation has no impact on the previous trend of firm exports. Additionally, firm exports have a significant downward trend after the implementation of the mandatory CPA programs and coefficients of the lags are significantly negative except the second-period lag term in the 90% level confidence interval. The results of the post-treatment test provide compelling evidence that the mandatory CPA affects the performance of firm exports negatively. From what is mentioned above, we define the time of being regulated as the year when the firm passed the acceptance inspections, and most firms probably had completed the mandatory CPA projects by this time. Therefore, it is not odd that firm exports decline dramatically during the year of being regulated.
4. Empirical Results and Discussions
4.1. Baseline Results
We now can assess the impact of the unique environmental regulatory policy called mandatory Cleaner Production Audit (CPA) on firm exports, by using the DID approach on the basis of verifying that the assumption of common trends holds. The empirical results from Equation (1) are in columns (1) and (2) of
Table 3. The coefficients of interest on the
Audit variable are significantly negative at the 5% level, indicating that the mandatory Cleaner Production Audit programs impair firm exports in our sample period, and the export values of firms subject to the mandatory Cleaner Production Audit are lower than those of non-regulated firms about 8.2% on average after controlling for the year, industry, and province effects. Our DID estimation results show that firms participating in the mandatory Cleaner Production Audit programs tend to export less, which is consistent with Hypothesis 1a and the Pollution Haven Effect, showing that firm exports are negatively affected by environmental regulations; and this result is also same as the findings of some existing related literature, such as Hering and Poncet [
16], Shi and Xu [
17], Cherniwchan and Najjar [
18], and Zhang et al. [
19]. A possible explanation for this phenomenon is that firms subject to the mandatory Cleaner Production Audit are forced to cut their production and export activities, owing to increased compliance costs such as the labor input and equipment investment for pollution control [
16].
The estimation results of Equations (2) and (3) are in columns (3) and (4) of
Table 3. In column (3), the coefficient of the
Audit variable is insignificantly negative, indicating that the enforcement of the mandatory Cleaner Production Audit is relatively weak in the absence of uniform criteria and acceptance inspections for audit results in the early stage of 2005–2008, and environmental regulations have little effect on firm exports. In column (4), we estimate the coefficient of interest in the stage of 2009–2012, which is negative and significant at the 1% level, and its value decreases from −0.08 in the full sample period to −0.11, indicating that the impact of environmental regulations on firm exports is larger and more significant since the substantial improvements on the mandatory Cleaner Production Audit process after 2008. All these findings suggest that the establishment of a comprehensive framework and concrete standards and procedures are important for the mandatory Cleaner Production Audit implementation. All in all, the mandatory Cleaner Production Audit has little or no impact on firm exports in the early stage with relatively lax regulations. By contrast, the impact is large and significant in the later stage of the mandatory Cleaner Production Audit implementation. All these findings indicate that a comprehensive implementation framework and strong enforcement of environmental regulations are important and necessary.
4.2. Robustness Checks
To test the stability of the baseline results, we next conduct a series of robustness checks, including the falsification test excluding anticipatory effect of pre-treatment trends, the multiple propensity score matching approaches avoiding estimation bias of single matching method, and the Heckit model dealing with self-selection bias.
4.2.1. Falsification Tests
To verify whether the mandatory Cleaner Production Audit participants started to conduct some Cleaner Production projects to circumvent regulations that led to systematic differences with non-participants, a falsification test is performed. We drop firms that had participated in the mandatory CPA programs, and so the remaining samples consist of listed firms that had not participated in the mandatory CPA programs in the treatment group and those non-participants in the control group. We artificially advance the implementation time of the mandatory CPA by several years as the hypothetical implementation year to carry out the placebo experiment. If the year
t of the listed firm is after the hypothetical implementation year, then the dummy variable
equals 1 and otherwise 0. The regression equation is:
where the statistical significance of coefficient
suggests that there should be a significant difference between the treatment group and the control group before the implementation of the mandatory Cleaner Production Audit, such that the validity of the difference-in-differences (DID) approach will be impaired.
We test 2, 3, and 4 years earlier than the actual mandatory Cleaner Production Audit implementation year, and the falsification estimation results are in
Table 4. We learn that all coefficients for the hypothetical mandatory CPA indicator,
False-Audit, are insignificant at the 10% level, which exclude the existence of the anticipatory effect for listed firms before participating in the mandatory CPA programs. This finding confirms that the selection of participants of the mandatory CPA programs is independent of firm exports after PSM, such that validity of the DID approach holds.
4.2.2. Multiple PSM Approaches
We then conduct the multiple propensity score matching (PSM) approaches to avoid the single matching method biasing our estimations. Specifically, we perform multiple PSM approaches including 1 to 3 and 1 to 5 nearest-neighbor matching methods, to make sure our estimation results are robust and convincing like beforehand. The empirical estimation results under other PSM approaches are reported in
Table 5, which are consistent with the baseline results beforehand. Thus, the way to conduct the multiple PSM approaches makes no big difference, and our baseline results are robust.
4.2.3. Heckit Model
Because not all firms export, there may be a self-selection effect that biases the OLS estimation. Therefore, we set up the regression equations in terms of the Heckit model, including two steps to avoid the self-selection bias, and investigate channels through which the environmental regulations affect firm exports. The first step of the Heckit model accounts for the firm propensity to export, and the second step accounts for the volume of a firm’s export if this firm chooses to export. The two equations are:
The setting of these two equations is similar to the basic equations. The dummy dependent variable
in Equation (6) equals 1 if the firm exported at year
t and equals 0 otherwise; and
is a vector of control variables that affect a firm’s export decision-making, including
in Equation (7) and firm location (indicated by
Location), which makes the Heckit model estimates identified more robustly. The dummy variable
Location equals 1 if the firm is located in the eastern region of China and equals 0 otherwise. Firms located in the eastern region can get access to export opportunities easier, because of information sharing through international opportunities, more advanced facilities, and better service for firm exports, whereas export intensity relies more on firm-specific technological and productive capacity [
17,
60].
From the estimation results in columns (1) and (2) of
Table 6, we see that the coefficients of interest are both insignificantly negative, indicating that the environmental regulatory policy called mandatory CPA hinders firm exports by preventing them from entering foreign markets and decreasing their export value once they enter foreign markets. These results are also in line with the baseline estimation results beforehand and strengthen the robustness of the preceding conclusions.
The estimation results in columns (3) and (4) show that environmental regulations negatively affect a firm’s propensity to export. The implementation effectiveness of the mandatory CPA comes into being remarkably after 2008, such that the estimation results in columns (5) and (6) provide us with more compelling evidence to evaluate the impact of environmental regulations on firm exports. The coefficients of interest, which are negative insignificantly in column (5) and negative significantly in column (6), present the fact that the negative impact of the mandatory CPA on firm exports is mainly driven by the decline in a firm’s export value. According to Melitz [
43], non-exporters have to pay a fixed cost to gain access to foreign markets. Environmental regulations may not increase the fixed cost (that is necessary to enter the foreign markets), but do reduce the volume of exports by raising production and operation costs.
4.3. Heterogeneous Effects
In addition to the average effects of the mandatory Cleaner Production Audit on firm exports, this research further investigates impacts of environmental regulations on different types of firms. Three firm characteristics stand out: firm ownership, firm location, and firm size. We find the effects in different types of firms are heterogeneous.
4.3.1. Heterogeneity on Firm Ownership
There is a general consensus that state-owned firms are systematically different from firms with other ownership types in China. State-owned enterprises (SOEs) have remarkable legal and financial advantages over other ownership types due to China’s unique institutional landscape described as a political pecking order [
60,
64]. Local officials’ promotion is closely related to the performance of state-owned enterprises, and so they have strong motivation to protect state-owned enterprises from environmental regulations, which may be harmful to their production and operation activities. Lax enforcement of laws and policies and administrative intervention give SOEs a certain privilege to escape from more stringent environmental regulations [
17,
65]. The generally existing fact is private firms have more credit constraints than SOEs. With better access to finance [
19], SOEs are able to more easily get financial support from credit institutions and local governments to offset the environmental regulation costs. As Hering and Poncet [
16] concluded, SOEs may not be affected by environmental regulations due to reduced obligations to comply with regulations and better access to finance.
To examine whether SOEs are privileged relative to other firms in obeying environmental regulations, we set up the following regression equation:
where the dummy variable
SOE equals 1 if the firm is a state-owned enterprise and equals 0 otherwise. All other effects are controlled like in Equation (1). As discussed above, state-owned enterprises are less sensitive to the environmental regulation, due to their privileged status relative to other ownership firms [
16,
17,
65]. Therefore, the sum of coefficients
and
capturing the impacts of the mandatory Cleaner Production Audit on firm exports by SOEs is expected to be statistically insignificant.
The estimation results from Equation (8) are reported in
Table 7. Column (1) represents the estimation result for the whole stage of implementation of the mandatory Cleaner Production Audit. Columns (2) and (3) represent the results for the early and later stages, respectively. The bottom of the table reports that the
p-value from the test of the sum of coefficients
and
is 0; in other words, the test based on the hypothesis that the mandatory CPA has nearly no effect on SOEs. The null hypothesis cannot be rejected due to the p-value, which verifies our argument about SOEs above.
4.3.2. Heterogeneity on Firm Location
During the concrete implementation process of the mandatory CPA programs, local governments are in charge of the selection and confirmation of firms that shall conduct the mandatory CPA projects and organize the assessment and acceptance inspections for these firms. Hence, policy enforcement, detailed implementation procedures, and the assessment and acceptance inspections standards vary across regions. Generally, China’s eastern region is more developed than its central and western regions in economy and society, and the pollution in the eastern region is more severe. Thus, the implementation of the environmental regulation could be stricter [
17,
52]. In view of this situation, we divide all of China’s provinces into two areas: Beijing, Tianjin, Hebei, Shanghai, Jiangsu, Zhejiang, Shandong, Liaoning, Fujian, Guangdong, and Hainan belong to the eastern area, and the remaining provinces and municipalities belong to the other area.
Similar to the heterogeneity analysis on firm ownership, we set up the following regression equation to discuss the heterogeneous effect for firm location:
Table 8 reports the estimation results of Equation (9), where column (1) is for the whole stage of 2004–2012, and column (2) and (3) are for the early and later stages, respectively. The coefficients
are significantly negative for the whole and later stages, which indicate that the implementation of the mandatory Cleaner Production Audit programs has a much larger negative effect on exports of firms located in the eastern region relative to other regions of China. The p-value at the bottom of the table also shows that the mandatory Cleaner Production Audit programs have a significantly negative impact on firm exports in the eastern region. Our estimation results are in accordance with those in Hering and Poncet [
16] and Shi and Xu [
17] for the impact of environmental regulations on different firm ownerships and regions.
4.3.3. Heterogeneity on Firm Size
For firms of different sizes, there are obviously differences in economies of scale about resource utilization, corporate governance, and equipment investment, in accordance with more stringent environmental regulations. Hence, the costs are heterogeneous for firms of different sizes in their compliance with stringent environmental regulations [
23]. Generally, the implementation of mandatory Cleaner Production Audits programs, will result in a smaller increase of average production costs for larger firms, and a larger increase of average production costs for smaller firms [
19,
26]. Thus, the stringent environmental regulations may significantly reduce the exports of smaller firms, while having no significant effect on the exports of larger firms. In view of this situation, we divide the sample firms into two categories, according to the median of sample firms’ total fixed assets. Specifically, firms above the median are classified as large-size firms, while firms below the median are classified as small-size firms.
To examine whether the costs of complying with environmental regulations are heterogeneous for firms of different sizes, we set up the following regression equation:
The estimation results from Equation (10) are reported in
Table 9. Column (1) represents the result for the whole stage of implementation of the mandatory Cleaner Production Audit. Columns (2) and (3) represent the results for the early and later stages, respectively. The coefficients
are significantly negative for the whole and later stages, which indicate that the implementation of the mandatory CPA programs has a much larger negative effect on exports of small-size firms relative to large-size firms. However, the bottom of the table reports that the
p-value from the test of the sum of coefficients
and
is 0; in other words, the test based on the hypothesis that the mandatory CPA has nearly no effect on large-size firms. The null hypothesis cannot be rejected due to the
p-value, which verifies our argument about large-size firms above.
4.4. Mechanism Analyses
The baseline results show that firms participating in the mandatory CPA programs tend to export less, which is consistent with the pollution haven effect. According to the theoretical analysis and research hypothesis in
Section 2.2, we further explore the potential mechanisms through which the mandatory CPA affects firm exports.
4.4.1. Mechanism by Compliance Costs
Environmental regulations generally require labor input and polluting facilities to undertake abatement activities, and may impose compliance costs on businesses. Thus, environmental regulatory differences across firms, sectors, or jurisdictions can cause changes in relative production costs. According to the theoretical analysis of compliance costs effect in
Section 2.2, firms participating in the mandatory Cleaner Production Audit programs tend to use the following three methods to comply with the cleaner production standards. First, inputting more labor for end-of-pipe governance to meet the emission standards, which is manifested in an increase in the firms’ total wage expenditure. Second, purchasing production equipment meeting discharge standards to reduce pollution emissions during the production process, which is mainly reflected in an increase in the firms’ total fixed assets investment. Third, increasing the operating frequency of pollution control equipment to reduce pollution emissions, which is manifested in the acceleration of equipment wastage and an increase in the depreciation of firms’ fixed assets.
Table 10 reports the estimation results of the compliance costs effect through which the mandatory Cleaner Production Audit affects firm exports, by using the DID approach on the basis of verifying that the assumption of common trends holds, where column (1) is for firms’ total wage expenditure, and columns (2) and (3) are for firms’ total fixed assets and depreciation of firms’ fixed assets, respectively. All of the coefficients of interest on the
Audit variable are significantly positive at the 5% level, fully indicating that the implementation of mandatory Cleaner Production Audit programs impair firm exports, through increasing the firms’ total wage expenditure, total fixed assets investment, and depreciation of firms’ fixed assets in our sample period. The aforementioned results show that the compliance costs effect is indeed an important mechanism through which the mandatory Cleaner Production Audit negatively affects firm exports.
4.4.2. Mechanism by Innovation Offsets
Environmental regulations may also alter firms’ decisions concerning the volume, type, or timing of their investments, whether in adopting cleaner technologies through plant refurbishment or replacement or in the development of innovative production technologies or products [
23]. According to the theoretical analysis of innovation offsets effect in
Section 2.2, the mandatory Cleaner Production Audit programs can thus affect firms’ long-term competitiveness through providing proper incentives for technological innovations. From an economic perspective, it is critical for environmental regulations to provide incentives for technological change because new technologies may substantially reduce the long-run cost of abatement [
25]. From a political perspective, such policy-induced innovation may also improve the acceptability of environmental policies. Indeed, in the knowledge-based economy, firms’ competitiveness depends largely on innovation, which is considered to be a key component of firms’ productivity growth [
26].
The estimation results of the innovation offsets effect through which the mandatory Cleaner Production Audit affects firm exports are reported in
Table 11, where we use the annual number of patent applications extracted from the Chinese Patent database to measure a firm’s technological innovations, and use total factor productivity estimated by the approach of Head and Ries [
61] to measure a firm’s productivity. Column (1) and (2) represent the result for firms’ all patent applications and invention and utility patent applications, respectively. Both of the coefficients for the
Audit variable are significantly positive at the 5% level, indicating that on average, mandatory Cleaner Production Audit participation stimulates technological innovations. More specifically, these coefficients suggest that mandatory CPA participation can raise a firm’s all patent applications by 16.3%, and this effect increases slightly to 18.0% for invention and utility patent applications. Column (3) represents the result for firms’ total factor productivity, where the coefficient for the
Audit variable is significantly positive at the 1% level, indicating that on average the mandatory CPA participation can promote productivity growth.
4.4.3. Mechanism Discussions
To summarize, the aforementioned results in
Section 4.4.2 show that there is strong evidence that the mandatory Cleaner Production Audit programs induce innovation activity in cleaner technologies and promote productivity growth. Consistent with the innovation offsets effect, by lowering firms’ marginal production costs (and hence product prices in competitive markets), increased productivity can enhance the competitiveness of firms that operate in international markets, thus boosting exports and market share. Such being the case, why does the baseline estimation result show that the mandatory Cleaner Production Audit negatively affects the firm exports?
The reasons may be that, on the one hand, in
Section 4.4.1 we find that the compliance costs effect is indeed an important mechanism through which the mandatory Cleaner Production Audit negatively affects firm exports; on the other hand, the final influencing effect of environmental regulations on firm exports, depends on whether innovation induced by environmental regulations can more than fully offset the costs of complying with them and enhance firms’ competitiveness [
23]. In our article, there are indeed both the compliance costs and innovation offsets effects, for the impact of environmental regulation on firm exports; however, the mandatory Cleaner Production Audit programs negatively affect the firm exports from China. This fully reflects that thus far the benefits from the innovation offsets effect do not appear to be large enough to outweigh the compliance costs effect for the regulated entities. Of course, this does not preclude the ability of environmental regulations to foster the development of global leaders in technological innovations, but it does suggest that the evidence for the most controversial interpretation of the Porter hypothesis (or the innovation offsets effect) is lacking.
5. Conclusions
Exporters often take an outsized role in popular debates over the effects of environmental regulation due to concerns over how these policies affect the ability of domestic firms to compete globally. However, there is surprisingly little evidence of how environmental regulations affect individual exporters, although there is a large existing literature studying the effects of environmental regulations on aggregate trade flows. In this article, we investigate the individual exporting decisions and potential mechanisms in response to the mandatory Cleaner Production Audit, a unique environmental regulatory policy in China. Specifically, we use the mandatory Cleaner Production Audit policy as a quasi-natural experiment to deal with the potential endogeneity issue associated with the environmental regulation, and combine the propensity score matching and difference-in-differences approaches to identify the causal effect of the mandatory CPA programs on firm exports, by using matched firm-level data of China.
We obtain several novel findings about the mandatory Cleaner Production Audit programs effects on firm-level exporting performance. The baseline results show that the mandatory Cleaner Production Audit programs hence stifle firm export growth during the data period, which is consistent with the pollution haven effect, and this stifling effect is stronger and more significant after the implementation of the mandatory Cleaner Production Audit was substantially improved in the later stage after 2008, which suggests that the establishment of a comprehensive framework and concrete standards and procedures are important for the mandatory Cleaner Production Audit implementation. This result is robust against a series of robustness checks, including the falsification test excluding the existence of anticipatory effect of pre-treatment trends, the multiple propensity score matching approaches avoiding estimation bias of single matching method, and the Heckit model dealing with self-selection bias.
Moreover, the impact of the mandatory Cleaner Production Audit programs is not homogeneous on different types of firms, especially in terms of firm ownership, firm size, and in what region the firms are located. Specifically, state-owned firms are less affected by the stricter environmental regulations, compared with firms under other ownerships, reflecting the existence of the political pecking order of Chinese firms. The negative impact on firms located in the eastern region of China is stronger due to stricter environmental regulations spawned by a more developed economy and society. The mandatory CPA programs significantly reduce the exports of smaller firms, while having no significant effect on the exports of larger firms. Furthermore, the mechanism discussions show that there are both the compliance costs effect and the innovation offsets effect, but the benefits from the innovation offsets effect do not appear to be large enough to outweigh the compliance costs effect for the regulated firms.
Our results shed light on some profound policy implications. Firstly, in developing countries like China, governments nowadays are investing large amounts of resources to reduce the increasingly severe pollution, and environmental policy is beneficial in many ways, in terms of the economy and public health, but our study finds a negative effect of stringent environmental regulation on firm exports for a short time, especially for the private firms and small-size firms located in the eastern region of China. Policymakers therefore need to take some measures to alleviate the negative impact on firm exports in future policy making, for example, giving appropriate subsidies for the affected firms to purchase pollution control devices and update pollution abatement technologies, and providing some preferential measures for trade in intermediate goods. As a result, our findings are helpful for the construction of an accurate policy package to alleviate the negative impacts of stricter pollution controls on firm export values.
Secondly, the impact of environmental policy appears to be mitigated by state ownership, suggesting that the analysis at the ownership level further uncovers a potential obstacle to the effectiveness of environmental policy, which is important for China as it endeavors to improve environmental quality. It is thus very important to address the gap between state and non-state firms, even if more work is needed to understand what is behind this effect. Thirdly, it will be interesting to investigate whether individual exporters eventually exited the export market or bounced back after adapting to the environmental regulation, as such long-term effects have important implications for evaluating current policy and future policy making. This is a potential topic for future research when the relevant data are available. Last but not least, the establishment of a comprehensive framework and concrete standards and procedures are important for the effective implementation of environmental policy.
Author Contributions
Conceptualization, L.Z.; methodology, Y.L. and J.-L.H.; software, L.Z. and T.L.; validation, Y.L. and J.-L.H.; formal analysis, L.Z., T.L. and S.L.; investigation, Y.L. and T.L.; resources, L.Z. and T.L.; data curation, L.Z. and S.L.; writing—original draft preparation, L.Z., Y.L., T.L., S.L. and J.-L.H.; writing—review and editing, J.-L.H.; visualization, L.Z., S.L.; supervision, Y.L. and J.-L.H.; project administration, Y.L. and T.L.; funding acquisition, L.Z. and J.-L.H. All authors have read and agreed to the published version of the manuscript.
Funding
This research was supported by the National Social Science Foundation of China, granted to L.Z. with No. 16CJY009. The APC was funded by MDPI discount vouchers issued to J.-L.H.
Institutional Review Board Statement
Not applicable.
Informed Consent Statement
Not applicable.
Data Availability Statement
All of the data presented in this article can be made available upon reasonable request from the corresponding author. The raw datasets for this article are not publicly available due to a conditional request from the source.
Acknowledgments
The authors are grateful to three anonymous referees and an academic editor of this journal for their valuable suggestions.
Conflicts of Interest
The authors declare no conflict of interest.
References
- Ebenstein, A.; Fan, M.; Greenstone, M.; He, G.; Zhou, M. New evidence on the impact of sustained exposure to air pollution on life expectancy from China’s Huai River Policy. Proc. Natl. Acad. Sci. USA 2017, 114, 10384–10389. [Google Scholar] [CrossRef] [PubMed] [Green Version]
- Bombardini, M.; Li, B. Trade, pollution and mortality in China. J. Int. Econ. 2020, 125, 1–36. [Google Scholar] [CrossRef] [Green Version]
- Fu, S.; Viard, V.B.; Zhang, P. Air pollution and manufacturing firm productivity: Nationwide estimates for China. Econ. J. 2021, 131, 3141–3273. [Google Scholar] [CrossRef]
- Copeland, B.R.; Taylor, M.S. Trade, growth, and the environment. J. Econ. Lit. 2004, 42, 7–71. [Google Scholar] [CrossRef]
- Ederington, J.; Minier, J. Is environmental policy a secondary trade barrier? An empirical analysis. Can. J. Econ. 2003, 36, 137–154. [Google Scholar] [CrossRef]
- Cole, M.A.; Elliott, R.J.; Zhang, L. Foreign direct investment and the environment. Annu. Rev. Environ. Resour. 2017, 42, 465–487. [Google Scholar] [CrossRef] [Green Version]
- Copeland, B.R.; Shapiro, J.S.; Taylor, M.S. Globalization and the Environment; Working Papers No. 28797; National Bureau of Economic Research: Cambridge, MA, USA, 2021. [Google Scholar]
- Eskeland, G.S.; Harrison, A.E. Moving to greener pastures? Multinationals and the pollution haven hypothesis. J. Dev. Econ. 2003, 70, 1–23. [Google Scholar] [CrossRef] [Green Version]
- Broner, F.; Bustos, P.; Carvalho, V.M. Sources of Comparative Advantage in Polluting Industries; Working Papers No. 18337; National Bureau of Economic Research: Cambridge, MA, USA, 2012. [Google Scholar]
- Kocha, N.; Mama, H.B. Does the EU Emissions Trading System induce investment leakage? Evidence from German multinational firms. Energy Econ. 2019, 81, 479–492. [Google Scholar] [CrossRef]
- Verde, S.F. The impact of the EU emissions trading system on competitiveness and carbon leakage: The econometric evidence. J. Econ. Surv. 2020, 34, 320–343. [Google Scholar] [CrossRef]
- Levinson, A.; Taylor, M.S. Unmasking the pollution haven effect. Int. Econ. Rev. 2008, 49, 223–254. [Google Scholar] [CrossRef] [Green Version]
- Kellenberg, D.K. An empirical investigation of the pollution haven effect with strategic environment and trade policy. J. Int. Econ. 2009, 78, 242–255. [Google Scholar] [CrossRef]
- Cai, X.; Lu, Y.; Wu, M. Does environmental regulation drive away inbound foreign direct investment? evidence from a quasi-natural experiment in China. J. Dev. Econ. 2016, 123, 73–85. [Google Scholar] [CrossRef]
- Hanna, R. US environmental regulation and FDI: Evidence from a panel of us-based multinational firms. Am. Econ. J. Appl. Econ. 2010, 2, 158–189. [Google Scholar] [CrossRef] [Green Version]
- Hering, L.; Poncet, S. Environmental policy and exports: Evidence from Chinese cities. J. Environ. Econ. Manag. 2014, 68, 296–318. [Google Scholar] [CrossRef]
- Shi, X.; Xu, Z. Environmental regulation and firm exports: Evidence from the Eleventh Five-Year Plan in China. J. Environ. Econ. Manag. 2018, 89, 187–200. [Google Scholar] [CrossRef]
- Cherniwchan, J.; Najjar, N. Do environmental regulations affect the decision to export? Am. Econ. J. Econ. Policy 2021. forthcoming (online preview). Available online: https://www.aeaweb.org/articles?id=10.1257/pol.20200290 (accessed on 2 December 2021).
- Zhang, Y.; Cui, J.; Lu, C. Does environmental regulation affect firm exports? Evidence from wastewater discharge standard in China. China Econ. Rev. 2020, 61, 101451. [Google Scholar] [CrossRef]
- Berry, H.; Kaul, A.; Lee, N. Follow the smoke: The pollution haven effect on global sourcing. Strateg. Manag. J. 2021, 42, 2420–2450. [Google Scholar] [CrossRef]
- Palmer, K.; Oates, W.E.; Portney, P.R. Tightening environmental standards: The benefit-cost or the no-cost paradigm? J. Econ. Perspect. 1995, 9, 119–132. [Google Scholar] [CrossRef]
- Ambec, S.; Cohen, M.; Elgie, S.; Lanoie, P. The Porter hypothesis at 20: Can environmental regulation enhance innovation and competitiveness? Rev. Environ. Econ. Policy 2013, 7, 2–22. [Google Scholar] [CrossRef] [Green Version]
- Dechezlepretre, A.; Sato, M. The impacts of environmental regulations on competitiveness. Rev. Environ. Econ. Policy 2017, 11, 183–206. [Google Scholar] [CrossRef] [Green Version]
- Porter, M.E.; van der Linde, C. Toward a new conception of the environment–competitiveness relationship. J. Econ. Perspect. 1995, 9, 97–118. [Google Scholar] [CrossRef] [Green Version]
- Greenstone, M.; List, J.A.; Syverson, C. The Effects of Environmental Regulation on the Competitiveness of U.S. Manufacturing; Working Papers No.18392; National Bureau of Economic Research: Cambridge, MA, USA, 2012. [Google Scholar]
- Albrizio, S.; Kozluk, T.; Zipperer, V. Environmental policies and productivity growth: Evidence across industries and firms. J. Environ. Econ. Manag. 2017, 81, 209–226. [Google Scholar] [CrossRef]
- Holladay, J.S. Exporters and the environment. Can. J. Econ. 2016, 49, 147–172. [Google Scholar] [CrossRef]
- Cherniwchan, J.; Copeland, B.R.; Taylor, M.S. Trade and the environment: New methods, measurements and results. Annu. Rev. Econ. 2017, 9, 59–85. [Google Scholar] [CrossRef] [Green Version]
- Cherniwchan, J. Trade liberalization and the environment: Evidence from NAFTA and US manufacturing. J. Int. Econ. 2017, 105, 130–149. [Google Scholar] [CrossRef]
- Forslid, R.; Okubo, T.; Ulltveit-Moe, K.H. Why Are firms that export cleaner? International trade, abatement and environmental emissions. J. Environ. Econ. Manag. 2018, 91, 166–183. [Google Scholar] [CrossRef] [Green Version]
- Shapiro, J.S. The environmental bias of trade policy. Q. J. Econ. 2021, 136, 831–886. [Google Scholar] [CrossRef]
- Aldy, J.E.; Pizer, W.A. The competitiveness impacts of climate change mitigation policies. J. Assoc. Environ. Resour. Econ. 2015, 2, 565–595. [Google Scholar] [CrossRef]
- Sato, M.; Dechezlepretre, A. Asymmetric industrial energy prices and international trade. Energy Econ. 2015, 52, 130–141. [Google Scholar] [CrossRef] [Green Version]
- Branger, F.; Quirion, P.; Chevallier, J. Carbon leakage and competitiveness of cement and steel industries under the EU ETS: Much ado about nothing. Energy J. 2016, 37, 109–135. [Google Scholar] [CrossRef] [Green Version]
- List, J.A.; McHone, W.W.; Millimet, D.L. Effects of environmental regulation on foreign and domestic plant births: Is there a home field advantage? J. Urban Econ. 2004, 56, 303–326. [Google Scholar] [CrossRef] [Green Version]
- Dean, J.M.; Lovely, M.E.; Wang, H. Are foreign investors attracted to weak environmental regulations? Evaluating the evidence from China. J. Dev. Econ. 2009, 90, 1–13. [Google Scholar] [CrossRef] [Green Version]
- Millimet, D.L.; Roy, J. Empirical tests of the pollution haven hypothesis when environmental regulation is endogenous. J. Appl. Econ. 2016, 31, 652–677. [Google Scholar] [CrossRef]
- Jeppesen, T.; List, J.A.; Folmer, H. Environmental regulations and new plant location decisions: Evidence from a meta-analysis. J. Reg. Sci. 2002, 42, 19–49. [Google Scholar] [CrossRef] [Green Version]
- Manderson, E.; Kneller, R. Environmental regulations, outward FDI and heterogeneous firms: Are countries used as pollution havens? Environ. Resour. Econ. 2012, 51, 317–352. [Google Scholar] [CrossRef] [Green Version]
- Hafstead, M.A.C.; Williams RC, I. Unemployment and environmental regulation in general equilibrium. J. Public Econ. 2018, 160, 50–65. [Google Scholar] [CrossRef] [Green Version]
- Chen, H.; Xu, Y. Environmental regulation and exports: Evidence from the comprehensive air pollution policy in China. Int. J. Environ. Res. Public Health 2021, 18, 1316. [Google Scholar] [CrossRef]
- Melitz, M.J.; Redding, S.J. Heterogeneous firms and trade. In Handbook of International Economics; Gopinath, G., Helpman, E., Rogoff, K., Eds.; Elsevier: Amsterdam, The Netherlands, 2014; Chapter 1; Volume 4, pp. 1–54. [Google Scholar]
- Melitz, M.J. The Impact of Trade on Intra-industry Reallocations and Aggregate Industry Productivity. Econometrica 2003, 71, 1695–1725. [Google Scholar] [CrossRef] [Green Version]
- Mohr, R.D. Technical change, external economies, and the porter hypothesis. J. Environ. Econ. Manag. 2002, 43, 158–168. [Google Scholar] [CrossRef]
- Shi, L.; Liu, J.; Wang, Y.; Chiu, A. Cleaner Production Progress in Developing and Transition Countries. J. Clean. Prod. 2021, 278, 1–7. [Google Scholar] [CrossRef]
- Hicks, C.; Dietmar, R. Improving Cleaner Production through the Application of Environmental Management Tools in China. J. Clean. Prod. 2007, 15, 395–408. [Google Scholar] [CrossRef]
- Bai, Y.; Yin, J.; Yuan, Y. An Innovative System for Promoting Cleaner Production: Mandatory Cleaner Production Audits in China. J. Clean. Prod. 2015, 108, 883–890. [Google Scholar] [CrossRef]
- Zameer, H.; Wang, Y.; Yasmeen, H. Reinforcing Green Competitive Advantage through Green Production, Creativity and Green Image: Implications for Cleaner Production in China. J. Clean. Prod. 2020, 247, 119–129. [Google Scholar] [CrossRef]
- Chang, I.; Wu, J.; Qiao, H.; Zhang, Z. The Spatio-temporal Approach to Regional Analysis on Cleaner Production in China. Renew. Sustain. Energy Rev. 2015, 52, 1491–1503. [Google Scholar] [CrossRef]
- Standing Committee of the National People’s Congress (SCNPC). Cleaner Production Promotion Law of the People’s Republic of China. China, 2002. Available online: https://jjjcz.mee.gov.cn/djfg/gjflfg/fl/200206/t20020601_444283.html (accessed on 14 July 2020).
- Standing Committee of the National People’s Congress (SCNPC). Cleaner Production Promotion Law of the People’s Republic of China (Amended). China, 2012. Available online: https://jjjcz.mee.gov.cn/djfg/gjflfg/fl/201202/t20120201_444442.html (accessed on 14 July 2020).
- Tang, R. Environmental Regulation and Firm Innovation: Evidence from China; Working Paper; Department of Economics, University of Alberta: Edmonton, AB, Canada, 2015; Available online: https://sites.ualberta.ca/~econphd/Ruotao_Tang_JMP.pdf (accessed on 10 August 2020).
- Ministry of Environmental Protection (MEP). The Administrative Procedures for Conducting Cleaner Production Audit in Key Enterprises (in Chinese), China, 2005. Available online: https://www.mee.gov.cn/gkml/zj/wj/200910/t20091022_172368.htm (accessed on 16 July 2020).
- Ministry of Environmental Protection (MEP). The Administrative Procedures for Evaluation and Acceptance of Cleaner Production Audit in Key Enterprises, China, 2008. Available online: http://www.gov.cn/govweb/gongbao/content/2009/content_1205388.htm (accessed on 16 July 2020).
- National Developmental and Reform Commission; Ministry of Environmental Protection (MEP). The Interim Measures on Cleaner Production Audit (Command 16), China, 2004. Available online: http://www.gov.cn/gongbao/content/2005/content_64351.htm (accessed on 16 July 2020).
- Brandt, L.; Biesebroeck, J.V.; Zhang, Y. Creative Accounting or Creative Destruction? Firm-level Productivity Growth in Chinese Manufacturing. J. Dev. Econ. 2012, 97, 339–351. [Google Scholar] [CrossRef] [Green Version]
- Rosenbaum, P.R.; Rubin, D.B. The Central Role of the Propensity Score in Observational Studies for Causal Effects. Biometrika 1983, 70, 41–55. [Google Scholar] [CrossRef]
- Heyman, F.; Sjöholm, F.; Tingvall, P.G. Is There Really a Foreign Ownership Wage Premium? Evidence from Matched Employer–employee Data. J. Int. Econ. 2007, 73, 355–376. [Google Scholar] [CrossRef] [Green Version]
- Feenstra, R.C.; Li, Z.; Yu, M. Exports and Credit Constraints Under Incomplete Information: Theory and Evidence from China. Rev. Econ. Stat. 2014, 96, 729–744. [Google Scholar] [CrossRef]
- Fan, H.; Lai, E.; Qi, S. Trade Liberalization and Firms’ Export Performance in China: Theory and Evidence. J. Comp. Econ. 2019, 47, 640–668. [Google Scholar] [CrossRef]
- Head, K.; Ries, J. Heterogeneity and the FDI versus Export Decision of Japanese Manufacturers. J. Jpn. Int. Econ. 2003, 17, 448–467. [Google Scholar] [CrossRef] [Green Version]
- Beck, T.; Levine, R.; Levkov, A. Big Bad Banks? The Winners and Losers from Bank Deregulation in the United States. J. Financ. 2010, 5, 1637–1668. [Google Scholar] [CrossRef] [Green Version]
- Xu, M. Riding on the New Silk Road: Quantifying the Welfare Gains from High-Speed Railways; Working Paper; Institute of New Structural Economics at Peking University: Peking, China, 2017. [Google Scholar]
- Huang, Y. One Country, Two Systems: Foreign-invested Enterprises and Domestic Firms in China. China Econ. Rev. 2008, 14, 404–416. [Google Scholar] [CrossRef]
- Bao, Q.; Shao, M.; Yang, D. Environmental Regulation, Local Legislation and Pollution Control in China. Environ. Dev. Econ. 2021, 5, 1–19. [Google Scholar] [CrossRef]
| Publisher’s Note: MDPI stays neutral with regard to jurisdictional claims in published maps and institutional affiliations. |
© 2022 by the authors. Licensee MDPI, Basel, Switzerland. This article is an open access article distributed under the terms and conditions of the Creative Commons Attribution (CC BY) license (https://creativecommons.org/licenses/by/4.0/).


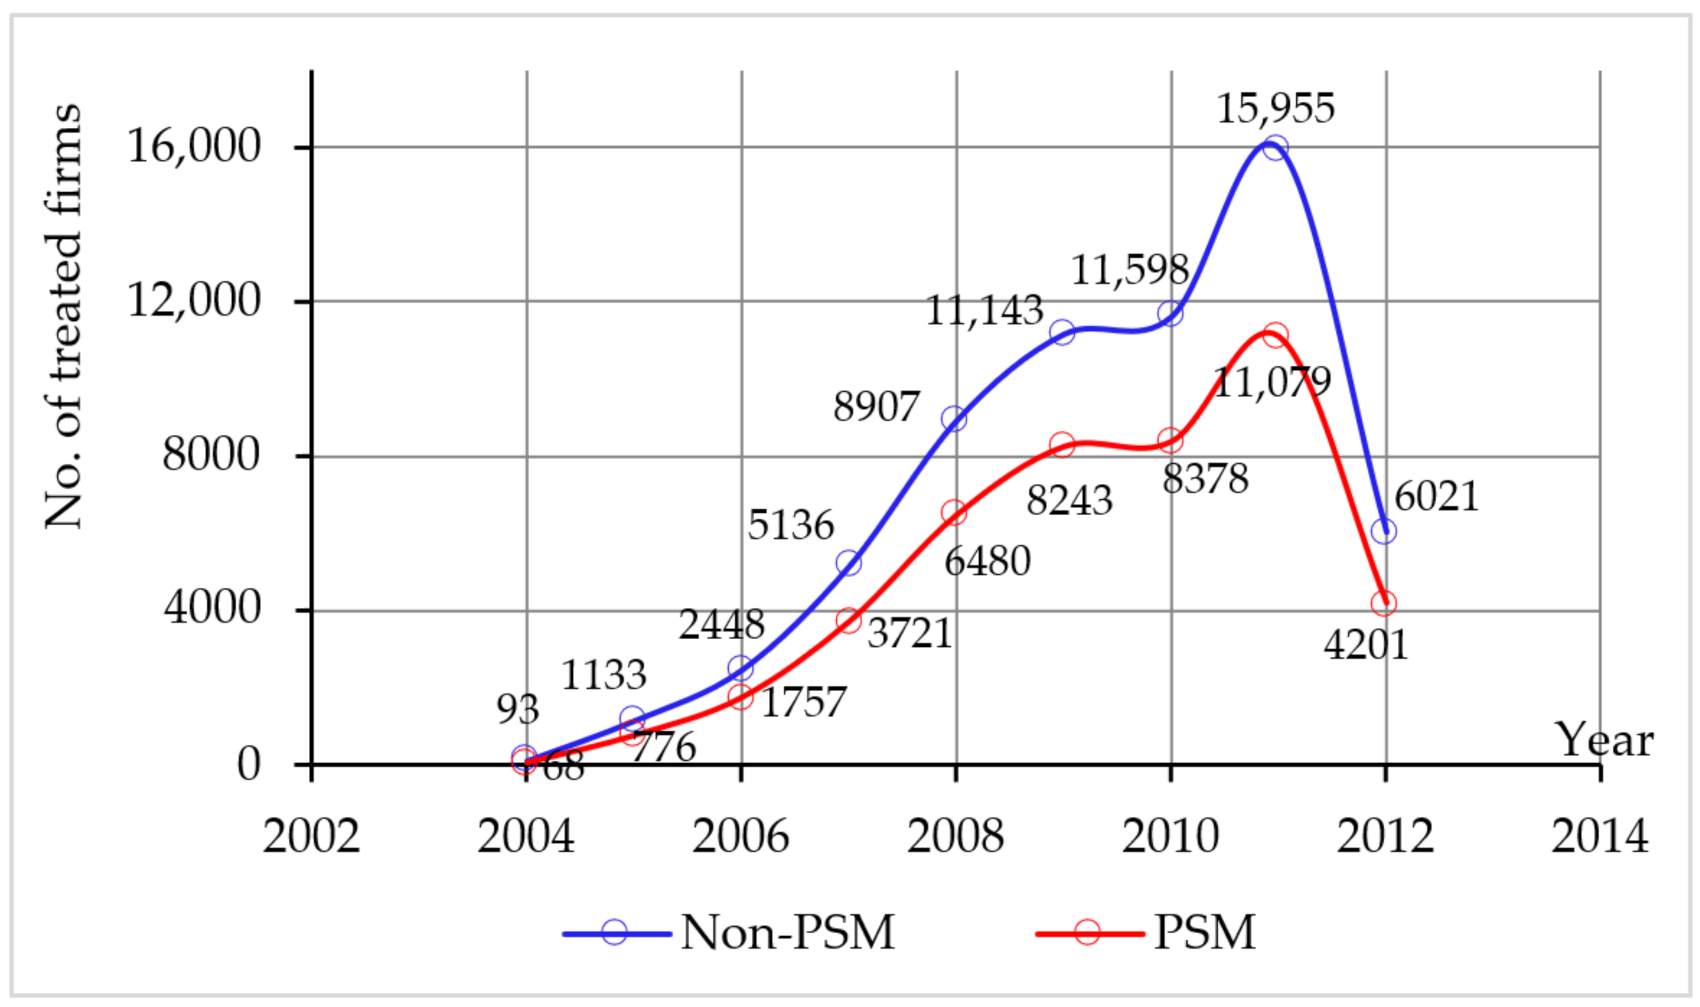

