4.1. Results Analysis
In this study, the FIDP model suitable for Handan’s water management was established to obtain the objective function values and water resources allocation schemes, which can be seen in
Table 3. The
,
represent the maximum subordinate degree and the minimum subordinate degree respectively. In detail, by solving the model, the value of
is 0.993, the corresponding economic benefit is 2989.33 × 10
8 yuan, the satisfaction of users is 96.50%, and the social benefit is 1.23 × 10
8 kg. On the contrary, the value of
is 0.985, whilst the corresponding economic benefits, satisfaction and social benefits are 2264.72 × 10
8 yuan, 87.50% and 1.65 × 10
8 kg, respectively.
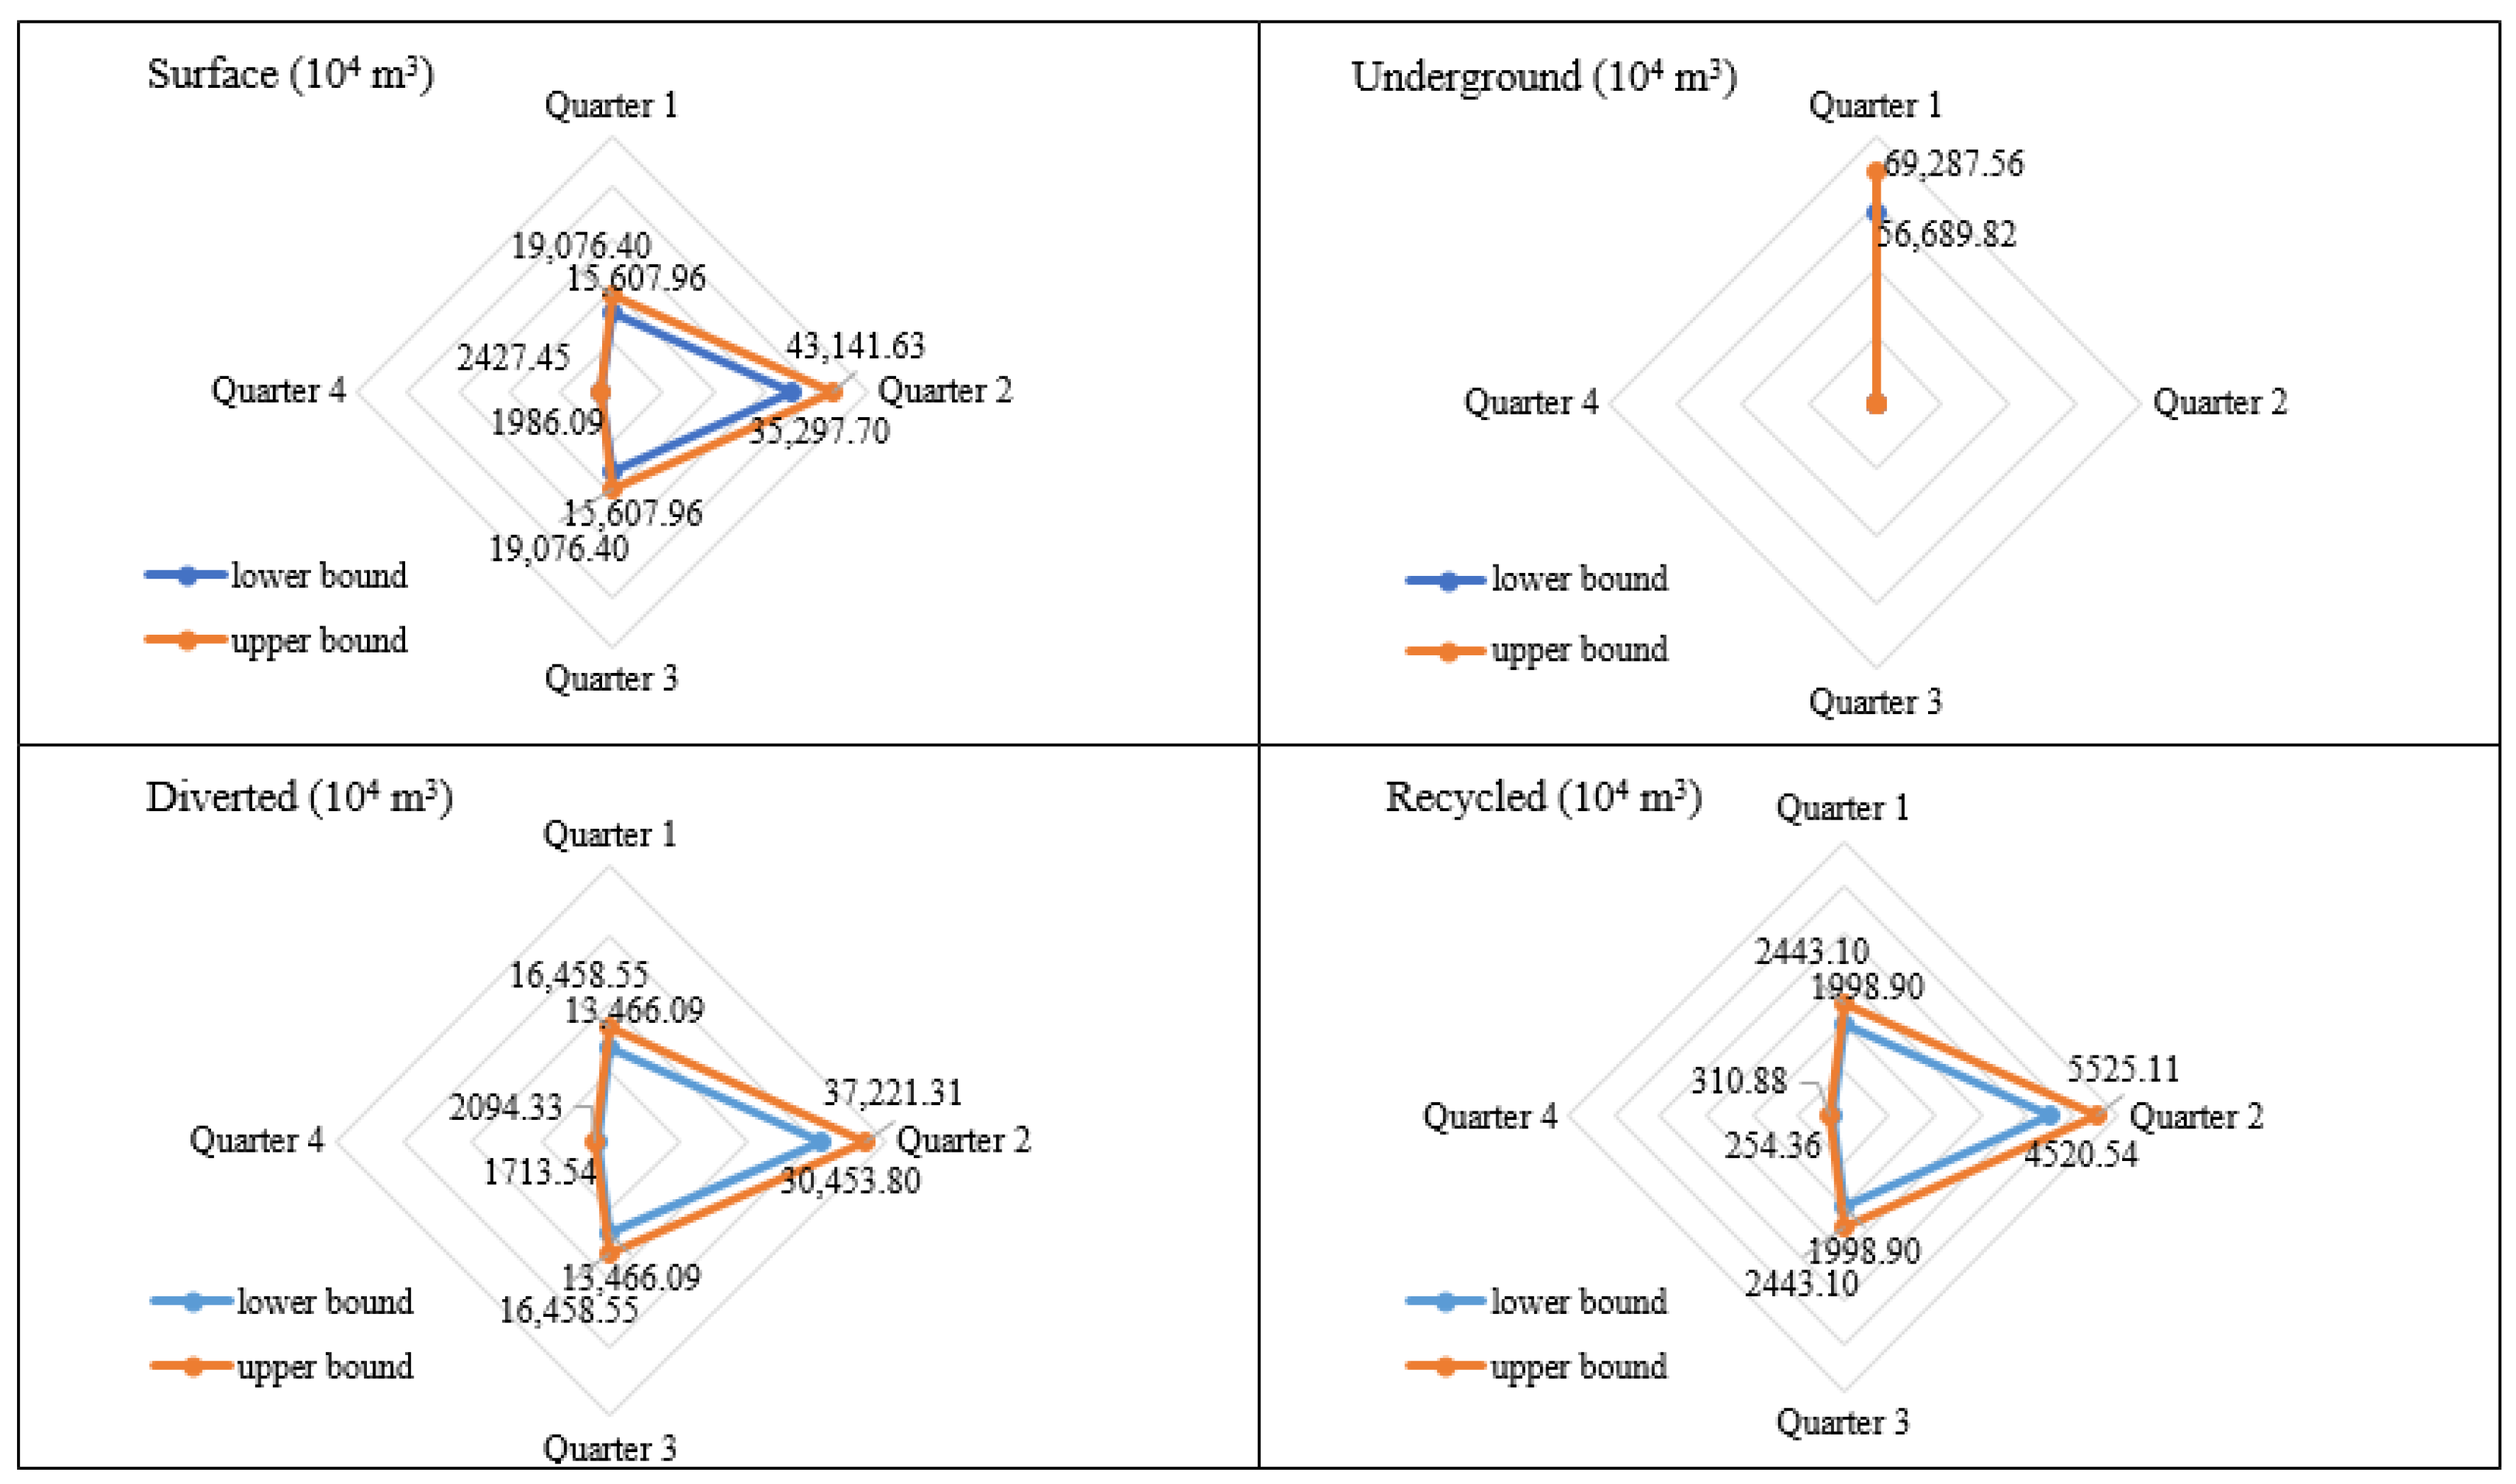
Table 4 shows the total amount of water allocated to different users in different regions of Handan City in the planning year, while
Table 5 shows the total amount of water allocated from different water sources to different regions. It can be seen that the total amount of allocated water in Handan City in 2030 will be [175,412.60, 219,210.86] × 10
4 m
3, and the total water shortage will reach [34,051.91, 36,800.32] × 10
4 m
3 according to the water demand forecasting results. As the minimum water demand in the planning year will reach [167,571.50, 204,809.62] × 10
4 m
3, which is less than the allocated water, the water allocation in the planning year can meet its minimum guaranteed water demand on the whole.
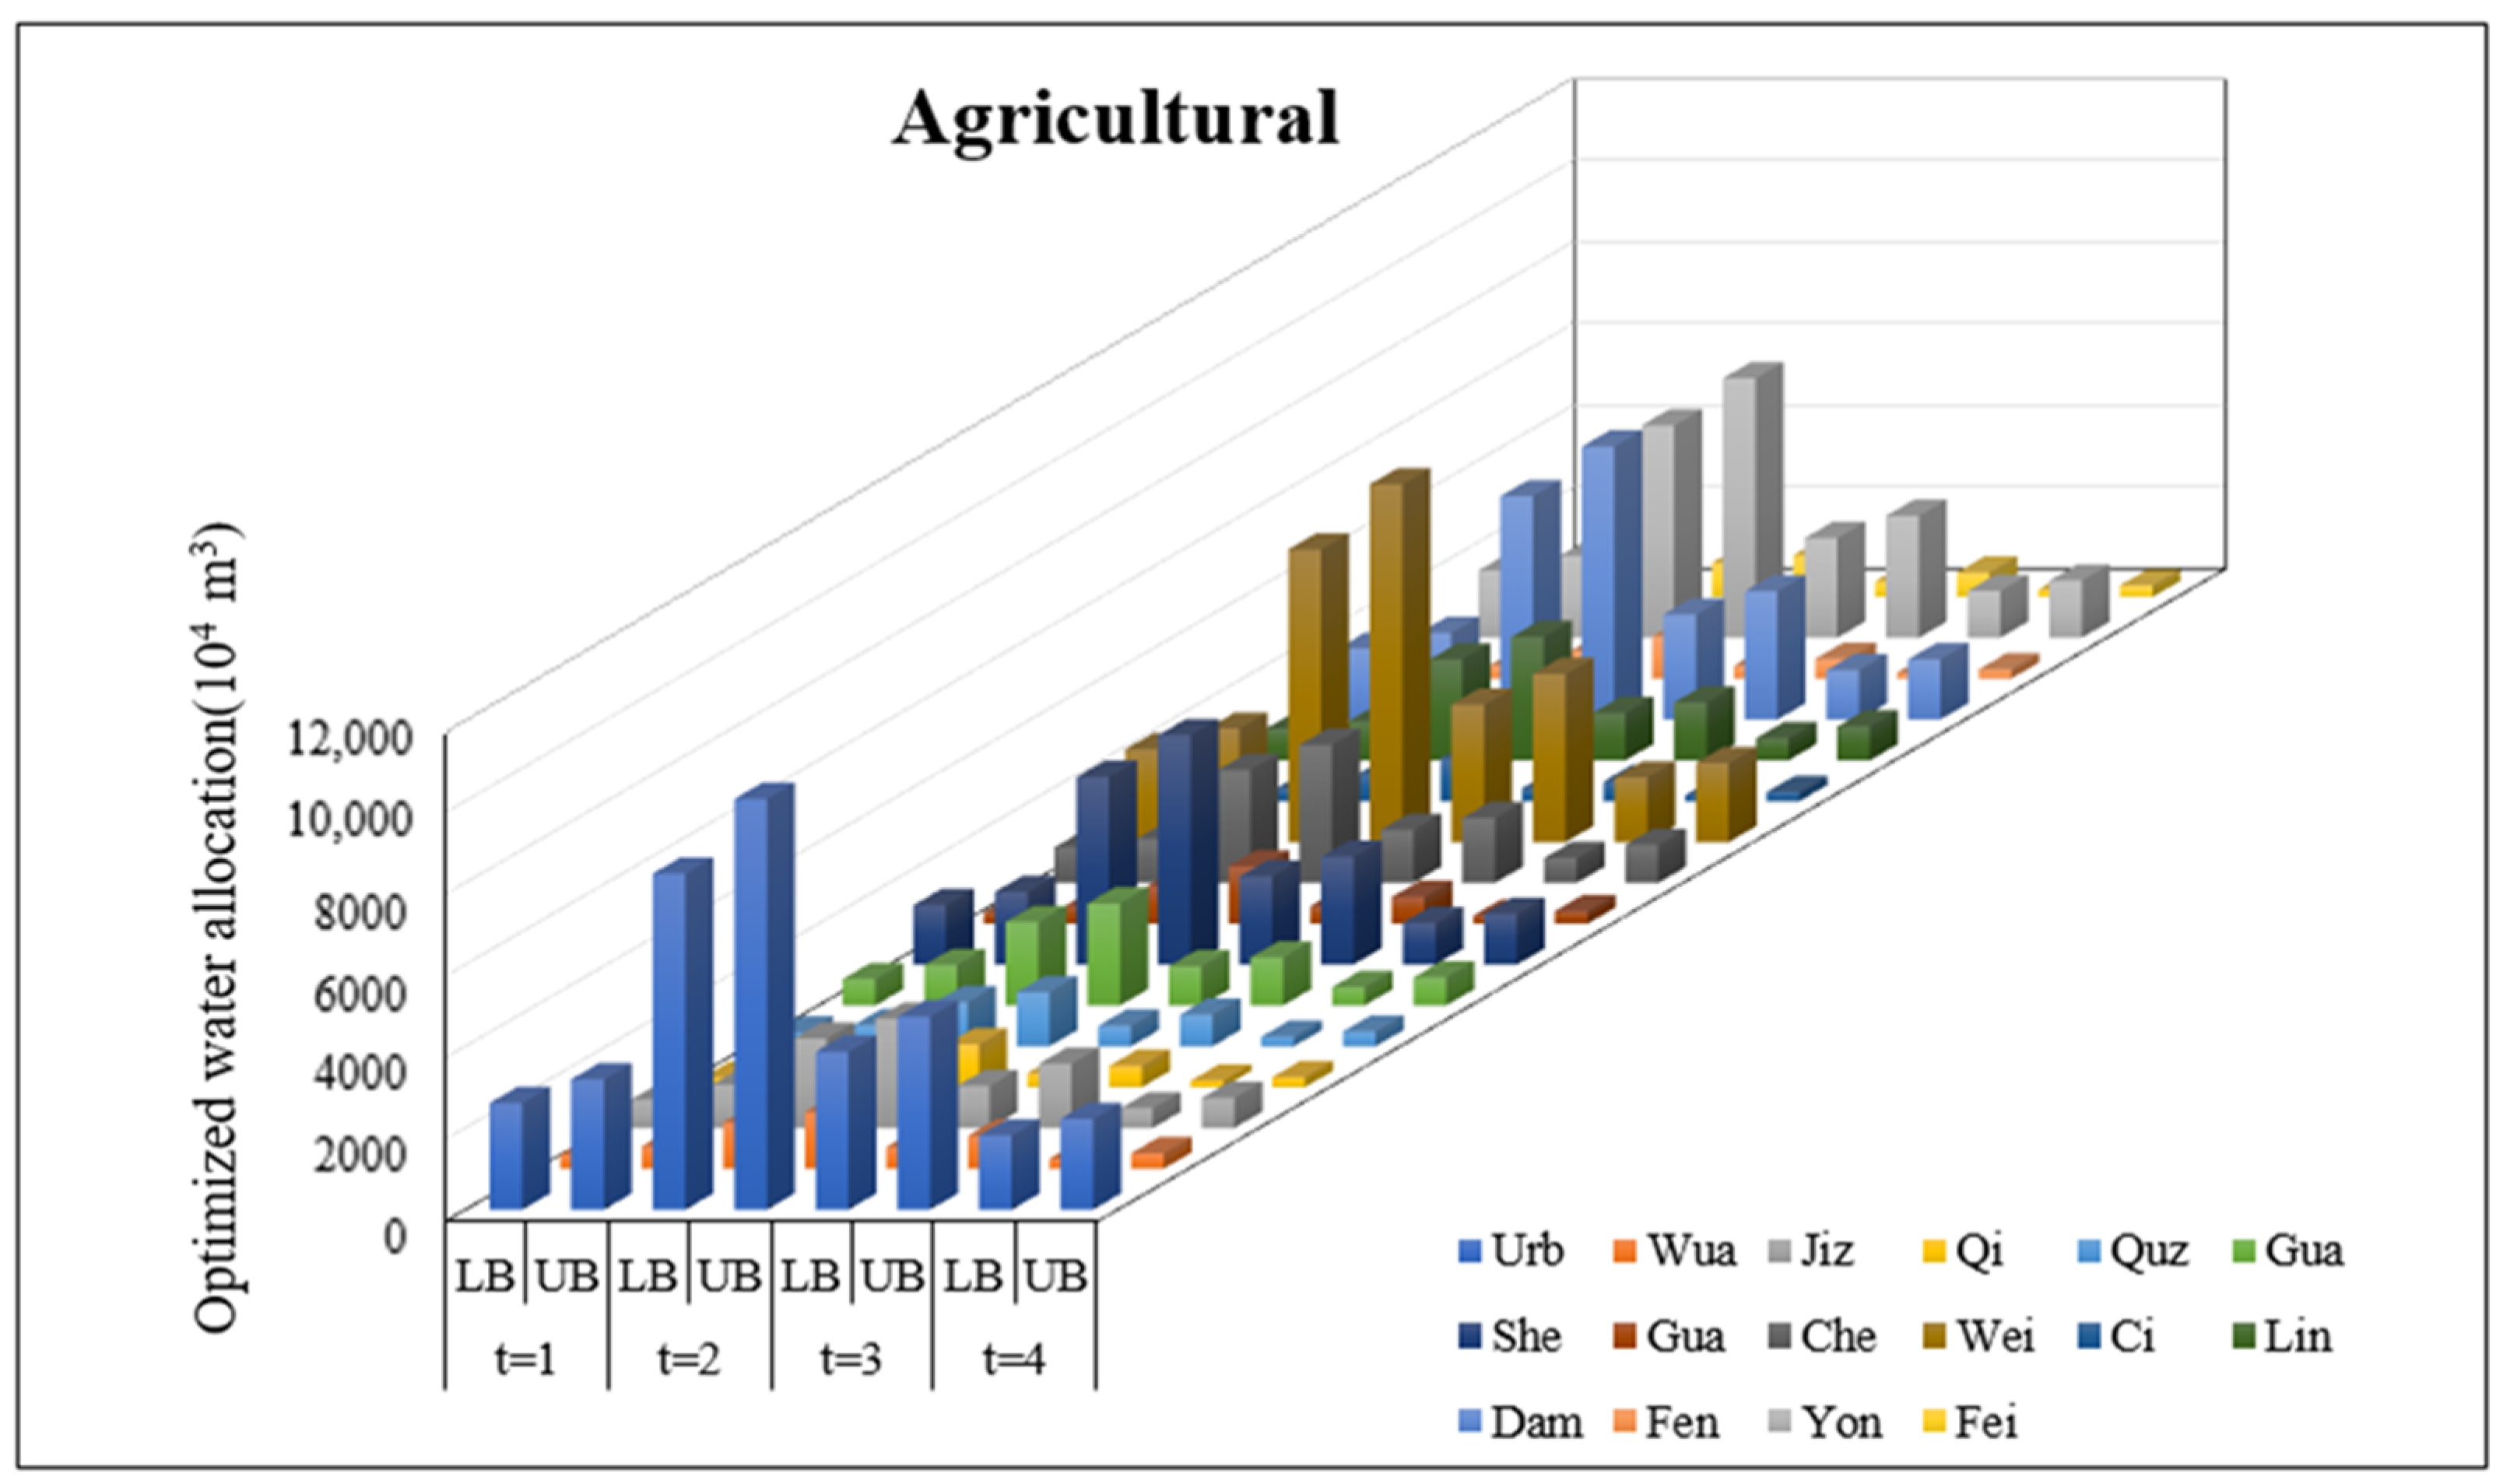
In 2030, the agricultural water consumption in Handan City will account for [52.90, 53.60] % of the total water distribution with the detailed allocation being [92,754.97, 117,454.65] × 10
4 m
3. Since the agricultural water demand is affected by the season and climate, the water demand also changes at different stages of the planning year. In detail, the second stage is the main growth period of crops, and the agricultural water demand in this stage also increases correspondingly, accounting for [48.80, 49.80] % of the annual water demand. On the contrary, the amount of water distribution in the fourth stage accounts for the least proportion, which is only [11.10, 11.50] % of the total agricultural water distribution. The difference between these two stages is [35,988.55, 43,789.37] × 10
4 m
3. The calculation results show that the satisfaction of the agricultural is [80.00, 82.90] % in 2030, and it reaches 80% in each stage, meeting its minimum water demand. Supported by the soil characteristics of each region, the leading agricultural industries in Urban, Weixian, Daming, and Yongnian have been developing rapidly, and the agricultural water consumption in these four regions would account for [54.40, 56.40] % of the total agricultural water consumption in the city. The agricultural water distribution in the planning year is shown in
Figure 4.
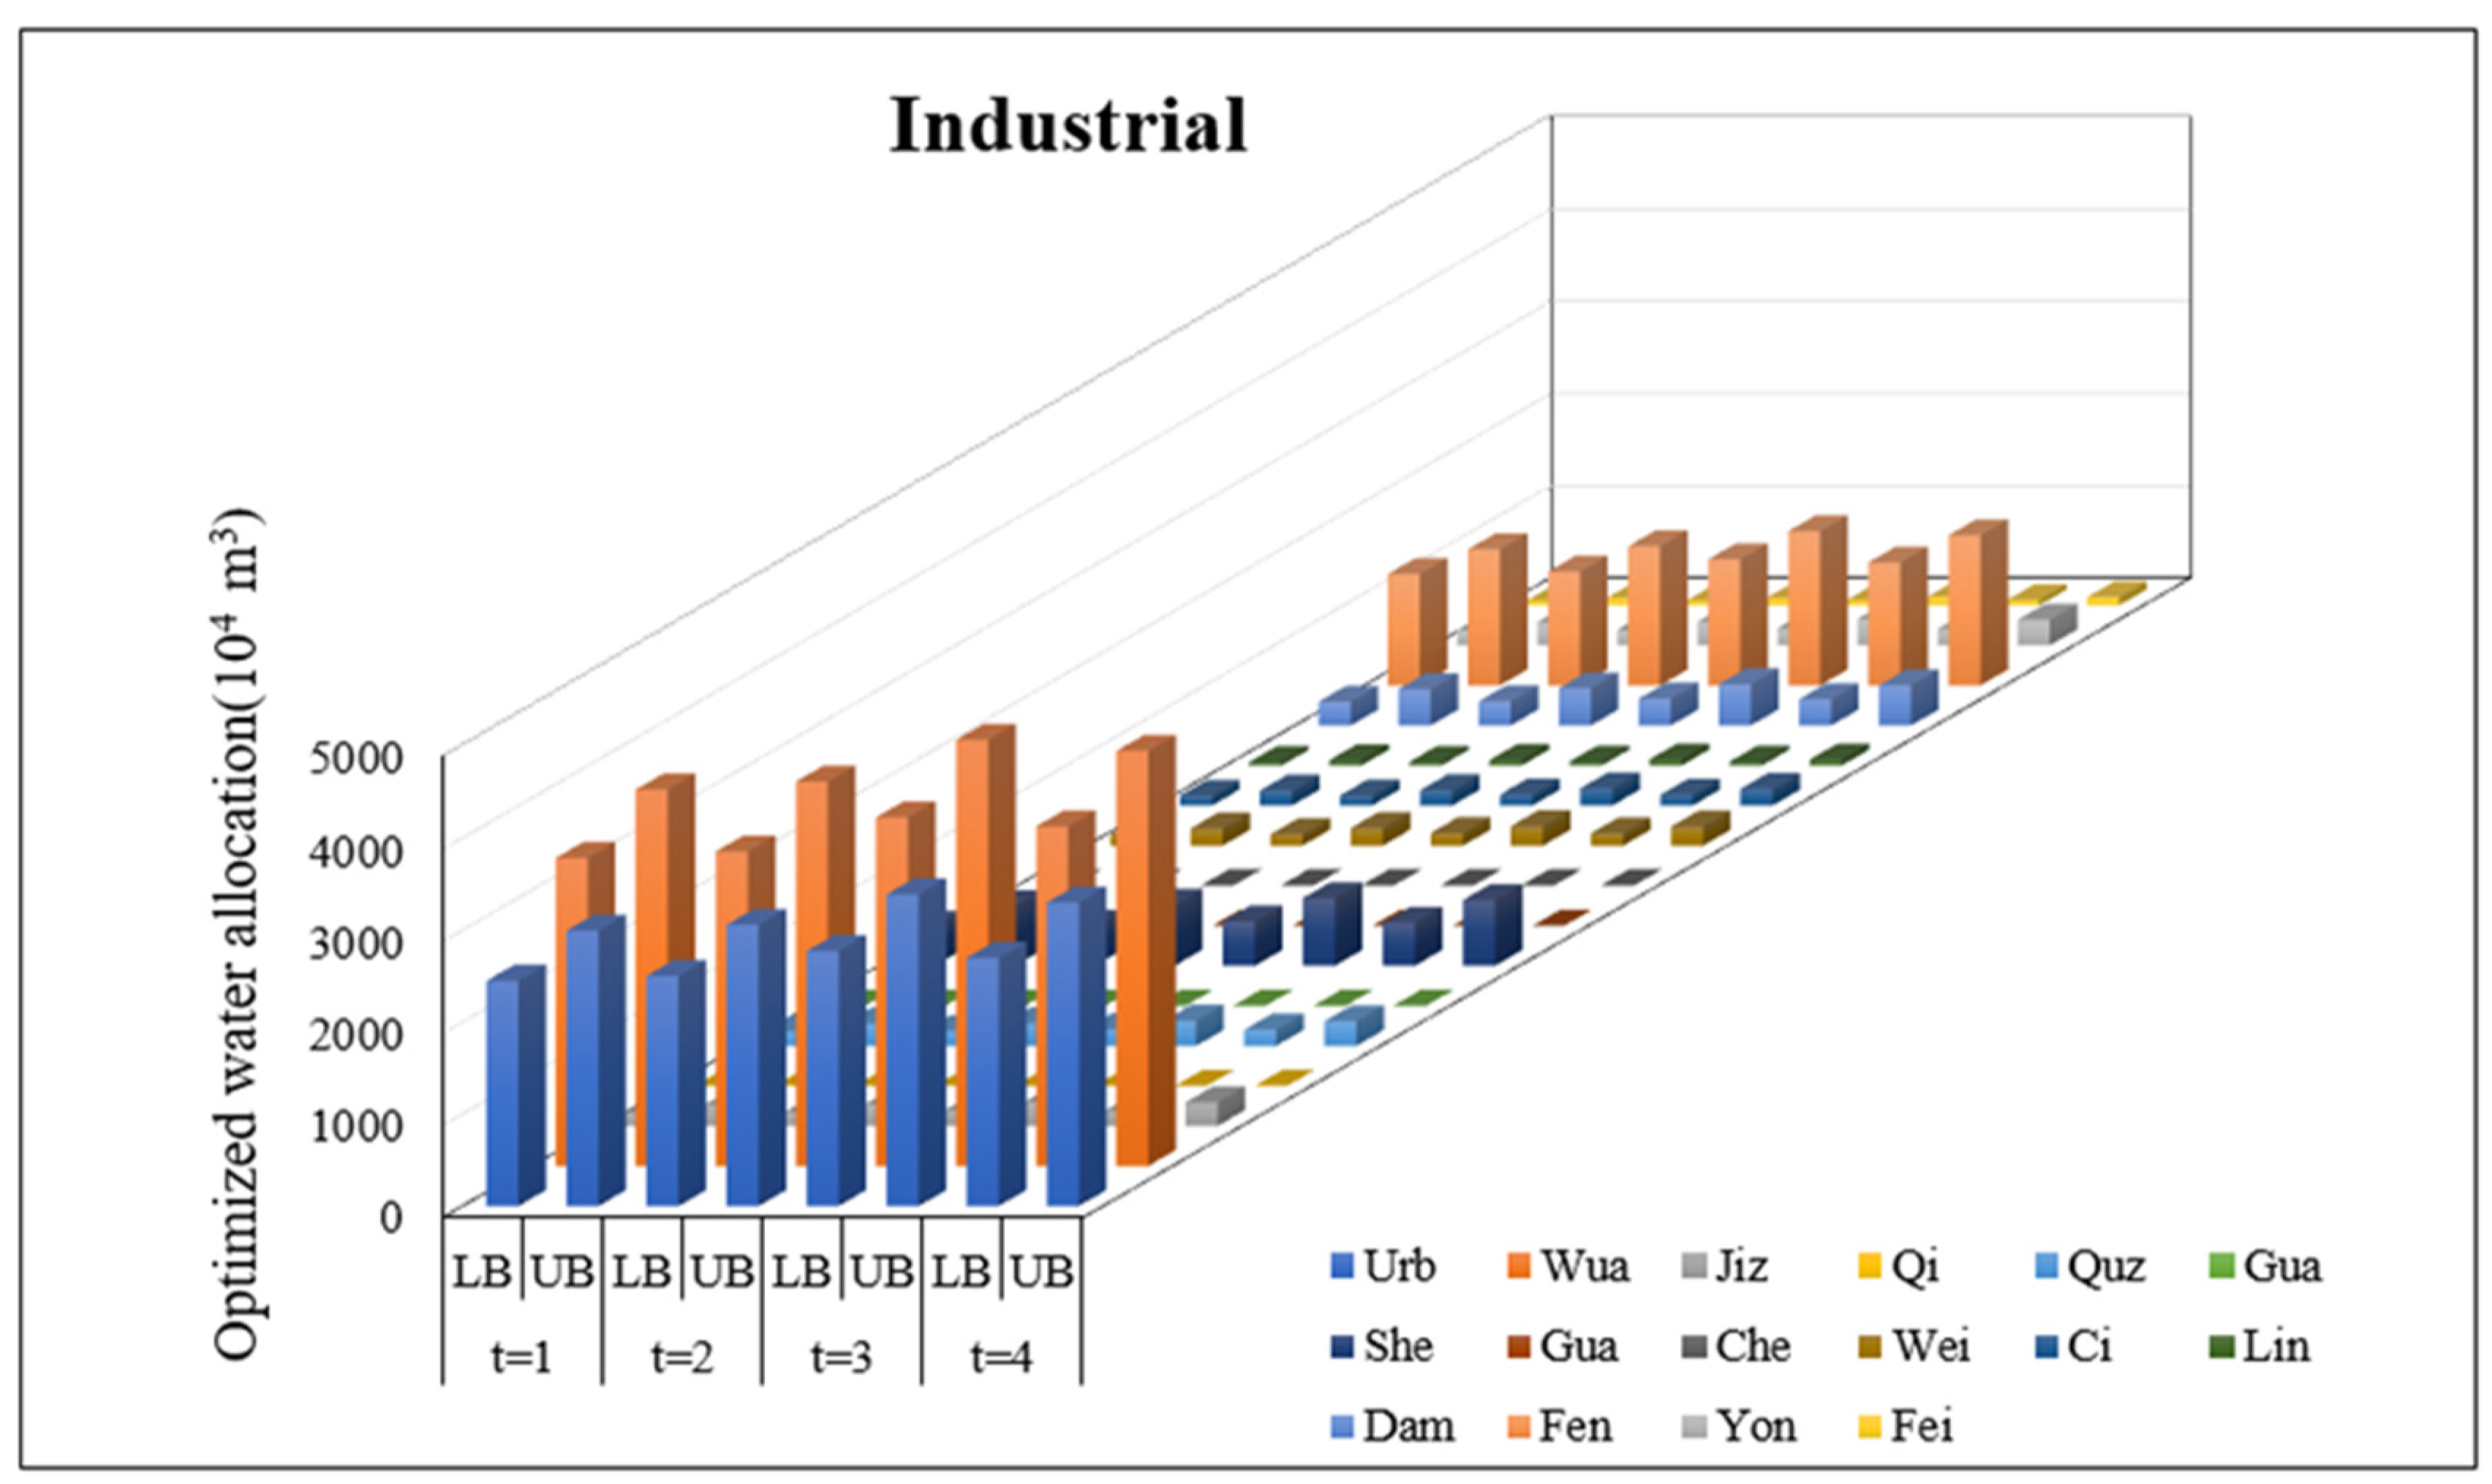
By solving the model, the industrial water distribution of Handan City in 2030 will be [36,210.94, 46,203.93] × 10
4 m
3, accounting for [20.60, 21.10] % of the total water distribution. The satisfaction of industrial water consumption is [80.00, 83.50] % in the whole year, and such satisfaction is higher than 80.00% in each stage, meeting its minimum water demand. According to the solution results as shown in
Figure 5, the third stage has the largest industrial water distribution, which is [9631.84, 12,290.27] × 10
4 m
3, whereas the water distribution in the first stage is least with the allocation amount of [8509.83, 10,859.91] × 10
4 m
3, and the difference between the two stages is [1122.11, 1432.34] × 10
4 m
3. Among them, Urban, Wu’an and Fengfeng are the major industrial water users, making a contribution of [78.90, 82.40] % for the whole city’s industrial water consumption.
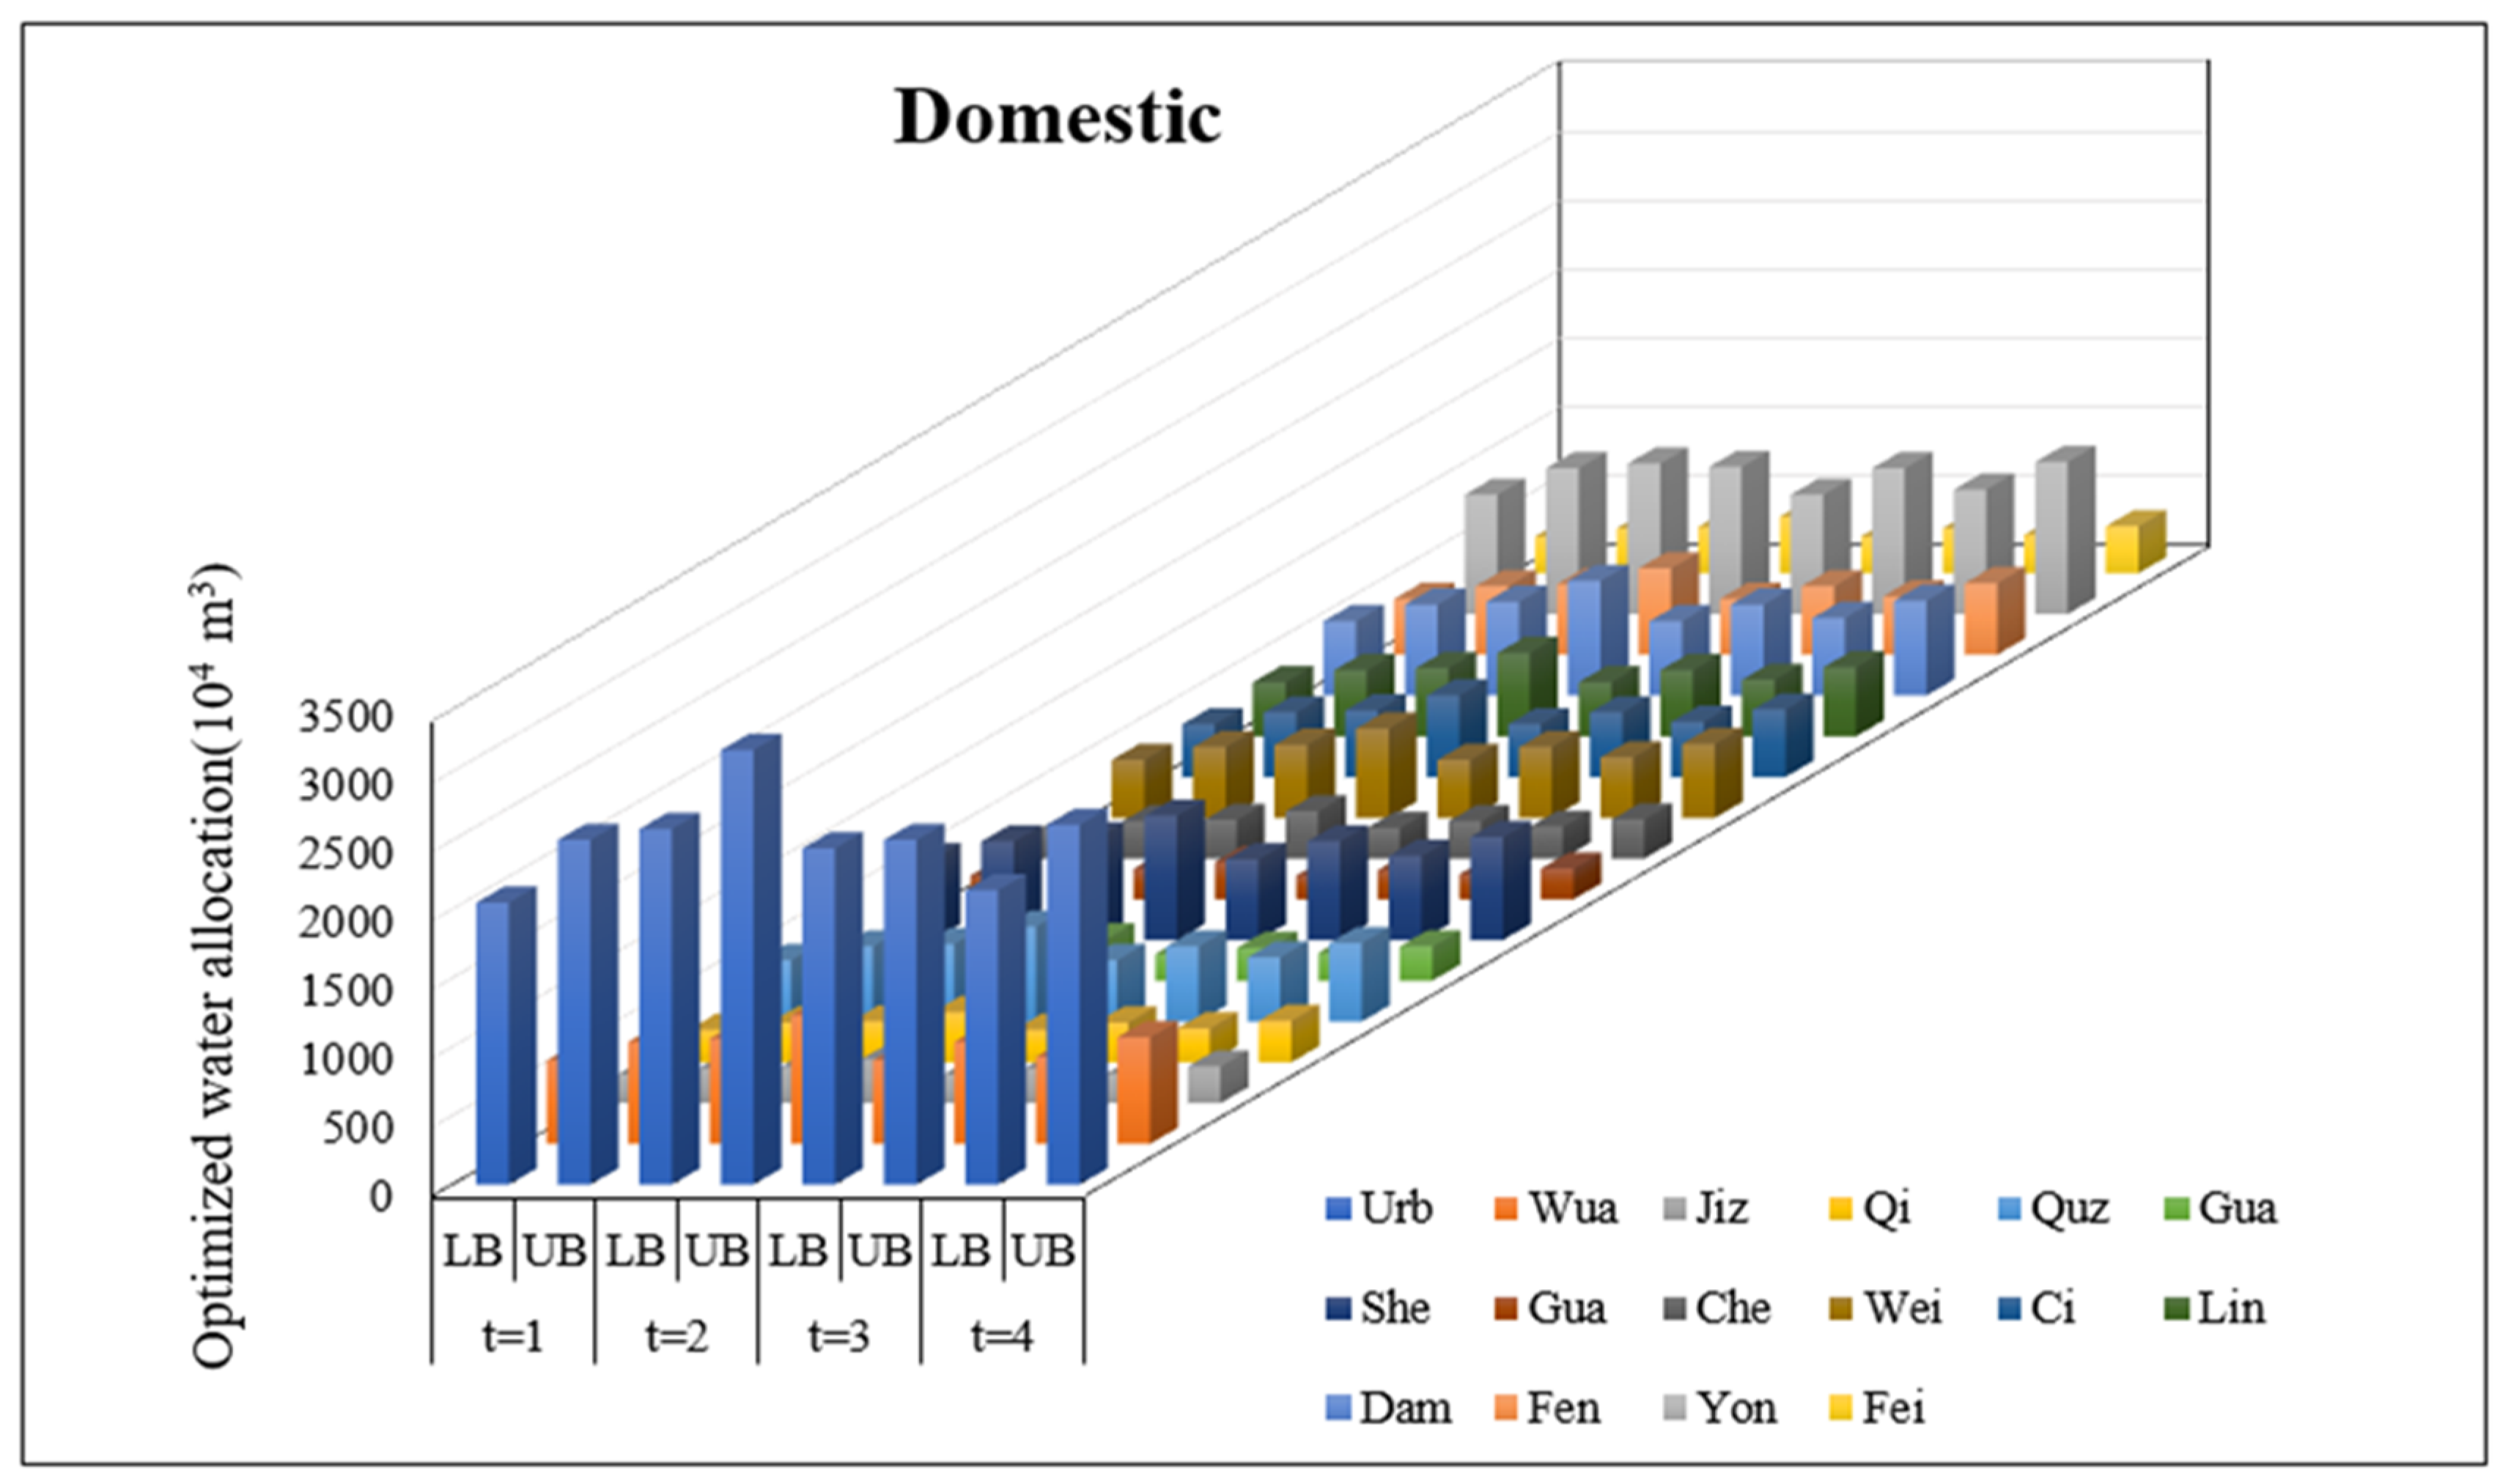
In 2030, the domestic water distribution in Handan City will be [34,907.31, 41,915.24] × 10
4 m
3, accounting for [19.10, 19.90] % of the total water distribution. The satisfaction of domestic water use in the whole year is [93.40, 95.10] %, and it is higher than 92.00% in each stage indicating a high degree for guaranteed domestic water. With the change of temperature, the domestic water consumption at different stages also changes slightly to some extent. Specifically, the proportion of domestic water in the four stages of the planning year is [23.01, 23.44] %, [28.80, 29.00] %, [23.40, 24.10] % and [24.00, 24.40] % respectively. Obviously, the second stage consumes the most domestic water, whereas the first stage consumes the least proportion. During the planning year, the population in Urban and Yongnian will reach 3.40 × 10
6, and the water allocated to these two areas will be [12,953.41, 15,082.32] × 10
4 m
3 correspondingly, accounting for [36.00, 37.10] % of the domestic water distribution to the whole city. The annual domestic water distribution in the planning year is shown in
Figure 6.
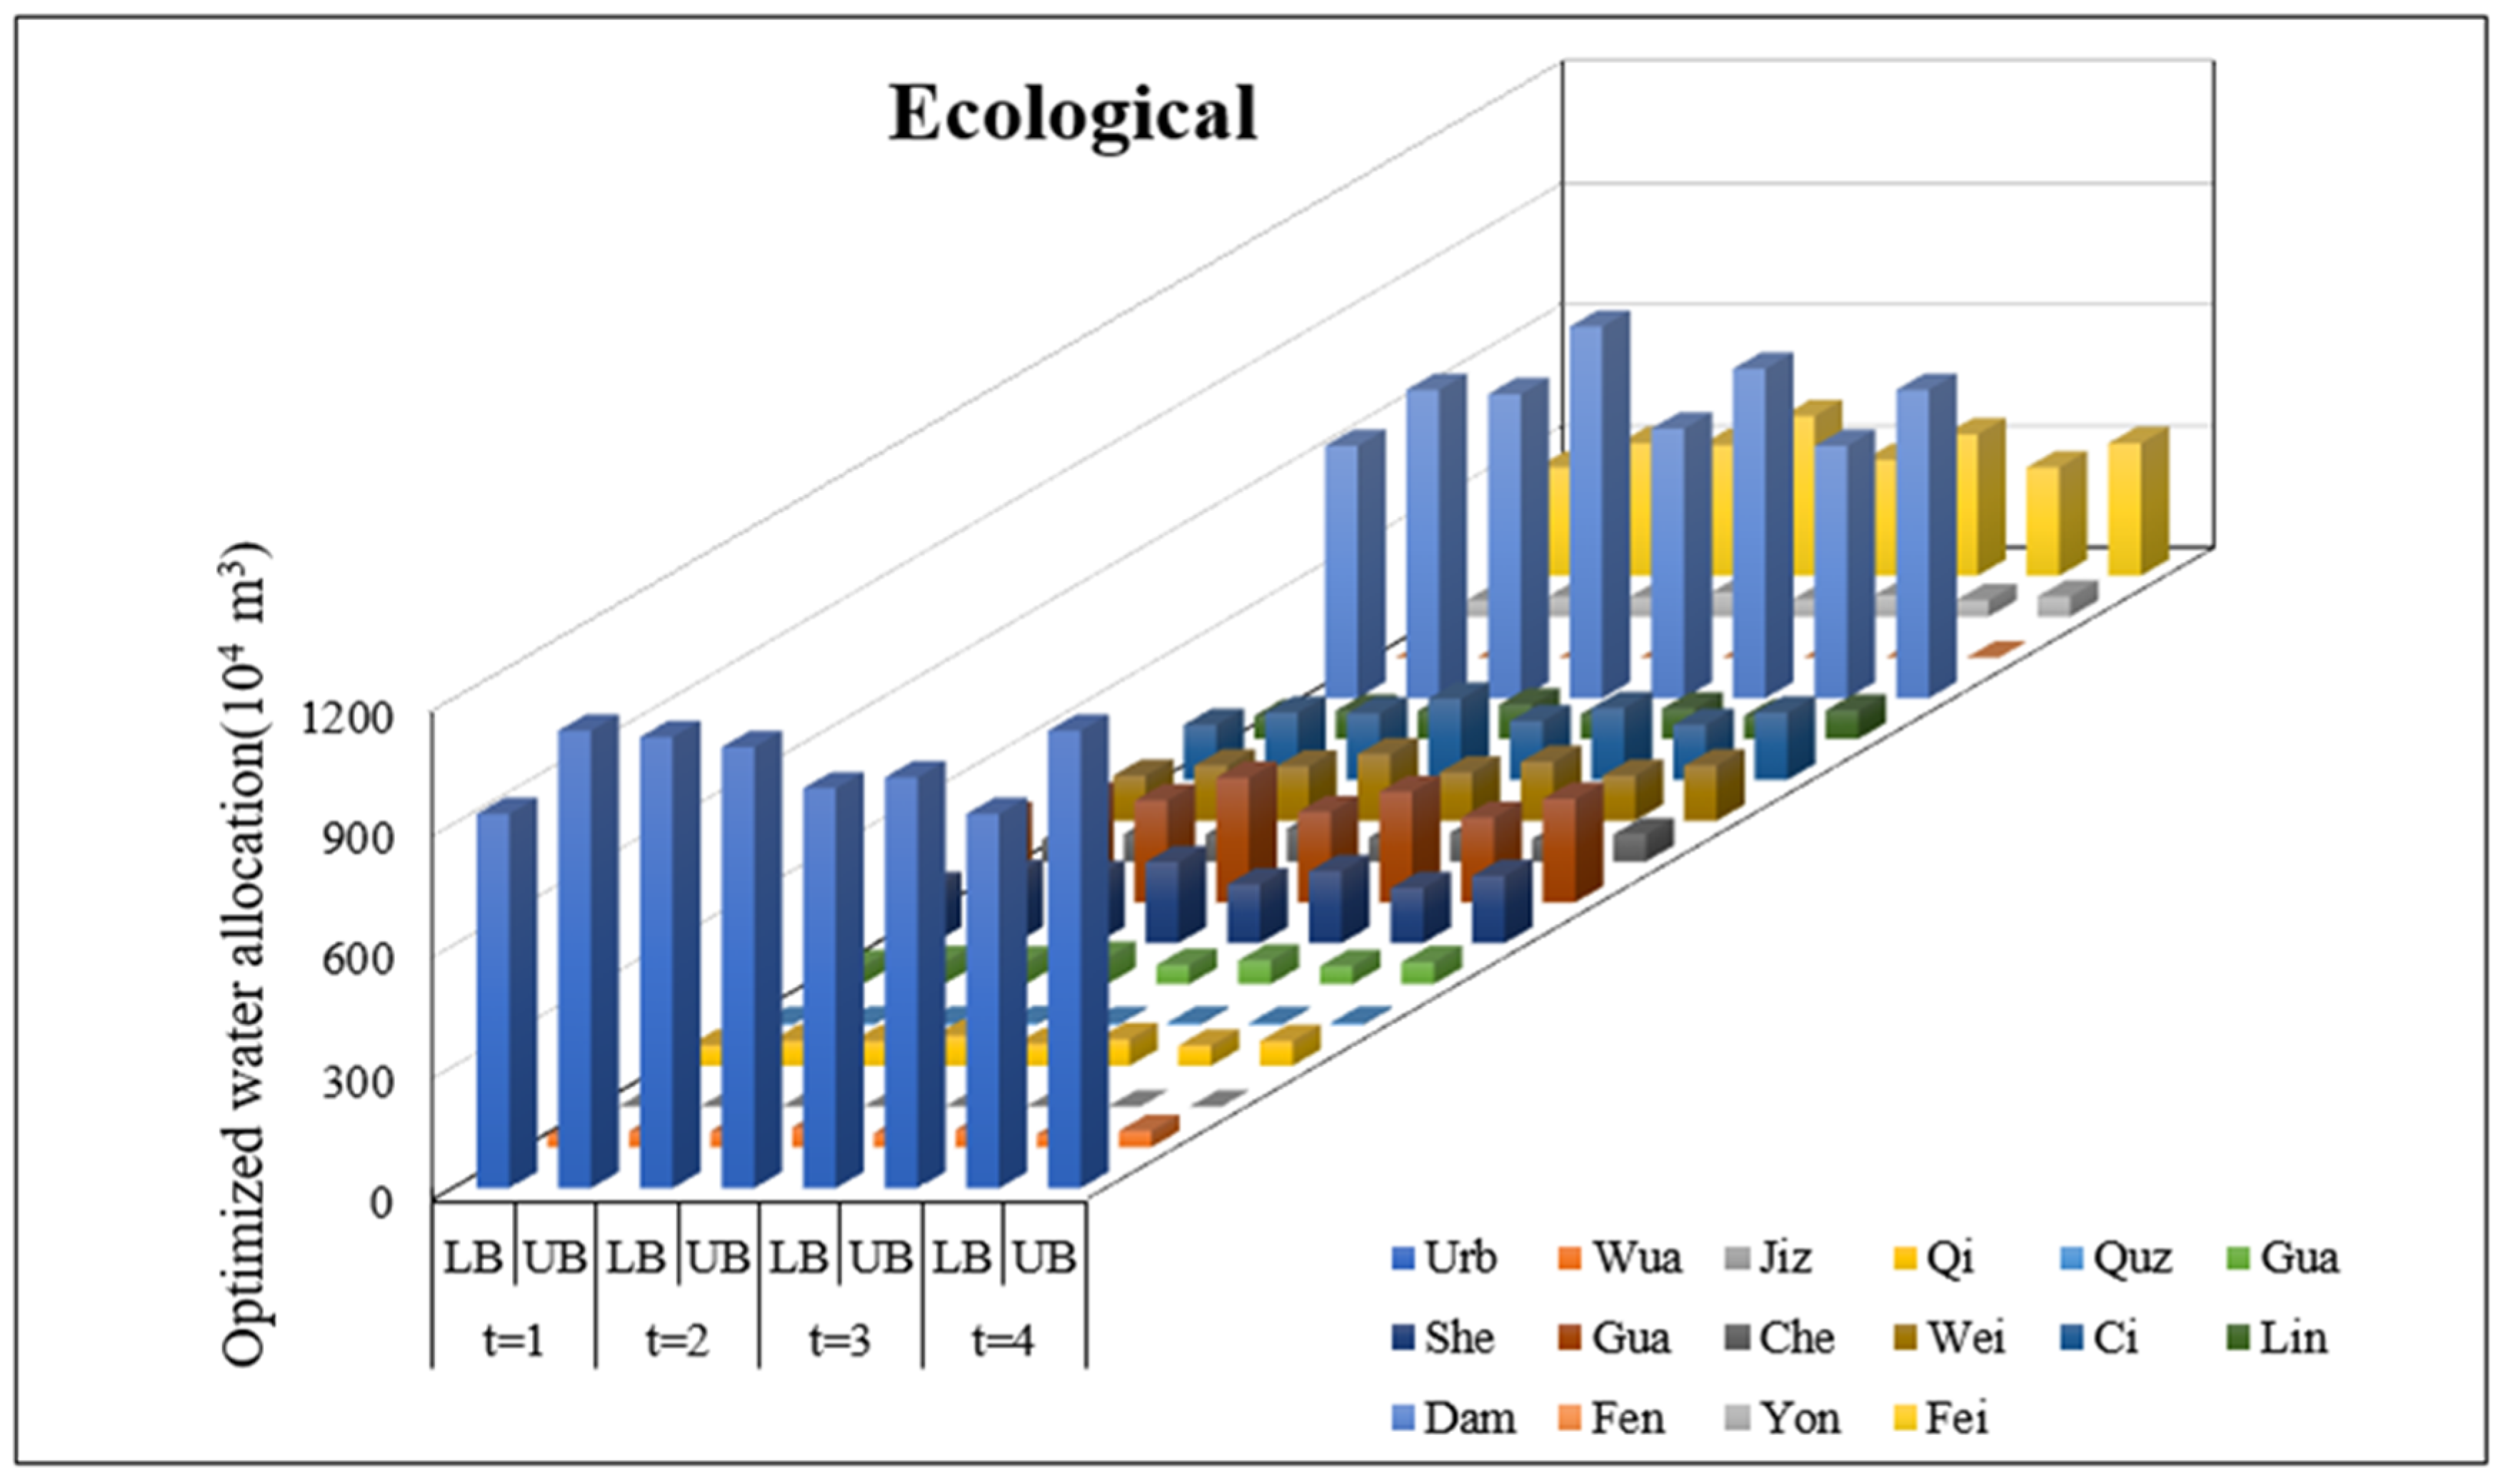
To a certain extent, the development degree of ecological environment reflects the sustainability level of the region. In 2030, the ecological water distribution in Handan will be [11,539.41, 13,638.02] × 10
4 m
3, with a contribution of [6.20, 6.60] % for the total water distribution. The satisfaction of ecological water use is [96.70, 100.00] % in the whole year with the satisfaction degree over 93.00% in each stage, which reflects the priority in ecological development. It can be seen from
Figure 7 that the distribution of ecological water reaches the annual maximum amount of [3254.21, 3704.50] × 10
4 m
3 in the second stage, which is [404.34, 554.02] × 10
4 m
3 more than the least water distribution in the first stage. The ecological water consumption in the third and fourth stage is [2884.81, 3333.10] × 10
4 m
3 and [2700.24, 3300.23] × 10
4 m
3 respectively, accounting for [24.40, 25.00] % and [23.40, 24.20] % of the ecological water consumption in the whole year. Among them, the ecological water consumption in the urban area and Daming county is relatively huge, contribution [32.10, 34.30] % and [23.10, 23.90] % to the total ecological water consumption respectively. This indicates that these two regions pay close attention to ecological environment construction.
Based on the analysis above, it can be known that FIDP model can provide global optimal solutions for the planned annual water distribution scheme, as well as specific water distribution schemes at different stages of the year under dynamics and uncertainties. In the planning year, the second stage has the largest water distribution of [68,246.70, 84,190.91] × 104 m3, while the fourth stage has the smallest water distribution of [30,648.40, 39,012.42] × 104 m3. The water distribution difference between the two stages is [37,598.12, 45,178.58] × 104 m3, and the difference accounts for [20.60, 21.40] % of the annual water distribution.
4.2. Model Comparison
In order to verify the effectiveness of the proposed FIDP model, the application of FILP model to the case study is provided for comparison, which is shown in
Appendix A. The difference between FILP model and FIDP model is that it deletes dynamic programming and parameter
t, but their objective functions, constraints, decision variables and solution methods remain the same. Because the FIDP model takes into account the dynamic factors in different stages of water resources system, the solution results cannot only conform to the case study, but also achieve global optimization under the local optimal conditions of each stage. However, the FILP model only aims at optimality over the whole planning year without considering the dynamic variability of regional water resources system, which would imply that the water use efficiency, water consumption, water demand, water supply and other factors in the FILP model cannot be adjusted correspondingly with the seasonal changes. Therefore, the FIDP model has better optimal solutions and stronger applicability than FILP. The detailed analysis is as follows.
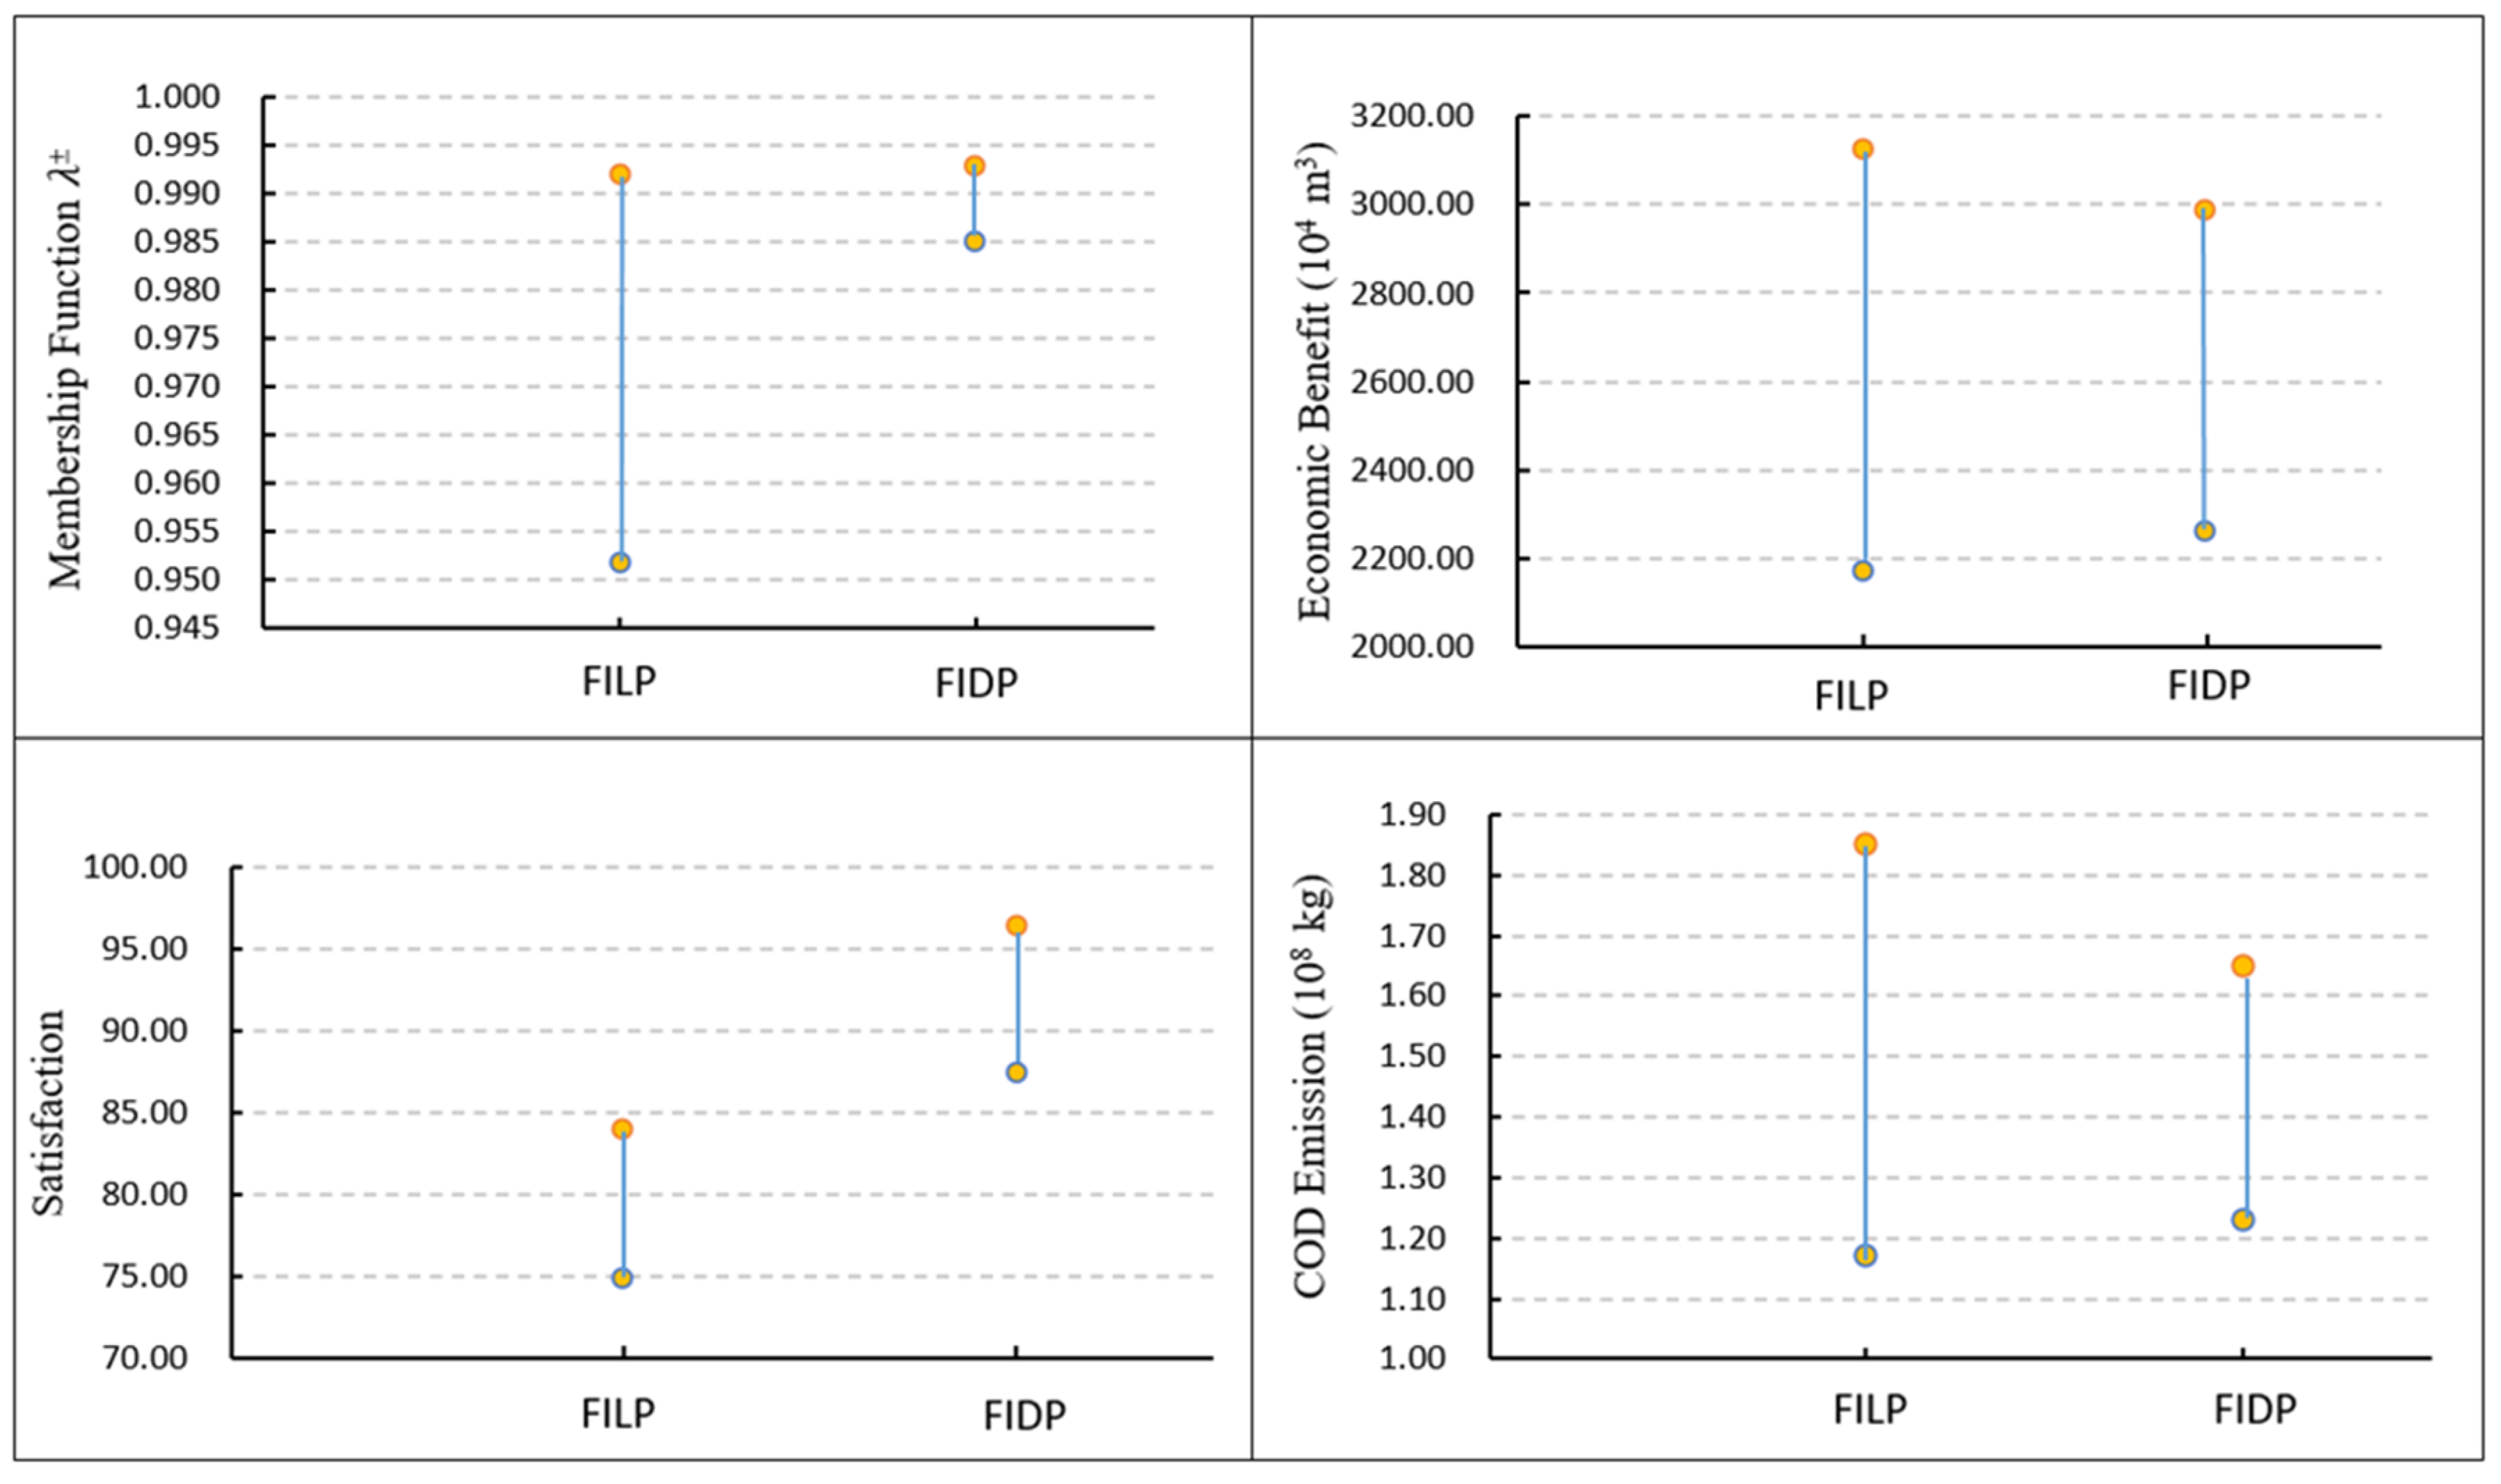
Based on the FILP model, the membership function
= [0.952, 0.992],
= [2171.42, 3124.16] × 10
8 yuan,
= [75.00, 84.00] %,
= [1.17, 1.85] × 10
8 kg, and the comparison result of two models is shown in
Figure 8. It can be seen that, compared with the FILP model, the ranges of the solution results of the FIDP model are reduced in different degrees, making the results more specific and accurate. In detail, the
of the FIDP model is not only reduced in scope, but also presents increases in its overall value, with its upper bound and lower bounds increased by 0.10% and 3.30% respectively. For
and
, not only the ranges of their value are reduced by 23.90% and 38.20%, but also their lower bounds are increased by 93.30 × 10
8 yuan and 0.06 × 10
8 kg respectively, which are more accurate. The value of
in FIDP model is improved by 12.50%, which will alleviate the conflicts between local government and users, and among different users more effectively. Consequently, it can be concluded that FIDP model proposed in this paper performs better and is more suitable for the optimization of water resources allocation in this area.
The water distribution scheme of FILP model is shown in
Table 6, and the water shortage rate of the two models is compared in
Figure 9. As presented in
Table 6, the total water distribution of the FILP model is [167,643.11, 205,259.94] × 10
4 m
3, which is reduced by [7769.43, 13,951.80] × 10
4 m
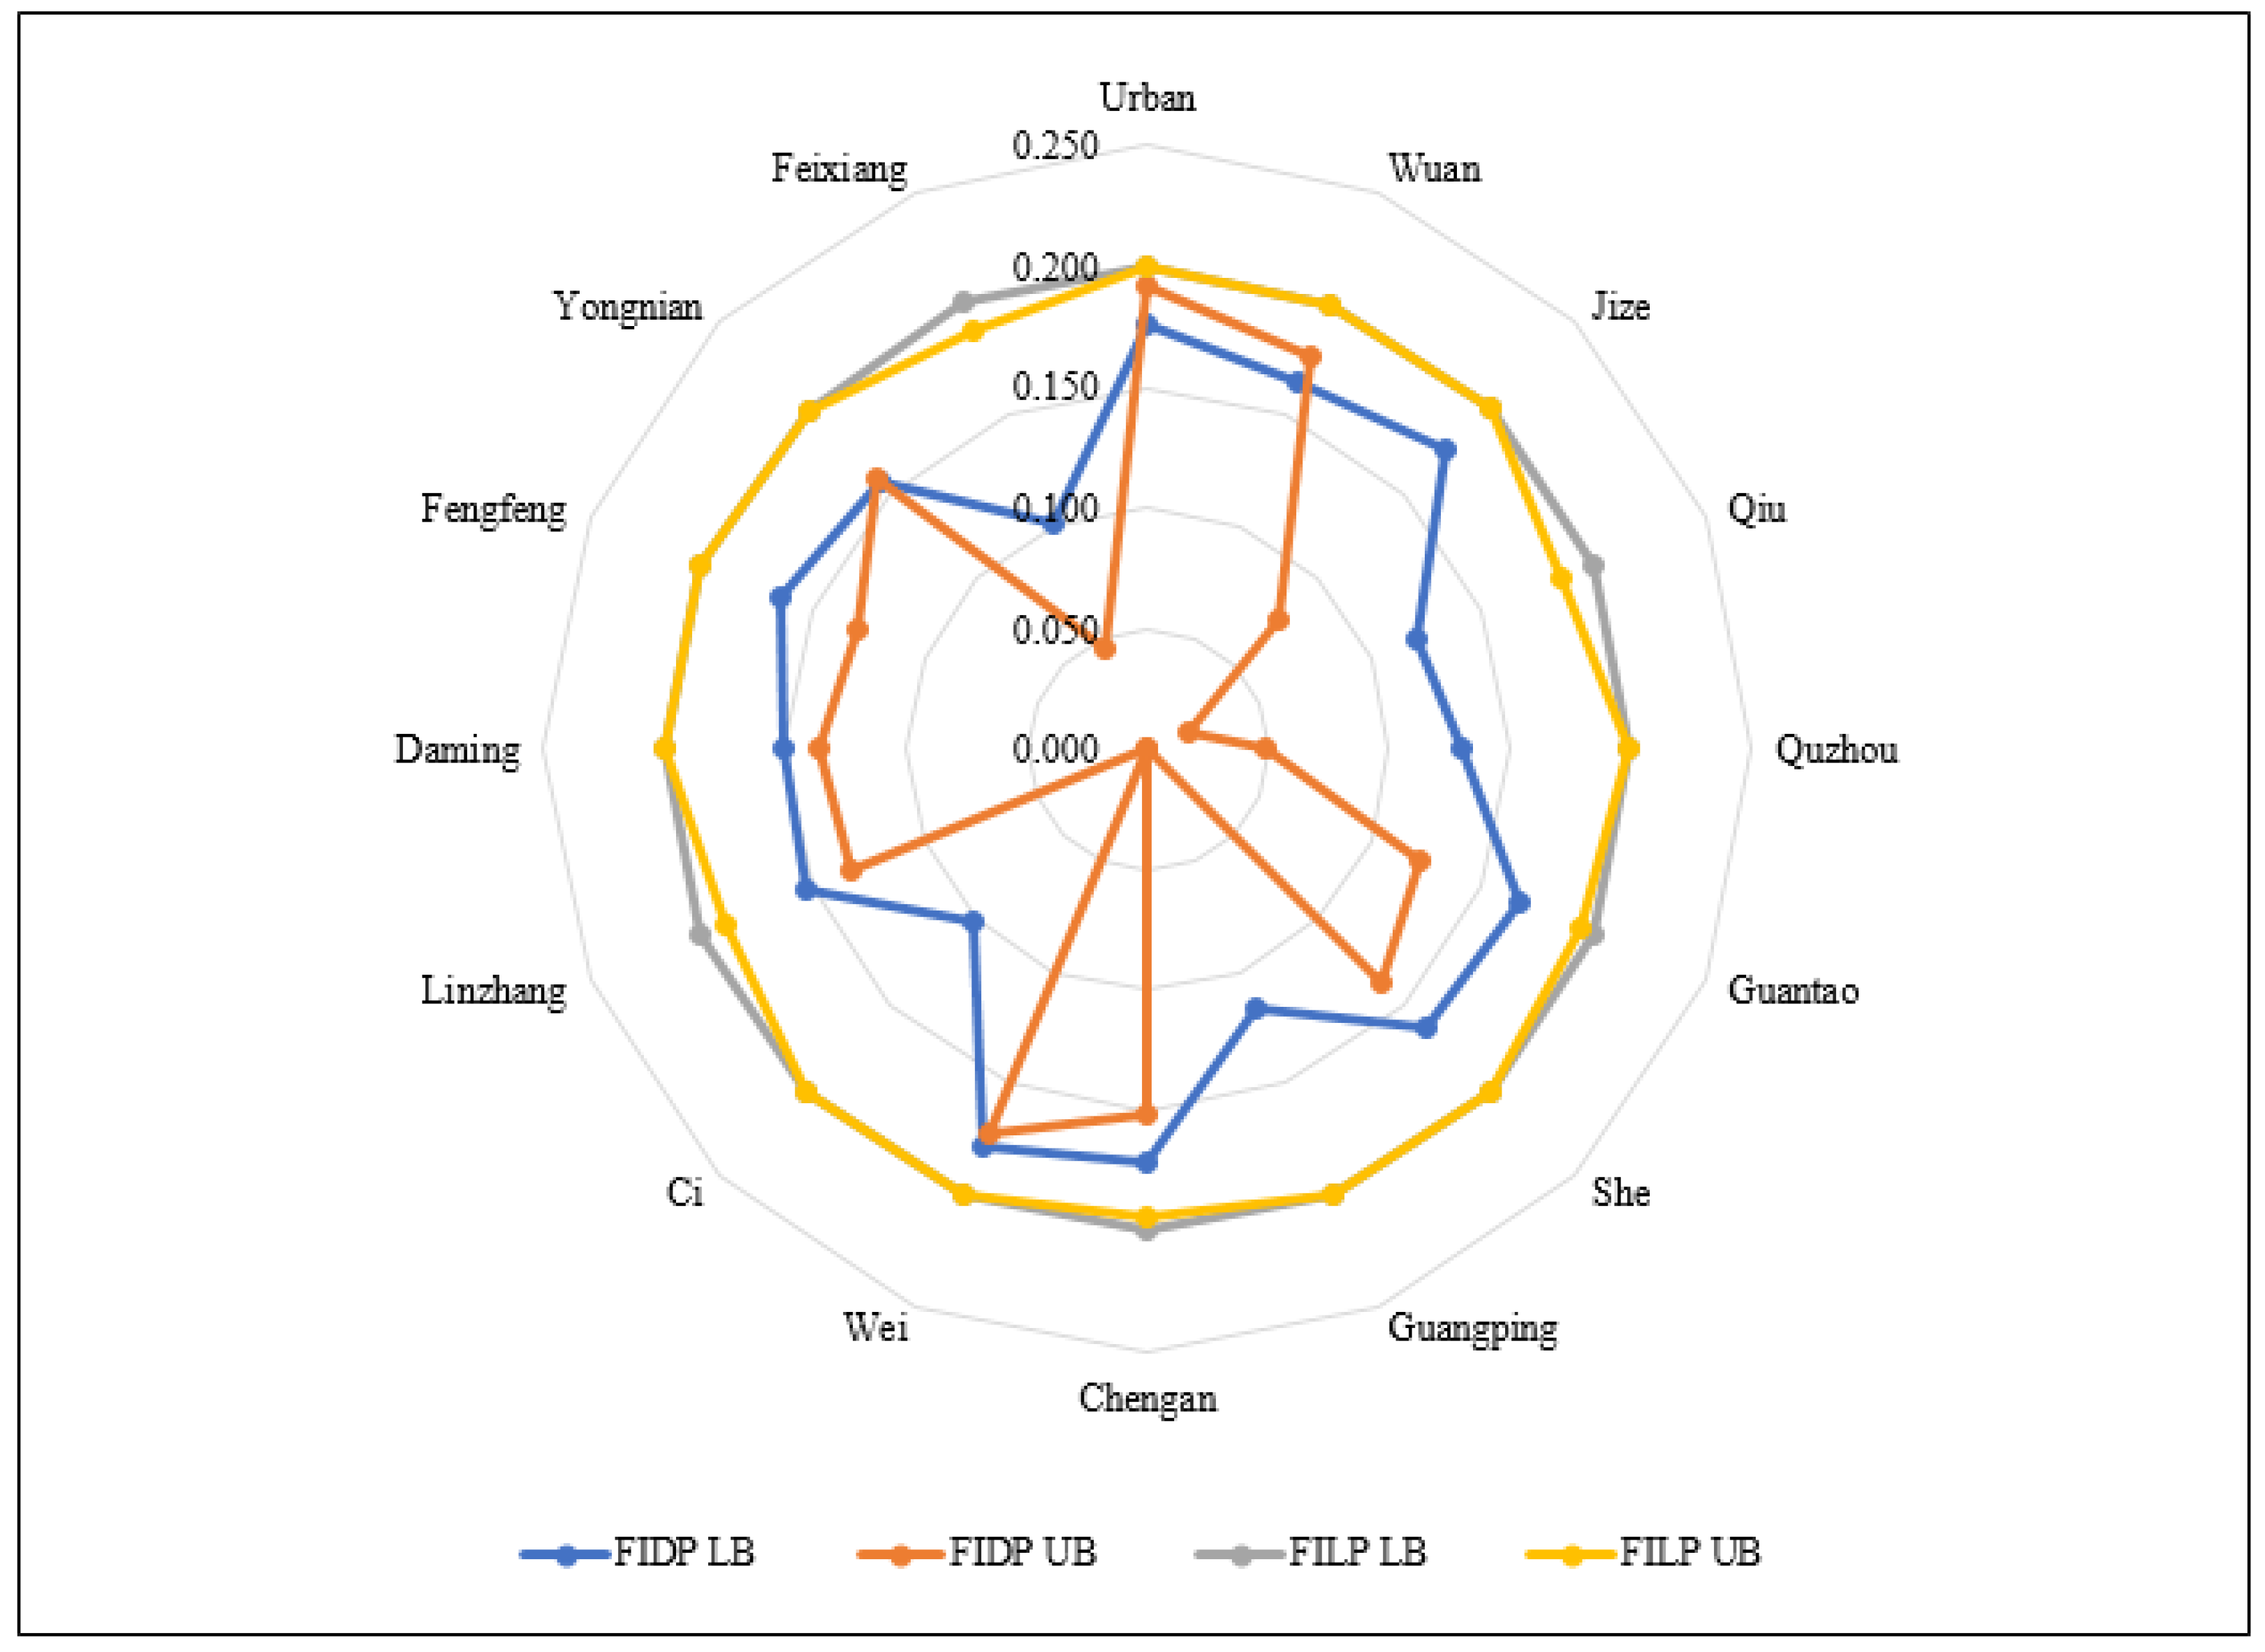
3 compared with the FIDP model. As the water distribution decreases, the corresponding water shortage rate will be [19.70, 20.00] %, with an increase of [5.10, 9.10] % compared with [10.60, 14.90] % from the FIDP model. Compared with FILP, the water shortage rate from FIDP has declined in all regions, especially in Qiu, Quzhou, Guangping, Ci and Feixiang, with a decrease of [7.90, 16.70] %, [7.00, 15.00] %, [8.30, 20.00] %, [9.90, 20.00] %, and [9.80, 14.30] % respectively. Therefore, the model has good applicability to water resources allocation in water-scarce areas.
In summary, the FIDP model has the following advantages over the FILP model: (i) The obtained target value intervals are more specific and accurate. (ii) This model can improve the overall satisfaction of the water users and alleviate the water contradiction among them. (iii) The water shortage rate of FIDP model is lower than that of FILP, which effectively alleviates the contradiction between water supply and demand. (iv) Last but not least, FIDP model can get the allocation schemes of each stage in the planning year, and provide theoretical basis for water distribution decision-making in more detail way. Therefore, the model has a good performance in dealing with the dynamic changes of water resources system, and has advantages in optimizing the target value and reducing the water shortage rate.


