Article

Design and Verification of Process Discovery Based on NLP Approach and Visualization for Manufacturing Industry

1
Department of Smart Factory Convergence, Sungkyunkwan University, 2066 Seobu-ro, Jangan-gu, Suwon 16419, Korea
2
Department of Systems Management Engineering, Sungkyunkwan University, 2066 Seobu-ro, Jangan-gu, Suwon 16419, Korea
*
Author to whom correspondence should be addressed.
Sustainability 2022, 14(3), 1103; https://doi.org/10.3390/su14031103
Submission received: 20 December 2021 / Revised: 31 December 2021 / Accepted: 14 January 2022 / Published: 19 January 2022

Abstract

:
When a consultant of a company that provides a smart factory solution consults with a customer, it is difficult to define the outline of the manufacturing process and create all activities within the process by case. It requires a large amount of resources from the company to perform a task. In this study, we propose a process discovery automation system that helps consultants define manufacturing processes. In addition, for process discovery, a fully attention-based transformer model, which has recently shown a strong performance, was applied. To be useful to consultants, we solved the black box characteristics of the deep learning model applied to process discovery and proposed a visualization method that can be used in the monitoring system when explaining the discovery process. In this study, we used the event log of the metal fabrication process to perform the modeling, visualization, and evaluation.

1. Introduction

One of the ultimate goals of a smart factory is production flexibility. Therefore, companies that create smart factory solutions must be able to adapt quickly to changes in the environment and technology to gain a competitive edge. An accurate understanding of the production process in dynamic situations is essential for production flexibility [1]. For flexible businesses, companies in various industries follow systematic work patterns to achieve results by complying with efficient and optimized regulations. In the recent manufacturing environment, the ability to predict the overall manufacturing process has emerged as a major concern for production managers. Accurate event prediction allows managers to more easily control undesirable situations, thereby avoiding future losses. In addition, several studies have been conducted on process mining, a concept that has emerged to handle manufacturing processes efficiently. Process mining continues to attract attention in academia as a key technology to achieve business process intelligence (BPI) [2].
Process discovery in process mining involves discovering information from event logs, such as the transaction logs of enterprise resource planning (ERP) systems, drawing a process map, and transforming the process model into a more understandable form. Recently, the introduction of process mining and workflow solutions has increased, owing to the introduction of process mining in the company and the positive change in perception. However, when introducing process mining, there are still certain issues, such as the existence of an event log to define processes, personnel, and cost problems of domain experts to define processes, making it difficult for companies to introduce process mining [3]. Process discovery helps to improve corporate resources by deriving and defining processes on behalf of the domain experts. In addition, the latest production environment is often subject to change due to rapid development and changes in demand. Building an efficient production process cannot rely solely on the manual work of consultants [4] due to issues such as excessive cost and lack of manpower. As a result, automated process discovery is especially helpful for domain experts and smart factory consultants in establishing processes. Therefore, this study aims to positively influence the introduction of process mining solutions through the automation of process discovery.
However, automated discovery is not an easy task, and several problems must be addressed. This is because there is room for cost and potential risks, the ramifications can be very large, and the overall structure must be understood by predicting detailed events [5]. First, to model these structured processes, we require an event log from the software and solutions that contain the process. Many companies are attempting to implement such manufacturing software to record and utilize event logs. These event logs contain scenarios that affect a set of rules and process linkages. For example, to place workers in a plant to assign tasks to machines, you may need to get a ’principle request for placement’ approved by your manager. Creating event logs makes business process management (BPM) techniques more broadly applicable. However, even if the corresponding event log is secured, a specific framework for a solution that provides direction so that it can be applied to the industry through appropriate use is absolutely necessary.
Another problem is that in the actual field, efficiency is limited because of the lack of high-level predictive analysis for the manufacturing process and the overall industry in the business process monitoring system. A robust automation model that can accurately predict the manufacturing process of complex structures and discover the entire process is needed [6]. The use of machine learning as a basis for event-prediction models has received considerable attention. Ref. [7] applied machine learning and statistical approaches, and the spread of these prediction systems guaranteed context-independent characteristics. This means that the same prediction algorithm can be used in multiple business cases with little or no modifications. This means that they can be applied to manufacturing systems, and various related studies are being conducted [8,9]. However, it is still necessary to predict events by introducing the latest model with powerful performance for application to manufacturing processes where there are many dynamically changing variables. Furthermore, we need a model that will be used to discover the process so that we can compose the entire workflow and not just predict events.
Modeling is an important and time-consuming part of the business process management lifecycle, and its reliability is highly emphasized. In particular, from the perspective of a consultant who proposes a solution to a company, evidence is necessary to trust the automated process discovery framework [10]. Artificial intelligence-based solutions that have recently been introduced into automated prediction systems in various fields are generally in the form of a black box, and because it is difficult to predict how the results were derived, additional explanations of the artificial intelligence model are required. In this study, the following research was conducted to solve the aforementioned problems based on datasets including the event log of the metalworking process in the manufacturing industry. Therefore, we study a model that discovers the entire process by connecting the latest NLP-based process prediction model with powerful performance. In addition, by visualizing the discovery process, we propose a framework that allows consultants to more easily understand the results and put their trust in AI models. Through this, the process prediction model is continuously updated and reused, thereby contributing to the creation of a sustainable process discovery automation tool.
  • We propose an automated process discovery framework that can be used on actual industrial sites, such as smart factory consulting, which is difficult to define recent processes. The framework includes the overall flow to be studied in this paper and provides an appropriate pre-processing process for the event log datasets, the method of applying the discovery model, and the entire process in which the visualized insights are delivered to users. Based on this framework, we propose a process-monitoring system solution that can be used in various manufacturing fields.
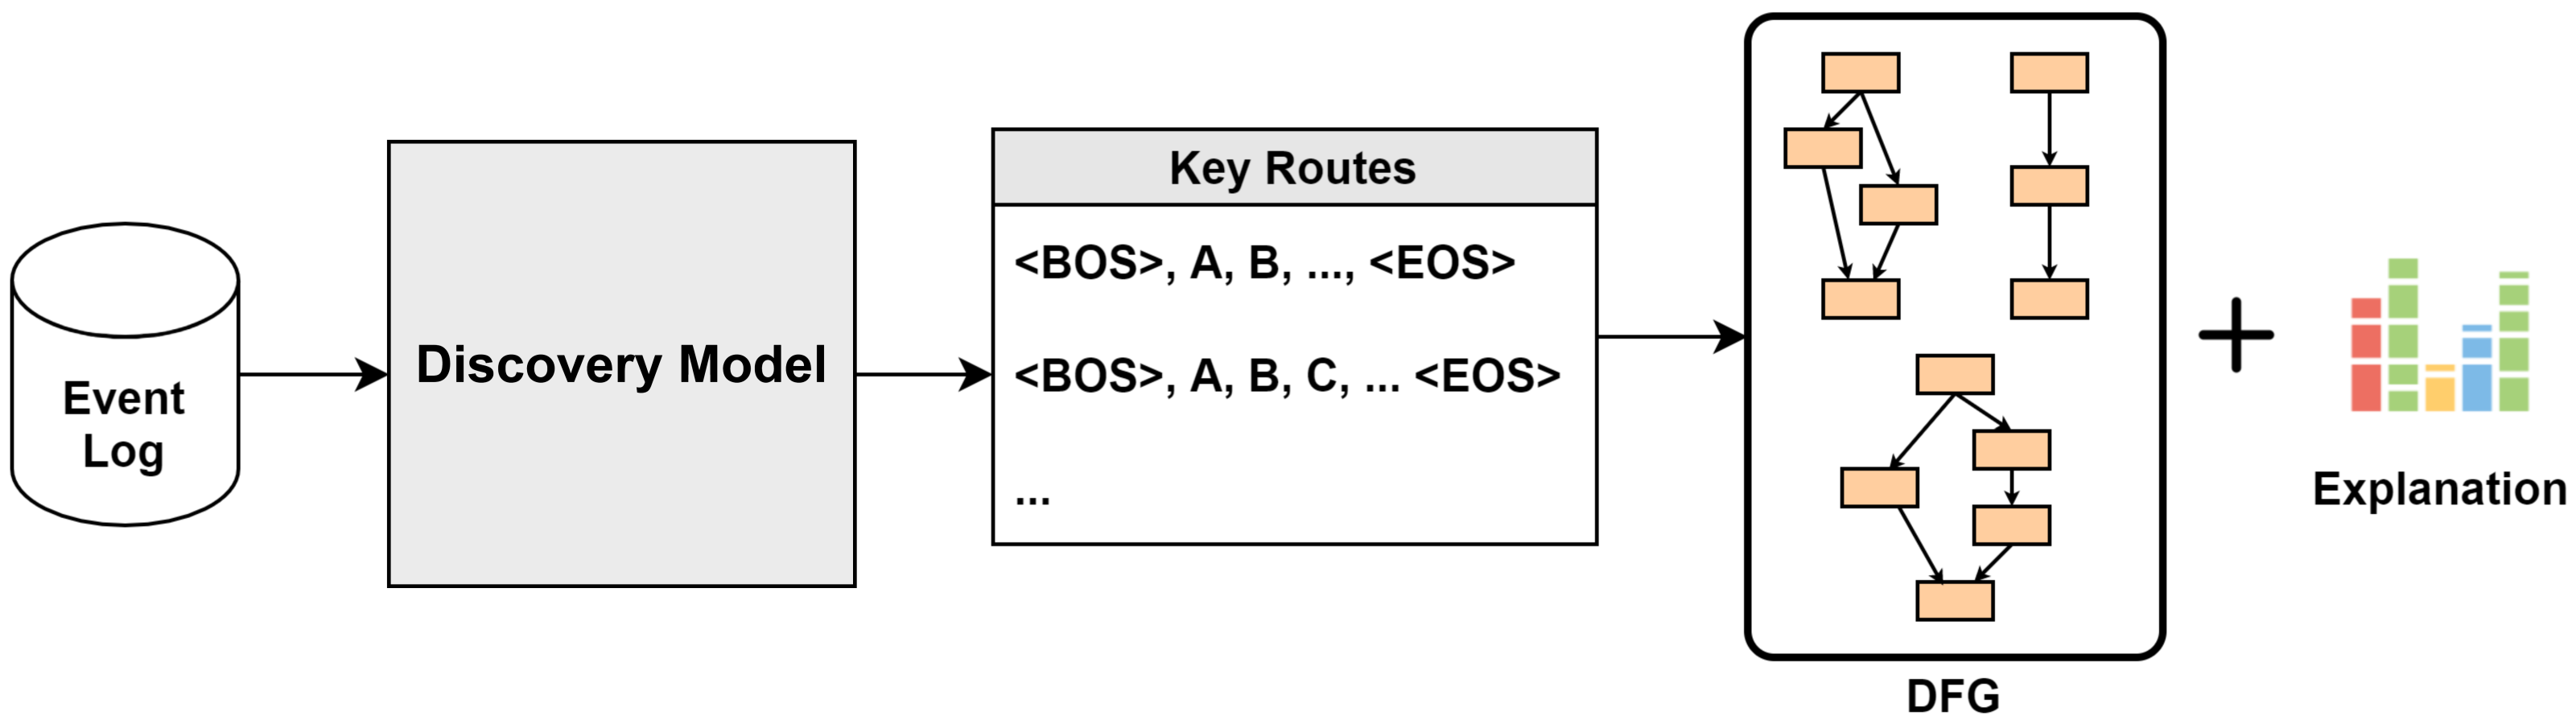
  • Previous studies have shown that the application of powerful natural language processing (NLP) to event logs can be effectively used to predict the next event and unearth the entire process [11]. In this study, the transformer model based on the attention mechanism was applied to event prediction in various industries, and excellent research results were obtained. In this study, we were not satisfied with the detailed event prediction, but we enabled automation of the discovery of manufacturing processes in the smart factory, and through this, we wanted to help provide a more sustainable and enhanced monitoring system by introducing an automated process discovery system to the existing monitoring system that has only depended on the manual work of consultants. First, using the event log, data preprocessing suitable for effective process discovery is performed. Data preprocessing is performed in a specific manner to increase the prediction precision of the model. Subsequently, we learn from the proposed process discovery model. In conclusion, including data preprocessing in the model improves the overall performance indicators and precision. Through the discovery model, a modified version of the generative pre-training of language model 2 (GPT-2), a transformer model based on full-attention mechanism linked to previous studies, is presented. This proves that the powerful performance of the model can be applied to process discoveries.
  • In addition, the model is explained using various techniques employed in eXplainable artificial intelligence (XAI), such as directly-follows graph (DFG) and local interpretable model-agnostic explanations (LIME). By explaining the model this way, it can be adopted as a meaningful indicator when consulting smart factory solutions. By visualizing the discovery process and deriving insights using the XAI technique, we want to help consultants, developers, and managers.
The remainder of this paper is organized as follows. Section 2 describes event logs, cases of process discovery in manufacturing, and existing studies related to NLP. Section 3 explains the components, approaches, and main ideas of the proposed discovery model in detail. Section 4 provides the experimental environment and visualizes the discovery process to derive meaningful insights. Finally, Section 5 concludes the paper with a summary, evaluation results, and future research directions.

2. Related Work

2.1. Event Log for Manufacturing

At industrial sites, various software solutions are used to perform efficient work. In particular, it is very important to utilize these solutions in the right place when establishing a detailed plan from a large flow of work through a business workflow. Software products typically record real-time event logs of actions performed. The entire process and details can be explained to the user in various ways by performing prediction, analysis, visualization, etc., on these event logs. This section describes event logs that can be used in process prediction studies. A growing number of solutions cover the manufacturing processes. This creates a large amount of raw process data that are logged every hour and stored in a database. Nevertheless, organizations still struggle to discover complete information from data [12].
If database records store the execution results of process instance logs, then process mining techniques can be used to discover data from the database. The main goal of process mining is to discover process-related information (e.g., the automatic discovery of process models) from event data. The first step in process discovery is mining the process model. Once the model is ready, one can re-run the events that occur to check its fit and discover bottlenecks [13]. In process mining terminology, events are characterized by various properties. Events contain properties that indicate their attributes. Thus, it can be seen that multiple event attributes are used in one event log in a tree-like structure. For example, an event has a timestamp, organizational resources that identify an executor, associated costs, roles, etc.. These properties allow us to predict the next event and improve the entire event log process. An event log consists of several cases, and one case is assigned to exactly one event log. In addition, a case is assigned to exactly one event among multiple events [14].
Each event must be associated with a case. If all the events in a case are listed in chronological order, then one can have a trace, which is a sequence of events in which each event appears once and does not decrease in time. Multiple cases can follow the same trace, but each case is different. An event log is defined as a set of traces. Theoretically, all processes occurring in the time dimension, including manufacturing activities, can have event logs stored in the database. All manufacturing activities performed on a product can be stored in a production order that includes both the required resources (machines, raw material quantity, turnaround time, etc.) and the execution time. Taking this into account, the terms activity and machine are used interchangeably. For example, there is part of an event log that contains three production orders, 1, 2, and 3, for each product A and B (considering that each PO order is related to only one product). The first study dealing with the problem of predicting the remaining case properties was proposed in [15].
This describes a framework for estimating the time remaining until a running case is completed in the log. Their approach was based on the discovery of conversion systems from event logs. In addition, a description has been added to the information on the past time of the case. Predictions were made using an abstraction of the system state and the ability to map the provided state to the corresponding predictive value. There has also been a study of the activities performed by future machines on process instances. In their work, clustering techniques were performed on log traces according to ‘context features’, and then a predictive model similar to that proposed by [15] was included in each cluster. Consequently, the method shows that applying process mining to the manufacturing event log can yield meaningful prediction results.
The problem of discovering the entire process is generally to predict events by considering the sequence and properties of past events of a specific process and connecting them to create an overall structure; thus, event logs, including past records, can be utilized appropriately. This study aims to predict and discover the entire process by analyzing logs generated by manufacturing software such as ERP and manufacturing execution systems (MES).

2.2. Process Discovery for Manufacturing

The manufacturing industry strives to increase the overall efficiency of factories and equipment to achieve better system integration, availability, maintenance, performance, quality, and various functions. In particular, it is important to standardize the process and predict the next activity in the ongoing process to ensure efficient plant operation in the production planning stage. The manager can identify the process flow through the standard process and compare it with the actual work to improve the process, which can be used to improve it. It can reduce bottlenecks that can occur in the process. The author of [16] proposes to discover a process that causes delay using a decision tree to make an efficient process, and proves that a consultant can help solve the bottleneck of the process. In addition, when consultants in the manufacturing industry provide a new solution, it takes a lot of time and resources to create and introduce a process outline due to the lack of existing process outlines for manufacturing companies. For such consultations, reliable data with strong performance and predictive accuracy are required. In addition, it is necessary to further enhance the reliability by visualizing the derivation process of these data. A general AI-based process discovery model has black box characteristics [17]. This black-box characteristic of artificial intelligence makes it difficult to build trust. Therefore, this study aims to provide a reliable source for consultants by simultaneously improving the performance of the process discovery model and visualizing the discovery process.
Currently, the combination of process discovery and consulting is in its infancy, and several related studies are being conducted. The author of [18] attempted to combine construction projects and process discovery. A powerful tool, process digging, is based on a digital record of the execution of an event called an event log [19]. Excavating processes in a construction project provide a simple and superior way to identify the causes of failures in a construction process in an effective manner. Based on this information, managers can make more formal decisions and take action to optimize the construction process for the environment. Process discovery is an innovative technology that connects data science with process management. In addition, from a control flow perspective, when event log data and process discovery are combined, multiple analyses, including process delay discovery, anomaly detection, and operational support, can proceed. Process discovery technology can comprehensively abstract and visualize real processes with high complexity, such as process diagnosis and tracking.
In Ref. [20], the latest research related to process discovery, proposes a specific framework that can relate process characteristics. It normalizes the process characteristics with derived information and discoves correlations between processes using decision trees. One of the outcomes obtained through the proposed correlation is the discovery of completion time. However, this method has low prediction accuracy based on decision trees, and to improve it, the author of [21] attempted to enhance the discovery accuracy by using machine learning techniques such as support vector regressors. Ref. [22] sought to discover various properties of a process using long short-term memory (LSTM). Despite these studies, the accuracy and performance of process discovery still require further improvement. This study intends to improve the performance of event prediction and process discovery, and to this end, an attention mechanism-based transformer model is used.

2.3. NLP Approach

2.3.1. Attention Mechanism

The attention mechanism was first proposed in [23] in 2014 and is a frequently used technique, especially in the field of NLP. Attention mechanism is a concept initially applied in the recurrent neural network (RNN) type of neural network architectures, but it has been proven that the technique provides high reliability for the performance improvement effect of models and decision-making results [24,25]. Recently, not only RNN-type neural network architectures but also convolutional network architectures (CNNs) have been developed [26]. Accordingly, in this research, the entire discovery model is constructed using an attention mechanism that helps to improve the predictive model performance in the NLP field.
In [23], where the attention mechanism was first proposed, as the translation performance of the Seq2Seq model, a neural network architecture previously used to perform machine translation, did not reach the human translation ability and encountered certain limitations. The attention mechanism is proposed under the assumption that the input string feature is in a context vector of fixed size [27]. The Seq2Seq architecture consists of an encoder that extracts features from an input string to create a fixed-size context vector, and a decoder that receives the context vector as input and translates it into another language system. However, there was a limitation in that all information on a number of words and strings should be compressed into a context vector of a fixed size even when the length of the string is very long. In the attention mechanism, when you want to translate a specific word in a string, you can focus on the word most closely related to the word you want to translate to the current decoder among the input strings; that is, perform attention. This alleviated the problem of the context vector, which has to compress all information [28].
In this section, the attention mechanism is explained in detail to help understand the excavation model proposed in this study. Figure 1 shows a schematic diagram of the Seq2Seq attention mechanism, where h t and s t correspond to the hidden layers of the encoder and decoder at time t, respectively, and y t , the translation result at that point in time, is outputted through the decoding process of s t .
In the decoding process, all hidden layers of the encoder are searched, and a high weight is assigned to the hidden layer that is most closely related to y t to be transformed at the current time. The method used to obtain the weight has been called “attention”, but the authors who first proposed the method suggested it as the alignment model. The alignment model used to obtain the weight is e I j = a s i 1 , h j and is expressed together. Here, e i j is the attention score of each h t calculated using the alignment model, and the corresponding weight is set using the softmax function like a i j = exp e i j / k = 1 T x exp e i k . The attention scores of h t s , which are of high importance in the translation of y t , are distributed. The weighted sum between a ij and h t , which is the weight obtained through the above process, is calculated as c i = j = 1 T x a i j h j , and the context is used by the decoder to perform the translation at that point in time. A vector c i is created Through this, the performance degradation problem due to the bottleneck of the Seq2Seq model mentioned above can be improved, and c i calculated through the attention mechanism is finally s i = f s i 1 , y i 1 , c i , which is used to create the hidden layer of the decoder.
Various methods may be used to perform the alignment model, that is, attention, which is a method for calculating e ij . In the manuscript that first proposed this technique, a feed-forward neural network with a single layer is used. Since this study was proposed, various methods have been recommended to calculate the attention score, among which the representative methods include the previously described Bahdanau attention [23] and Luong attention [8]. For an AI model to make a decision, the attention mechanism that proposes a method by which it finds a particular piece of information among the available information that should be the most focused, has been proven since it was first proposed in the architecture of RNN. Hence, it can be used in CNN-type architectures as well, and has been applied. An architecture such as Transformer, designed based only on the attention mechanism without a CNN or RNN layer, has been proposed and has contributed to significantly improving the performance of today’s NLP field. The transformer considers only the relationship between input and output data, and improves the existing method in which only the attention score of the output data and the input data can be calculated for the neural network model to perform the correct output at a specific point in time. A method to calculate the attention score called self-attention has been proposed [22]. Furthermore, in related research, the self-attention-based transformer, which is the basis of the prediction and excavation model proposed in this study, is considered.

2.3.2. Transformer

The transformer follows the encoder–decoder, which is the structure of the existing Seq2Seq and is a model implemented only with attention. The transformer does not use an RNN, but like Seq2Seq, the encoder–decoder structure receives an input sequence from the encoder and outputs an output sequence from the decoder. However, there is a difference that N units of the encoder and decoder can exist. If the existing Seq2Seq structure is a structure in which one RNN has multiple timestamps in the encoder and decoder in the transformer, the encoder and decoder are composed of N units. These transformer-based deep learning models have recently demonstrated excellent results in several language analysis and prediction tasks. In particular, embeddings from language models (ELMo) [29], OpenAI generative pre-training (GPT) [30], GPT-2 [31], and pre-trained models, such as bidirectional encoder representations from transformers (BERT) [32], have been proven to be superior.
Previous studies have shown that the advantage of using attention is that it can help interpret the decision process by showing how the model focuses on different parts of the input [33]. The previously described deep neural language model successfully generates contextual word representations and sensitive word vectors. In NLP, word embeddings are typically the mapping of words into contiguous vectors. Replacing word embeddings with contextual representations has significantly improved various NLP tasks, from answering questions to resolving correlations [30]. The contextual word expression suggests that the highly communicable and non-influenced properties of the language model are learned, even though they have only been trained with the language modeling task. By reflecting on the characteristics of these language models in the event properties, we intend to predict events and discover the entire process. Recently, with the growing popularity of process mining, certain studies have attempted to develop an automation tool that can discover process-related information from business documents using machine learning and NLP techniques [2]. In this study, machine learning and NLP-related tasks were reviewed and applied to process mining. Process mining has been extensively discussed in the literature and several tools and techniques have been developed.
Given the limitations of word embeddings in that there is no outline for actual sentences, a recent study attempted to create contextual word expressions [34]. ELMo, BERT, and GPT are deep neurolinguistic models that have been fine-tuned to create various models. In the NLP task, the internal representation of a word becomes a feature of the entire input sentence; therefore, it can be called a contextualized word representation. The success of this approach suggests superior communicative abilities and flexibility of a language. The communication capabilities and flexibility of this language model are suitable for application to complex and dynamically changing events, as processes are performed in the industry. ELMo creates a contextual representation of each token by linking the internal state of a two-layer biLSTM (two-way LSTM) trained in a bidirectional language-modeling task. By contrast, BERT and GPT are bidirectional and unidirectional transformer-based language models, respectively. Each transformer layer in BERT and GPT focuses on different parts of the input sentence to create a context-processed representation of each token. The basis of BERT and GPT-2 is a transformer model with a fully attention-based approach, unlike the existing sequence model based on an iterative architecture. The GPT-2 model achieved excellent results among several language-modelling benchmarks in a zero-shot setting. These models have achieved state-of-the-art performance in a variety of NLP tasks, from question answering to sentiment analysis. The main difference between ELMo, BERT, and GPT is that all the masking distributions have different directions [34].
In our previous research, we studied a business process prediction model using an NLP approach [11]. In this study, among the language models of the NLP approach, a model modified to predict the process of GPT-2, which is a one-way language model with strong performance, was proposed, and it showed strong predictive performance. Based on these results, we want to prove that it is feasible to construct detailed event prediction elements and discover the entire process. In this study, event prediction and process discovery were performed using GPT, which has exhibited strong performance in the field of natural language processing. We conclude that GPT is more suitable for event prediction than ELMo and BERT because GPT is a one-way language model. That is, GPT predicts the next event by considering the previous event that has already occurred. In general, the prediction process should consider previous events when fitting the next event. Because we solve the problem of fitting the next event by considering the previous event, we assume that information about the next event does not exist. As described above, BERT and ELMo check before and after an event, hence, they are suitable for predicting, analyzing, and monitoring the state of a specific process rather than predicting the next event. There are two ways to apply a pretrained linguistic representation of the model to actual work.
One is a feature-based method and the other is a fine-tuning method. ELMo is a feature-based method that can be expressed bidirectionally, from both left-to-right and right-to-left. However, the difference from BERT is that it learns from left to right and right to left, and then connects and uses them. BERT is a fine-tuning method and is currently a good model in various studies; however, pre-training using masking considers the events before and after the event to be predicted [32]. Therefore, the discovery model proposal and experimental procedure given in the subsequent section were performed by referring to GPT, a one-way language model suitable for the experimental method for process discovery.

3. Transformer-Based Process Discovery

An effective business process monitoring system should allow enterprises to delay, change and restart business processes. In addition, the factors contributing to the creation of optimal business processes can be seen directly or indirectly in management processes, operational processes and business process modeling support. Models can be reused for process management in a repository or a set of formed business processes. The efficiency of business processes useful for consultants can be seen in the process of linking activities according to the automated process discovery procedure. An attempt to judge compatibility or similarity in multiple complex process models and to review information management flows in process models can give consultants meaningful indicators [35]. Because event log data of the business process based on actual events exists, the data is used to evaluate the business process, and to discover the model of the business process, the event log is used as the starting element of the business process model analysis. The event log data of the search indicates the business process model that has occurred, and the activity of the data can be viewed through the event log data whether or not to follow the standard operational procedure (SOP). SOP is the basis for a company or organization to compose business activity. Establish and maintain business processes in accordance with SOPs and selected objectives. Match and compare the business process model for the event log with the SOP business process model to know how long the SOP was maintained.
The excavation process is one of the techniques for identifying and measuring the similarity of a set of business process models [36]. The similarity of business process models can be described by the similarity of text, structure and behavior [37]. Some problems with measurement methods arise when using worse data or AI models with lower accuracy. In particular, the black box characteristic does not explain the high performance of the model to the user. Despite its high performance, it is difficult to use in the actual field. In our proposed model, the process instant is predicted based on the structure and behavioral similarity of texts, and the entire process is discovered through the flow of sentences. And by visualizing and describing high-performance models, consultants build a foundation on which they can consistently trust the models. Data is not suitable for real-life problems caused by changes in complex environments, so it is often impossible to predict preferences with accurate numbers. We want to provide a way to make it happen. Additionally, we intend to contribute to creating a sustainable process discovery automation tool based on a continuously improved process model.
In this study, we attempted to discover a process using a natural language processing model. To discover a structured process that comprehensively expresses the entire event log, it is possible to discover key routes with high importance in the event log with a sequential generation method using a natural language processing model and visualize them with DFG to comprehensively explain the event log. A process model is derived. In addition, to provide a description of the behavior of the process, a modified GPT model with an added layer to reflect the attributes of the process was used, and information about the main attributes affecting the discovery process was provided. This process discovery model is grafted onto the manufacturing process and the process is derived as a framework. It also covers the model architecture in detail, starting with the data preprocessing.

3.1. Process Discovery Framework

In this section, the characteristics of the aforementioned unidirectional language model GPT, which considers the previous words as basis for guessing what the next word that will appear in the sentence, is applied to the process prediction method by considering the previous event and predicting the next event. In addition, we propose a framework for discovering the entire process by linking predicted events. The transformer-based process discovery model we are proposing is applied to the event prediction of a software product in which the process is defined. We propose a prediction method that transforms GPT-2, a transformer model, away from the classic multi-class classification problem, which was the existing process prediction model, and predicts based on various information by adding a number of attributes in addition to the text activity. In addition, an attempt was made to construct the entire workflow by utilizing NLP for process mining, and in particular, transformer-based models were given multiple properties that were not utilized in previous studies. Our previous work related to these predictions showed superiority in a number of indicators compared to other deep learning models. Furthermore, in this study, which brought the prediction process as a part of the entire excavation, the excellent performance of the prediction model was extended to a larger category and it was possible to explain it. Figure 2 illustrates the process discovery framework proposed in this study.
Figure 2 explains this study implicitly. The event log data generated from software products and solutions used in various industries were preprocessed according to the proposed model. Data pre-processing was performed by dividing the attributes and sequences discovered from the event logs. First, in the data preprocessing part of Figure 2, the attribute performs the work corresponding to the area 1. Numerical attributes, which are numeric data, are one-encoded by min-max scaling and categorical attributes consisting of characters. The sequence performs operations in Area 2 and tokenizes the sub-sequence. Subsequently, learning and testing were conducted using the proposed predictive model. The prediction procedure is described in detail in the Data Preprocessing section. It creates reliable added value by providing predictive results and discovery procedures to developers, managers, and consultants in a more detailed and visual manner. Through the visualization process, we attempted to create a natural language processing model that could be explained to the user. The process on which the output method is used based on the metal manufacturing process dataset is described in detail later.
The discovery model proposed in this study recognizes the activity name as a single word and completes the process, which is the entire sentence. Process discovery in process mining derives process models from event logs without prior information. Because deriving a model through discovery is essential for other areas of process mining, such as analysis and improvement, research on discovery methods that accurately reflect system behavior and changes is very important. In this research, instead of the statistical methods of existing process discovery methodologies, processes are sequentially created using a model modified from the natural language processing model GPT, which has excellent performance in procedural generation. In addition, we conducted an experiment to discover the key route of the process and visualized it as a process model. The experimental sequence is the preprocessing of the event log, training and testing of the model, creation of key routes, and visualization based on key routes.
When designing an algorithm for process discovery, trade-offs for the four factors of precision, generalization, overfitting, and underfitting must be considered. The two factors of precision and generalization are closely related to the parameter setting of the model in the course of the experiment, as overfitting and underfitting of the model occur as trade-offs. Figure 3 shows the working procedure of the case study conducted in this section. The working procedure consisted of the following steps. First, by learning the factory event log in the model, it learns the characteristics and sequence order of each attribute. Second, the key sequence, which is the main one, is discovered using the predictive model. Third, it provides a visualization to understand the overall process flow so that practitioners can intuitively understand the process model and the variables that are important in local prediction.

3.2. Discovery Model

The model used in this study is a GPT-based deep-learning model. The figures on the left and right in Figure 4 represent the GPT and the proposed model, respectively. b s is the batch-size input to the model, n seq is the length of the input sequence, n attr is the length of the input attribute, and n layer is the number of stacked decoder layers. Both models have the same structure, which receives a series of sequences and predicts which tokens have a high probability of appearing at each position in the sequence. In the case of the proposed model on the right side of the figure, an additional attribute linear layer (ALL) that receives input attributes is inserted into each decoder layer of the GPT so that the attributes of events can be reflected in the sequence of events.
Figure 5 shows the detailed structure of the decoder layer of the proposed discovery model. The decoder layer receives two input values for the input sequence and attribute. The input sequence passes through the input embedding layer and positional encoding before being inputted to the first decoder layer. In the input embedding, the input sequence is a layer that allows the token to have an implied meaning. The input embedding layer expands the input sequence of b s × n s e q dimension to b s × n s e q × d model dimensions. Positional encoding implies information regarding each position of the input sequence. It has the same d model dimension as the input embedding, and after finding the angle value for each position in the input sequence, finds the sin and cos values of the even and odd indices, respectively. Positional encoding is added to the input-embedding value. The input sequence proceeds through input embedding and positional encoding to imply the meaning of tokens and information on each position and is inputted to the first decoder layer.
The masked multi-head attention layer includes n head of scaled dot-product attention. Each scaled dot-product attention is calculated and executed as in Equation (1) for queries Q, key K, and value V.
Attention ( Q , K , V ) = softmax Q K T d k V
Q and K are d k dimensions, and V are d v dimensions. Q K T is the part that finds the similarity between query and key. If a token plays an important role, then each head learns to increase the dot-product value between them. This is divided by d k to scale. Masking is performed on scaled values. The decoder’s attention must refer to only the preceding words, hence, it includes masking that covers the following words: If masking is not performed, attention is obtained with tokens that will occur in the future. By applying the softmax function to the scaled and masked values and multiplying it by the value, the scaled dot-product attention value can be obtained.
The masked multi-head attention layer uses n head attention heads. Each attention head has different Q , K , and V weights, and each attention head is calculated. Then, the values of each attention head are collected and multiplied by a weight matrix to calculate the final masked multi-head attention layer output. This is the same as in Equations (2) and (3): The trainable weight matrices are W i Q , W i K , W i V R d m o d e l × d k , and W i o R h d k × d m o d e l .
MultiHead ( Q , K , V ) Concat = head 1 , , head n head W o
where head i = Attention Q W i Q , K W i K , V W i V
ALL is a layer to reflect attributes containing process information. It is a fully-connected Feed Forward Network (FFN) using three linear layers and a Rectified Linear Unit (ReLU) activation function that receives a b s × n attr dimension input and outputs a b s × n seq × d model dimension output.
A L L ( x ) = max 0 , x W 1 + b 1 W 2 + b 2 W g + b S
The trainable weights are W 1 R n attr × d attr , W 2 R d attr × d attr , W 3 R d attr × n seq × d model . d attr is the dimension of the linear layer of ALL. This output value is converted to the n s e q × d model dimension and has the same dimension as the output of the masked multi-head attention layer.
The ALL output was added to the residual block of the masked multi-head attention layer. A residual block is a structure that adds an input value to the output value of a layer, and it helps solve the vanishing gradient problem as the layer becomes deeper [38]. The added value goes through the layer normalization and dropout layers. The dropout probability p drop was set at 0.05 .
This value is used as the input for FFN. This layer consisted of two fully connected linear layers, an activation function ReLU, and a dropout layer. The FFN formula is given by Equation (5).
F F N ( x ) = max 0 , x W 1 + b 1 W Z + b 2
The FFN also has the same residual structure as the masked multi-head attention layer. The value obtained by adding the input and output of the FFN is the output of the decoder layer through layer normalization. The second and subsequent decoder layers use the input attribute and output value of the previous decoder layer as input values, and the output value of the last decoder layer is linearly transformed through the linear layer, as in the model proposed in Figure 4  b s × n s e q × d model dimension becomes bs × n seq × v o c a b _ s i z e ) dimension. This value was converted into a probability using the softmax function. Therefore, the corresponding output probability is the probability that each token in the vocabulary appears for each position in the sequence.
Figure 6 shows the key route creation procedure using the trained GPT model. In each iteration, the next token is discovered using the route created up to the previous point in time, and key routes are discovered in a recursive generation method that updates the tree. When the <‘<BOS>’> sequence is inputted into the model, the probability of tokens appearing in the second position is calculated. The next token is determined according to this probability, and the route determined thus far is inputted back into the GPT model to determine the next token. However, if the number of branches is infinitely increased to derive a process model that meets all conditions, the computation time is excessively high, and the ultimately derived process model may become a spaghetti process. Moreover, if the length of the routes is too short or the number of routes is too small, there is a risk that the event log will not be properly described. Therefore, to prevent these risks, we set up a discovery rule to discover routes of an appropriate number and depth. The spaghetti process is discussed later.
We established four discovery rules. The t h r e s h o l d is the value of the minimum probability that can be adopted as the next token when the sequence <‘<BOS>’, ‘A’, ‘A” C’, ‘C’> is input, the output is the probability of the ‘<EOS>’ token 0.4 and the probability of the ‘A’ token 0.5. Because the probabilities of both tokens are above t h r e s h o l d = 0.2 , the next node is generated from both tokens. m a x _ d e p t h is the maximum length of the route excluding special tokens such as ‘<BOS>’ and ‘<EOS>’. When <‘<BOS>’, ‘A’, ‘C’, ‘A’> is input, the probability of ‘C’ token is 0.91, which is above t h r e s h o l d . However, it did not create a node because m a x _ d e p t h = 3 . m a x _ l e a f _ p e r _ n o d e is the number of nodes that a node can create. When entering <’<BOS>’>, the probability of ‘A’ token is 0.3, the probability of ‘B’ token is 0.45, and the probability of ‘C’ token is 0.25, all above t h r e s h o l d and not exceeding m a x _ d e p t h . However, according to the m a x _ l e a f _ p e r _ n o d e = 2 rule, ‘C’ tokens with a relatively low probability are not generated as the next node. Finally, m a x _ l e a f _ t o t a l is the number of nodes that remain in the last iteration. In other words, m a x _ l e a f _ t o t a l is the maximum number of routes. In the example, m a x _ l e a f _ t o t a l = 5 , but the number of remaining nodes in ‘Iteration 3’, the last iteration, is 3; therefore, the rule is not violated.
In addition to the previous discovery rules, if the last token of a route is the ‘<EOS>’ token that means End of Sequence, the discovery of the route is unconditionally terminated. Therefore, in Figure 6, <‘<BOS>’, ‘A’, ‘C’, ‘<EOS>’>, <‘<BOS>’, ‘A’, ‘C’, ‘A’>, <‘<BOS>’, ‘B’, ‘C’, ‘<EOS>’> three routes are determined as key routes. The detailed procedure for discovering the next token in each iteration is as follows.
Figure 7 shows the flow used to discover the next token when creating a route. It creates sample attributes from the training dataset and inputs each into the same input sequence and model. Subsequently, soft voting on the output of the model determines the next token and updates the route in addition to the input sequence. Extracting multiple sample attributes and producing the results are based on the bagging (bootstrap aggregation) ensemble method. Bagging creates a final result by aggregating the weak prediction results obtained from the bootstrap sample resampled from the training dataset and has the advantage of producing a generalized output with relatively little variance.
Samples were extracted in different ways according to the characteristics of the attributes. Instead of using the bootstrap resampling method to directly restore and extract the data points from the training data, we employed a method of randomly generating sample data considering the distribution of each attribute. Gaussian sampling was performed for the numerical attributes. After determining the mean and variance of the corresponding attribute in the training dataset, n sample is extracted from the normal distribution that follows it. In the case of a categorical attribute, it is inappropriate to apply Gaussian sampling because it involves one-hot encoding. Instead, the samples were extracted according to the distribution ratio of each category in the training dataset.
Soft voting is applied to the output of each sample. Soft voting is a method used to aggregate the output together with hard voting. Hard voting is a method of selecting the most appropriate output among the outputs determined from each sample as the final result, and soft voting [39] is a method of selecting the class with the highest value by summing the probabilities of each output to be. Because the purpose is to discover a process model that can comprehensively explain the event log, we adopted a method of discovering a more generalized model through soft voting using resampling attributes as input values.

4. Experiment and Results

All experiments and evaluations in this study were performed on an NVIDIA Tesla V100 16 GB GPU and 52 GB RAM. PyTorch version 1.10 . 0 + cu 111 was used to build the NLP model. The training hyperparameters were set to 200 epochs, batch size 128, learning rate 10 5 , and the model hyperparameters were set to n layer = 8 , d model = 128 , d attr = 1024 , d f f = 1024 , n head = 8 . The trained model exhibited an accuracy of 0.7834 .

4.1. Datasets

The [40] datasets used in this study contain process data from the production process, including case data, activities, resources, timestamps, and other data fields. It is generally known that higher quality information from sensors in the process and critical equipment for plant control can improve plant operations and production planning [41]. In this scenario, providing a visualization of the history of a business process and leveraging event logs to predict the next activity to be executed in a business process are critical for providing valuable input data for work planning and resource allocation. Knowing in advance the next activity of a business process to be executed has a huge impact on proactively releasing or reserving resources to support work resiliency in manufacturing.
In [42], using these datasets, we considered event log preprocessing and predictive models in the context of event logs occurring in the Industry 4.0 domain, and predicted the time to the next activity or event through LSTM neural network implementation. In this research, by applying the proposed predictive model and architecture, each activity in the manufacturing process is recognized as a single word by using the event log that occurs in the Industry 4.0 domain, which is recognized as one sentence (process) using the NLP approach, and aims to introduce an approach to predicting the next event. The factory in the case study produces a variety of metal parts, such as drills, hinges, flanges, bearings, springs, ball nuts, discs, tubes, and wheel shafts. Products are produced through 28 machines or by hand and go through processes such as turning, milling, lapping, laser marking, and flat grinding. Table 1 lists some of the event logs of the processes that control the logic of the metalworking process plant. The full log can be found in [40].
In the activity of the datasets that can be checked in Table 1, the event and the machine where the event occurred were written together. Table 2 divides this into events and machines, and lists the number of occurrences and cases based on the event.

4.2. Data Pre-Processing

4.2.1. Sequence

The model uses the input sequence and input attribute as inputs. The input sequence is a series of events that occur in a case, and the input attribute is the value of an attribute that includes the event information. Because of the different characteristics of the two inputs, different pre-processing steps were applied. The input sequence consists of tokenization, special token insertion, subsequence extraction, and an encoding process.
Tokenization is the process of decomposing a series of sentences into meaningful words [43]. In this experiment, the token was defined as the name of the activity of the event and tokenized for each case. In the tokenized sequence, a special token was added to the front and rear. A special token is added to grammatically important positions, such as the beginning and end of text and breaking points in sentences. In this research, ‘<BOS>’ tokens (Beginning of Sequence) and ‘<EOS>’ tokens were inserted before and after the sequence, respectively. Figure 8 shows an example of applying the event log, in which two cases and five events are recorded to tokenize, insert a special token, and extract the subsequence. For the event log L = [<‘A’, ‘C’, ‘D’>, <‘A’, ‘B’>] in Figure 8, after tokenization, the special token is added as follows:
  • L S T = BOS , A , C , D , EOS , BOS , A , B , EOS
A subsequence is defined as a series of tokens connected from the <BOS> token of the sequence to each subsequent time-point. In the example of Figure 8, the subsequences extracted from <‘<BOS>’, ‘A ’, ‘C’, ‘D’, ‘<EOS>’>, which are the first elements of L S T , are <‘<BOS>’, ‘A’>, <‘<BOS>’, ‘A’, ‘C’>, <‘<BOS>’, ‘A’, ‘C ’,‘D’>, <‘<BOS>’. There are four of ‘A’, ‘C’, ‘D’, and ‘<EOS>’>. The model learns to predict the last token of each subsequence input in the training process, and learns the event occurrence pattern of the process.
Finally, the subsequences are encoded in a form that can be inputted into the model. First, we normalized the length of all subsequences to be the same and converted the tokens, which are character strings, into numbers. To match the length of the subsequences, each subsequence was increased to the maximum length among the sequences in L S T , and the insufficient length was filled with another special token ‘<PAD>’ token (Padding). The ‘<PAD>’ token is a meaningless token to match the length between subsequences, and even when it is inputted into the model, it is masked in the attention layer, so that its correlation with other tokens is not learned. To achieve this, we created vocabulary. Vocabulary is data that corresponds to different integers one-to-one to tokens, including special tokens, and is used to convert a sequence into an integer vector. The preprocessing of the subsequence is completed by replacing each token of the subsequence with an integer mapped to the vocabulary.
In the example of Figure 8, let us say that we encode <‘<BOS>’, ‘A’, ‘C’>, which is one of the subsequences, and the vocabulary is as shown in Table 3. The length of the longest sequence in L S T is 5. Thus, by inserting two ‘<PAD>’ tokens, a subsequence of length 5 becomes <‘<BOS>’, ‘A’, ‘C’, ‘<PAD>’, ‘<PAD>’>. ‘<BOS>’, ‘A’, and ‘C’ correspond to 1, 3, and 5, respectively. Therefore, the encoded results become <1, 3, 5, 0, 0>.

4.2.2. Attribute

Attributes representing process attributes are classified into categorical and numeric attributes. Categorical attributes have labels that cannot be numerically compared. This includes names, genders, and so on. Numerical attributes are those that have arithmetic values and can be compared with each other, such as height, age, and weight. Owing to the characteristics of the two types of attributes, they go through different pre-processing processes. In this paper, we propose a method of applying one-hot encoding to categorical attributes and min–max scaling to numerical attributes.
One-hot encoding is one of the main methods used to process categorical attributes. This method converts categorical attributes into binary vectors by enumerating labels of categorical attributes and assigning 1 and 0 to the corresponding label [30]. Figure 9 shows an example of one-hot encoding of categorical attributes. For attribute ‘Part Desc’ with multiple labels such as ‘Hinge’, ‘Ballnut’, and ‘Spring’, a column for each label was created, and 1 was assigned to the corresponding column and 0 to the remaining columns.
Min-max scaling is a linear transformation technique that can control the range of data while preserving the shape of the data distribution. For example, if there is a purchase quantity and price feature of an item, and if the quantity feature is 1 to 10 and the price feature is 1000 to 100,000, in this case, a difference of 1000 and 10,000 times may occur between each feature. Scaling was used to ensure that the value of each feature conformed to a certain range or rule. In this study, min-max scaling is applied to numerical attributes in the same way as in Equation (6).
x i = x i x min x max x min , where x i X
x is an arbitrary numerical attribute, and x is the min-max scaled value of x. Through Equation (6), the distribution of numerical attributes is normalized between 0 and 1. The MinMaxScaler class of scikit-learn 1.0.1 version was used to apply min-max scaling in the development and experimental stages.

4.3. Analysis of Visualization on Process Discovery

The DFG is a method used to visualize the process model. Compared with other visualization methods, the advantage is that it is based on an intuitive understanding. It is also the basis for applying other process discovery algorithms such as inductive miners. It is also used for process visualization in commercial process mining solutions such as disco and celonis. A node in the DFG represents each event, and an arc connecting two nodes indicates the relationship between the nodes. Compared with other process visualization models, DFG provides a quick, easy, and intuitive analysis. However, this method also has drawbacks [44]. Although information is provided by methods such as displaying the working time and frequency of occurrence on the arc connecting the nodes, it has the disadvantage of being weak in providing specific information compared with other models such as Petri nets and process trees. In addition, similar to other process models, there is a possibility of deriving a spaghetti process owing to noise in the event log or traces that occur less frequently than other traces.
Figure 10 shows an example of the spaghetti process, which expresses the entire log of the metalworking process datasets in the DFG. This is a visualization of the entire transition that occurred in the event log of 166 cases and 1083 events of the dataset. ‘Final Inspection’, ‘Deburring’, ‘Rework Miling’, ‘Fix EDM’, ‘Milling Q.C.’, ‘Change Version’, ‘Nitration Q.C.’ It can be said that events such as ‘Turning & Milling’ and ‘Laser Marking’ appear only once in the entire log and have relatively lower importance compared to events such as ’Turning & Milling’ and ’Laser Marking’ that appear more than 100 times. In the case of inter-event transition, even if it is a transition between events that appeared frequently, transitions such as ‘Turning & Milling’ from ‘Laser Marking’ and ‘Grind Rework’ from ‘Turning & Milling’ appeared only once among all transitions. In the Spaghetti Process in Figure 10, all these non-important events and transitions are expressed in nodes and arcs, preventing recognition of other important information and acting as a noise factor when applying process mining techniques. In summary, it is impossible to grasp what is important at once because an event or transition that occurs once or twice appears in the picture like an event or transition that appears hundreds of times, and it becomes noise when applying the technique.
The intuitive interpretation, which is the strength of DFG, is diluted, and it is difficult to grasp information about the process, except for the starting and ending points. Also, the spaghetti process is an unstructured process, and there is a problem that only very limited process mining techniques can be applied [43]. To solve this problem, a discovery methodology that considers frequency, such as heuristic mining, was used. We aim to prevent the model from becoming an unstructured process by removing the low-frequency arc or using only certain data by filtering the event log according to the user’s needs.
Figure 11 shows the key routes created using the trained model with DFG. The discovery rules set t h r e s h o l d = 0.2 , m a x _ l e a f _ p e r _ n o d e = 3 , m a x _ l e a f _ t o t a l = 16 , and m a x _ d e p t h = 12 , which is the maximum length of a sequence in the entire event log. The number of sample attributes is set to n sample = 128 . Each node represents a process, the arc represents the direction of the event, and the number written with the arc is the probability of progressing from one event to another. A total of 16 key routes were derived, each representing a process and an arc representing the direction of the event. In the figure, it can be seen that <‘<BOS>’, ‘Turning & Milling’, ‘Turning & Milling QC’> proceeds the same, and loop occurs in <‘Turning & Milling’, ‘Turning & Milling QC’> have. This means that turning and milling and quality check (QC) processes often occur repeatedly.
Various variables determined during the manufacturing process have a significant effect on the progress of the process. In the case of workload, machine used, and product type, which are the variables given in the dataset, it can be inferred that each will be an important variable. If there is a lot of work, several works will be needed, depending on production capacity. This is because the production process of going through and the equipment to be inputted are different for each product to be produced. After deriving the key route and DFG, the process mining practitioner must find out which attribute of the model determines the next event in the given sequence. Owing to the characteristics of the proposed model, which is a black box model, the input attribute is changed and the way the score of each token changes is presented as a bar plot.
Figure 12, Figure 13 and Figure 14 show the probability of appearing as the next event for each event by changing the variables of workload, equipment used, and product type at a point of interest arbitrarily selected from the training dataset. Table 4 lists the selected interest points. The input sequence is the sequence of the corresponding point, and the target token is a token actually recorded in the log at the time next to the point of interest and becomes the target of the model output. The input attributes are the attributes of the point of interest.
Input the sequence and attribute in Table 4 to the model to discover the next token, but give each attribute a slight change and fix the remaining attributes and input sequence to check if there is any change in the output of the model. Among the three attributes, ‘Work Order Qty’, a numerical attribute, was changed at intervals of 0.1 from 0 to 1, and the categorical attributes, ‘Machine’ and ’Part Desc’, were changed by each class within the category and the results were confirmed.
In Figure 12, as the amount of work increases, the probability that the target token ‘Turning & Milling Q.C’ will be discovered decreases, and the probability of discovering ‘Lapping’, ‘Turning & Milling’, ‘Grinding Rework’, and ‘Turning’ events will be discovered increases. As shown in Figure 13, it was confirmed that the equipment used did not significantly affect the prediction probability. When working on ‘Machine 27’, there was a high probability that the ‘Lapping’ event was discovered, but for most categories, the ‘Turning & Milling QC’ event, the target token, was most likely to be discovered. In contrast, in Figure 14, it can be confirmed that there is a significant difference depending on the product type. In summary, it can be confirmed that the attributes that have an important influence on the discovery at the point of interest in Table 4 are ‘Work Order Qty’ and ‘Part Desc’, and ‘Machine’ does not have a significant effect. Developers build a monitoring system by intensively highlighting necessary variables by using an index in which the variable of the point of interest assigned to the event attributes is changed by the absolute value of the regression coefficient. In addition, managers and consultants at industrial sites can check the relevant indicators to check the environment that has a major impact on the workflow of the manufacturing process, and modify the excavation algorithm to improve the process that needs improvement. That is, through the corresponding visualized graphs, important and insignificant attributes can be specified in the behavior of the process, and the target related to the important attribute can be managed intensively. It is necessary to utilize this in process modeling and corporate workflow consulting, and it can play an important role in raising the reliability of the automated process discovery system.

4.4. Results

4.4.1. Discovery Verification

Evaluate how well the discovered process matches the actual event log The evaluation index uses footprint comparison conformance checking, one of the conformance checking methods that is one of the main areas of process mining [45]. Footprint comparison conformance checking is a method of calculating Footprint conformance by creating a Footprint matrix that defines the relationship between events from each of the excavated process models and event logs, and comparing the ’Model Footprint Matrix’ with the ’Log Footprint Matrix’.
Four interrelationships exist between the events used to derive the footprint matrix. The first is the direct succession (>). This is a case in which an event appeared immediately after one event. The second relationship was causality (→). In this case, one event has a ‘>’ relation to another event, but the reverse is not true. The third is Choice. These were unrelated events. The last is parallel. In this case, one event has a ‘>’ relationship with another event, and vice versa. In other words, this case excludes causality from direct succession.
Footprint matrix F L of the event log and Footprint matrix F M of the process model became a matrix, indicating the relationship between each event. Therefore, F L and F M become ( v o c a b _ s i z e × v o c a b _ s i z e ) dimensional matrices. From the obtained footprint matrices, the footprint conformance is calculated using Equation (7). The number of relations is the number of elements in the footprint matrix, and the number of deviations is the number of relations that do not match at the same position in F L and F M .
Footprint Conformance = 1 Number of Deviations Number of Relations
Figure 15 shows Log Footprint Matrix and Model Footprint Matrix, respectively. Each row and column index is the tokens used in the model, that is, unique events and special tokens appearing in the event log. And the colors painted in each cell indicate the relationship between the events in the corresponding row and column.
For example, in both Log Footprint Matrix and Model Footprint Matrix, the relationship of A can be defined in each of the ‘Round Q.C’ event, ‘Round Grinding’, ‘Final Inspection Q.C’, and ‘Lapping’ event. As a result of calculating the footprint conformance using the footprint matrices in Figure 15 and Equation (7), the footprint conformance was calculated to be 0.7653, which means that the two footprint matrices match by approximately 76.53%.

4.4.2. LIME Verification

In this section, we identify the attributes that have an important influence on the model determining the next token in the key route discovery process and quantify the importance of the attributes confirmed by the process discovery process visualization in the previous section. LIME is a concrete implementation of a surrogate model used to explain the individual predictions of a machine-learning model [46]. LIME tests what happens to the output of the model when a transformation is applied to the input data.
LIME samples the data points, weighs them with an exponential smoothing kernel according to the distance between the points of interest and the sample datasets, and measures the importance of variables by fitting the sample datasets to the Lasso regression model through a linear regression model. As a sample dataset for applying LIME in the model presented in this paper, the sample attribute obtained in Section 4 is used, and the data points in Figure 12, Figure 13 and Figure 14 are used as the points of interest. For the implementation of the LIME algorithm, the logistic regression class of sklearn 1.0.1 version and the numpy version 1.19.5 package were used.
Figure 16 shows the results of applying LIME to the previously selected data point. In the case of Work Order Qty, it was −1.3154, which showed a large negative value. In the case of the machine, the relatively small negative value was −0.2973, and Part Desc showed the largest positive value. From the above results, the user will be able to obtain the following information about the behavior of the process at the point of interest. There is a high probability of proceeding to ‘Turning & Milling Q.C’ when the amount of work is small or the cable head process and the equipment used is not of great importance.

5. Conclusions

To introduce a process mining solution in a fluid and complex field, such as a manufacturing process, infrastructure resources for experts in the relevant domain are significantly consumed. In this study, we attempted to help companies save scarce domain expert resources through process discovery. Transformer-based GPT was used as an approach to perform process discovery, which is essential for process mining. If a labeled process name exists in the event log, it is possible to perform various tasks such as prediction, discovery, and monitoring in the field of process mining. Therefore, we treated the process name as text, performed natural language processing, and succeeded in predicting detailed events and discovering the entire process using a powerful transformer model. After learning the event log in GPT, an experiment was conducted to discover a process model that could represent the event log by creating a key route. Based on this, it is expected that it can be expanded to various fields such as production, quality, and service improvement in a smart factory environment by using it in various fields. In addition to manufacturing, by applying our sustainable process discovery automation model to various business process areas such as medical and banking, it can help consultants in the field who have only depended on manual work to build optimized processes more easily and conveniently.
In our discovery work, in the process discovery work of this paper, after calculating the log footprint matrix and the model using the natural language processing model, the footprint conformance, the agreement between the two, was used as a visualization material to build reliability as an evaluation index for model conformance. In addition, at one point in the process model, the attribute that had a major influence on the occurrence of a specific event was derived using LIME. Obtain a prediction token by inputting the input sequence of the interest point and the sampled input attribute, and train the Lasso logistic regression model weighted according to the distance between the sample and the interest point as a target label. The regression coefficient was calculated as the local attribute importance. In our model and dataset, we selected a few points of interest and verified the importance of each local attribute. Visualization of these data not only provide information about the current behavior of the system, but also identify and diagnose a more in-depth cause. Research on process prediction using process mining methods is gradually advancing, and as a result, AI model accuracy has steadily increased, but the interpretability of a fitted model, such as the relative importance of predictors or causal effects between processes, always evolves with it [47]. Although the prediction accuracy of artificial intelligence is gradually improving, it can be a problem if the consultant who uses the result does not gain credibility due to the black box characteristics of the intermediate process. The XAI-oriented process discovery procedure proposed in this paper can play a positive role in helping to solve such problems.
However, in the case of attribute sampling, categorical attributes were discovered according to the distribution within the training dataset, whereas in the case of numerical attributes, a Gaussian sampling method using the mean and standard deviation in the training dataset of each attribute was used. If sampling is performed considering the distribution of each numerical attribute, a more representative sample can be obtained. Also, each attribute is discovered independently. In other words, the interrelationships between attributes were not considered. For example, there is a risk that equipment types that are not used in a particular product type will be sampled at the same point. Therefore, in future research, the sampling that considers the correlation between the attributes of the training dataset may be attempted. In addition, our future work will involve delivering more accurate and detailed data to users through more detailed XAI processing. Thus, the reliability of process discovery has increased, and research related to process discovery is planned for the future.

Author Contributions

Conceptualization, J.M. and J.J.; methodology, J.M.; software, J.M. and G.P.; validation, J.M. and J.J.; formal analysis, G.P.; investigation, M.Y.; resources, J.J.; data curation, J.M.; writing—original draft preparation, J.M. and G.P. and M.Y.; writing—review and editing, J.J.; visualization, G.P.; supervision, J.J. project administration, J.J. All authors have read and agreed to the published version of the manuscript.

Funding

This work was supported by the National Research Foundation of Korea(NRF) grant funded by the Korea government(MSIT) (No. 2021R1F1A1060054) and the MSIT(Ministry of Science and ICT), Korea, under the ICT Creative Consilience Program(IITP-2021-2020-0-01821) supervised by the IITP(Institute for Information & communications Technology Planning & Evaluation).

Institutional Review Board Statement

Not applicable.

Informed Consent Statement

Not applicable.

Data Availability Statement

All data generated or analyzed during this study are included in this published article.

Conflicts of Interest

The authors declare no conflict of interest.

References

  1. Furstenau, L.B.; Sott, M.K.; Kipper, L.M.; Machado, E.L.; Lopez-Robles, J.R.; Dohan, M.S.; Cobo, M.J.; Zahid, A.; Abbasi, Q.H.; Imran, M.A. Link between sustainability and industry 4.0: Trends, challenges and new perspectives. IEEE Access 2020, 8, 140079–140096. [Google Scholar] [CrossRef]
  2. Li, J.; Wang, H.J.; Bai, X. An intelligent approach to data extraction and task identification for process mining. Inf. Syst. Front. 2015, 17, 1195–1208. [Google Scholar] [CrossRef]
  3. Pfeiffer, P.; Lahann, J.; Fettke, P. Multivariate Business Process Representation Learning utilizing Gramian Angular Fields and Convolutional Neural Networks. arXiv 2021, arXiv:2106.08027. [Google Scholar]
  4. Lugaresi, G.; Matta, A. Automated manufacturing system discovery and digital twin generation. J. Manuf. Syst. 2021, 59, 51–66. [Google Scholar] [CrossRef]
  5. Chambers, A.J.; Stringfellow, A.M.; Luo, B.B.; Underwood, S.J.; Allard, T.G.; Johnston, I.A.; Brockman, S.; Shing, L.; Wollaber, A.; VanDam, C. Automated Business Process Discovery from Unstructured Natural-Language Documents. In International Conference on Business Process Management; Springer: Cham, Switzerland, 2020; pp. 232–243. [Google Scholar]
  6. Neu, D.A.; Lahann, J.; Fettke, P. A systematic literature review on state-of-the-art deep learning methods for process prediction. In Artificial Intelligence Review; Springer: New York, NY, USA, 2021; pp. 1–27. [Google Scholar]
  7. Di Francescomarino, C.; Ghidini, C.; Maggi, F.M.; Petrucci, G.; Yeshchenko, A. An eye into the future: Leveraging a-priori knowledge in predictive business process monitoring. In International Conference on Business Process Management; Springer: Cham, Switzerland, 2017; pp. 252–268. [Google Scholar]
  8. Evermann, J.; Rehse, J.R.; Fettke, P. Predicting process behaviour using deep learning. Decis. Support Syst. 2017, 100, 129–140. [Google Scholar] [CrossRef] [Green Version]
  9. Mehdiyev, N.; Evermann, J.; Fettke, P. A novel business process prediction model using a deep learning method. Bus. Inf. Syst. Eng. 2020, 62, 143–157. [Google Scholar] [CrossRef] [Green Version]
  10. Baiyere, A.; Salmela, H.; Tapanainen, T. Digital transformation and the new logics of business process management. Eur. J. Inf. Syst. 2020, 29, 238–259. [Google Scholar] [CrossRef]
  11. Moon, J.; Park, G.; Jeong, J. POP-ON: Prediction of Process Using One-Way Language Model Based on NLP Approach. Appl. Sci. 2021, 11, 864. [Google Scholar] [CrossRef]
  12. Saura, J.R. Using data sciences in digital marketing: Framework, methods, and performance metrics. J. Innov. Knowl. 2021, 6, 92–102. [Google Scholar] [CrossRef]
  13. De Leoni, M.; van der Aalst, W.M.; Dees, M. A general process mining framework for correlating, predicting and clustering dynamic behavior based on event logs. Inf. Syst. 2016, 56, 235–257. [Google Scholar] [CrossRef]
  14. Philipp, P.; Georgi, R.X.M.; Beyerer, J.; Robert, S. Analysis of control flow graphs using graph convolutional neural networks. In Proceedings of the 2019 6th International Conference on Soft Computing & Machine Intelligence (ISCMI), Johannesburg, South Africa, 19–20 November 2019; pp. 73–77. [Google Scholar]
  15. Van der Aalst, W.M.; Schonenberg, M.H.; Song, M. Time prediction based on process mining. Inf. Syst. 2011, 36, 450–475. [Google Scholar] [CrossRef] [Green Version]
  16. Ferreira, D.R.; Vasilyev, E. Using logical decision trees to discover the cause of process delays from event logs. Comput. Ind. 2015, 70, 194–207. [Google Scholar] [CrossRef]
  17. Verenich, I.; Dumas, M.; La Rosa, M.; Nguyen, H. Predicting process performance: A white-box approach based on process models. J. Softw. Evol. Process. 2019, 31, e2170. [Google Scholar] [CrossRef] [Green Version]
  18. Pan, Y.; Zhang, L. Automated process discovery from event logs in BIM construction projects. Autom. Constr. 2021, 127, 103713. [Google Scholar] [CrossRef]
  19. Pan, Y.; Zhang, L. Roles of artificial intelligence in construction engineering and management: A critical review and future trends. Autom. Constr. 2021, 122, 103517. [Google Scholar] [CrossRef]
  20. De Leoni, M.; Van der Aalst, W.M.; Dees, M. A general framework for correlating business process characteristics. In International Conference on Business Process Management; Springer: Cham, Switzerland, 2014; pp. 250–266. [Google Scholar]
  21. Polato, M.; Sperduti, A.; Burattin, A.; de Leoni, M. Data-aware remaining time prediction of business process instances. In Proceedings of the 2014 International Joint Conference on Neural Networks (IJCNN), Beijing, China, 6–11 July 2014; pp. 816–823. [Google Scholar]
  22. Tax, N.; Verenich, I.; La Rosa, M.; Dumas, M. Predictive business process monitoring with LSTM neural networks. In International Conference on Advanced Information Systems Engineering; Springer: Cham, Switzerland, 2017; pp. 477–492. [Google Scholar]
  23. Bahdanau, D.; Cho, K.; Bengio, Y. Neural machine translation by jointly learning to align and translate. arXiv 2014, arXiv:1409.0473. [Google Scholar]
  24. Park, J.; Woo, S.; Lee, J.Y.; Kweon, I.S. Bam: Bottleneck attention module. arXiv 2018, arXiv:1807.06514. [Google Scholar]
  25. Woo, S.; Park, J.; Lee, J.Y.; Kweon, I.S. Cbam: Convolutional block attention module. In Proceedings of the European Conference on Computer Vision (ECCV), Munich, Germany, 8–14 September 2018; pp. 3–19. [Google Scholar]
  26. Vaswani, A.; Shazeer, N.; Parmar, N.; Uszkoreit, J.; Jones, L.; Gomez, A.N.; Kaiser, Ł.; Polosukhin, I. Attention is all you need. In Proceedings of the 31st Conference on Neural Information Processing Systems (NIPS 2017), Long Beach, CA, USA, 4–9 December 2017; pp. 5998–6008. Available online: https://proceedings.neurips.cc/paper/2017/file/3f5ee243547dee91fbd053c1c4a845aa-Paper.pdf (accessed on 20 November 2021).
  27. Sutskever, I.; Vinyals, O.; Le, Q.V. Sequence to Sequence Learning with Neural Networks. 2014. Available online: https://proceedings.neurips.cc/paper/2014/file/a14ac55a4f27472c5d894ec1c3c743d2-Paper.pdf (accessed on 5 December 2021).
  28. Chorowski, J.; Bahdanau, D.; Serdyuk, D.; Cho, K.; Bengio, Y. Attention-based models for speech recognition. arXiv 2015, arXiv:1506.07503. [Google Scholar]
  29. Peters, M.; Neumann, M.; Iyyer, M.; Gardner, M.; Clark, C.; Lee, K.; Zettlemoyer, L. Deep contextualized word representations. arXiv 2018, arXiv:1802.05365. [Google Scholar]
  30. Radford, A.; Narasimhan, K.; Salimans, T.; Sutskever, I. Improving Language Understanding by Generative Pre-Training. 2018. Available online: https://www.cs.ubc.ca/amuham01/LING530/papers/radford2018improving.pdf (accessed on 29 October 2021).
  31. Radford, A.; Wu, J.; Child, R.; Luan, D.; Amodei, D.; Sutskever, I. Language models are unsupervised multitask learners. OpenAI blog 2019, 1, 9. [Google Scholar]
  32. Devlin, J.; Chang, M.W.; Lee, K.; Toutanova, K. Bert: Pre-training of deep bidirectional transformers for language understanding. arXiv 2018, arXiv:1810.04805. [Google Scholar]
  33. Belinkov, Y.; Glass, J. Analysis methods in neural language processing: A survey. Trans. Assoc. Comput. Linguist. 2019, 7, 49–72. [Google Scholar] [CrossRef]
  34. Ethayarajh, K. How contextual are contextualized word representations? comparing the geometry of BERT, ELMo, and GPT-2 embeddings. arXiv 2019, arXiv:1909.00512. [Google Scholar]
  35. Klinkmüller, C.; Weber, I. Analyzing control flow information to improve the effectiveness of process model matching techniques. Decis. Support Syst. 2017, 100, 6–14. [Google Scholar] [CrossRef]
  36. Kuss, E.; Stuckenschmidt, H. Automatic classification to matching patterns for process model matching evaluation. In CEUR Workshop Proceedings; RWTH: Aachen, Germany, 2017; Volume 1979, pp. 306–319. [Google Scholar]
  37. Safitri, L.N.; Sarno, R.; Budiawati, G.I. Improving Business Process by Evaluating Enterprise Sustainability Indicators using Fuzzy Rule Based Classification. In Proceedings of the 2018 International Seminar on Application for Technology of Information and Communication, Kuala Lumpur, Malaysia, 23–25 July 2018; pp. 55–60. [Google Scholar]
  38. He, K.; Zhang, X.; Ren, S.; Sun, J. Deep residual learning for image recognition. In Proceedings of the IEEE Conference on Computer Vision and Pattern Recognition, Las Vegas, NV, USA, 27–30 June 2016; pp. 770–778. [Google Scholar]
  39. Zhou, Z. Ensemble Methods: Foundations and Algorithms; Chapman & Hall/Crc Machine Learning: New York, NY, USA, 2012. [Google Scholar]
  40. Levy, D. Production Analysis with Process Mining Technology. Dataset. 2014. Available online: https://data.4tu.nl/articles/dataset/Production_Analysis_with_Process_Mining_Technology/12697997/1 (accessed on 10 October 2021).
  41. Colombo, A.W.; Bangemann, T.; Karnouskos, S.; Delsing, J.; Stluka, P.; Harrison, R.; Jammes, F.; Lastra, J.L. Industrial cloud-based cyber-physical systems. Imc-Aesop Approach 2014, 22, 4–5. [Google Scholar]
  42. Tello-Leal, E.; Roa, J.; Rubiolo, M.; Ramirez-Alcocer, U.M. Predicting activities in business processes with LSTM recurrent neural networks. In Proceedings of the 2018 ITU Kaleidoscope: Machine Learning for a 5G Future (ITU K), Santa Fe, Argentina, 26–28 November 2018; pp. 1–7. [Google Scholar]
  43. Riedl, M.; Biemann, C. Using semantics for granularities of tokenization. Comput. Linguist. 2018, 44, 483–524. [Google Scholar] [CrossRef]
  44. Van Der Aalst, W.M. A Practitioner’s Guide to Process Mining: Limitations of the Directly-Follows Graph; Elsevier: Amsterdam, The Netherlands, 2019. [Google Scholar]
  45. Van Der Aalst, W. Data science in action. In Process Mining; Springer: Berlin, Germany, 2016; pp. 3–23. [Google Scholar]
  46. Ribeiro, M.T.; Singh, S.; Guestrin, C. “Why should i trust you?” Explaining the predictions of any classifier. In Proceedings of the 22nd ACM SIGKDD International Conference on Knowledge Discovery and Data Mining; Association for Computing Machinery: San Francisco, CA, USA, 2016; pp. 1135–1144. [Google Scholar]
  47. Ryo, M.; Angelov, B.; Mammola, S.; Kass, J.M.; Benito, B.M.; Hartig, F. Explainable artificial intelligence enhances the ecological interpretability of black-box species distribution models. Ecography 2021, 44, 199–205. [Google Scholar] [CrossRef]
Figure 1. Seq2Seq Attention.
Sustainability 14 01103 g001
Figure 2. Proposed Process Discovery Framework.
Sustainability 14 01103 g002
Figure 3. Working Procedures.
Sustainability 14 01103 g003
Figure 4. Schematic Diagram of GPT and the Proposed Model.
Sustainability 14 01103 g004
Figure 5. Detailed Structure of the Proposed Model Decoder Layer.
Sustainability 14 01103 g005
Figure 6. Key Route Creation Procedure and Discovery Rules.
Sustainability 14 01103 g006
Figure 7. Discovering the Next Token Through Attribute Sampling and Soft Voting.
Sustainability 14 01103 g007
Figure 8. Extract Subsequence from Trace in Event Log.
Sustainability 14 01103 g008
Figure 9. One-hot Encoding Process.
Sustainability 14 01103 g009
Figure 10. Example of Spaghetti Process.
Sustainability 14 01103 g010
Figure 11. Key Routes Expressed in DFG.
Sustainability 14 01103 g011
Figure 12. Change of Output According to ‘Work Order Qty’ Attribute in Interest Point.
Sustainability 14 01103 g012
Figure 13. Change of Output According to ‘Machine’ Attribute at Interest Point.
Sustainability 14 01103 g013
Figure 14. Change of Output According to ‘Part Desc’ Attribute at Interest Point.
Sustainability 14 01103 g014
Figure 15. Log Footprint Matrix and Model Footprint Matrix.
Sustainability 14 01103 g015
Figure 16. Importance by Attribute Quantified by LIME at Interest Point.
Sustainability 14 01103 g016
Table 1. Event Log Based on Manufacturing Datasets.
Case IDActivityResourceStart TimestampPart Desc
Case 1Turning & Milling—Machine 4Machine 4—Turning & Milling29 January 2012 23:24Cable Head
Case 1Turning & Milling—Machine 4Machine 4—Turning & Milling30 January 2012 5:44Cable Head
Case 1Turning & Milling—Machine 4Machine 4—Turning & Milling30 January 2012 6:59Cable Head
Case 1Lapping—Machine 1Machine 1—Lapping14 February 2012 0:00Cable Head
Case 1Lapping—Machine 1Machine 1—Lapping14 February 2012 9:05Cable Head
Case 1Round Grinding—Machine 3Machine 3—Round Grinding14 February 2012 9:13Cable Head
Case 1Round Grinding—Machine 3Machine 3—Round Grinding14 February 2012 13:37Cable Head
Case 1Final Inspection Q.C.Quality Check 116 February 2012 6:59Cable Head
Case 1PackingPacking17 February 2012 0:00Cable Head
Case 1
Table 2. The Number of Occurrences of Each Event and the Number of Cases Containing the Event.
Event NameFull Log Number of OccurrencesNumber of Cases with Events
Change Version11
Deburring11
Final Inspection11
Final Inspection Q.C.164122
Fix22
Fix EDM11
Flat Grinding4641
Grinding Rework1714
Lapping10985
Laser Marking119112
Milling65
Milling Q.C.11
Nitration Q.C.11
Packing128121
Rework Milling11
Round Q.C.21
Round Grinding9067
SETUP Turning & Milling33
Setup22
Turn & Mill. & Screw Assembly31
Turning1915
Turning & Milling168109
Turning & Milling Q.C172114
Turning Q.C.2417
Wire Cut22
Table 3. Examples of Vocabulary.
TokenID
<PAD>0
<BOS>1
<EOS>2
A3
B4
C5
D6
Table 4. Information of Interest Points Randomly Selected on Train Dataset.
Input Sequence[‘<BOS>’, ‘SETUP Turning & Milling’, ‘Turning & Milling’, ‘Laser Marking’]
Target Token‘Turning & Milling Q.C’
Input AttributeWork Order Qty 0.0451
MachineQuality Check 1
Part DescCable Head
Publisher’s Note: MDPI stays neutral with regard to jurisdictional claims in published maps and institutional affiliations.

