Abstract
Groundwater storage (GWS) in the Haihe River Basin (HRB), which is one of the most densely populated and largest agricultural areas in China, is of great importance for the ecosystem environment and socio-economic development. In recent years, large-scale overexploitation of groundwater in HRB has made it one of the global hotspots of GWS depletion. In this study, monthly GWS variations in HRB from 2003 to 2020 were estimated using the Gravity Recovery and Climate Experiment (GRACE) and GRACE Follow-On (GRACE-FO) data in combination with three land surface models (LSMs) from the Global Land Data Assimilation System (GLDAS). The results show the following: (1) HRB suffered extensive GWS depletion from 2003 to 2020, which has been aggravated since 2014, with a mean rate of 1.88 cm·yr−1, which is equivalent to a volume of 6 billion m3·yr−1. The GWS depletion is more serious in the plain zone (−2.36 cm·yr−1) than in the mountainous zone (−1.63 cm·yr−1). (2) Climate changes are excluded from the reasons for GWS depletion due to annual precipitation and evaporation being close to normal throughout the period. In addition, GWS changes show a low correlation with meteorological factors. (3) The consumption of groundwater for irrigation and land use/cover changes have been confirmed to be the dominant factors for GWS depletion in HRB. (4) The effects of inter-basin water transfer projects cannot be obviously observed using the GRACE and GRACE-FO; more inter-basin water transfers are needed for recovering the GWS in HRB. Therefore, it is imperative to control groundwater exploitation and develop a more economical agricultural irrigation structure for the sustainability of groundwater resources in HRB.
1. Introduction
Groundwater, the third largest water storage after the ocean and the cryosphere, is the world’s largest freshwater resource for agriculture, industry, public supply, and ecosystems [1,2]. However, some regions consume more groundwater than is recharged, causing groundwater storage (GWS) depletion [3]. In the past several decades, GWS depletion has occurred in many areas throughout the world, such as in north China [4], northwest India [5], and the Central Valley in the United States [6]. Globally, the magnitude of GWS depletion may be so large that it has become a measurable contributor to rising sea levels. GWS depletion has already caused some negative geological impacts on the environment, such as groundwater funnels, land subsidence, soil salinization, seawater intrusion, groundwater quality deterioration, and, in some cases, ecosystem degradation [7,8,9,10]. However, the magnitude of GWS depletion is rarely assessed, particularly due to insufficient in situ groundwater observations [7]. In addition, it has been a long-term challenge to illustrate the influences of climate changes and human activities on GWS depletion [6,11]. Therefore, a more complete understanding of GWS depletion and its driving factors are of great importance for water resource sustainability [12].
Over the past decades, many methods have been developed for studying GWS changes. The most representative methods include the water table fluctuation method (WTF) [13], hydrological models [14,15], groundwater flow models [12,16], and satellite gravimetry [17,18,19]. The Gravity Recovery and Climate Experiment (GRACE) mission has provided information on changes in the earth’s gravity field with unprecedented accuracy since it was launched in March 2002 [3,20,21]. The gravity anomalies observed by GRACE are converted to monthly terrestrial water storage anomalies (TWSA) [22], which are the sum of all forms of water storage anomalies, including the snow, surface water, soil moisture, biomass water, and groundwater [21,23]. GWS anomalies (GWSA) could be isolated from TWSA with the help of auxiliary data using the water balance method [4]. Land Surface Models (LSMs) can simulate the exchange of water and energy fluxes at the Earth’s surface and atmosphere interface and have always been used in conjunction with GRACE data to calculate GWSA [24].
Over the past few decades, a growing number of studies have proven the potential of the joint use of GRACE data with LSMs for estimating GWS changes in many regions of the world [3,4,6,20,25,26,27]. Abou et al. found a good agreement between GWS changes from groundwater levels and GRACE data in the Bakhtegan Catchment, Iran [28]. Chen et al. obtained TWSA over the Songhua River Basin from 2003 to 2013 using a generalized three cornered hat method using GRACE data, reconstructed the monthly TWSA data during 1982–2002 using an artificial neural network, and revealed that the GWS decreased at a rate of 1.04 ± 0.59 mm·yr−1 from 1982 to 1994 [29]. Furthermore, a recent review of monitoring GWS changes using GRACE data reported the method of assimilating GRACE data into hydrological models [30]. GRACE has made unique contributions to geodesy, hydrology, oceanography, and glaciology [31]. Therefore, following the decommissioning of GRACE in October 2017, the GRACE Follow-On (GRACE-FO) mission was launched in May 2018 in order to ensure continuity in the earth gravity measurements. GRACE/FO is used as a combination of GRACE and GRACE-FO in the following.
The Haihe River Basin (HRB), a momentous political, economic, and cultural center, relies heavily on groundwater resources due to the shortage of surface water resources. According to the Ministry of Water Resources of China [32], more than 70% of fresh water comes from groundwater in HRB. Meanwhile, HRB is one of the regions where water resources’ supply seriously contradicts water resources’ demand. In recent years, large-scale overexploitation of groundwater in HRB had made it one of the global hotspots of GWS depletion [33]. GWS depletion has changed the water circulation conditions and caused a series of ecological environment problems in HRB [34]. Therefore, scientific analysis and a better understanding of the spatial-temporal patterns of GWS depletion in HRB is of great significance for the regional ecological environment and socio-economic development.
Although prior studies have been conducted in terms of GWS depletion in HRB, on one hand, these studies do not compare the results from different data combinations and do not consider the effects of climate changes and human activities systematically; on the other hand, the time periods of these studies are not long enough to reveal the impacts of the South to North Water Diversion Project (SNWDP) on GWS. Therefore, the aims of this study are to (1) estimate the GWSA time series in HRB based on the two latest GRACE/FO datasets (one from the Center for Space Research and the other from the Jet Propulsion Laboratory) and three LSMs (CLSM, NOAH, and VIC) from the GLDAS; (2) compare the GWS changes among different GRACE/FO data and LSMs data combinations; (3) evaluate the consistency of GWS depletion based on the GRACE/FO and LSMs with in situ data; (4) clarify the spatial-temporal patterns of GWS depletion in different subzones of HRB; and (5) illustrate the responses of GWS changes to climate changes and human activities.
2. Materials and Methods
2.1. Study Area
Haihe River Basin (HRB) is located between 112°–120°E and 35°–43°N with an area of about 31.8 × 10⁴ km2. HRB is a political, economic, and cultural center, adjacent to the Bohai Sea in the east, Yellow River in the south, Taihang Mountain in the west, and the Inner Mongolia Plateau in the north. According to the administrative division, HRB covers Beijing City, Tianjin City, most of Hebei Province, part of Shandong Province, Henan Province, Shanxi Province, Inner Mongolia Autonomous Region (Neimeng), and Liaoning Province (Figure 1).
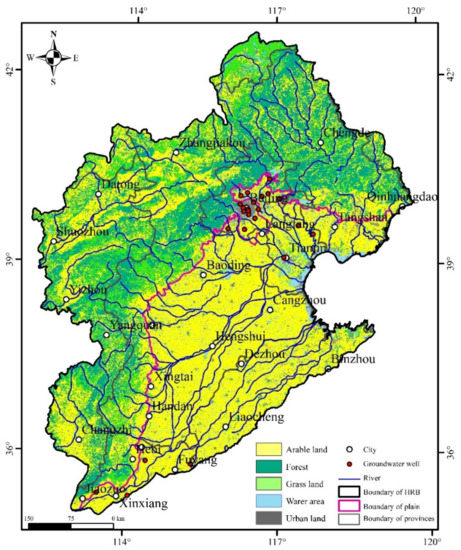
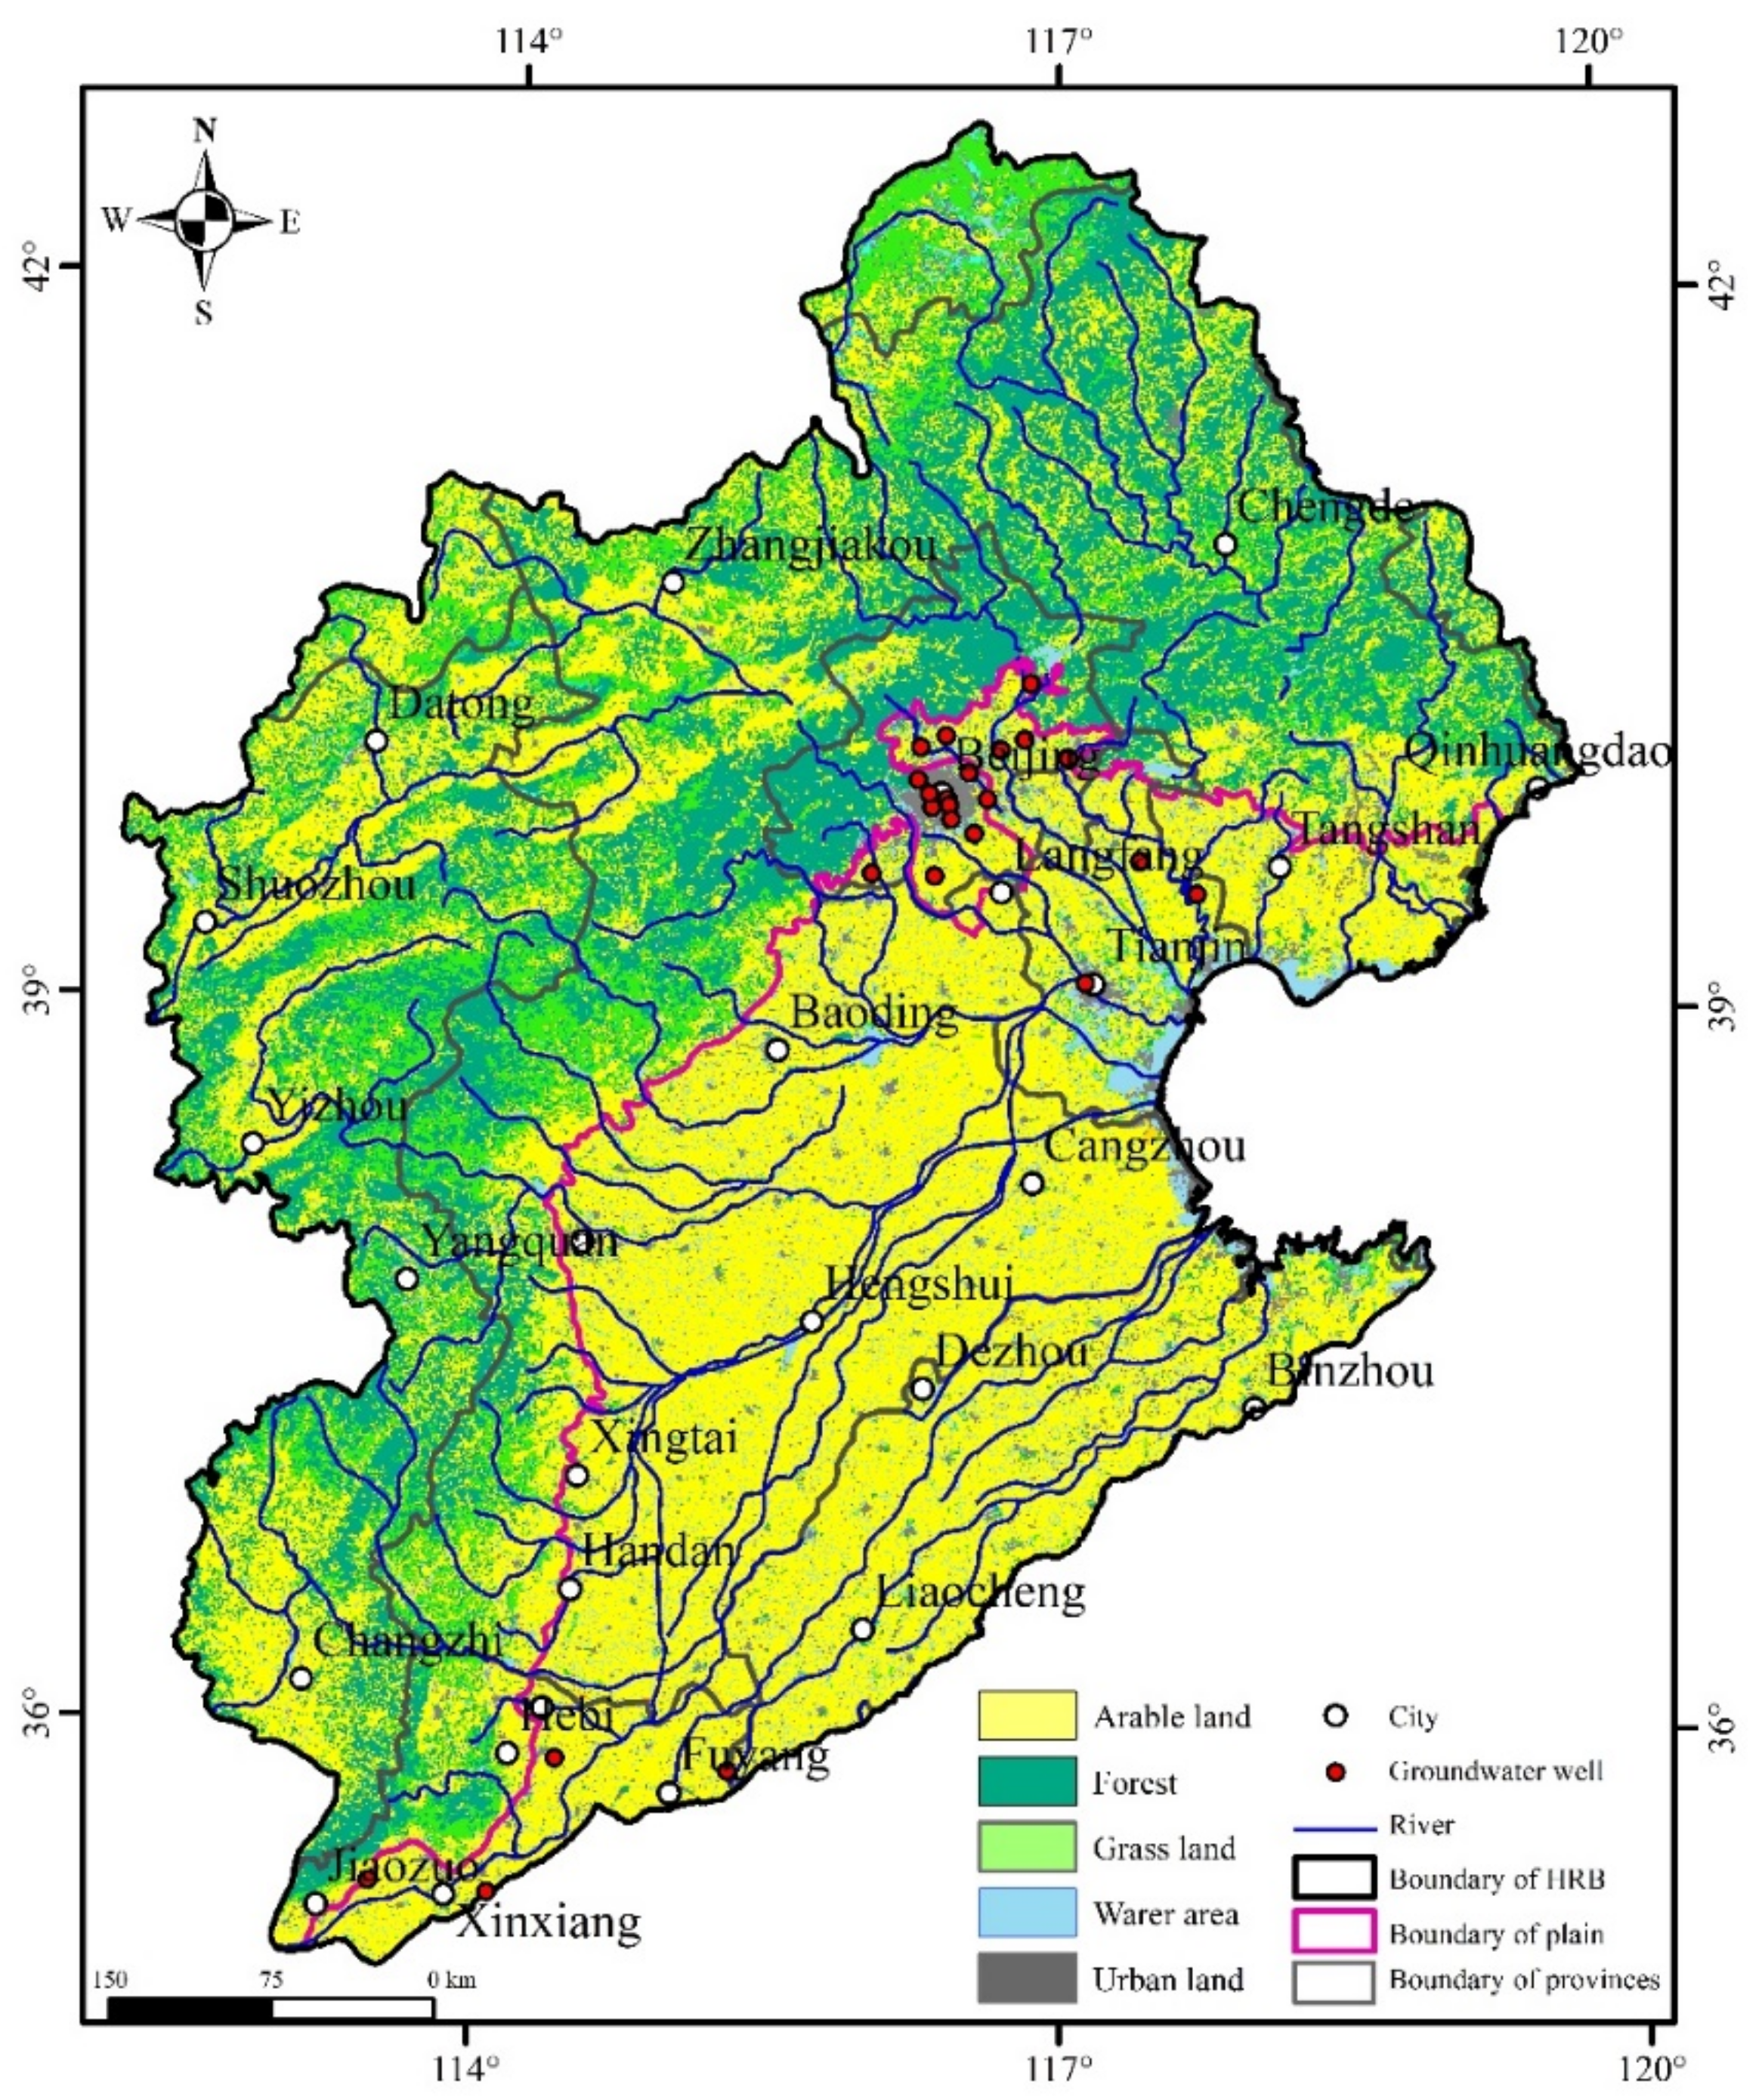
Figure 1.
Land use map of Haihe River Basin (this map is the average data of the years 2000, 2005, 2010, 2015, and 2020. These remote sensing data are from the Resource and Environment Science and Data Center).
HRB has a typically semi-humid and semi-arid continental monsoon climate. Affected by the continental air mass of Mongolia, the temperature of spring rises quickly with high winds and strong evaporation. Influenced by the marine air mass, it is humid in summer, with high temperatures and precipitation. Autumn brings less precipitation, and winter is controlled by the Siberian continental air mass with less snow. The annual average temperature is 1.5–14 ℃, and the annual average relative humidity is 50–70%. The annual average precipitation is 535 mm, with over 70% of precipitation falling in the summer months of June to August, and annual average surface evaporation of 850–1300 mm [34].
There are the following three river systems in HRB: Haihe River System, Luanhe River System, and Tuhaimajiahe River System. As the biggest, the Haihe River system contains Jiyun River, Chaobai River, Beiyun River, and Yongding River in the northern part, and Daqing River, Ziya River, and Zhangwei River in the southern part. The Luanhe River system and Tuhaimajiahe River system are in the northern and southern parts of HRB, respectively. As the largest land use type in the region, agriculture accounts for over 90% of the arable lands. In addition, over 70% of the arable lands are under continuous wheat–maize rotation farming. HRB grain production accounts for 10% of China's total grain production, including 30% of wheat production and 20% of corn production [35,36].
The bedrock of HRB consists of Archean gneiss and Proterozoic carbonate rocks overlain by thick Tertiary and Quaternary deposits. In a plain area, groundwater mainly occurs in Quaternary unconsolidated strata. The Quaternary aquifers in HRB are recognized as one of the world’s 37 large aquifer systems in the Worldwide Hydrogeological Mapping and Assessment Program (WHYMAP) [37]. The Quaternary aquifers in HRB consist of four major aquifer units: Holocene series (Q4), late Pleistocene series (Q3), middle Pleistocene series (Q2), and early Pleistocene series (Q1). Q4 is an unconfined aquifer, 40–170 m in depth, consisting of coarse-grained sand in the piedmont plain and fine-grained sand in the littoral plain. Q3 is a shallow confined aquifer, 120–70 m in depth, consisting of sandy gravel, and medium to fine sand. Q2 is a confined aquifer, 250–350 m in depth, consisting of sandy gravel in the piedmont plain, and medium to fine sand in the central and the littoral plains. Q1 is 400–600 m in depth and consists of cemented sandy gravel and a thin layer of weathered sand. Both aquifers Q1 and Q2 are the targets of exploitation.
Since the 1970s, rapid agricultural and industrial development has resulted in a great demand for water resources [33]. In 2000–2019, groundwater accounted for 81% of the total water supply in HRB, and 79%, 44%, and 83% in Beijing City, Tianjin City, and Hebei Province, respectively [38]. Groundwater in HRB has been in a state of unsustainable development. In the year 2000, 7.7 × 10⁹ m3 of groundwater was overexploited, of which 3.9 × 10⁹ m3 was from shallow groundwater and 3.8 × 10⁹ m3 was from deep groundwater, forming 60 × 103 km2 shallow groundwater overexploitation areas and 56 × 103 km2 deep groundwater overexploitation areas.
2.2. Data
2.2.1. GRACE/FO Data
There are two primary GRACE/FO datasets, the spherical harmonic coefficients (SHCs) and the mass concentration solutions (mascon). In this study, two versions of GRACE/FO mascon products, CSR-M (from the Center for Space Research) and JPL-M (from the Jet Propulsion Laboratory) were used to obtain the gridded TWSA. These mascon data are now developed to the 6th generation (RL06), which was recently released to minimize the common north–south striping errors and noises. CSR-M provides monthly TWSA data with a grid of 0.25° × 0.25° that are available from April 2002 to June 2017 for GRACE and from June 2018 to December 2020 for GRACE-FO [39]. TWSA are relative to the 2004-to-2009 mean baseline. CSR-M could be used without any post-processing. JPL-M provides monthly TWSA data with a grid of 0.5° × 0.5° with the same time span as CSR-M. JPL-M needs to multiply the scale factor to recover the leakage signals. In both products, the degree 2 order 0 coefficients have been substituted with more accurate estimations from satellite laser ranging (SLR) [40,41], and the degree 1 coefficient has been added [42]. Glacial isostatic adjustment (GIA) correction has been applied based on the model from Geruo et al. [43]. The leakage of continental hydrology is corrected following the method proposed by Chen et al. [44]. The missing GRACE/FO data are filled by using the cubic-spline interpolation.
2.2.2. Land Surface Models
The National Aeronautics and Space Administration (NASA) and National Oceanic and Atmospheric Administration (NOAA) jointly developed the Global Land Data Assimilation System (GLDAS). The land surface models (LSMs) in the GLDAS adopt advanced data assimilation technology to integrate satellite and ground observation data and can simulate the global distributions of land surface states/fluxes in real time. In this study, the monthly soil moisture content (SM), snow water equivalent (SWE), and total canopy water storage (CWS) from the following three LSMs were used as auxiliary data to estimate the GWSA: the Catchment Model (CLSM), NOAH Model (NOAH), and Variable Infiltration Capacity Model (VIC) from the GLDAS (v2.1). The simulated SM in the CLSM, NOAH, and VIC only hold representatives for the 343 mm, 200 mm, and 190 mm soils in depth. The time span ranges from January 2000 to December 2020 with a spatial resolution of 1° × 1°. In addition, evapotranspiration and precipitation flux were also used to calculate the regional evapotranspiration and precipitation.
2.3. Methods
2.3.1. GWSA Based on GRACE/FO and LSMs Data
GWSA can be isolated from TWSA derived by the GRACE/FO and other components estimated by auxiliary data using the following formula:
According to the statistical data from Haihe River Basin Water Resources Bulletins [38], the water storage in reservoirs and lakes are very small in HRB. Therefore, the surface water storage anomalies (SWSA) consist of SM anomalies (SMA), SWE anomalies (SWEA), and CWS anomalies (CWSA) in HRB. SMA, SWEA, and CWSA are obtained by subtracting the mean value of 2003–2020 from the original data. Due to the inconsistent spatial resolution between LSMs data and GRACE/FO data, LSMs data and GRACE/FO data are downscaled at a spatial resolution of 0.025°.
2.3.2. Time Series Decomposition
The time series is composed of seasonal signal, trend signal, and residuals based on the non-parametric STL (Seasonal-Trend decomposition procedure based on Loess) method.
The STL method is a robust and computationally efficient approach to detect non-linear patterns in trend estimates, based on a locally weighted regression [45]. The Mann-Kendall trend test with Sens’s slope estimator is a widely used non-parametric trend test for analyzing climatic, hydrological, and environmental time series data, used to assess the statistical significance of the trend signal in GWSA at the pixel scale.
2.3.3. Groundwater Storage Deficit Index
The monthly groundwater storage deficit (GWSD) is used to indicate the hydrological characteristics as follows:
where and represent the GWSD and GWSA for the jth month in the year I, and is the long term mean of GWSA for the jth month. A negative GWSD indicates that GWS is less than the normal value. GWSDI is the normalized GWSD by the zero mean normalization method as shown in the following Equation (4):
where and are the mean and standard deviation of GWSD time series, respectively.
2.3.4. Uncertainty Assessments
The TWSA uncertainty is based on the method proposed by Landerer and Swenson [46]. First, the linear trends and seasonal components were removed from TWSA to obtain the residuals. Then, the inter-annual signals were removed by fitting a 13-month moving average to the residuals. The root mean square (RMS) of the residuals approximated the uncertainty in TWSA. For SWSA, the uncertainty was estimated from the monthly standard deviation (STD) among the three GLDAS models. Considering the error propagation law during the least squares fit and uncertainties in TWSA and SWSA, the uncertainty in the GWSA was estimated by using the following equation:
3. Results
3.1. Total Water Storage and Surface Water Storage Variations in HRB
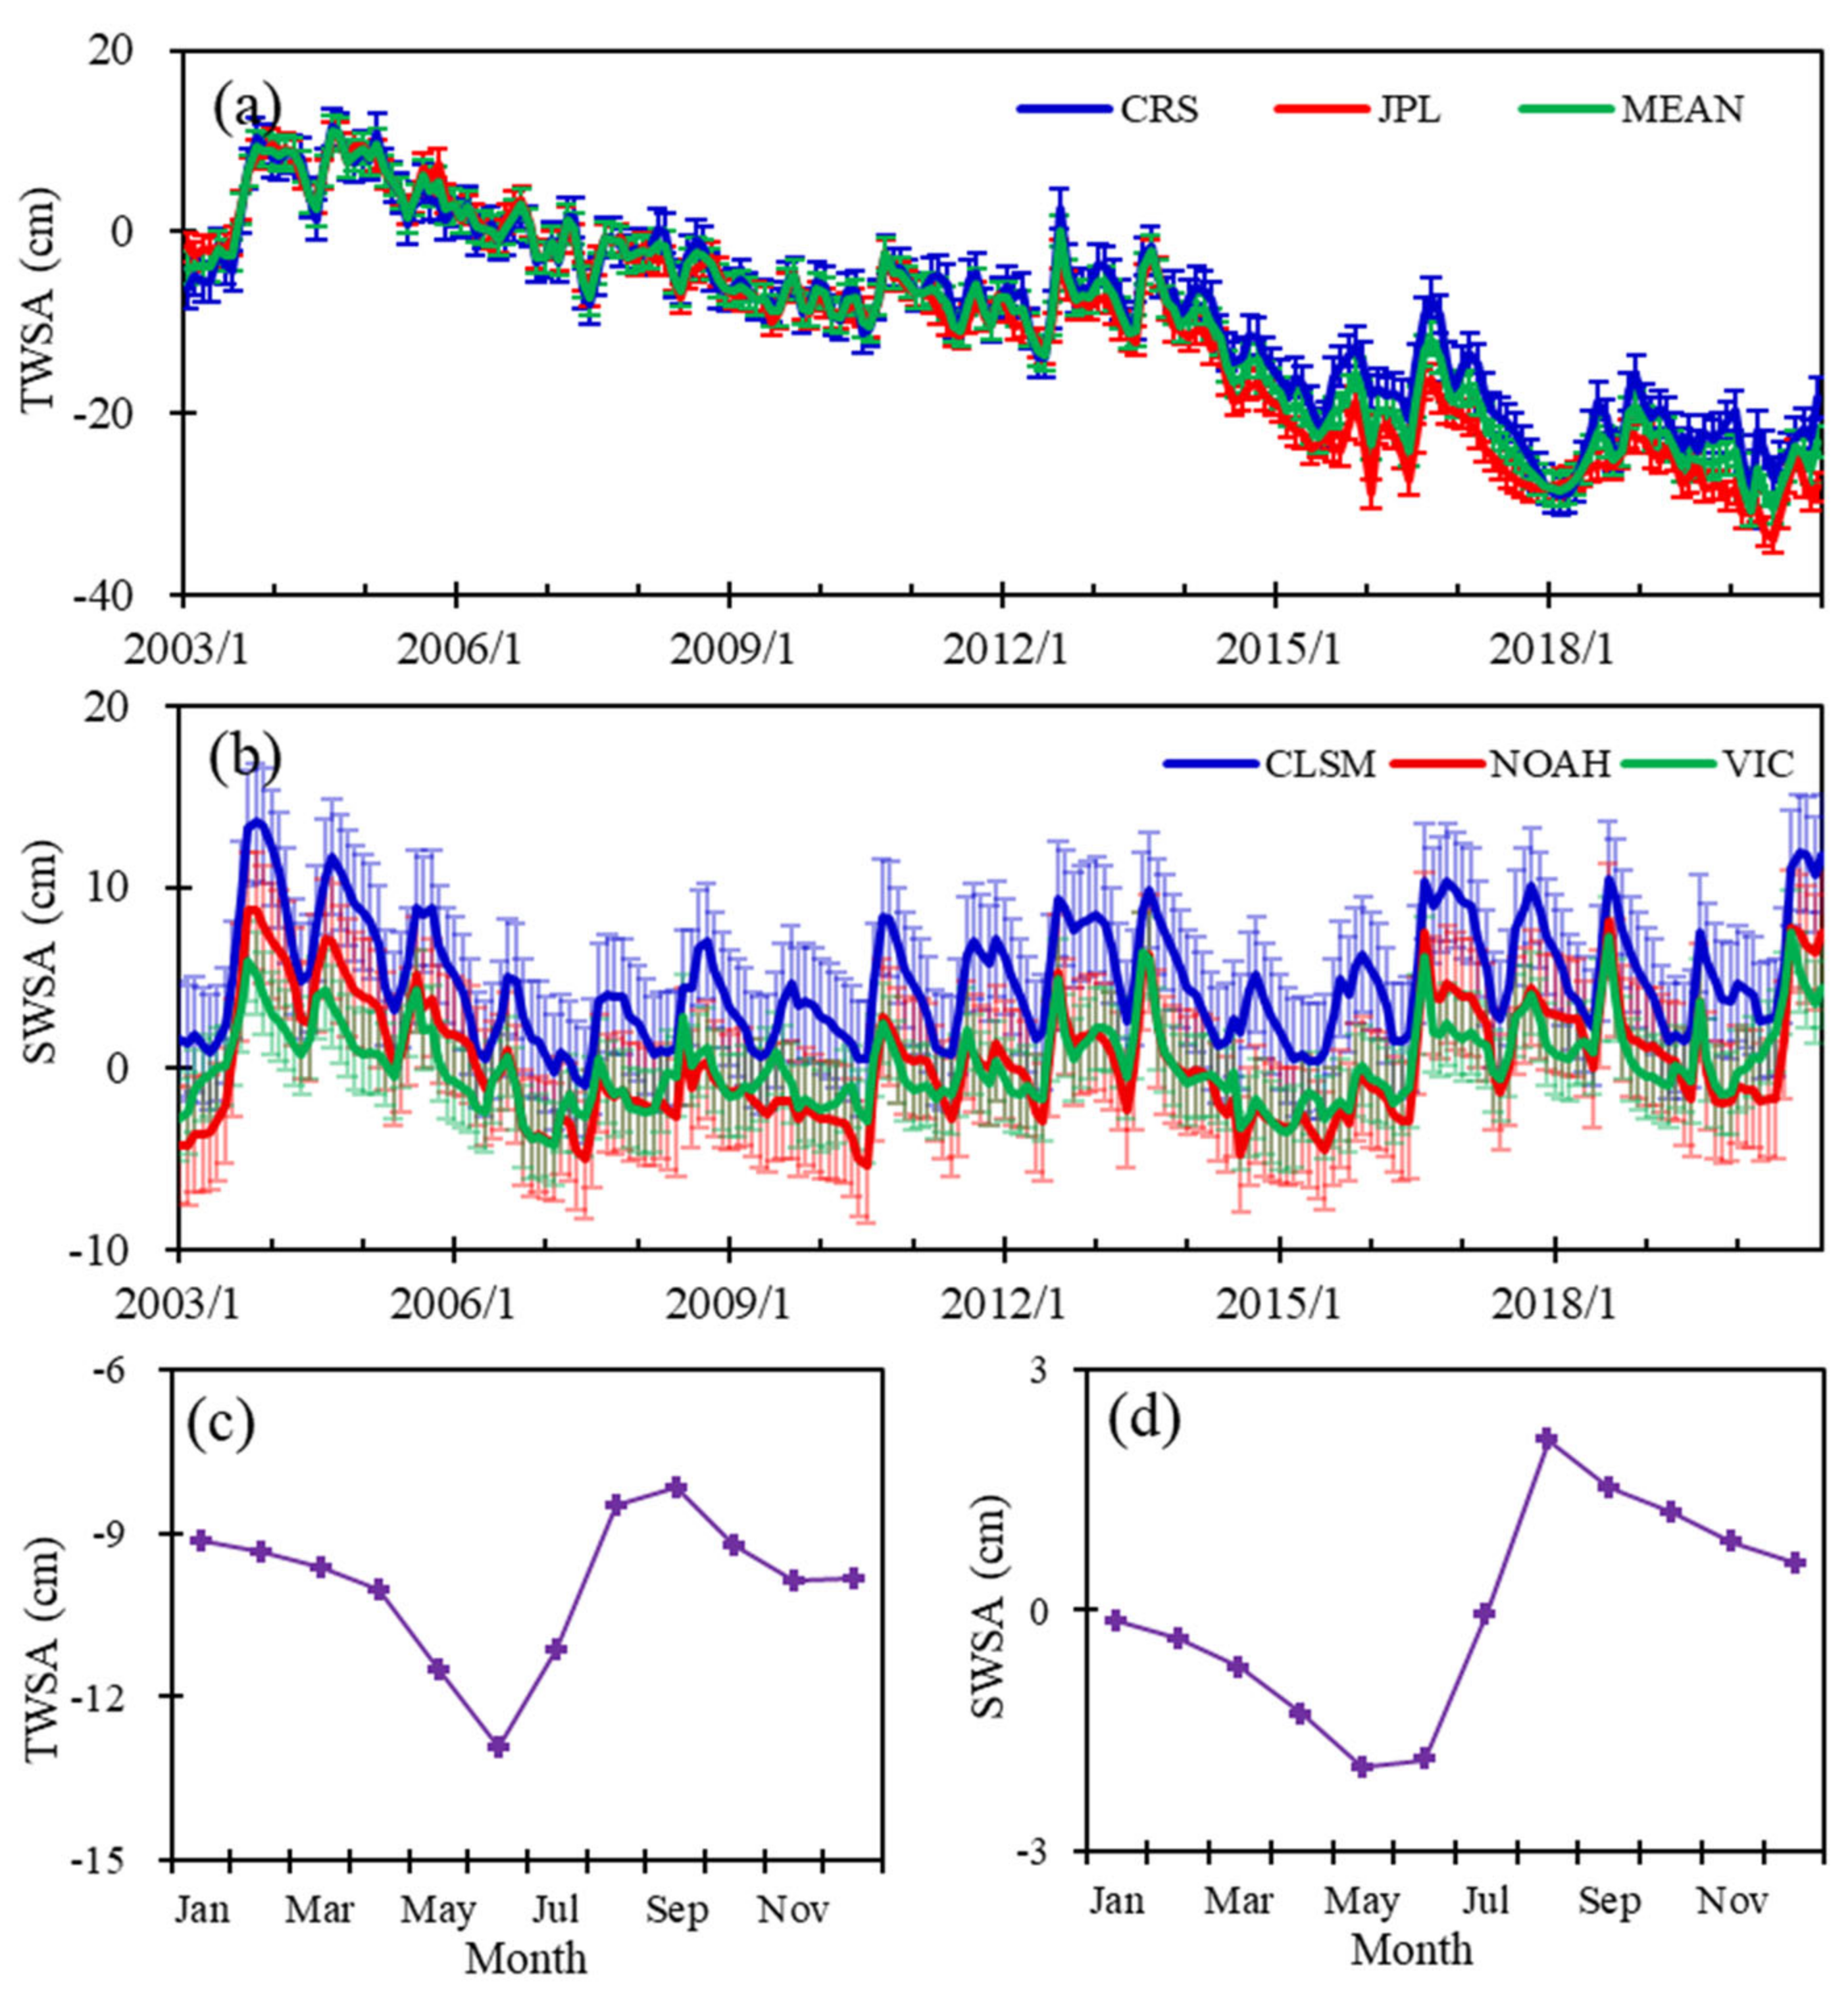
Figure 2a shows the monthly TWSA in HRB as the equivalent water heights in 2003–2020, obtained from two different GRACE/FO products. The TWSA derived from CSR-M and JPL-M are almost unanimous with slopes of 0.99 and 0.90 and R2 of 0.92 and 0.78 for 2003–2013 and 2014–2020, respectively. Overall, the slope between the TWSA derived from CSR-M and JPL-M is 0.82 with an R2 of 0.95 (Figure 3). Therefore, the TWSA refers to the mean of the TWSA based on JPL-M and CSR-M in the following. The monthly TWSA exhibits a decreasing trend at a rate of 1.92 cm·yr−1 from 2003 to 2020, with an uncertainty of 1.74 cm.
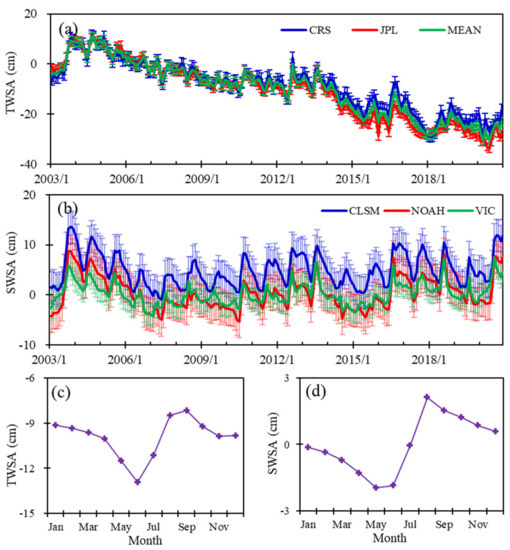
Figure 2.
Monthly variations of TWSA (a) and SWSA (b), and seasonal distributions of TWSA (c) and SWSA (d) in HRB.
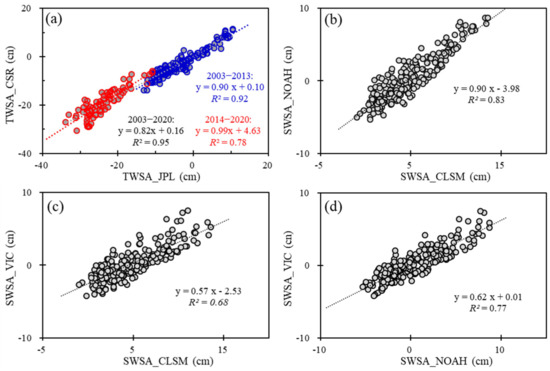
Figure 3.
The relationship between TWSA derived from CSR-M and JPL-M (a); SWSA derived from CLSM, NOAH, and VIC (b–d).
Compared with the TWSA, the SWSA obtained from LSMs show a non-significant increase or decrease trend from 2003 to 2020 with smaller amplitudes (Figure 2b). In addition, the monthly SWSA from the CLSM, NOAH, and VIC show obvious differences. The CLSM-estimated SWSA is larger than that estimated from NOAH and VIC (Figure 2b). The differences are mainly caused by the differences in the soil depths. The uncertainties of the SWSA are 3.19, 3.23, and 2.25 cm for the CLSM, NOAH, and VIC, respectively.
3.2. The Groundwater Storage Variations in HRB
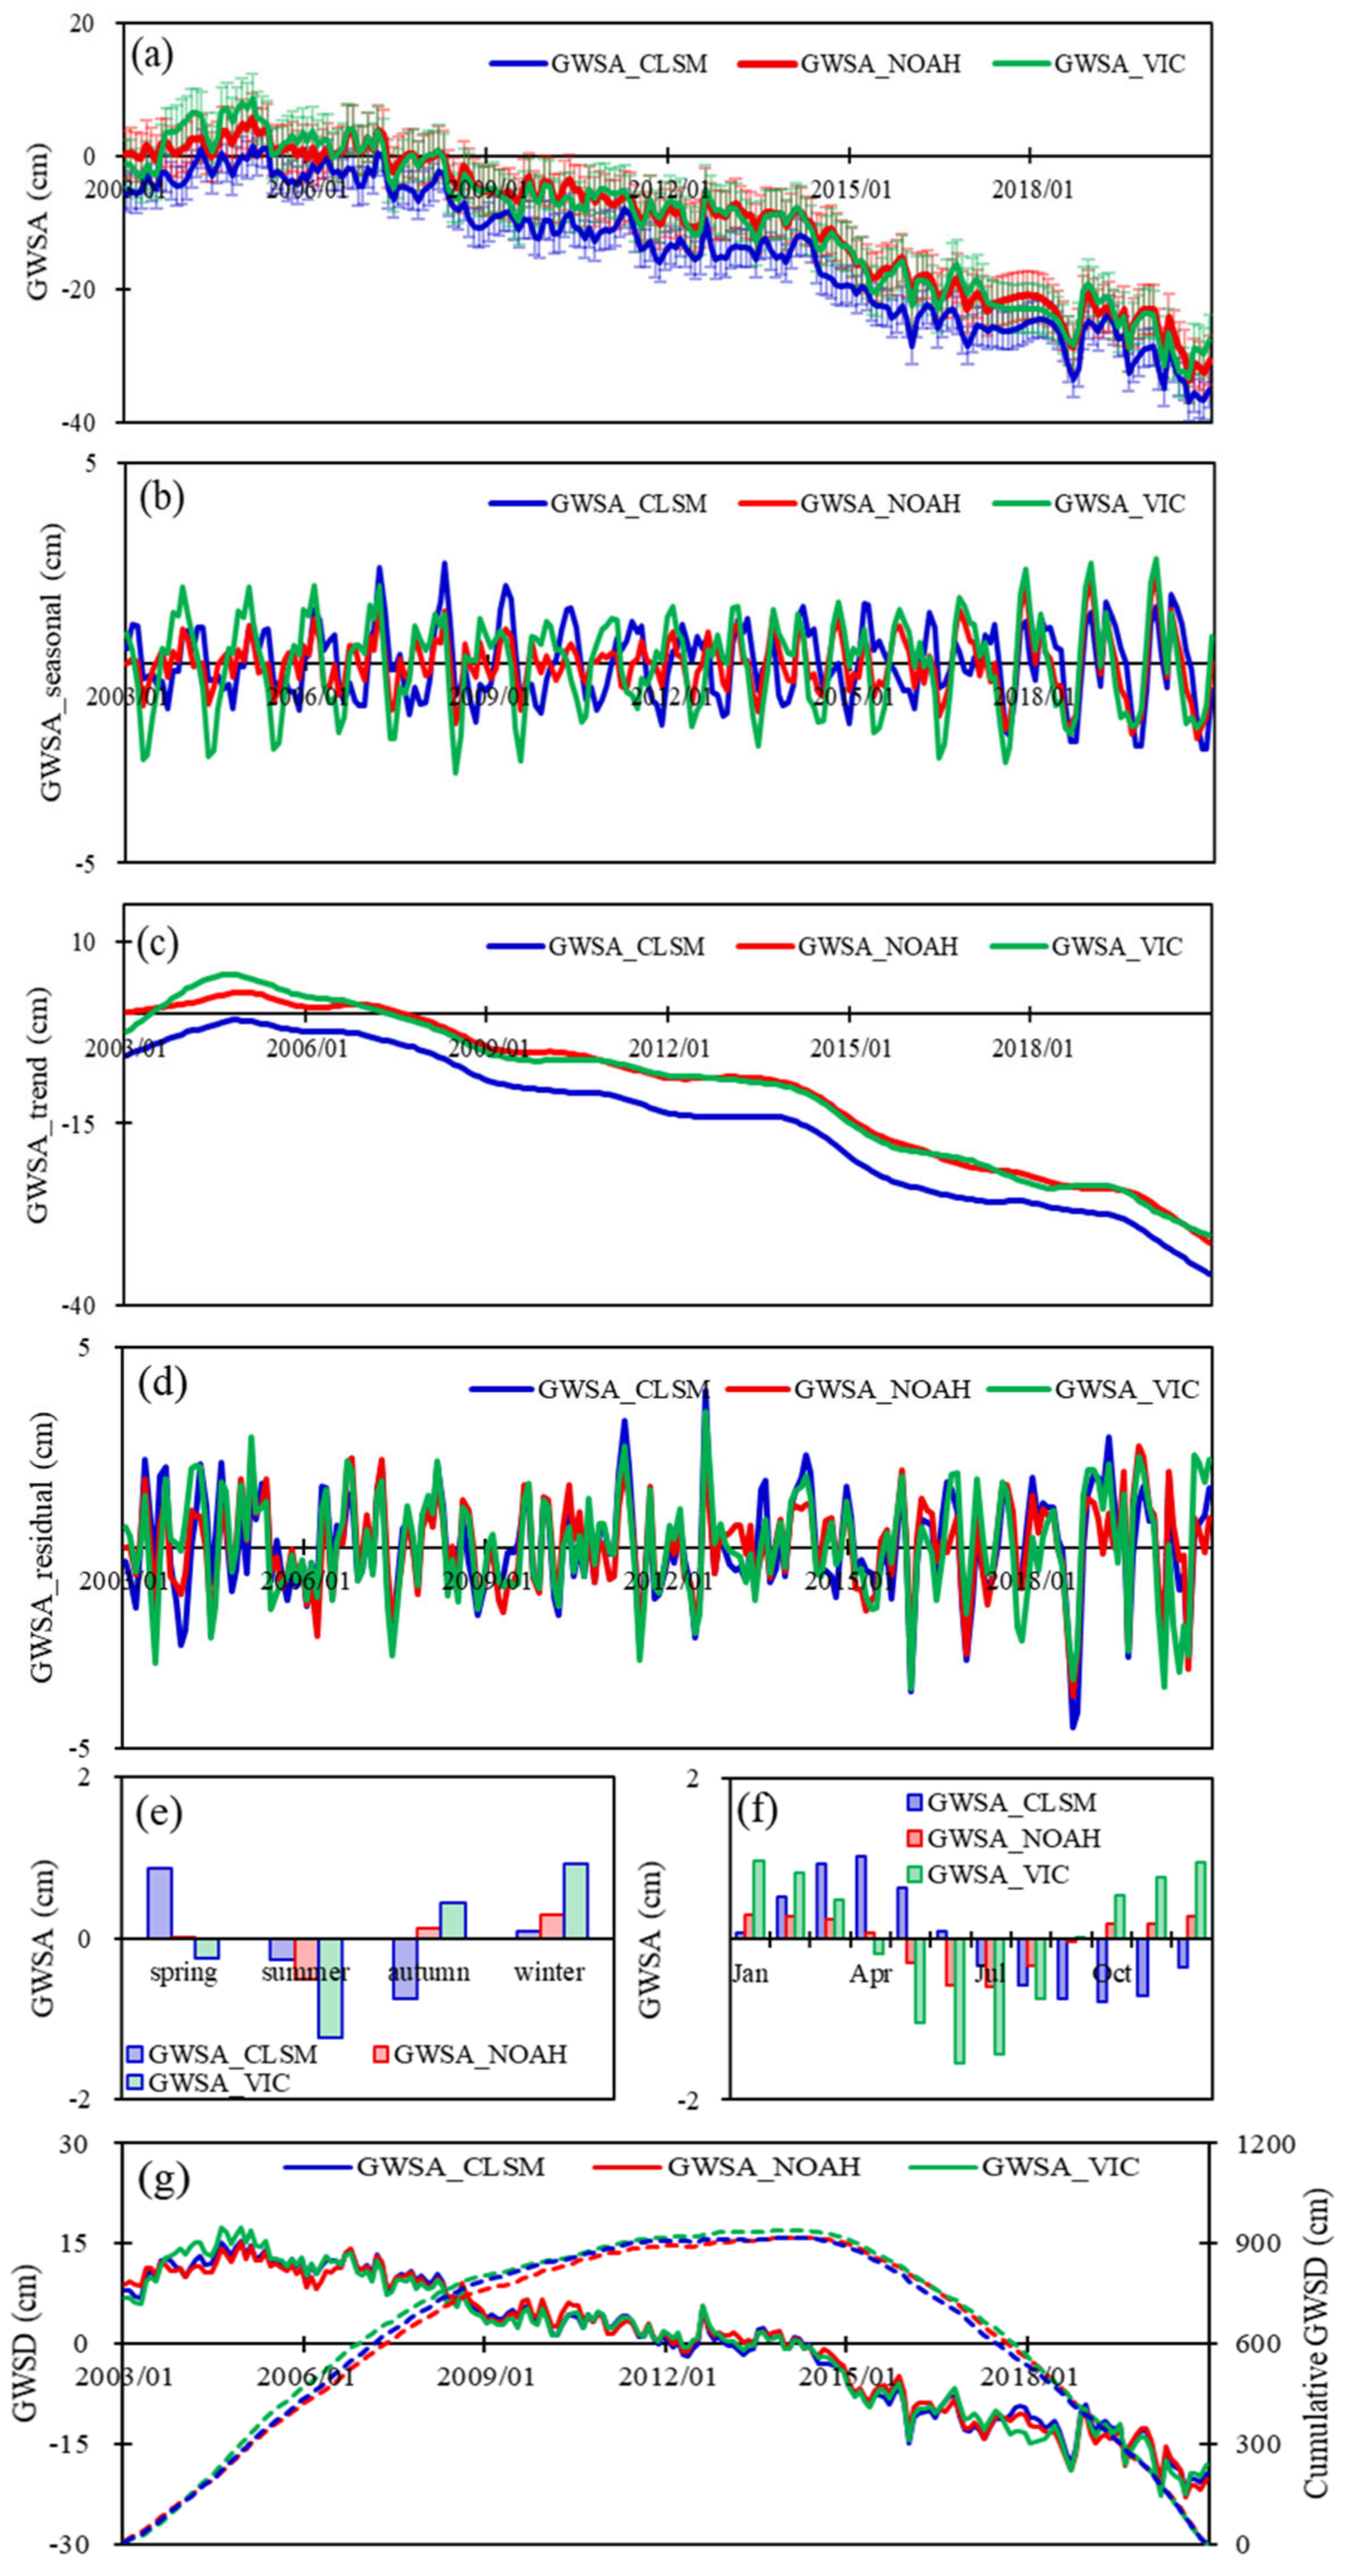
Due to the differences among the SWSA derived from the CLSM, NOAH, and VIC, there are three monthly GWSA time series based on GRACE/FO and three LSMs for the period of 2003 to 2020, respectively (Figure 4a). In terms of the intra-annual distributions of the GWSA, the seasonal patterns are different for different GRACE/FO and LSMs combinations (Figure 4b,e,f). For the combination of the GRACE/FO and the CLSM, the highest GWSA is in April (1.03 cm), and the lowest is in October (−1.88 cm). For a combination of the GRACE/FO and NOAH, the highest GWSA is in January (0.31 cm), and the lowest is in July (−0.60 cm). For the combination of the GRACE/FO and VIC, the highest GWSA is in January (0.98 cm), and the lowest in June (–1.55 cm). The seasonal patterns of the GWSAs in HRB are attributed to the intensive groundwater withdrawal for irrigating winter wheat that takes place from March to May, followed by precipitation in July and August.

Figure 4.
Monthly variations of original GWSA (a), seasonal signals (b), trend signals (c), and residuals (d) decomposed using the STL method; seasonal (e) and monthly (f) distributions of GWSA; monthly GWSD (straight line) and cumulative GWSD (dotted line) time series (g) in HRB.
Similar to the TWSA, the GWSA show a decreasing trend, with rates of 1.87, 1.86, and 1.92 cm·yr−1 for the GRACE/FO combined with the CLSM, NOAH, and VIC, respectively, for the period of 2003 to 2020 (Figure 4c). GWS depletion has accelerated since 2014. The decreasing rates of GWSA were 1.71/1.48/2.23 cm·yr−1 in the period of 2004–2009, 1.29/1.23/1.15 cm·yr−1 in 2009–2014, and 2.33/2.54/2.46 cm·yr−1 in 2014–2020 for the combination of the GRACE/FO with the CLSM, NOAH, and VIC, respectively (Table 1). The GWSD decreased in HRB, and the turning point from surplus to deficit occurred in the spring of 2014. The cumulative GWSD in HRB increased during 2003–2014 but has declined since the end of 2014 (Figure 4g). An increasing trend in the cumulative GWSD indicates a groundwater storage surplus and a declining trend indicates a lasting deficit.

Table 1.
The linear regression functions of GWSA for different periods and seasons.
3.3. The Spatial Patterns of GWSA in HRB
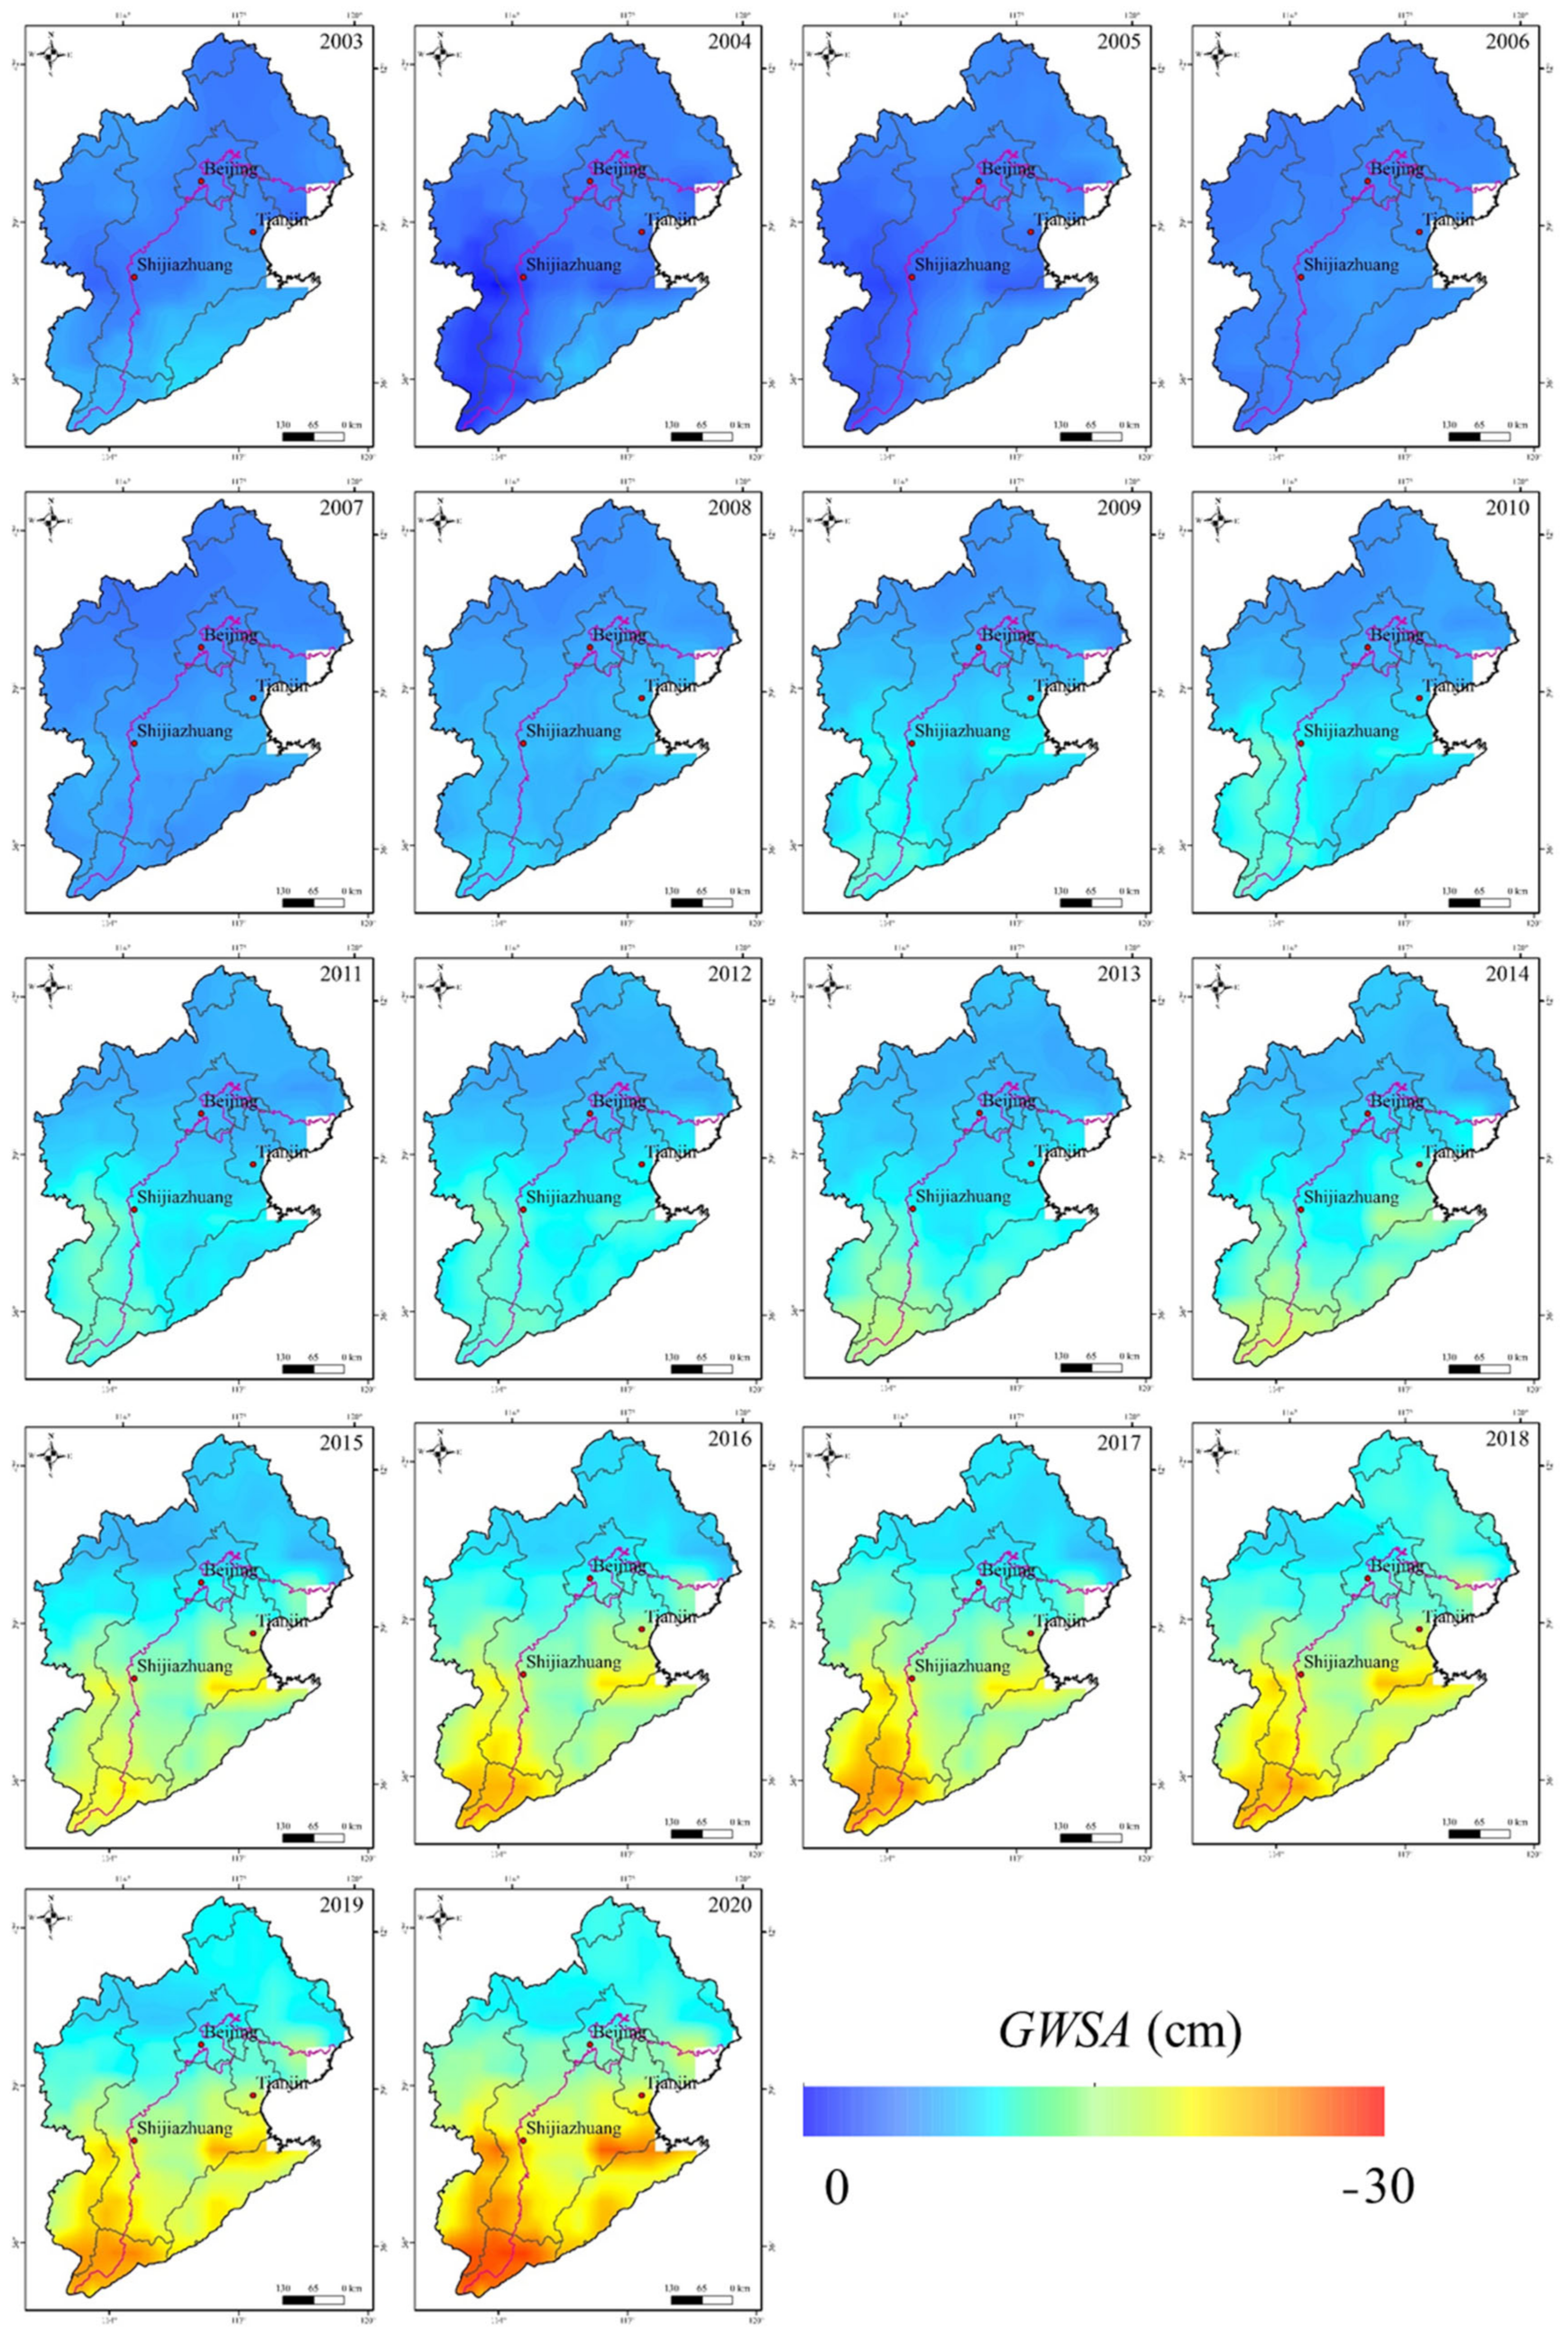
Figure 5 shows the spatial patterns of GWSA in HRB in the period of 2003–2020. On one hand, the groundwater depletion in HRB is serious year by year. On the other hand, the distribution of GWSA is uneven in HRB, and the southern area is more depleted than that in the northern area. There are two GWS depletion centers: one is on the border of Hebei Province, Shanxi Province, and Henan Province, including Xingtai City, Handan City, Changzhi City, and Hebi City. The other is in the east of Hebei Province, including Hengshui City, Cangzhou City, and DeZhou City.
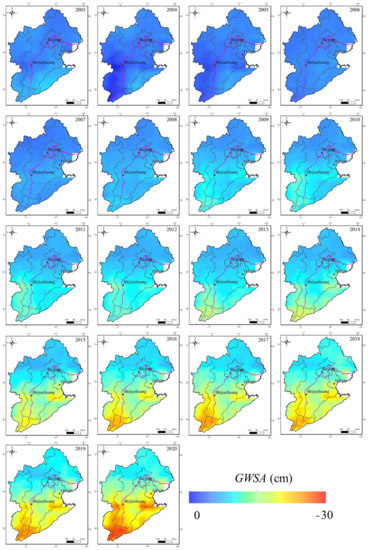
Figure 5.
Spatial distribution of GWSA in HRB from 2003 to 2020.
4. Discussion
4.1. Comparisons of the GWSA in this Study with other Results
4.1.1. Comparisons with in situ Groundwater Level Data
The daily groundwater level records from 20 groundwater monitoring wells in Beijing City over the periods of 2005 to 2011 and 2014 to 2015 were collected from the “China Geological Environment Monitoring Groundwater Level Yearbook” provided by the China Institute of Geological Environment Monitoring. Among them, eight are for shallow aquifers, and twelve for deep aquifers. It is obvious that the groundwater level anomalies (GWLA) relative to the mean value of 2005–2016 do not show obviously change trends. The GWSA based on the GRACE/FO and LSMs present a significant depletion in Beijing City, especially after the year 2014 (Figure 6). In fact, the previous studies conducted in HRB also found inconformity between the GWSA based on the GRACE/FO and LSMs with the in situ groundwater level [47,48]. There are four reasons for these differences. (1) The GRACE/FO examines a large spatial region, whereas monitoring wells are for point scale [5]. (2) Groundwater monitoring wells only monitor water level changes in a certain aquifer, while the GRACE/FO monitors the comprehensive performance of all aquifers. (3) The unevenly distributed groundwater monitoring wells do not have adequate spatial resolutions to reflect the holistic situation of Beijing City. (4) The coarse spatial resolution of the GRACE/FO is more suitable for a region with an area larger than 20 × 104 km2.
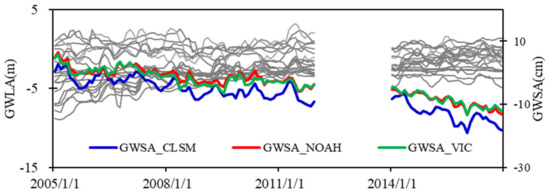
Figure 6.
Groundwater level anomalies (GWLA) and GWSA in Beijing City. (Each gray curve shows GWLA in one of 20 wells.)
4.1.2. Comparisons with the Data from Water Resources Bulletins
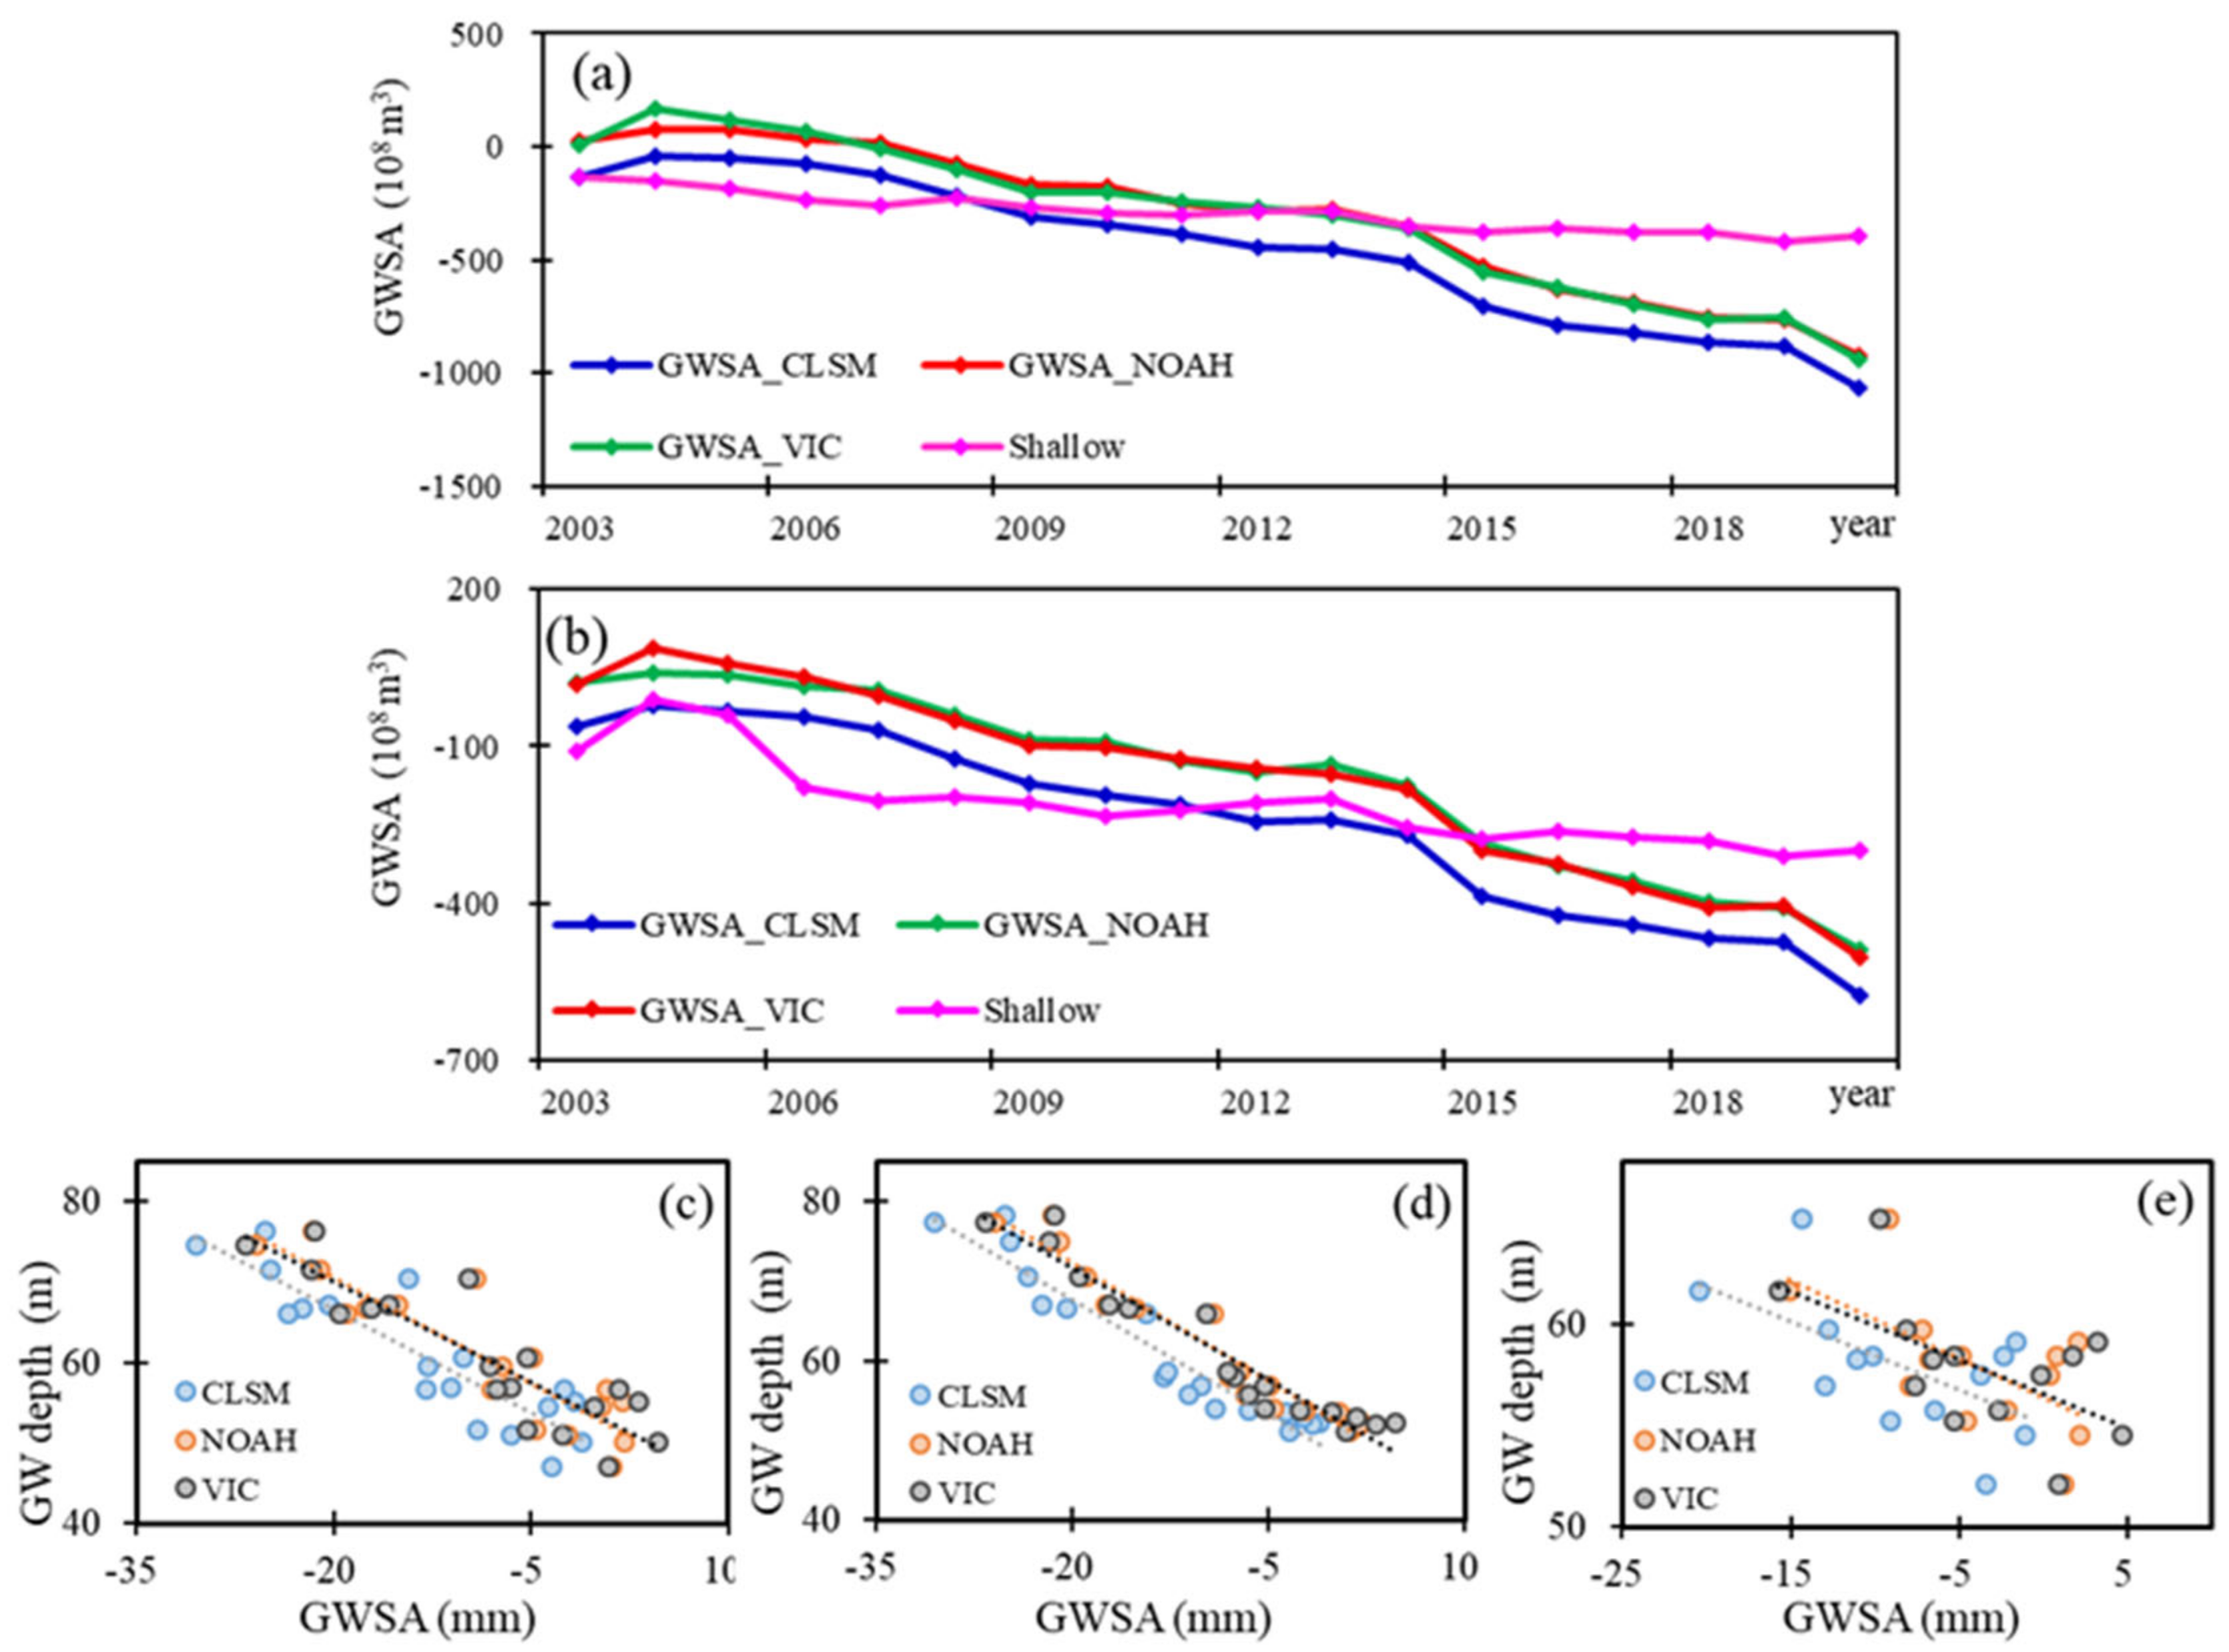
Haihe River Basin Water Resources Bulletins give the shallow groundwater storage variations in the plain zone [38]. Hebei Water Resources Bulletins give the shallow groundwater storage variations and groundwater depth variations in the deep aquifers [49]. Figure 7a shows the trend of GWSA in HRB based on the GRACE/FO, which is similar to the trend of GWSA in the shallow aquifer from Haihe River Basin Water Resources Bulletins, with a correlation coefficient of 0.90. Figure 7b shows the trend of GWSA in Hebei Province based on the GRACE/FO, which is similar with the trend of GWSA in the shallow aquifer from Hebei Water Resources Bulletins, with a correlation coefficient of 0.85. This phenomenon indicates that the shallow aquifer is the main force of groundwater depletion. However, GWS depletion derived from the GRACE/FO has been aggravated since 2014, while this phenomenon is not shown in the shallow groundwater storage changes in the Water Resources Bulletins. This indicates that the groundwater depletion has been deteriorative in the deep aquifer since 2014. This behavior is consistent with the previous geological survey results; the shallow groundwater funnel is over 20,000 km2, and the deep groundwater funnel is over 70,000 km2 in the plain area of the north. In addition, the GWSA in Hebei Province based on the GRACE/FO show a linear correlation with the deep groundwater depth changes in Cangzou City, Hengshui City, and Xingtai City (Figure 7c–e). Since the age of deep groundwater in the North China Plain is up to 25 ka B.P [50], it is very slow to recover from overexploitation.
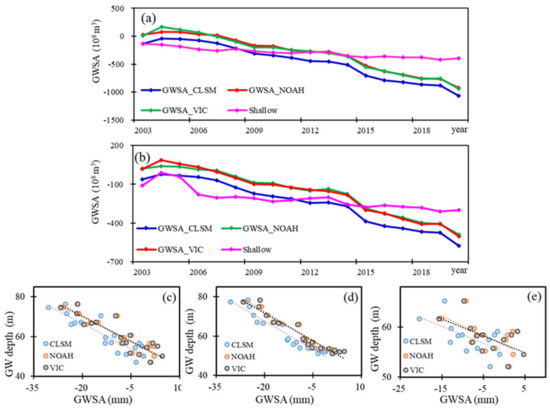
Figure 7.
The GWSA in HRB based on GRACE/FO and the shallow groundwater storage anomaly from Haihe River Basin Water Resources Bulletins (a); the GWSA in Hebei Province based on GRACE/FO and the shallow groundwater storage anomaly from Hebei Water Resources Bulletins (b), the relationship between GWSA in Hebei Province based on GRACE/FO, and groundwater depth in Hengshui City (c), Xingtai City (d), and Cangzhou City (e) based on Hebei Water Resources Bulletins.
4.1.3. Comparisons with Previous Studies
There are some previous studies estimating the TWS/GWS change trends using the GRACE/FO data and LSMs data in North China. For example, Zhong et al. studied TWS change trends in China using early GRACE data (RL 04) and found a 2.4 cm·yr−1 TWS loss in the Jing-Jin-Ji region from 2003 to 2007 [51]. Moiwo et al. estimated that the TWS decreased at a rate of 1.3~2.4 cm·yr−1 in HRB for the period from 2003 to 2006 based on the GRACE data (RL 04) [52]. According to Table 2, our results show TWS/GWS change trends that are consistent with prior studies. However, there are still some subtle differences in the change rate among different studies. These are mainly due to the differences in periods of data, kinds of data version, data combinations, post-processing methods, and so on. The superiority of our results lies in their deriving from the latest data version and multi-data combinations. On one hand, studies have proved that mascon solutions are more accurate compared with spherical harmonics solutions, although there was no post-processing [53]. In addition, this study not only uses the data from GRACE but also from GRACE-FO in HRB and covers a longer period. On the other hand, this study considers and compares the TWSA based on the latest mascon solutions (RL06) from CSR and JPL, and the SWSA based on three LSMs, and finally forms three combinations, the GRACE/FO with the CLSM, NOAH, and VIC, respectively.
Table 2.
Shows previous studies of TWSA/GWSA in North China based on GRACE/FO (unit is cm·yr−1).
4.2. The Spatial Trends of GWS Depletion in HRB
According to hydrogeological characteristics, HRB consists of the following two subzones: mountain area and plain area. The plain area consists of a piedmont pluvial plain, a central alluvial plain, and a coastal plain [50]. GWS decreases more quickly in the plain area (−2.36 cm·yr−1) than in the mountain area (−1.63 cm·yr−1) (Figure 8). The spatial patterns of GWS changes show significant groundwater depletion in the piedmont plain and central plain of HRB. The spatial patterns of GWS depletion are opposite to the precipitation recharge patterns. The maximum recharge rates are 250, 200, and 150 mm·yr−1 for the piedmont plain, the central plain, and the coastal plain, respectively [16].
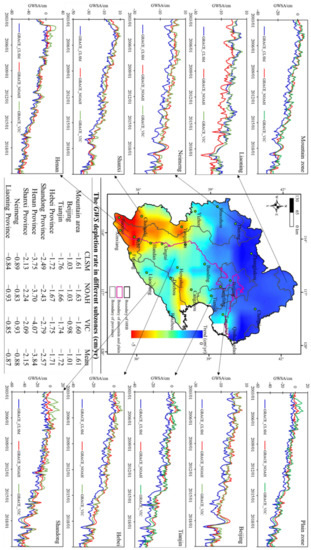
Figure 8.
The Spatial Trend of GWS depletion in HRB during 2003–2020.
The spatial pattern of the GWS trend is further estimated based on the administrative division. The northern part, including Neimeng and Liaoning Province, shows the lowest GWS depletion rate, less than 1 mm·yr−1. Beijing City also shows a small GWS depletion rate of around 1 mm·yr−1. The southern part, including Henan Province, Shanxi Province, and Shandong Province, shows serious GWS depletion. The mountain area in Shanxi Province is the largest coal-producing region in China. This large-scale coal mining would destroy the aquifers and result in the observed groundwater depletion [4].
4.3. Impacts of Climate Changes on GWS Depletion in HRB
Two driving factors account for the GWS depletion: climate changes (mainly the changes of temperature, precipitation, and evaporation) and human activities (water exploitation, hydraulic projects, land use/covers changes, etc.). Based on the method of Andersen et al. [62], the GWS changes (GWSCs) for a given area can be expressed as follows:
We consider the impacts of climate changes on GWSC in HRB in the following four aspects:
- (1)
- Due to the weakening monsoon winds over the past 60 years, many studies have found decreasing trends of annual precipitation in HRB by hydro-meteorological stations [63,64,65]. However, the annual precipitation from LSMs indicates a non-significant increasing trend during 2000–2020 (6.44 mm·yr−1, R2 = 0.28). The increased annual precipitation is almost offset by evaporation, which also increases (5 mm·yr−1, R2 = 0.62). Net recharge is the subtraction between precipitation and evapotranspiration (P-ET). In HRB, the net recharge remained constant during 2000–2020 (1.44 mm·yr−1, R2 = 0.03). Therefore, the persistent downward trend of GWS in HRB year by year indicates that climate changes are not the major reasons for GWS depletion.
- (2)
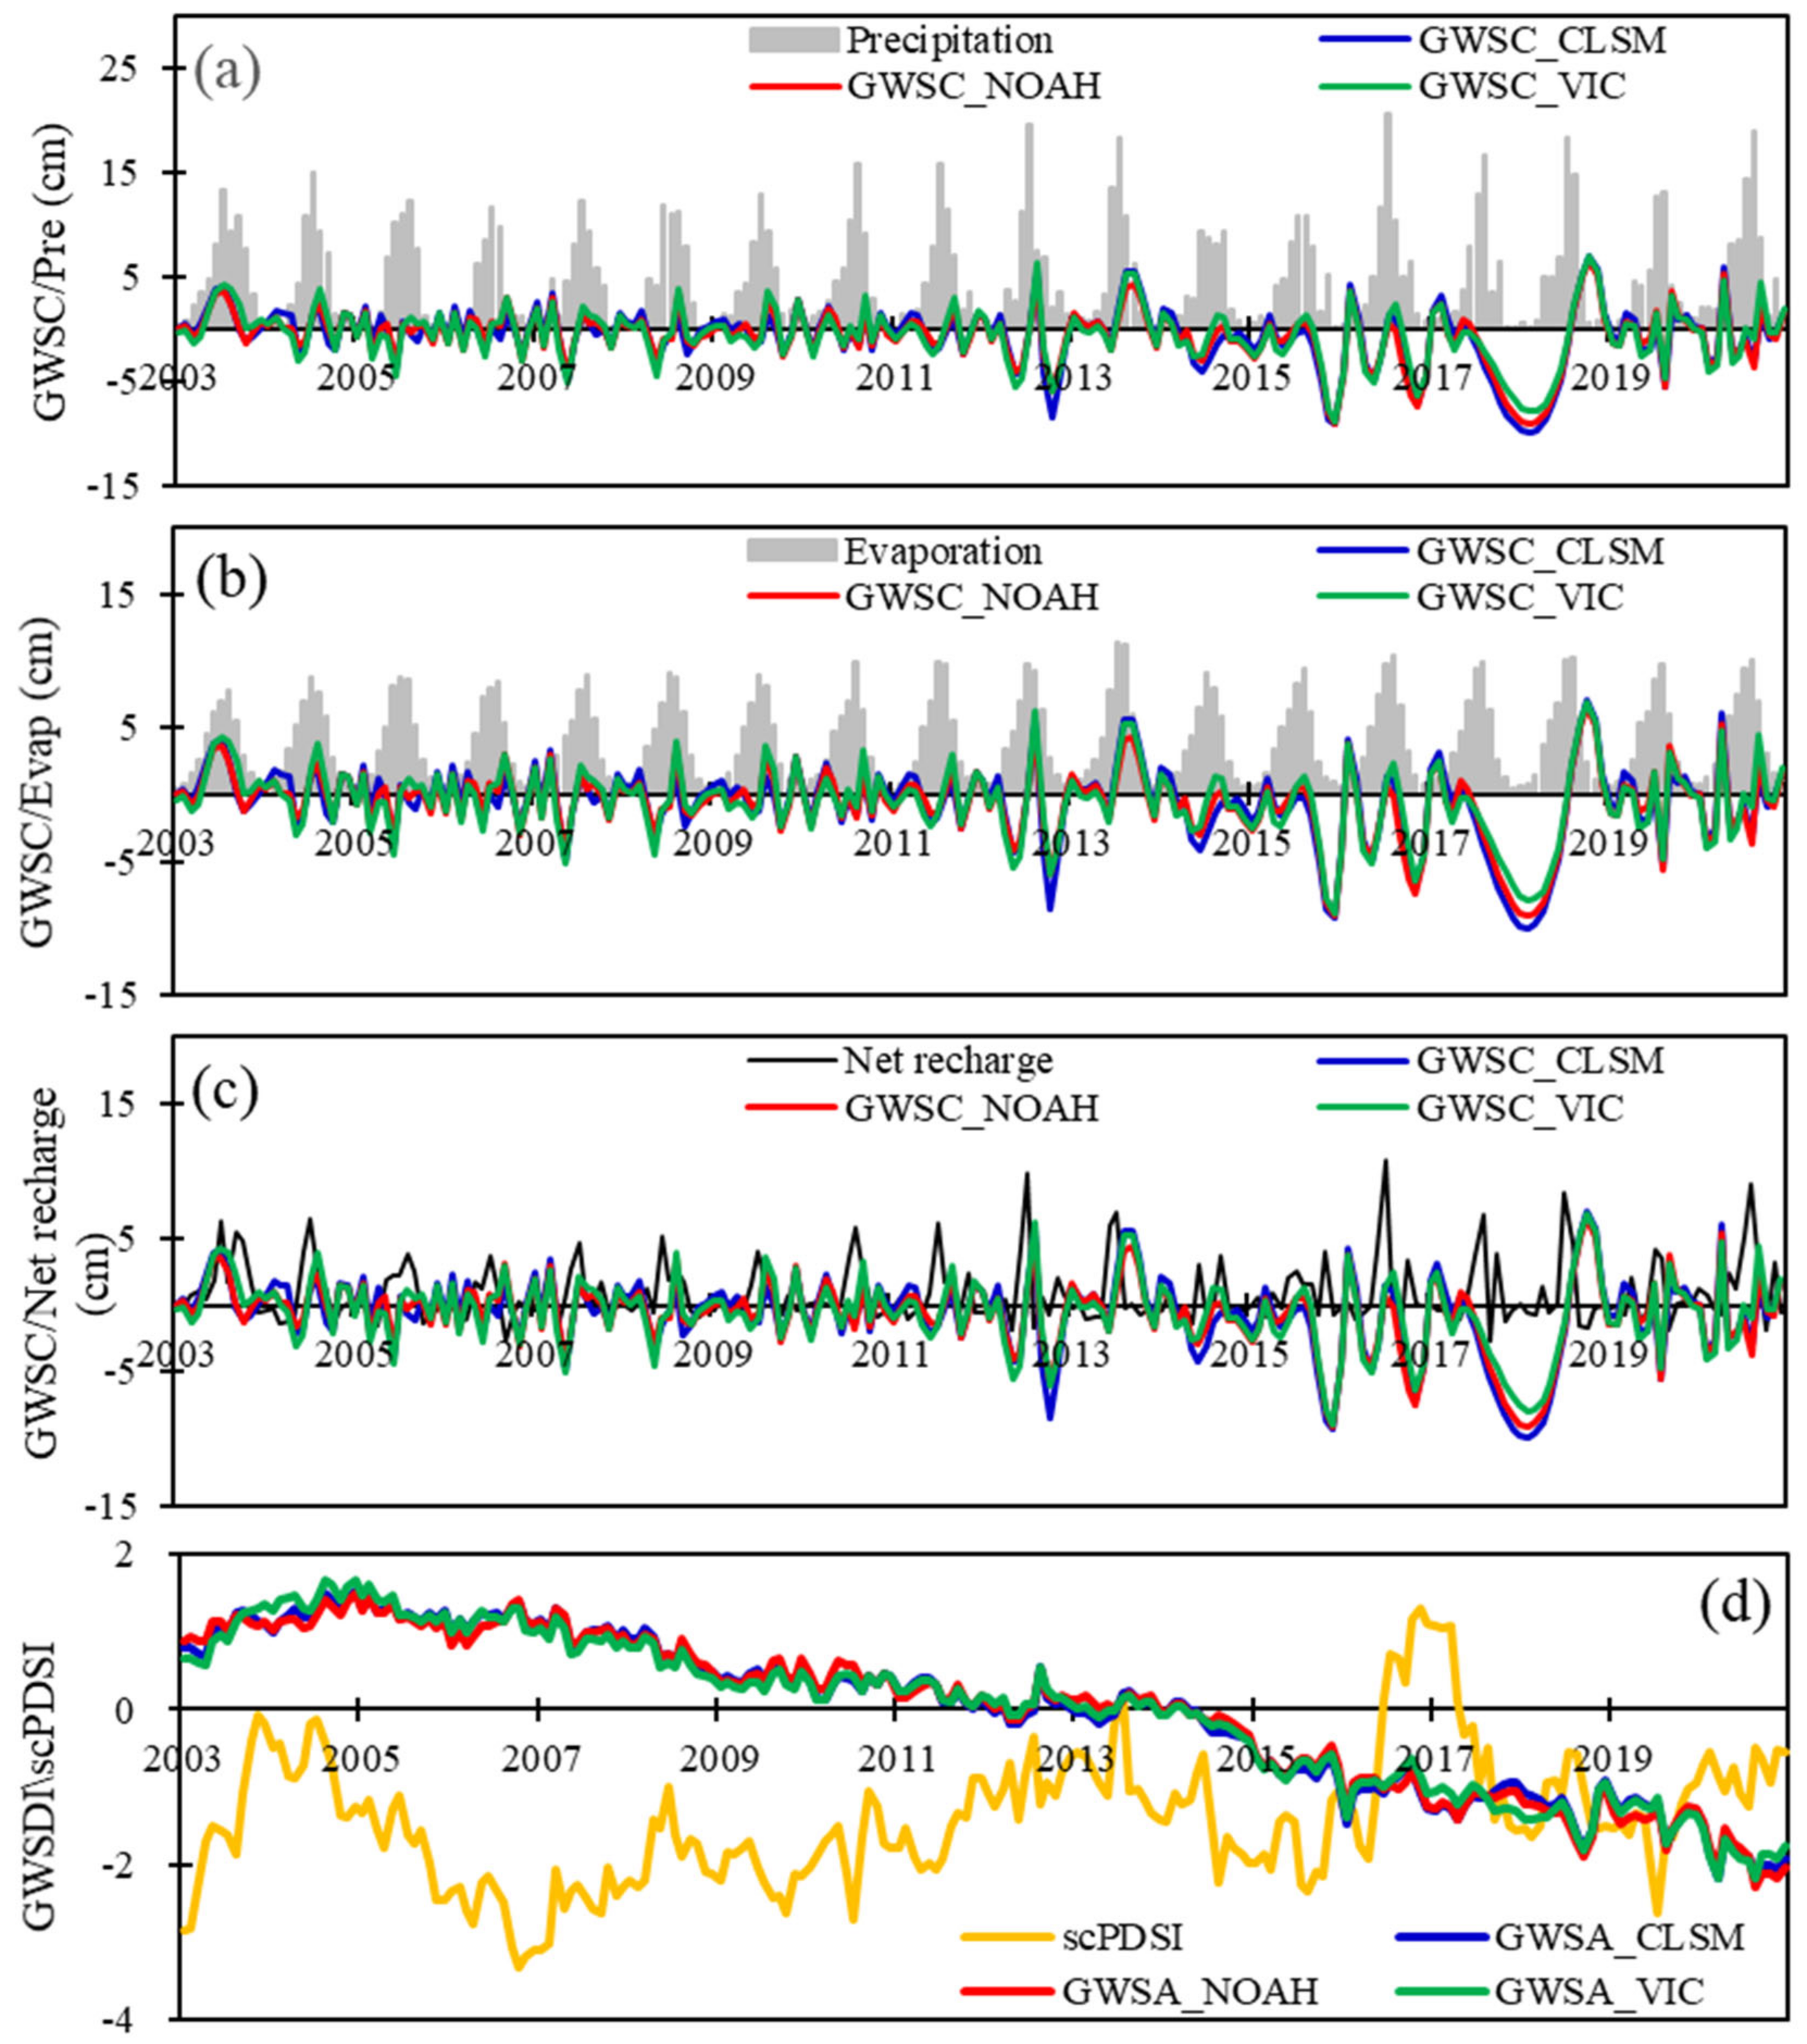
- Figure 9 shows that GWSC has a low correlation, even different phases, with precipitation, evaporation, and net recharge in HRB. Previous studies have shown that the maximum correlation coefficient between precipitation and GWS is low in HRB and has a time lag of nine months [66]. In this study, the maximum cross correlation coefficient between net recharge and GWSC is 0.16 with a lag of two months. The lag time corresponds with the seasonal pattern of GWSA in HRB.
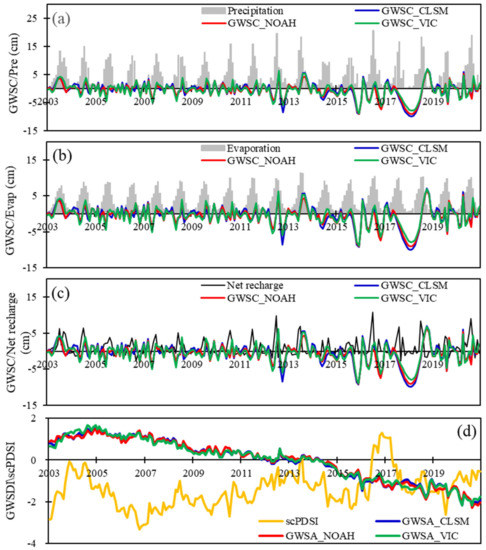 Figure 9. The time series of precipitation (a), evaporation (b), and net recharge (c) with GWSC, and GWSDI with scPDSI (d) in HRB during 2003–2020.
 - (3)
- As GWSC might have a strong relationship with dry/wet conditions, the groundwater storage deficit index (GWSDI) is compared with the self-calibrating Palmer drought severity index (scPDSI). The scPDSI is a comprehensive drought index derived from a variety of meteorological, agricultural, and hydrological variables to give a comprehensive picture of drought [67]. The scPDSI data are provided by the Climatic Research Unit at the University of East Anglia with a spatial resolution of 0.5° × 0.5° [68]. The low correlation between the scPDSI and GWSDI series also indicates that climate changes are not the major factors for GWS depletion in HRB (Figure 9).
- (4)
- The spatial distribution of GWS changes is different from the precipitation spatial distribution [32,38,49]. Based on the above four aspects, climate changes are not the major reasons for GWS depletion in HRB.
4.4. Impacts of Human Activities on GWS Depletion in HRB
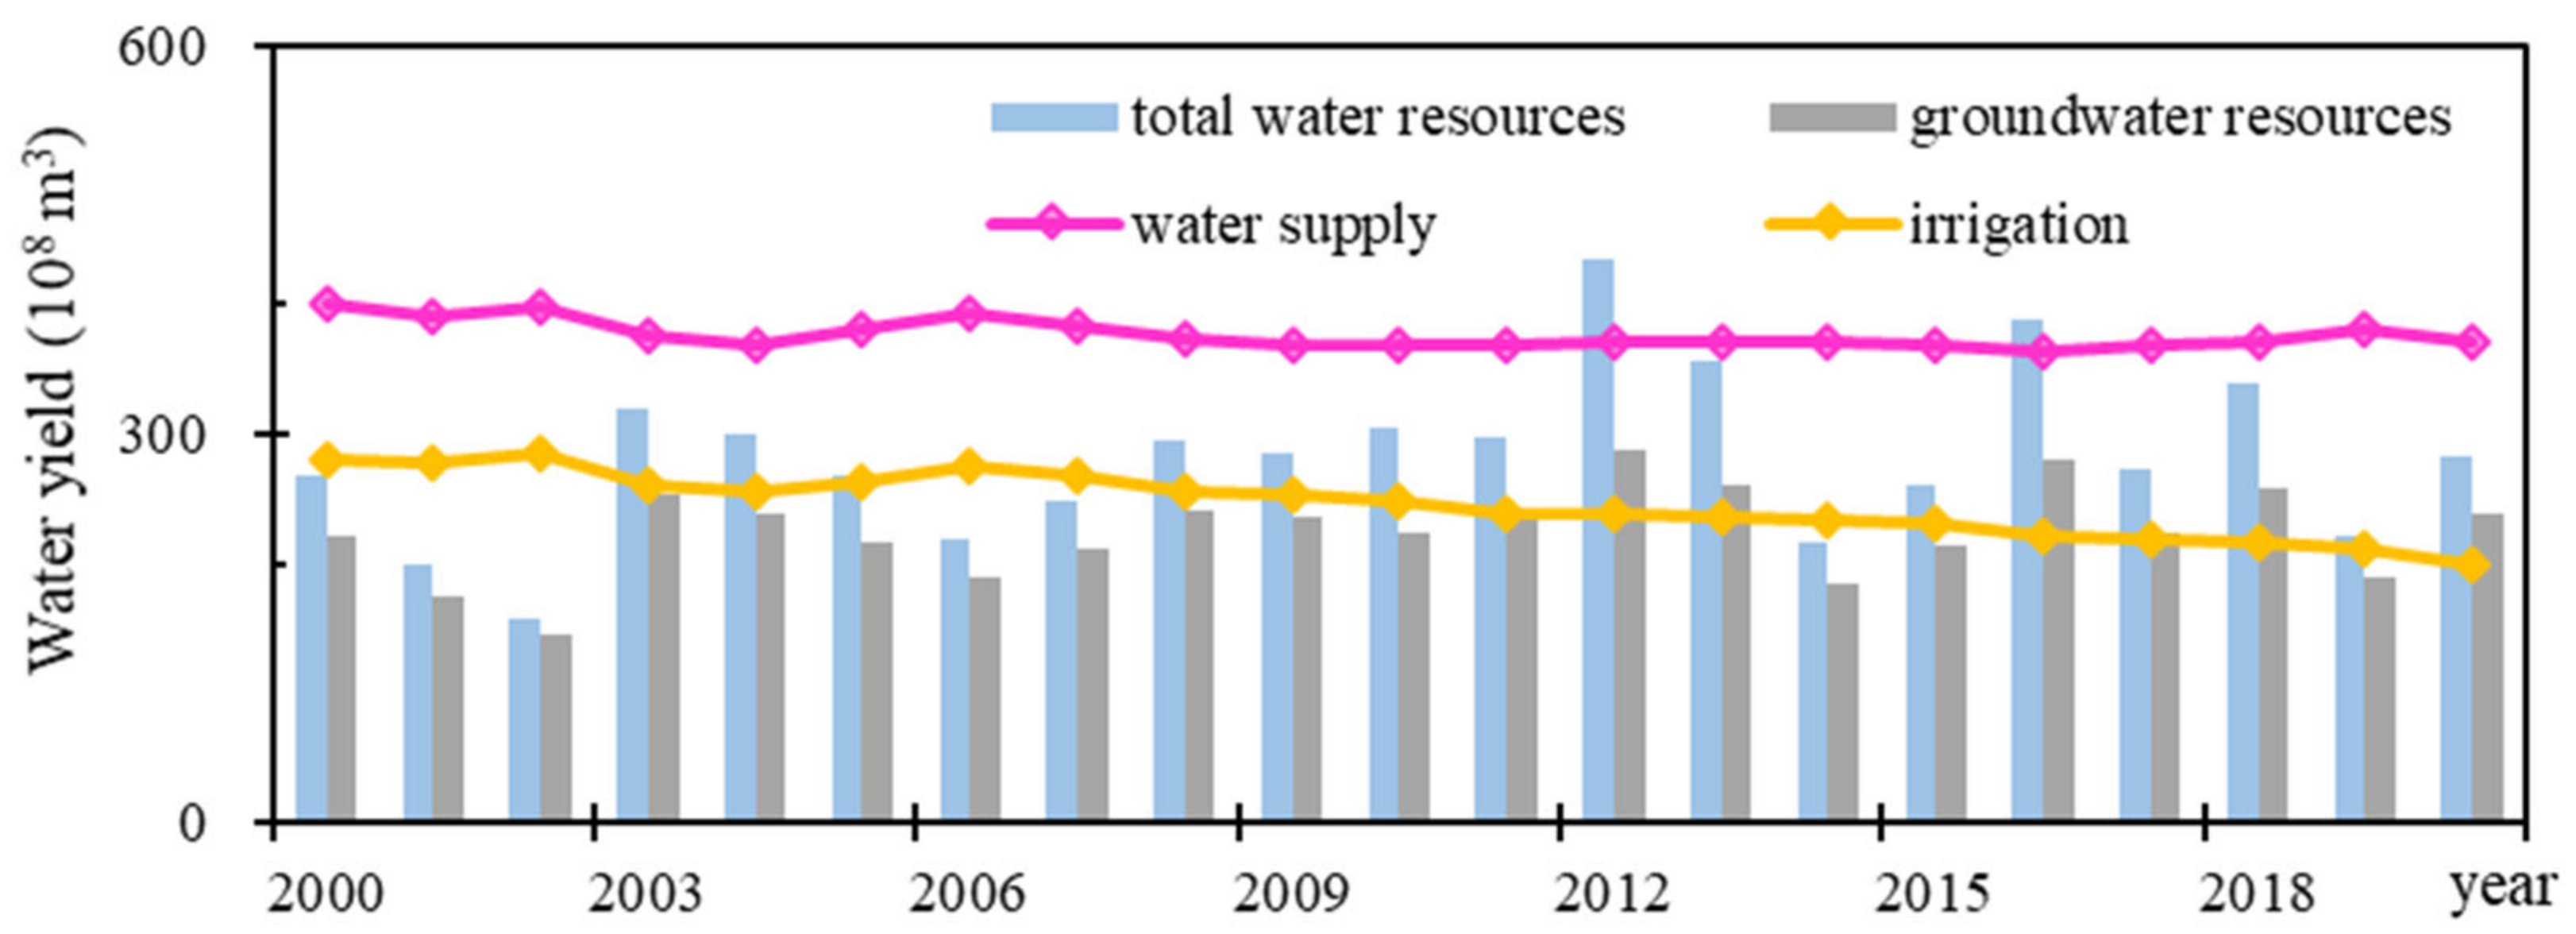
In this part, we consider the impacts of human activities on GWS depletion in HRB. The groundwater depletion is caused by the excess in groundwater exploitation compared to groundwater recharge [69]. The current global overexploitation of groundwater resources exceeds their recharge by 3.5 times [70]. Groundwater extraction increased by about 2.5 billion m3 per year to meet the need in China [71]. According to the Haihe River Water Conservancy Commission [38], the mean water supply was 37.7 billion m3 during 2000–2020, which is 1.3 times the mean total water resources (28.3 billion m3), and 1.7 times the mean groundwater resources (Figure 10). During 2003–2020, the accumulative water overexploitation was 198 billion m3. Therefore, overexploitation is one of the major reasons for groundwater depletion in HRB.

Figure 10.
The water resources and water consumption in HRB during 2000–2020.
Irrigation is an important factor affecting the change of terrestrial water storage [57]. Numerous studies have demonstrated that GRACE can detect GWS changes in arable areas, such as in northern India and Pakistan [3,72], the High Plains aquifer [73], the Central Valley [74], and the alluvial aquifer along the Mississippi River [27]. According to the latest version of the “Global Map of Irrigated Areas” (version 5) from FAO’s Global Information System on Water and Agriculture, irrigation in HRB mainly depends on groundwater rather than surface water. Cao et al. estimated that irrigation has severely depleted groundwater resources at a rate of around 4 km3·yr−1 since the 1960s in the North China Plain [75]. In addition, the annual two crops system is the most popular planting pattern in HRB, with winter wheat and summer maize. The annual average water consumption of winter wheat is 450 mm, which is two or three times the average precipitation amount during its growth period [76]. The mean irrigation was 24.6 billion m3, consuming 65% of the water supply, and exceeded the groundwater resources in 2000–2020 [38]. During this period, irrigation accumulatively used 45 billion m3 of water more than the groundwater resources in HRB. The excess water is compensated by groundwater, leading to continuous groundwater depletion. Therefore, agricultural activities and the consequent irrigation are important factors for GWS depletion in HRB.
Land use/cover changes also show influences on GWS changes. Firstly, based on remote sensing images, the area of arable land and grass land decreased by 7.85% (160,354 to 147,763 km2) and 4.54% (61,242 to 58,462 km2) from 2000 to 2020 in HRB, while the more water-intensive forest and urban land increased by 2.75% (60,444 to 62,104 km2) and 54.40% (25,120 to 38,784 km2), respectively. Additionally, the growth of deep-rooted vegetation caused by the implementation of ecological restoration will consume more water and reduce the groundwater level. The switch toward more profitable crops also causes increased groundwater consumption.
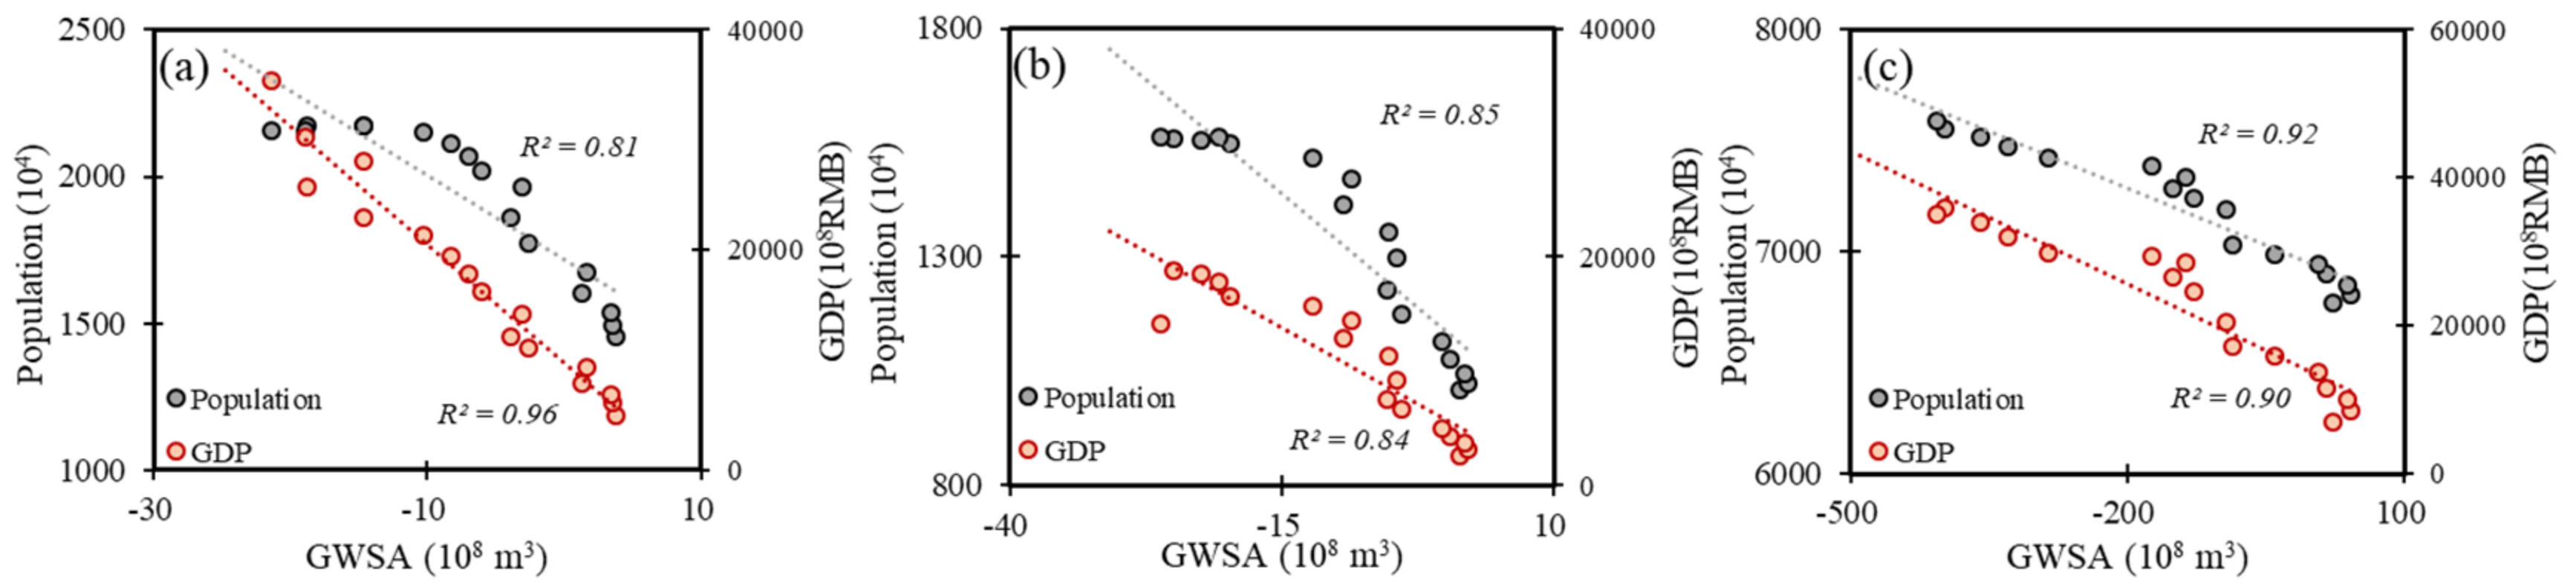
Moreover, previous studies show that urban expansion is a non-ignorable factor in GWS depletion in the Jing-Jin-Ji region [20]. During the past few decades, HRB has been undergoing significant changes in urbanization due to social-economic development. By analyzing the data from the Resource and Environment Science and Data Center, we found that the urban area increased from 25,120 km2 in 20,00 to 27,104 km2 in 2005, 28092 km2 in 2010, 29,376 km2 in 2015, and 38,784 km2 in 2020. On one hand, the obvious urban expansion in HRB leads to a decrease in infiltration with the low permeability of impervious surfaces. On the other hand, continuous urban expansion increases the water consumption, resulting in the overexploitation of groundwater and the aggravation of groundwater depletion. Figure 11 shows that there is an obviously negative relationship between the population and GDP (Gross Domestic Product) with GWS changes in Beijing City, Tianjin City, and Hebei Province.
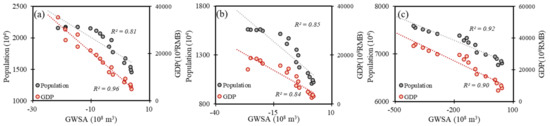
Figure 11.
The relationship between population and GDP with GWS changes in Beijing City (a), Tianjin City (b), and Hebei Province (c).
There are the following two major inter-basin water transfer projects in HRB: the Middle Route of the South to North Water Diversion Project (SNWDP) and the Yellow River transfer scheme. In total, 9.5 billion m3 of water is delivered to the North China Plain annually, which will significantly change the water supply structure [77]. In this study, we found that only in 2019, when the watershed water regulation was more than 10 billion m3, was the trend of groundwater depletion alleviated. In addition, the GWS changes had no relation to the inter-basin water transfer (Figure 12), which proves from the side that the GWS depletion in HRB is serious and more inter-basin water transfers are needed. All in all, human activities influence GWS changes in the aspects of groundwater exploitation, agricultural activities and irrigation, land use/cover changes, and city expansion and inter-basin water transfer projects in HRB.
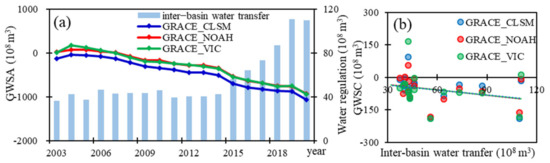
Figure 12.
The volume of inter-basin water transfer and GWSA (a) and the relation between in-ter-basin water transfer with GWS changes (b) in HRB.
4.5. Limitations in this Study
Although this study uses the latest data and considers different data combinations, we have to admit that the GWSA estimated in this study is affected by a series of limitations. These limitations are from both data processing schemes and the propagation of model errors. For example, the uncertainties in the simulations of SM, SWE, CWS changes with different LSMs are manifested, but to what levels remains unknown. In addition, the typical thickness of the unsaturated zone is as deep as 10–15 m for the North China Plain [75], while the soil depths in LSMs range from 200 to 340 cm. Thus, SMS do not account for water storage variations in deep soil. The unmatched spatial resolution of the dataset and the processing methods for each dataset could result in substantial uncertainties. Recently, data assimilation techniques have been proposed to improve GWS by assimilating the GRACE/FO observation into LSMs. We will use these new techniques in our future studies to enhance the accuracy of the GWS estimation.
5. Conclusions
GRACE and GRACE Follow-On (GRACE/FO) mascon data were used to estimate groundwater storage variations after removing other components from land surface models in the HRB, China. The TWSA derived from the two GRACE/FO data products (CRS and JPL) show that there was good agreement and consistency in HRB during 2003–2020, and the mean value was used as the ensemble solution of TWSA in HRB. The monthly TWSA exhibited a decreasing trend at a rate of 19.2 mm·yr−1 from 2003 to 2020, with an uncertainty of 1.74 cm. The surface water storage based on land surface models does not contribute significantly to the decrease in the TWSA. In addition, three land surface models (CLSM, NOAH, and VIC) show different SWSA. Therefore, GWS decreases at the rates of 18.7, 18.6, and 19.2 mm·yr−1 for the combination of the GRACE/FO with CLSM, NOAH, and VIC, respectively. The GWS decreases more quickly in the plain area (−23.6 mm·yr−1) than in the mountain area (−16.3 mm·yr−1). During the period of 2003–2020, the groundwater depletion was equivalent to a net loss of 108 billion m3 of water.
The GWS depletion in HRB has more of a human than natural cause. In the scenario of climate changes, the precipitation and evaporation in the HRB were stable without a significant increase or decrease during 2000–2020, and the changes in precipitation and evaporation almost offset each other. Compared with climate changes, human activities play a dominant role in the GWS depletion in the HRB. The continuous groundwater overexploitation, agricultural activities and irrigation, and urban expansion account for the groundwater resource shortage. Consequently, we should strengthen the management system of water resources in many aspects, and vigorously develop water-saving irrigation strategies, carry out groundwater recharge, and strictly control groundwater exploitation.
Author Contributions
Y.G., F.W., and R.J. processed the data; Y.G., F.G., B.Y., and J.B. conducted the analysis and drafted the paper. N.X. and Q.L. have worked collaboratively on structuring and reviewing the text, as well as discussing the results. All authors have read and agreed to the published version of the manuscript.
Funding
This research was supported by the Project of Key Laboratory of Aerial Geophysics and Remote Sensing Geology, Ministry of Natural Resources (2020YFL18), and Remote Sensing Quantitative Investigation of Water Cycle Elements and Natural Resources in Typical Watershed (DD20221642-3).
Institutional Review Board Statement
Not applicable.
Informed Consent Statement
Not applicable.
Data Availability Statement
The GRACE and GRACE Follow-On data were collected from http://www2.csr.utexas.edu/GRACE/RL06_mascons.html, accessed on 12 November 2021) and ftp://podaac.jpl.nasa.gov/allData/tellus/L3/mascon/RL06/JPL, accessed on 12 November 2021). The three land surface models were collected from http://disc.sci.gsfc.nasa.gov/serVICes/grads-gds/gldas/, accessed on 12 November 2021). The water consumption data were from the Haihe River Water Resources Bulletin (http://www.hwcc.gov.cn/wwgj/xxgb/szygb/, accessed on 12 November 2021) and Hebei Water Resources Bulletin, Department of Water Resources of Hebei Province (http://slt.hebei.gov.cn/a/, accessed on 12 November 2021). The ScPDSI data were from http://www.cru.uea.ac.uk/data/, accessed on 12 November 2021). The land use/cover map was from https://www.resdc.cn/data.aspx?DATAID=335, accessed on 12 November 2021). The groundwater monitoring data were collected from the Groundwater Yearbook from the Geo-Environment Monitoring Institute of China.
Acknowledgments
The research for this article was supported by Project of Key Laboratory of Aerial Geophysics and Remote Sensing Geology, Ministry of Natural Resources (2020YFL18), and Remote Sensing Quantitative Investigation of Water Cycle Elements and Natural Resources in Typical Watershed (DD20221642-3). The financial support is highly appreciated. We would like to express thanks for the GRACE/FO Mascon data supported by the CSR and JPL, GLDAS CLSM/NOAH/VIC V2.1 from the Goddard Earth Sciences Data and Information SerVICes Center, NASA. We would like to thank the Climatic Research Unit at the University of East Anglia for providing the scPDSI data. We would like to thank Zhong Yulong for his help in data processing. We are also thankful for the insightful comments raised by anonymous reviewers and the associate editor, who helped to improve this paper.
Conflicts of Interest
The authors declare no conflict of interest.
References
- Aeschbach-Hertig, W.; Gleeson, T. Regional strategies for the accelerating global problem of groundwater depletion. Nat. Geosci. 2012, 5, 853–861. [Google Scholar] [CrossRef]
- Taylor, R.G.; Scanlon, B.; Döll, P.; Rodell, M.; van Beek, R.; Wada, Y.; Longuevergne, L.; Leblanc, M.; Famiglietti, J.S.; Edmunds, M.; et al. Ground water and climate change. Nat. Clim. Chang. 2012, 3, 322–329. [Google Scholar] [CrossRef] [Green Version]
- Rodell, M.; Velicogna, I.; Famiglietti, J.S. Satellite-based estimates of groundwater depletion in India. Nature 2009, 460, 999–1002. [Google Scholar] [CrossRef] [PubMed] [Green Version]
- Feng, W.; Zhong, M.; Lemoine, J.-M.; Biancale, R.; Hsu, H.-T.; Xia, J. Evaluation of groundwater depletion in North China using the Gravity Recovery and Climate Experiment (GRACE) data and ground-based measurements. Water Resour. Res. 2013, 49, 2110–2118. [Google Scholar] [CrossRef]
- Asoka, A.; Gleeson, T.; Wada, Y.; Mishra, V. Relative contribution of monsoon precipitation and pumping to changes in groundwater storage in India. Nat. Geosci. 2017, 10, 109–117. [Google Scholar] [CrossRef] [Green Version]
- Thomas, B.F.; Famiglietti, J.S. Identifying Climate-Induced Groundwater Depletion in GRACE Observations. Nature 2019, 9, 4124. [Google Scholar] [CrossRef] [PubMed] [Green Version]
- Konikow, L.F.; Kendy, E. Groundwater depletion: A global problem. Hydrogeol. J. 2005, 13, 317–320. [Google Scholar] [CrossRef]
- Tamanyu, S.; Muraoka, H.; Ishii, T. Geological interpretation of groundwater level lowering in the North China Plain. Bull. Geol. Surv. Jpn. 2009, 60, 105–115. [Google Scholar] [CrossRef] [Green Version]
- Foster, S.; Garduno, H.; Evans, R.; Olson, D.; Tian, Y.; Zhang, W.; Han, Z. Quaternary Aquifer of the North China Plain-assessing and achieving groundwater resource sustainability. Hydrogeol. J. 2004, 12, 81–93. [Google Scholar] [CrossRef]
- Foster, S.S.; Chilton, P.J. Groundwater: The processes and global significance of aquifer degradation. Philos. Trans. R Soc. Lond. B Biol. Sci. 2003, 358, 1957–1972. [Google Scholar] [CrossRef] [PubMed] [Green Version]
- Goncalves, R.D.; Stollberg, R.; Weiss, H.; Chang, H.K. Using GRACE to quantify the depletion of terrestrial water storage in Northeastern Brazil: The Urucuia Aquifer System. Sci. Total Environ. 2020, 705, 135845. [Google Scholar] [CrossRef]
- Alley, W.M.; Healy, R.W.; LaBaugh, J.W.; Reilly, T.E. Flow and Storage in Groundwater Systems. Science 2002, 296, 1985–1990. [Google Scholar] [CrossRef] [PubMed] [Green Version]
- Jia, S.-f.; Li, Y.-y.; Lyu, A.-f.; Yan, J.-B. Estimation of excess pumping of shallow groundwater aquifer in Haihe Plain. South North Water Transf. Water Sci. Technol. 2016, 14, 1–7. (In Chinese) [Google Scholar]
- Müller Schmied, H.; Cáceres, D.; Eisner, S.; Flörke, M.; Herbert, C.; Niemann, C.; Peiris, T.A.; Popat, E.; Portmann, F.T.; Reinecke, R.; et al. The global water resources and use model WaterGAP v2.2d: Model description and evaluation. Geosci. Model Dev. 2021, 14, 1037–1070. [Google Scholar] [CrossRef]
- Doll, P.; Schmied, H.M.; Schuh, C.; Portmann, F.T.; Eicker, A. Global-scale assessment of groundwater depletion and related groundwater abstractions: Combining hydrological modeling with information from well observations and GRACE satellites. Water Resour. Res. 2014, 50, 5698–5720. [Google Scholar] [CrossRef]
- Cao, G.; Zheng, C.; Scanlon, B.R.; Liu, J.; Li, W. Use of flow modeling to assess sustainability of groundwater resources in the North China Plain. Water Resour. Res. 2013, 49, 159–175. [Google Scholar] [CrossRef]
- Peltier, W.R. VLBI baseline variations from the ICE-4G model of postglacial rebound. Geophys. Res. Lett. 1995, 22, 465–468. [Google Scholar] [CrossRef]
- Wahr, J.; Molenaar, M.; Bryan, F. Time variability of the Earth's gravity field: Hydrological and oceanic effects and their possible detection using GRACE. J. Geophys. Res. 1998, 103, 30205–30229. [Google Scholar] [CrossRef]
- Chen, J.L.; Wilson, C.R.; Eanes, R.J.; Tapley, B.D. Geophysical contributions to satellite nodal residual variation. J. Geophys. Res. 1999, 104, 23237–23244. [Google Scholar] [CrossRef] [Green Version]
- Chen, Z.; Jiang, W.; Wu, J.; Chen, K.; Deng, Y.; Jia, K.; Mo, X. Detection of the spatial patterns of water storage variation over China in recent 70 years. Science 2017, 7, 6423. [Google Scholar] [CrossRef] [PubMed] [Green Version]
- Tapley, B.D.; Bettadpur, S.; Ries, J.C.; Thompson, P.F.; Watkins, M.M. GRACE measurements of mass variability in the earth system. Science 2004, 305, 503–505. [Google Scholar] [CrossRef] [PubMed] [Green Version]
- Rodell, M.; Famiglietti, J.S. An analysis of terrestrial water storage variations in Illinois with implications for the Gravity Recovery and Climate Experiment (GRACE). Water Resour. Res. 2001, 37, 1327–1339. [Google Scholar] [CrossRef] [Green Version]
- Zaitchik, B.F.; Rodell, M.; Reichle, R.H. Assimilation of GRACE Terrestrial Water Storage Data into a Land Surface Model: Results for the Mississippi River Basin. J. Hydrometeorol. 2008, 9, 535–548. [Google Scholar] [CrossRef]
- Wang, S.; Liu, H.; Yu, Y.; Zhao, W.; Yang, Q.; Liu, J. Evaluation of groundwater sustainability in the arid Hexi Corridor of Northwestern China, using GRACE, GLDAS and measured groundwater data products. Sci. Total Environ. 2020, 705, 135829. [Google Scholar] [CrossRef]
- Wang, J.; Song, C.; Reager, J.T.; Yao, F.; Famiglietti, J.S.; Sheng, Y.; MacDonald, G.M.; Brun, F.; Schmied, H.M.; Marston, R.A.; et al. Recent global decline in endorheic basin water storages. Nat. Geosci. 2018, 11, 926–932. [Google Scholar] [CrossRef] [PubMed] [Green Version]
- Rodell, M.; Famiglietti, J.S.; Wiese, D.N.; Reager, J.T.; Beaudoing, H.K.; Landerer, F.W.; Lo, M.H. Emerging trends in global freshwater availability. Nature 2018, 557, 651–659. [Google Scholar] [CrossRef]
- Rodell, M.; Chen, J.; Kato, H.; Famiglietti, J.S.; Nigro, J.; Wilson, C.R. Estimating groundwater storage changes in the Mississippi River basin (USA) using GRACE. Hydrogeol. J. 2006, 15, 159–166. [Google Scholar] [CrossRef] [Green Version]
- Abou Zaki, N.; Torabi Haghighi, A.; Rossi, M.P.; Tourian, J.M.; Kløve, B. Monitoring Groundwater Storage Depletion Using Gravity Recovery and Climate Experiment (GRACE) Data in Bakhtegan Catchment, Iran. Water 2019, 11, 1456. [Google Scholar] [CrossRef] [Green Version]
- Chen, H.; Zhang, W.; Nie, N.; Guo, Y. Long-term groundwater storage variations estimated in the Songhua River Basin by using GRACE products, land surface models, and in situ observations. Sci. Total Environ. 2019, 649, 372–387. [Google Scholar] [CrossRef]
- Frappart, F.; Ramillien, G. Monitoring Groundwater Storage Changes Using the Gravity Recovery and Climate Experiment (GRACE) Satellite Mission: A Review. Remote Sens. 2018, 10, 829. [Google Scholar] [CrossRef] [Green Version]
- Wouters, B.; Gardner, A.S.; Moholdt, G. Global Glacier Mass Loss During the GRACE Satellite Mission (2002–2016). Front. Earth Sci. 2019, 7, 96. [Google Scholar] [CrossRef] [Green Version]
- Ministry of Water Resources of China. 2020 China Water Resources Bulletin. Available online: http://www.mwr.gov.cn/sj/tjgb/szygb/ (accessed on 12 November 2021).
- Yang, H.; Cao, W.; Zhi, C.; Li, Z.; Bao, X.; Ren, Y.; Liu, F.; Fan, C.; Wang, S.; Wang, Y. Evolution of groundwater level in the North China Plain in the past 40 years and suggestions on its overexploitation treatment. Geol. China 2021, 48, 1142–1155. (In Chinese) [Google Scholar]
- Yang, H.; Meng, R.; Li, W.; Li, Z.; Zhi, C.; Bao, X.; Li, C.; Liu, F.; Wu, H.; Ren, Y. Groundwater resources of the Haihe River Basin and its development potential. Geol. China 2021, 48, 1032–1051. (In Chinese) [Google Scholar] [CrossRef]
- Guo, Y.; Shen, Y. Quantifying water and energy budgets and the impacts of climatic and human factors in the Haihe River Basin, China: 2. Trends and implications to water resources. J. Hydrol. 2015, 527, 251–261. [Google Scholar] [CrossRef]
- Guo, Y.; Shen, Y. Quantifying water and energy budgets and the impacts of climatic and human factors in the Haihe River Basin, China: 1. Model and validation. J. Hydrol. 2015, 528, 206–216. [Google Scholar] [CrossRef]
- Marga, W.A. Large Aquifer Systems of the World. 2008. Available online: http://ihp-wins.unesco.org/layers/geonode:world_aquifer_systems (accessed on 12 November 2021).
- Haihe River Water Conservancy Commission, Ministry of Water Resources of China. Haihe River Water Resources Bulletin. 2020. Available online: http://www.hwcc.gov.cn/wwgj/xxgb/szygb/ (accessed on 12 November 2021).
- Save, H.; Bettadpur, S.; Tapley, B.D. High-resolution CSR GRACE RL05 mascons. J. Geophys.Res. Solid Earth 2016, 121, 7547–7569. [Google Scholar] [CrossRef]
- Cheng, M.K.; Ries, J.C. The unexpected signal in GRACE estimates of C20. J. Geod. 2017, 91, 897–914. [Google Scholar] [CrossRef]
- Cheng, M.K.; Ries, J.R. Monthly Estimates of C20 from 5 SLR Satellites Based on GRACE RL06 Models, GRACE Technical Note 11, The GRACE Project, Center for Space Research, University of Texas at Austin. 2019. Available online: https://podaac-tools.jpl.nasa.gov/drive/files/allData/grace/docs/TN-11_C20_SLR.txt (accessed on 12 November 2021).
- Swenson, S.; Chambers, D.; Wahr, J. Estimating geocenter variations from a combination of GRACE and ocean model output. J. Geophys. Res. Solid Earth 2008, 113, B08410. [Google Scholar] [CrossRef] [Green Version]
- Geruo, A.; John, W.; Shijie, Z. Computations of the viscoelastic response of a 3-D compressible Earth to surface loading: An application to Glacial Isostatic Adjustment in Antarctica and Canada. Geophys. J. Int. 2012, 192, 557–572. [Google Scholar] [CrossRef]
- Chen, J.L.; Wilson, C.R.; Tapley, B.D. The 2009 exceptional Amazon flood and interannual terrestrial water storage change observed by GRACE. Water Resour. Res. 2010, 46, W12526. [Google Scholar] [CrossRef] [Green Version]
- Cleveland, R.B.; Cleveland, W.S.; McRae, J.E.; Terpenning, I. STL: A seasonal trend decomposition precedure based on loess. J. Off. Stat. 1990, 6, 3–73. [Google Scholar]
- Landerer, F.W.; Swenson, S.C. Accuracy of scaled GRACE terrestrial water storage estimates. Water Resour. Res. 2012, 48, W04531. [Google Scholar] [CrossRef]
- Ren, Y.-Q.; Pan, Y.; Gong, H.-L. Haihe Basin groundwater reserves time-varying trends analysis. J. Cap. Norm. Univ. Nat. Sci. Ed. 2013, 34, 88–94. (In Chinese) [Google Scholar] [CrossRef]
- Ran, Q.; Pan, Y.; Wang, Y.; Chen, L.H.; Xu, H.L. Estimation of annual groundwater explotaation in Haihe River Basin by use of GRACE satellite data. Adv. Sci. Technol. Water Resour. 2013, 33, 42–47. [Google Scholar]
- Hebei Provincial Department of Water Resources, 2020, Hebei Water Resources Bulletin. Available online: http://slt.hebei.gov.cn/a/2021/08/04/F3A8F2A53BD44494B6F0A253372F4530.html (accessed on 12 November 2021).
- Zongyu, C.; Zhenlong, N.; Zhaoji, Z.; Jixiang, Q.; Yunju, N. Isotopes and Sustainability of Ground Water Resources, North China Plain. Ground Water 2005, 43, 485–493. [Google Scholar] [CrossRef]
- Zhong, M.; Duan, J.; Xu, H.; Peng, P.; Yan, H.; Zhu, Y. Trend of China land water storage redistribution at medi- and large-spatial scales in recent five years by satellite gravity observations. Chinese Sci. Bull. 2009, 54, 816–821. [Google Scholar] [CrossRef] [Green Version]
- Moiwo, J.P.; Tao, F.; Lu, W. Analysis of satellite-based andin situhydro-climatic data depicts water storage depletion in North China Region. Hydrol. Processes 2013, 27, 1011–1020. [Google Scholar] [CrossRef]
- Yin, W.; Li, T.; Zheng, W.; Hu, L.; Han, S.-C.; Tangdamrongsub, N.; Šprlák, M.; Huang, Z. Improving regional groundwater storage estimates from GRACE and global hydrological models over Tasmania, Australia. Hydrogeol. J. 2020, 28, 1371–1388. [Google Scholar] [CrossRef]
- Tang, Q.; Zhang, X.; Tang, Y. Anthropogenic impacts on mass change in North China. Geophys. Res. Lett. 2013, 40, 3924–3928. [Google Scholar] [CrossRef]
- Feng, W.; Wang, C.-q.; Mu, D.-p.; Zhong, M.; Zhong, Y.-l.; Xu, H.-z. Groundwater storage variations in the North China Plain from GRACE with spatial constraints. Chin. J. Geophys. 2017, 60, 1630–1642. (In Chinese) [Google Scholar]
- Su, X.-L.; Ping, J.-s.; Ye, Q.-x. Terrestrial water variations in the North China Plain revealed by the GRACE mission. Sci. China Earth Sci. 2011, 54, 1965–1970. (In Chinese) [Google Scholar] [CrossRef]
- Chen, Z.; Wang, W.; Jiang, W.; Gao, M.; Zhao, B.; Chen, Y. The Different Spatial and Temporal Variability of Terrestrial Water Storage in Major Grain-Producing Regions of China. Water 2021, 13, 1027. [Google Scholar] [CrossRef]
- Liu, F.-f.; Huang, Y.-h.; Yao, H.-r.; Han, J.-f.; Ren, H.-y. Spatiotemporal evolution pattern of groundwater storage changes in Beijing-Tianjin-Hebei region based on GRACE. South North Water Transf. Water Sci. Technol. 2021, 19, 874–882. [Google Scholar]
- He, P.; Sun, Z.; Han, Z.; Ma, X.; Zhao, P.; Liu, Y.; Ma, J. Divergent Trends of Water Storage Observed via Gravity Satellite across Distinct Areas in China. Water 2020, 12, 2862. [Google Scholar] [CrossRef]
- Wang, C.; Yang, T. Spatial-temporal characteristics of terrestrial water storage variations in China based on GRACE Satellite Data. Warer Resour. Power 2013, 31, 20–23. [Google Scholar]
- Pan, Y.; Zhang, C.; Gong, H.; Yeh, P.J.F.; Shen, Y.; Guo, Y.; Huang, Z.; Li, X. Detection of human-induced evapotranspiration using GRACE satellite observations in the Haihe River basin of China. Geophys. Res. Lett. 2017, 44, 190–199. [Google Scholar] [CrossRef]
- Andersen, O.B.; Seneviratne, S.I.; Hinderer, J.; Viterbo, P. GRACE-derived terrestrial water storage depletion associated with the 2003 European heat wave. Geophys. Res. Lett. 2005, 32, L18405. [Google Scholar] [CrossRef]
- Jianting, C.; Jun, X.; Chongyu, X.; Lu, L.; Zhonggen, W. Spatial and temporal variability of daily precipitation in Haihe River basin, 1958–2007. Acta Geogr. Sin. 2010, 20, 248–260. [Google Scholar]
- Liu, J.; Qin, D.; Wang, H.; Wang, M.; Yang, Z. Dualistic water cycle pattern and its evolution in Haihe River basin. Chin. Sci. Bull. 2010, 55, 1688–1697. [Google Scholar] [CrossRef]
- Bao, Z.; Zhang, J.; Wang, G.; Fu, G.; He, R.; Yan, X.; Jin, J.; Liu, Y.; Zhang, A. Attribution for decreasing streamflow of the Haihe River basin, northern China: Climate variability or human activities? J. Hydrol. 2012, 460–461, 117–129. [Google Scholar] [CrossRef]
- Zhang, J.; Liu, K.; Wang, M. Seasonal and Interannual Variations in China’s Groundwater Based on GRACE Data and Multisource Hydrological Models. Remote Sens. 2020, 12, 845. [Google Scholar] [CrossRef] [Green Version]
- Sun, Z.; Zhu, X.; Pan, Y.; Zhang, J.; Liu, X. Drought evaluation using the GRACE terrestrial water storage deficit over the Yangtze River Basin, China. Sci. Total Environ. 2018, 634, 727–738. [Google Scholar] [CrossRef] [PubMed]
- University of East Anglia. Self-Calibrating Palmer Drought Severity Index for Global Land. 2019. Available online: https://www.droughtmanagement.info/self-calibrated-palmer-drought-severity-index-sc-pdsi/ (accessed on 12 November 2021).
- Frappart, F. Groundwater Storage Changes in the Major North African Transboundary Aquifer Systems during the GRACE Era (2003–2016). Water 2020, 12, 2669. [Google Scholar] [CrossRef]
- Siebert, S.; Burke, J.; Faures, J.M.; Frenken, K.; Hoogeveen, J.; Döll, P.; Portmann, F.T. Groundwater use for irrigation—A global inventory. Hydrol. Earth Syst. Sci. 2010, 14, 1863–1880. [Google Scholar] [CrossRef] [Green Version]
- Qiu, J. China faces up to groundwater crisis. Nature 2010, 466, 308. [Google Scholar] [CrossRef] [Green Version]
- Tiwari, V.M.; Wahr, J.; Swenson, S. Dwindling groundwater resources in northern India, from satellite gravity observations. Geophys. Res. Lett. 2009, 36, L18401. [Google Scholar] [CrossRef] [Green Version]
- Strassberg, G.; Scanlon, B.R.; Chambers, D. Evaluation of groundwater storage monitoring with the GRACE satellite: Case study of the High Plains aquifer, central United States. Water Resour. Res. 2009, 45, W05410. [Google Scholar] [CrossRef] [Green Version]
- Scanlon, B.R.; Longuevergne, L.; Long, D. Ground referencing GRACE satellite estimates of groundwater storage changes in the California Central Valley, USA. Water Resour. Res. 2012, 48, W04520. [Google Scholar] [CrossRef] [Green Version]
- Cao, G.; Scanlon, B.R.; Han, D.; Zheng, C. Impacts of thickening unsaturated zone on groundwater recharge in the North China Plain. J. Hydrol. 2016, 537, 260–270. [Google Scholar] [CrossRef]
- Changming, L.; Jingjie, Y.; Kendy, E. Groundwater Exploitation and Its Impact on the Environment in the North China Plain. Water Int. 2001, 26, 265–272. [Google Scholar] [CrossRef]
- Zhao, Y.; Zhu, Y.; Lin, Z.; Wang, J.; He, G.; Li, H.; Li, L.; Wang, H.; Jiang, S.; He, F.; et al. Energy Reduction Effect of the South-to-North Water Diversion Project in China. Nature 2017, 7, 15956. [Google Scholar] [CrossRef] [PubMed] [Green Version]


Publisher’s Note: MDPI stays neutral with regard to jurisdictional claims in published maps and institutional affiliations. |
© 2022 by the authors. Licensee MDPI, Basel, Switzerland. This article is an open access article distributed under the terms and conditions of the Creative Commons Attribution (CC BY) license (https://creativecommons.org/licenses/by/4.0/).