Article

Influence of the Geosynthetic Type and Compaction Conditions on the Pullout Behaviour of Geosynthetics Embedded in Recycled Construction and Demolition Materials

by
Castorina S. Vieira
* and
Paulo M. Pereira
CONSTRUCT, Faculty of Engineering, University of Porto, R. Dr. Roberto Frias, 4200-465 Porto, Portugal
*
Author to whom correspondence should be addressed.
Sustainability 2022, 14(3), 1207; https://doi.org/10.3390/su14031207
Submission received: 8 October 2021 / Revised: 31 December 2021 / Accepted: 13 January 2022 / Published: 21 January 2022

Abstract

:
The effects of the climate change that the planet has been experiencing, and the growing awareness of citizens that natural resources are finite, highlight the inevitability of making society more sustainable. Since the construction industry is responsible for a high consumption of natural resources and it simultaneously produces high volumes of waste, it is of great importance to investigate the feasibility of using construction and demolition (C&D) wastes as alternatives to common natural materials. This paper investigates the feasibility of using fine-grain recycled C&D wastes as backfill material of geosynthetic reinforced steep slopes, through a laboratory study focused mainly on the pullout behaviour of two geosynthetics embedded in these alternative materials. The influence of the geosynthetic type, moisture content and compaction degree of the recycled C&D material on the pullout behaviour is assessed and discussed. The physical and mechanical characterization of the filling material is also presented. The pullout test results have pointed out that, although the two geosynthetics have similar tensile strength, the pullout resistance of the geogrid is higher than that of the geotextile and is achieved at lower frontal displacements. While the reduction of the compaction moisture content below the optimum value induced a slight decrease in the geogrid pullout resistance (ranging from 5% to 7%), conversely the pullout capacity of the geotextile increased up to 22%. The compaction degree of the recycled C&D material had the expected effect on the geotextile pullout resistance, reflected in an increase of about 20% when the degree of compaction rose from 80% to 90%. However, the expected trend was not observed on the geogrid pullout behaviour. The pullout interaction coefficient tended to decrease with the variation of the compaction moisture content around the optimum value (maximum decrease of 33% and 16% for the geogrid and the geotextile, respectively) and with an increase in the vertical confining pressure from 10 kPa up to 50 kPa (decrease around 25%). The average value of the pullout interaction coefficient, fb, ranged from 0.61 to 1.09 for the geogrid and from 0.67 to 1.25 for the geotextile. From all these findings it can be concluded that recycled C&D materials can be seen as an environmentally friendly alternatives to the natural resources commonly used in the construction of geosynthetic-reinforced embankments.

1. Introduction

The construction industry has been identified as responsible for the consumption of around 50% of natural resources, 40% of energetic consumption and 50% of the total waste produced [1,2]. C&D wastes refer to the waste produced by construction, reconstruction, conservation, demolition or downfall of structures and infrastructures, being produced in huge quantities, mainly in urban areas. These wastes must be properly managed so as to avoid negative environmental impacts, and recycling alternatives should be found.
Recycling of C&D wastes has been studied over the years. Recycled C&D materials have been considered for use as alternative aggregates in concrete and mortars [3,4,5,6,7,8], as sustainable replacements for cement in soil stabilization [9,10,11] or mortar production [12,13], in base and sub-base layers of transportation infrastructure [14,15,16,17], as backfilling of pipes [18,19] or as filling materials of geosynthetic reinforcement structures [20,21,22,23].
This paper is expected to be a contribution to the latter application above mentioned. Geosynthetic-reinforced soil structures, such as steep slopes, retaining walls and bridge abutments, have gained wide acceptance throughout the world due to their technical, economic and environmental benefits. If the replacement of the soil, the natural resource used commonly in the construction of these structures, by recycled materials, such as recycled C&D wastes, becomes a feasible solution, the environmental benefits will be enhanced.
The interaction between the fill material (soil or other) and the geosynthetics is a topic of great relevance concerning this application, since it largely affects the stability of the geosynthetic-reinforced soil structures. As a matter of fact, the geosynthetic length and, thereafter, the size of the reinforced block depends on the interface properties.
Figure 1 illustrates a potential failure mechanism of a geosynthetic-reinforced steep slope and the most suitable laboratory tests for the characterization of the interface’s resistance. When the potential failure mechanism tends to provoke the sliding of the fill mass on the geosynthetic surface, the interface should be characterized through direct shear tests. If the reinforcement tends to be pulled out, then pullout tests should be used to characterize soil–geosynthetic interaction.
Over the last decades, soil–geosynthetic interactions have been studied through laboratory pullout tests [25,26,27,28,29,30] (Table 1). Alfaro et al. [25] discussed a new apparatus and evaluated the effects of the dilatancy. Lopes and Ladeira [26] reported the effects of specimen geometry, soil height and sleeve length on the pullout behaviour of geogrids. The influence of the confinement pressure, soil density and displacement rate on the pullout behaviour of geogrids was discussed by [27]. Ferreira et al. [28] studied the influence of soil density and moisture content on the pullout behaviour of different geosynthetics. The effects of cyclic loading on pullout resistance of geogrids embedded in compacted soils was analysed by Ferreira et al. [29] and Moraci and Cardile [30]—Table 1.
The laboratory studies on the pullout behaviour of geosynthetics embedded in recycled C&D waste are more recent and scarce (Table 1). Soleimanbeigi et al. [31] and Vieira et al. [32] presented results of direct shear tests and pullout tests carried out with various geosynthetics embedded in a recycled concrete aggregate (RCA) [31] and in a mixed recycled C&D material [32]. The effects of the specimen size and displacement rate on the pullout behaviour of geogrids embedded in a recycled C&D material were investigated by Vieira et al. [33]. The influence of cyclic loading on the pullout behaviour of various geosynthetics was studied by Vieira et al. [34].
Recent studies regarding the pullout behaviour of geosynthetics embedded in biocemented soils [35], marginal tropical soils [36] and in pond ash from thermal power plants [37] should also be highlighted.
This paper evaluates and discusses the effects of the compaction conditions, namely the moisture content and compaction degree of the recycled C&D material on the pullout behaviour of two distinct geosynthetics (a polyester geogrid and a high-strength composite geotextile). To the best of the authors’ knowledge, there are no studies in which the effects of the compaction conditions of the recycled C&D material have been studied. Understanding these effects is of great importance since the pullout behaviour of geosynthetics is strongly influenced by these conditions.

2. Materials and Methods

2.1. Materials

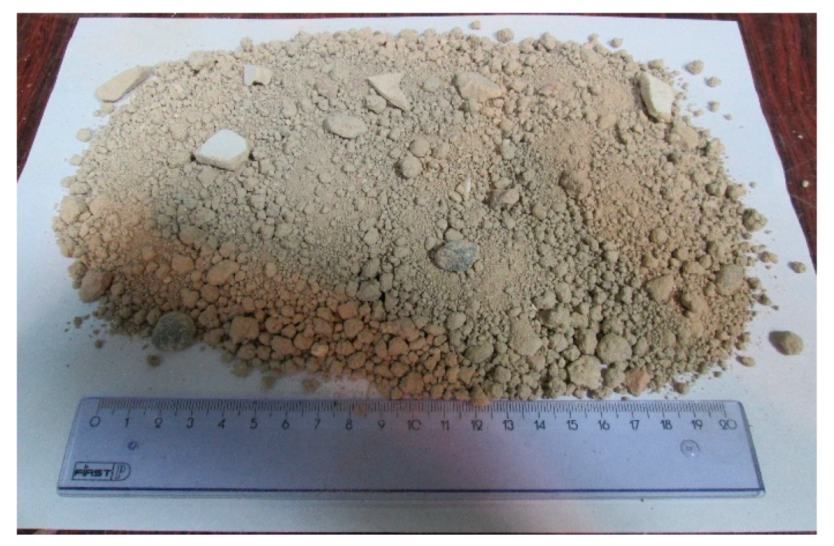
The recycled C&D material used in this work was obtained from a Portuguese recycling plant. C&D wastes used to produce this recycled material were mainly from the rehabilitation or demolition of small residential buildings and the cleaning up of illegal C&D waste dumps. As mentioned before, this study follows up on a previous work [33]; recycled material from the same batch was therefore used. It refers to a fine-grain fraction produced during the recycling process and due, mainly, to the high soil content and heterogeneity, it has limited demand from building contractors. A sample of the recycled C&D material is illustrated in Figure 2. Its geotechnical characterization will be presented in Section 3.
A laid uniaxial geogrid manufactured of extruded polyester (PET) bars with welded rigid junctions (Figure 3a) and a high-strength composite geotextile consisting of polypropylene (PP) continuous-filament needle-punched nonwoven and high-strength PET yarns (Figure 3b) were used in this study. Both geosynthetics are currently used as reinforcement materials in geosynthetic-reinforced structures (steep slopes and retaining walls). The main physical and mechanical properties of these geosynthetics are summarized in Table 2.

2.2. Pullout Tests

Several pullout test devices have been developed by different researchers around the world [26,38,39,40,41,42,43]. Commonly, the pullout test apparatus is composed of a rigid pullout box, a vertical load application system, a horizontal force application device, a clamping system and associated instrumentation [26,44].
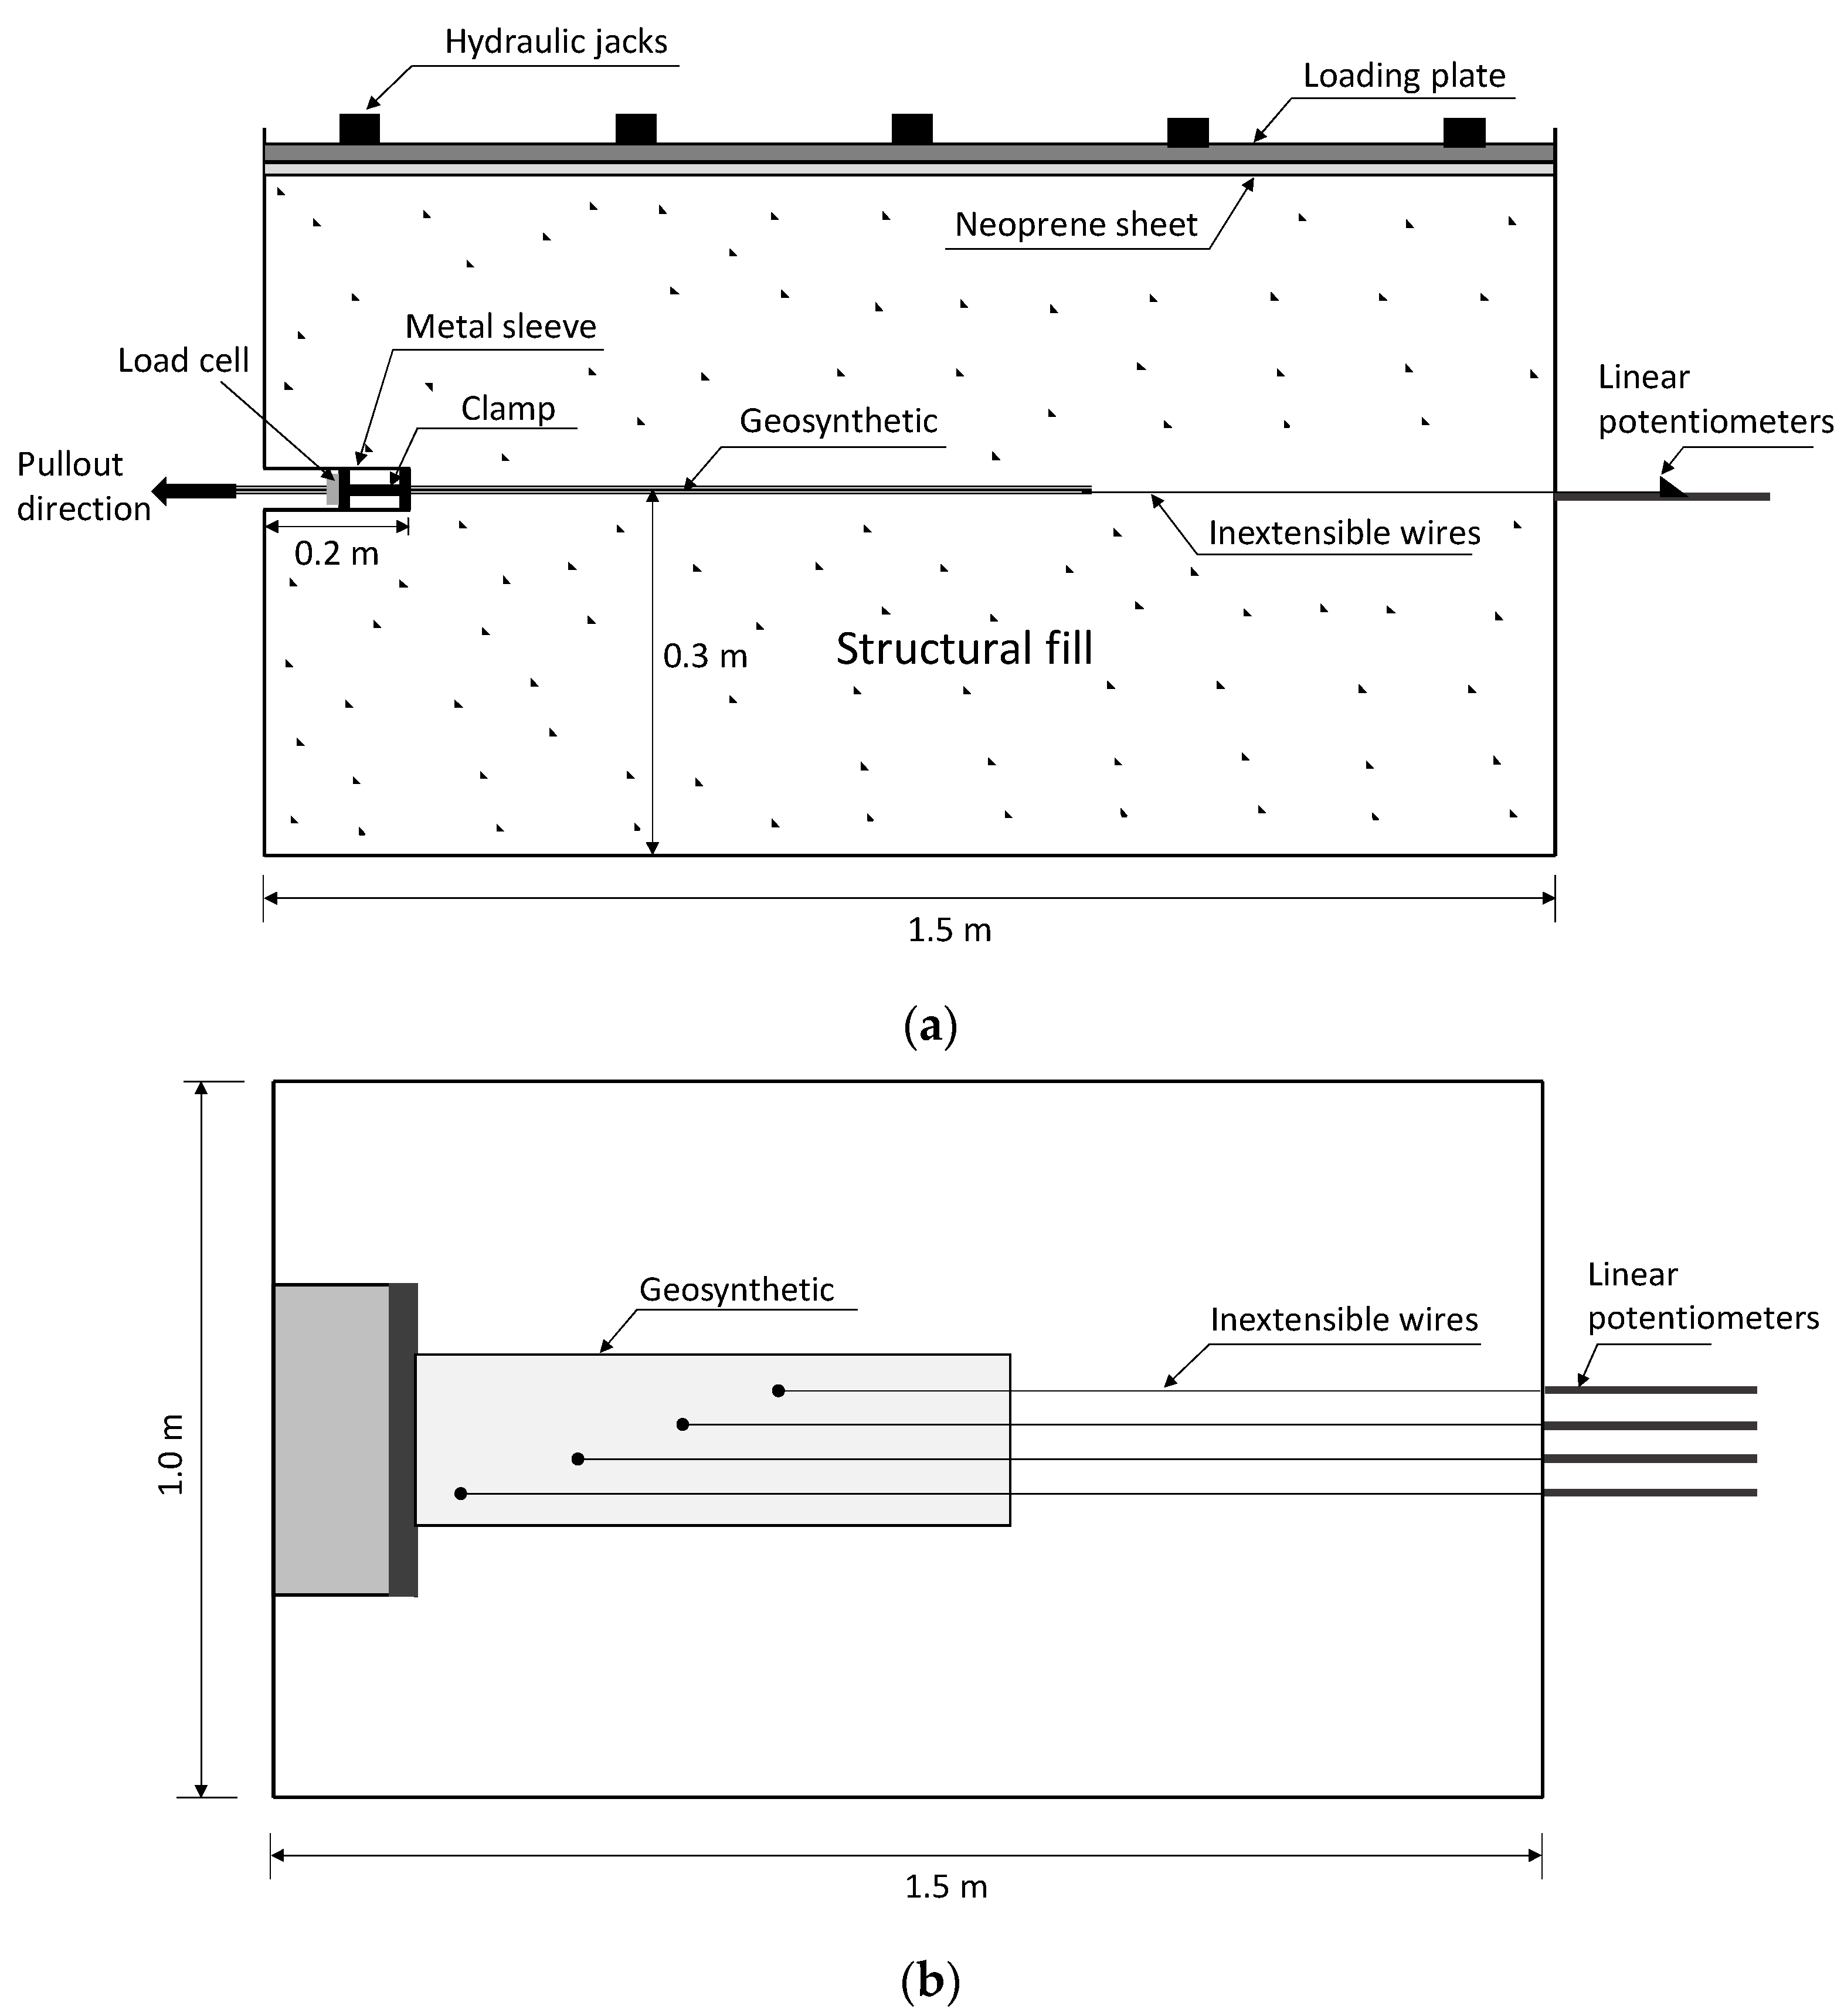
The large-scale pullout test apparatus used in this study (Figure 4) was developed at the University of Porto within the scope of previous research [26]. The pullout box consists of a modular structure with internal dimensions of 1.5 m long, 1.0 m wide and 0.8 m deep. The box is equipped with a 0.2 m long sleeve in order to minimize the frictional effects of the front wall (Figure 4). Considering that the clamping system is inserted into the pullout box through a metal sleeve, the initial unconfined length of the specimens is negligible. The normal stress is applied through ten small hydraulic jacks on a wooden loading plate. Between the top layer of the structural fill (soil or other material) and the loading plate, a 25 mm thick neoprene sheet is placed to reduce top boundary–soil friction.
The displacements throughout the geosynthetic length can be monitored using inextensible wires connected to the geosynthetic specimen, at one end, and to linear potentiometers placed outside the pullout box, at the other end (Figure 4). The frontal displacement of the specimen is obtained through a linear potentiometer and the pullout force recorded by a load cell.
The backfill material (or structural fill) was previously prepared at the required moisture content and then it was placed inside the pullout box, levelled and compacted using a compacting hammer to fill the volume of each layer (150 mm thick) identified on the walls of the box. After compacting the first two layers, the geosynthetic was fixed in the clamping system and introduced into the pullout box over the compacted backfill material. If the use of potentiometers is intended, the inextensible wires are fixed to the geosynthetic specimen and connected to the linear potentiometers (Figure 5b). Afterwards two more layers of recycled C&D material with 150 mm thick each are compacted over the geosynthetic specimen.
Once the compaction is completed, the neoprene sheet and the loading plate are placed over the fill and the hydraulic jacks are properly positioned. Before starting the pullout loading, the normal stress previously established was applied on the test samples for a period of 30 min.
A constant pullout displacement rate of 2 mm/min was considered in accordance with the European Standard [45].
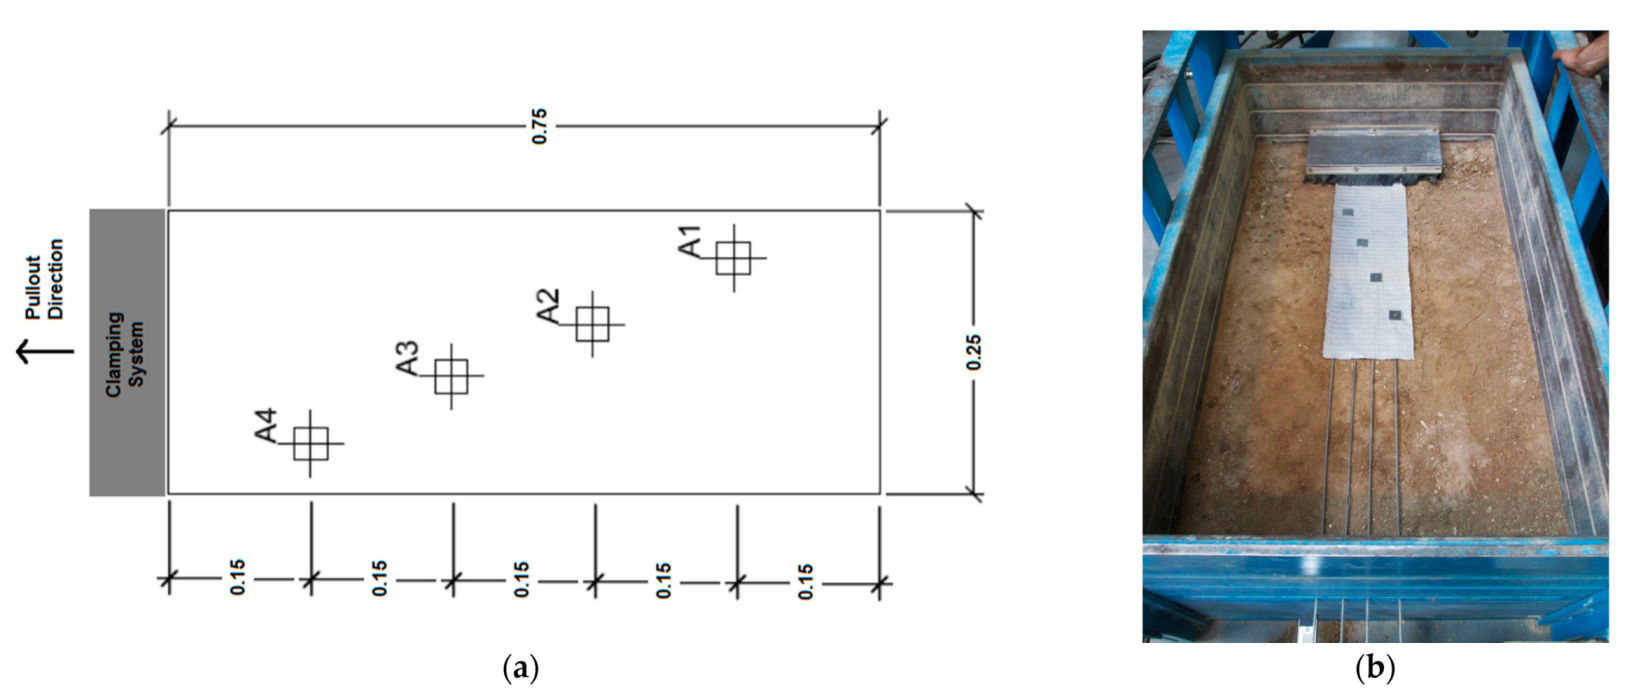
The geosynthetic specimens were tested with dimensions of 250 mm × 750 mm, complying with the ratio of confined length to width equal to three, as recommended by the standard [45]. The displacements throughout the length the geotextile (GCR) were recorded by linear potentiometers at the locations shown in Figure 5a. In the tests performed with the geogrid (GGR), the use of potentiometers was not viable, since the fixing system induced the premature rupture in the junctions of the bars during the pullout.
The laboratory study was designed to appreciate the influence of the geosynthetic type, compaction conditions and confining pressure at the interface level on the pullout behaviour of different geosynthetics embedded in a recycled C&D material. To investigate the influence of the moisture content, the recycled material was compacted at its optimum moisture content (OMC), OMC−3% and OMC+3% for 80% or 90% of the maximum dry density (MDD). The influence of the vertical confining pressure was evaluated carrying out pullout tests for 10, 25 and 50 kPa at the interface level. The pullout test programme is summarized in Table 3. Note that for each condition, three specimens were tested.

2.3. Pullout Interaction Coefficient

The behaviour of the interfaces between the geosynthetic and the filling material plays a major role in the design and stability analyses of geosynthetic-reinforced structures. The strength of these interfaces is typically established on interaction coefficients.
The pullout interaction coefficient, fb, is usually defined as the ratio between the maximum shear stress mobilized at the interface during pullout and the shear strength of the backfill material for the same confining pressure, σ:
f b = τ p u l l o u t m a x ( σ ) τ d i r e c t   s h e a r m a x ( σ ) = τ p τ d s
The pullout interaction coefficients for the interfaces under analysis were evaluated and will be presented and discussed in the next section.

3. Results and Discussion

3.1. Physical and Mechanical Characterization of the Recycled C&D Material

The particle size distribution of this fine-grained recycled C&D material determined by sieving and sedimentation is illustrated in Figure 6. The gradation limits for backfill materials of geosynthetic-reinforced segmental retaining walls (SRW) specified by the National Concrete Masonry Association (NCMA) [46] and mechanically stabilized earth walls (MSEW) and reinforced soil slopes (RSS) indicated by the Federal Highway Administration (FHWA) [47] are also shown in Figure 6.
In spite of the high fine content (16.9%), the particle size distribution of this recycled material is consistent with the requirements of NCMA for segmental retaining walls (SRW) and those of FHWA for reinforced soil slopes (RSS). This recycled material does not meet the gradation limits for backfill materials of mechanically stabilized earth walls (MSEW).
Table 4 summarizes the main physical and mechanical properties of the recycled C&D material. According to the Unified Soil Classification System (USCS), this recycled material can be classified as a silty sand (SM).
Large-scale direct shear tests (shear box with internal dimensions 300 mm × 600 mm × 200 mm) were carried out to evaluate the internal shear strength of the recycled C&D material for all the compaction conditions considered in the test programme (Table 3). The direct shear tests were performed on a prototype apparatus presented in previous publications [22,24,48] under normal stresses of 25, 50, 100 and 150 kPa. As recommended by the standard EN ISO 12957-1 [49], the tests were carried out twice for the normal stress of 100 kPa.
The potential variability of the results of direct shear tests carried out on recycled C&D materials was evaluated in a previous work [22]. In that study, performed with a material provided by the same recycling plant and similar particle size distribution, each direct shear test was performed three times under similar conditions, and the authors found that the variability among the results was low (in general below 8%).
The internal shear strength parameters of the recycled C&D material for each compaction condition are presented in Table 5.
From Table 5 it can be concluded that the increase in the moisture content (from OMC−3% to OMC+3%) leads to the decrease of the internal shear strength of the recycled material. As expected, increasing the compaction dry density induced the increase of the backfill shear strength.

3.2. Influence of the Geosynthetic Type on the Pullout Behaviour

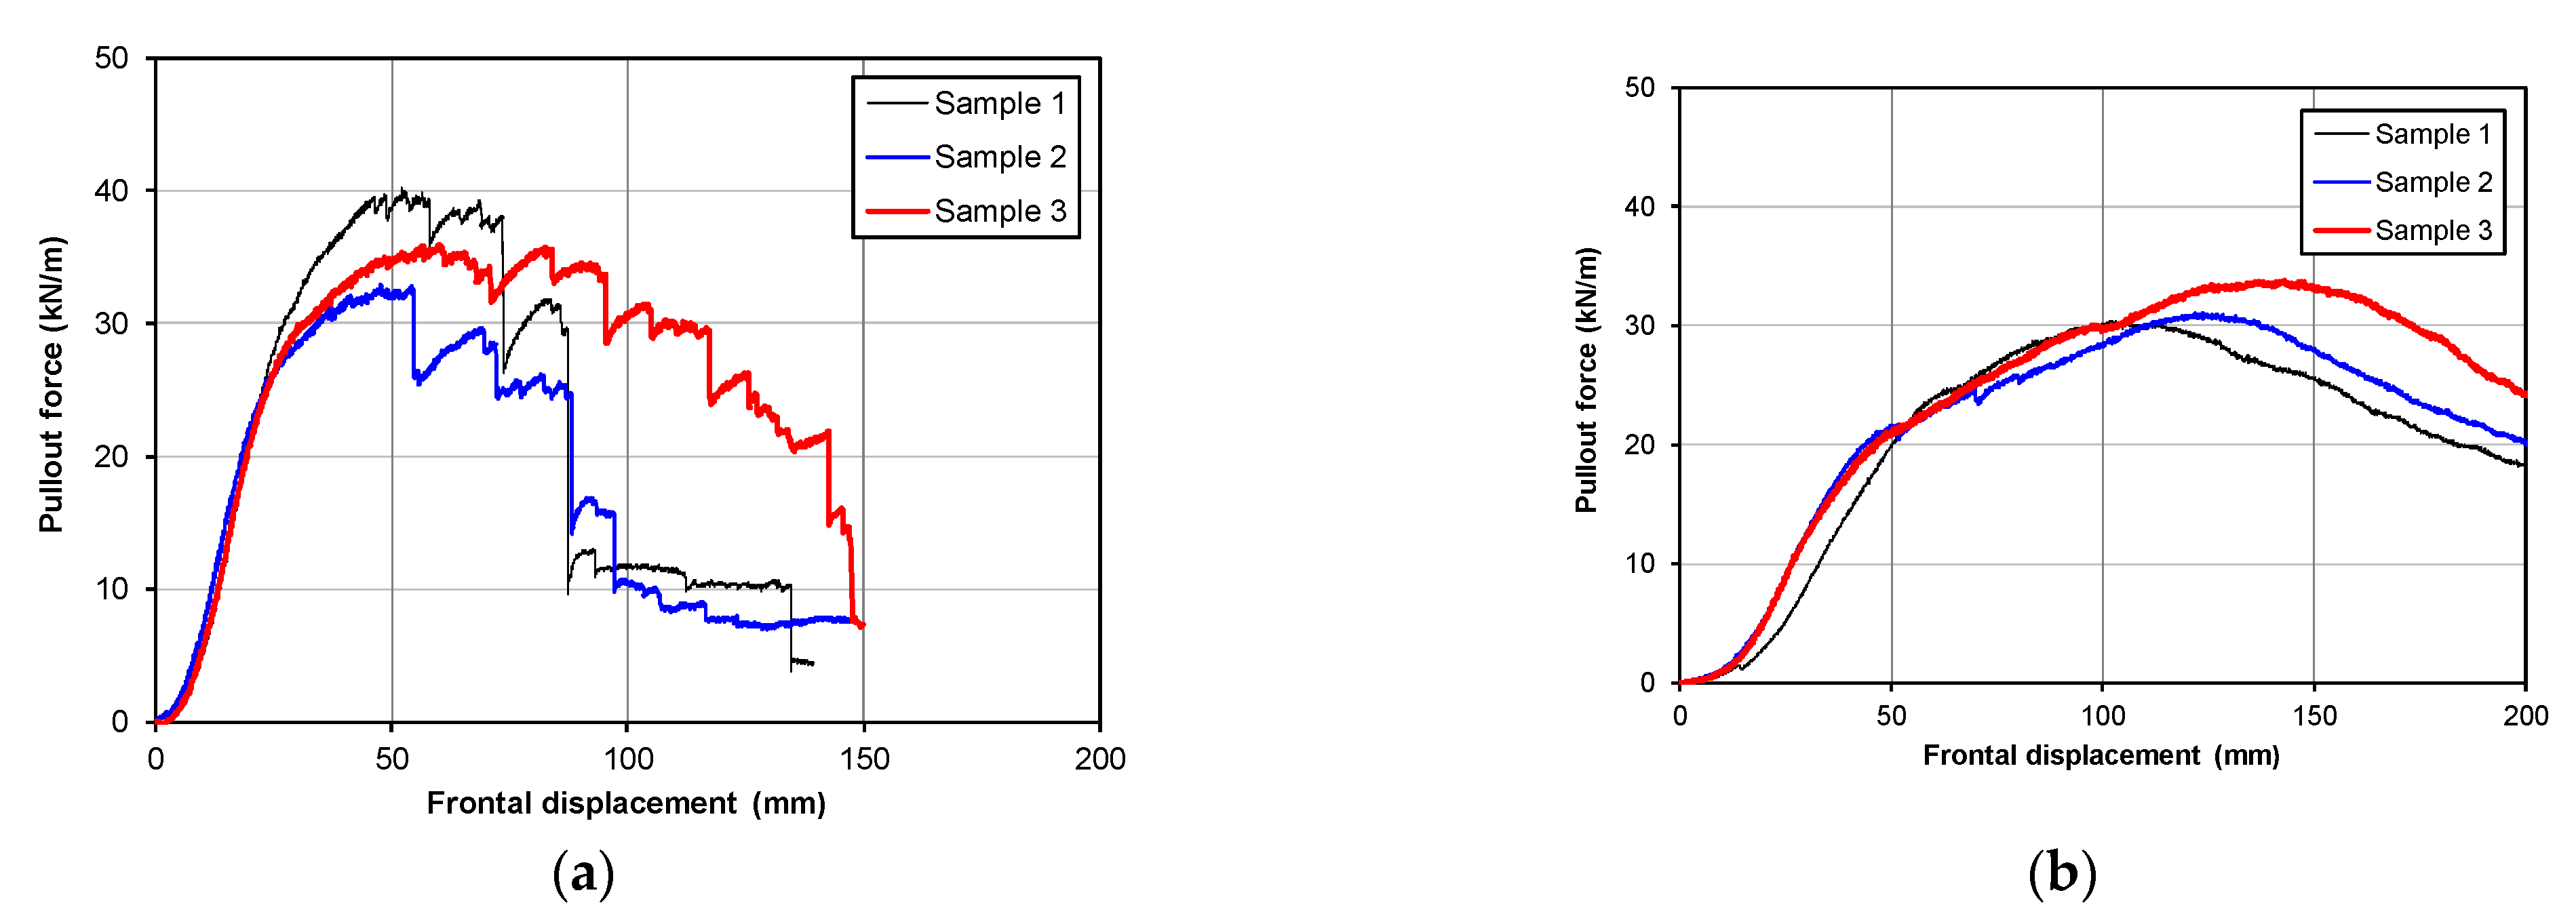
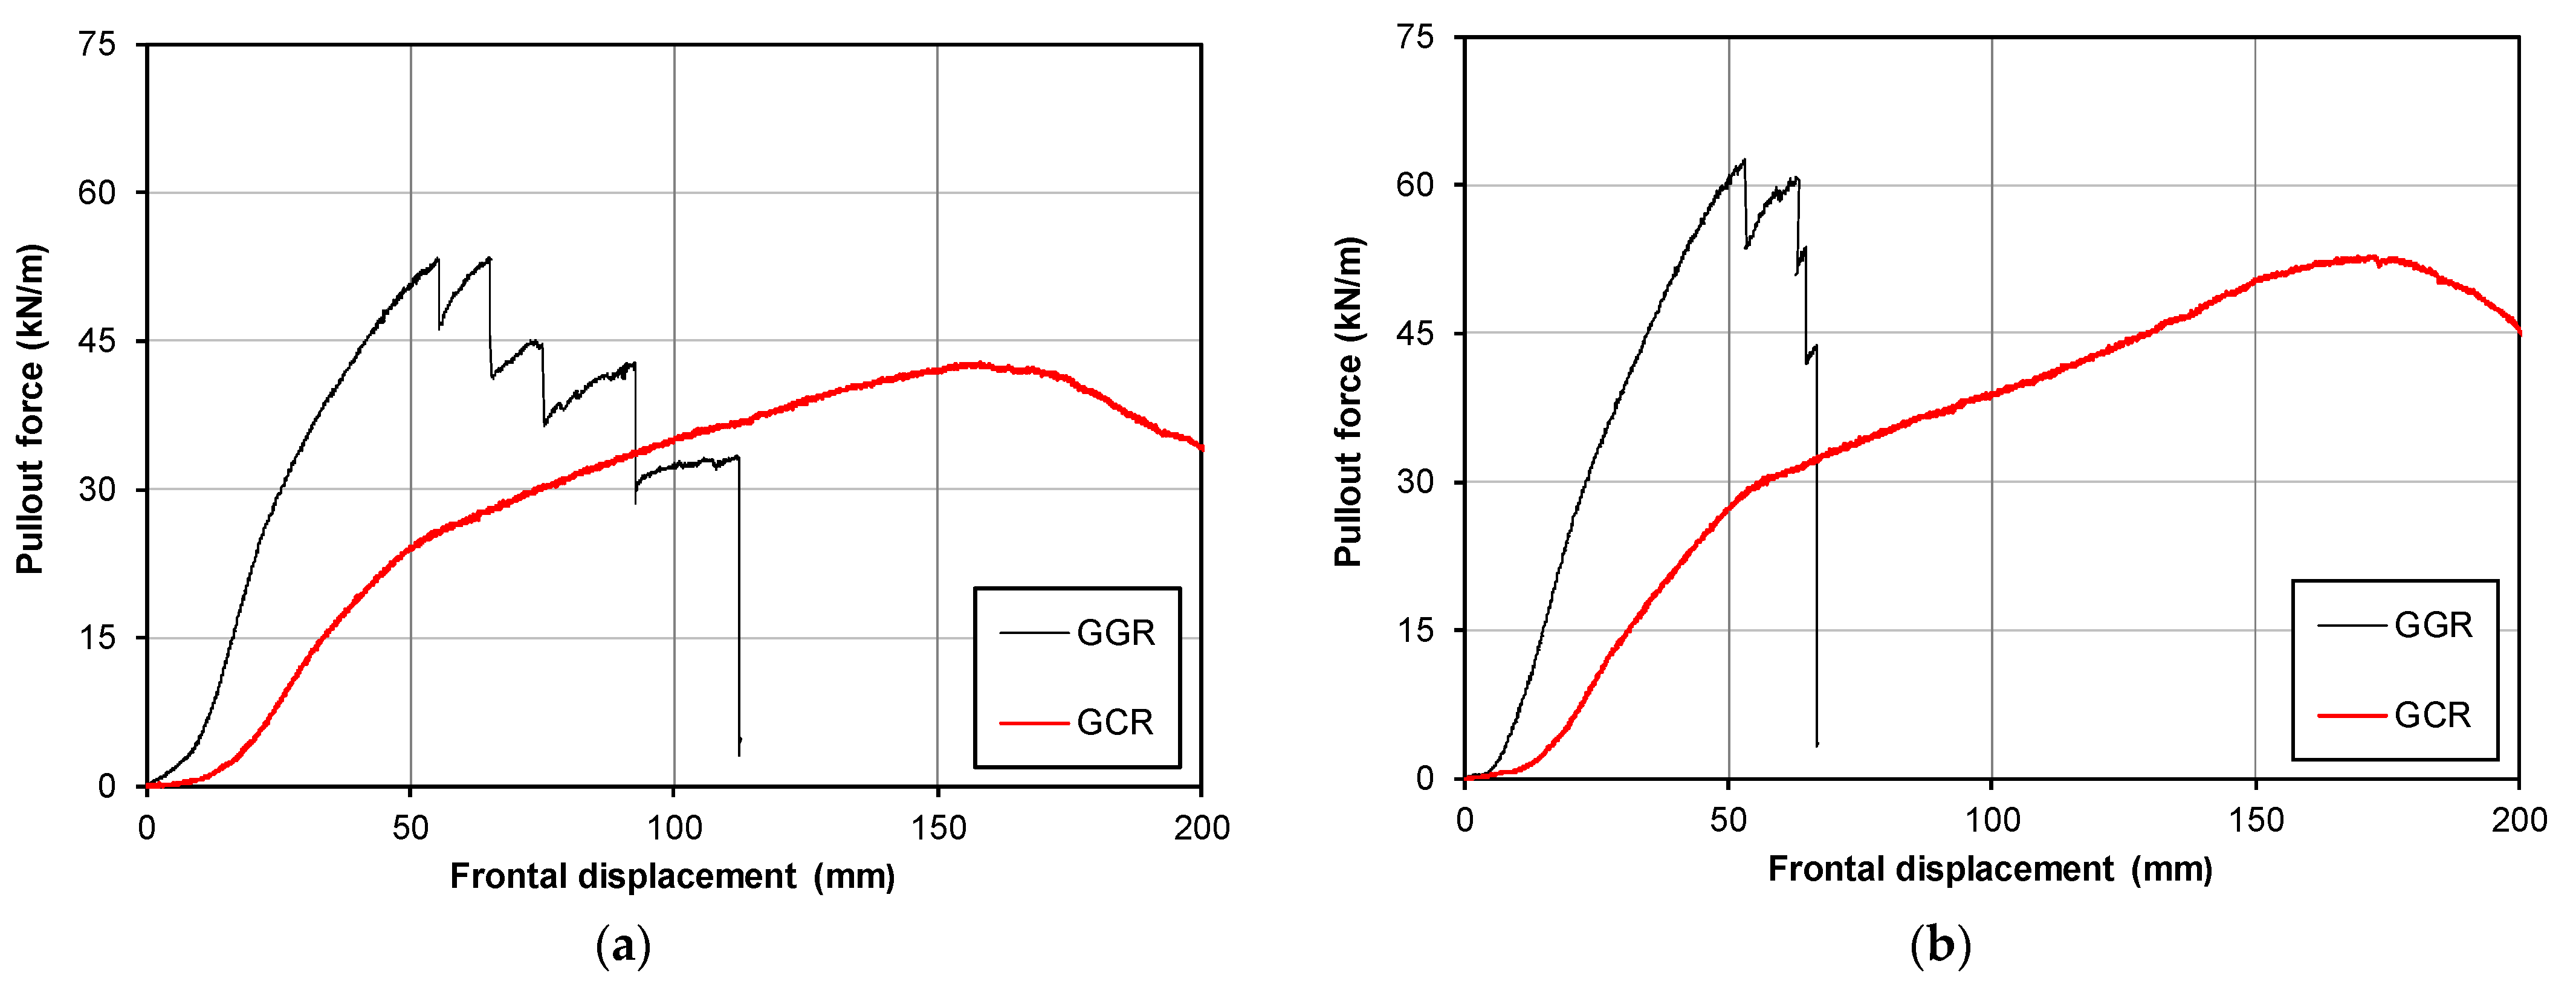
The pullout behaviour of both geosynthetics and the variability among the three test specimens are compared in Figure 7. The results presented in these graphs refer to pullout tests carried out under vertical confining pressure at the interface level of 10 kPa (tests T1 and T11).
From Figure 7 it can be seen that there is some variability of results in terms of both pullout resistance, PR, and corresponding frontal displacement, dPR. The coefficient of variation for the resistance PR was 10% and 6% for the geogrid and the geotextile, respectively. Concerning the displacement dPR, the variability was slightly higher in the geotextile than in the geogrid (coefficient of variation of 15% and 12%, respectively). It should be mentioned that the variability of the results tends to be lower for higher vertical confining stresses.
Figure 7 shows that the pullout resistance of the geogrid is higher than that of the geotextile and is achieved at lower frontal displacements. It is worth mentioning that the stiffness of the geogrid is much higher than that of the geotextile (the geogrid in-isolation secant stiffness at 2% strain is about three times higher—Table 2). Thus, it was already expected that the geogrid pullout resistance would be achieved for smaller displacements. Regarding the pullout resistance, it should be recalled that the pullout resistance of the geogrids results from the skin friction along the reinforcement and the passive thrust on the transversal members of the geogrid, while in the geotextiles the second component does not exist. Therefore, geogrids tend to exhibit higher pullout resistance than geotextiles of similar tensile strength.
The sudden drops in the pullout force shown in Figure 7a are due to sequential rupture of the welded junctions of the transversal bars. As can be seen in Figure 8, at the end of the pullout tests the transversal bars have become separated from the longitudinal bars. It should be noted, however, that this occurs because the geogrid has been led to pullout failure. The junctions are not expected to break under working conditions.
The sequential failure of the welded junctions of the transversal bars, as well as the heterogeneity of the filling material, are the main reasons for the higher variability of results found in Figure 7a.
As mentioned in Section 2.2, the displacements throughout the length of the geogrid during pullout were not recorded since the fixing system of the inextensible wires induced the premature rupture of the junctions and affected the test results. Therefore, it should be noted that the sudden breaks evidenced in the graphs of Figure 7a were not caused by the linear potentiometers, but reflect the pullout behaviour of this geogrid.
The pullout behaviours of both geosynthetics are also compared in Figure 9 for vertical confining pressure at the interface level of 25 kPa (tests T2 and T12) and 50 kPa (tests T3 and T13). For simplicity, only one representative curve for each test was plotted.
Regardless of the vertical confining pressure, the pullout resistance of the geogrid was higher than that of the geotextile and was achieved at lower frontal displacements, meaning that the tensile stiffness of the geogrid is much higher than that of the geotextile. The confined tensile stiffness of the geogrid tended to increase with the confining pressure.
While the geogrid exhibited a brittle-type pullout failure for 25 kPa and 50 kPa due to insufficient tensile strength under confinement, the geotextile showed a ductile failure regardless of the confining pressure. The internal displacements recorded throughout the geotextile’s length during pullout tests T12 and T13 are shown in Figure 10. The location of points A1–A4 is represented in Figure 5a.
Figure 10 shows the progressive mobilisation of the geotextile’s length during pullout tests. For example, up to a pullout displacement (or frontal displacement) of around 50 mm, the recorded displacements at location A4 are almost null, meaning that only the initial 0.15 m length of the geotextile (see Figure 5a) is being mobilised. Comparing the graphs presented in Figure 10, it can be concluded that for the same pullout displacement the increase in the vertical confining pressure reduced the internal displacements along the geotextile’s length, this reduction being more evident in the locations further away from the pulled area (points A1 and A2).
Table 6 summarises the results of the pullout tests (mean values) carried out on both geosynthetics when the recycled C&D material was compacted to 80% of the maximum dry density (MDD) at the optimum moisture content (tests T1–T3 and T11–T13). As previously mentioned, the geogrid revealed higher pullout resistance, PR, achieved for much lower frontal displacement, dPR. The increase in the vertical confining pressure, σv, led to the increase in the pullout resistance, with the most significant increase occurring when σv grew from 10 to 25 kPa. For higher confining pressures, larger frontal displacements were required to achieve the pullout resistance, particularly for the geotextile.

3.3. Influence of Moisture Content of the Recycled C&D Material

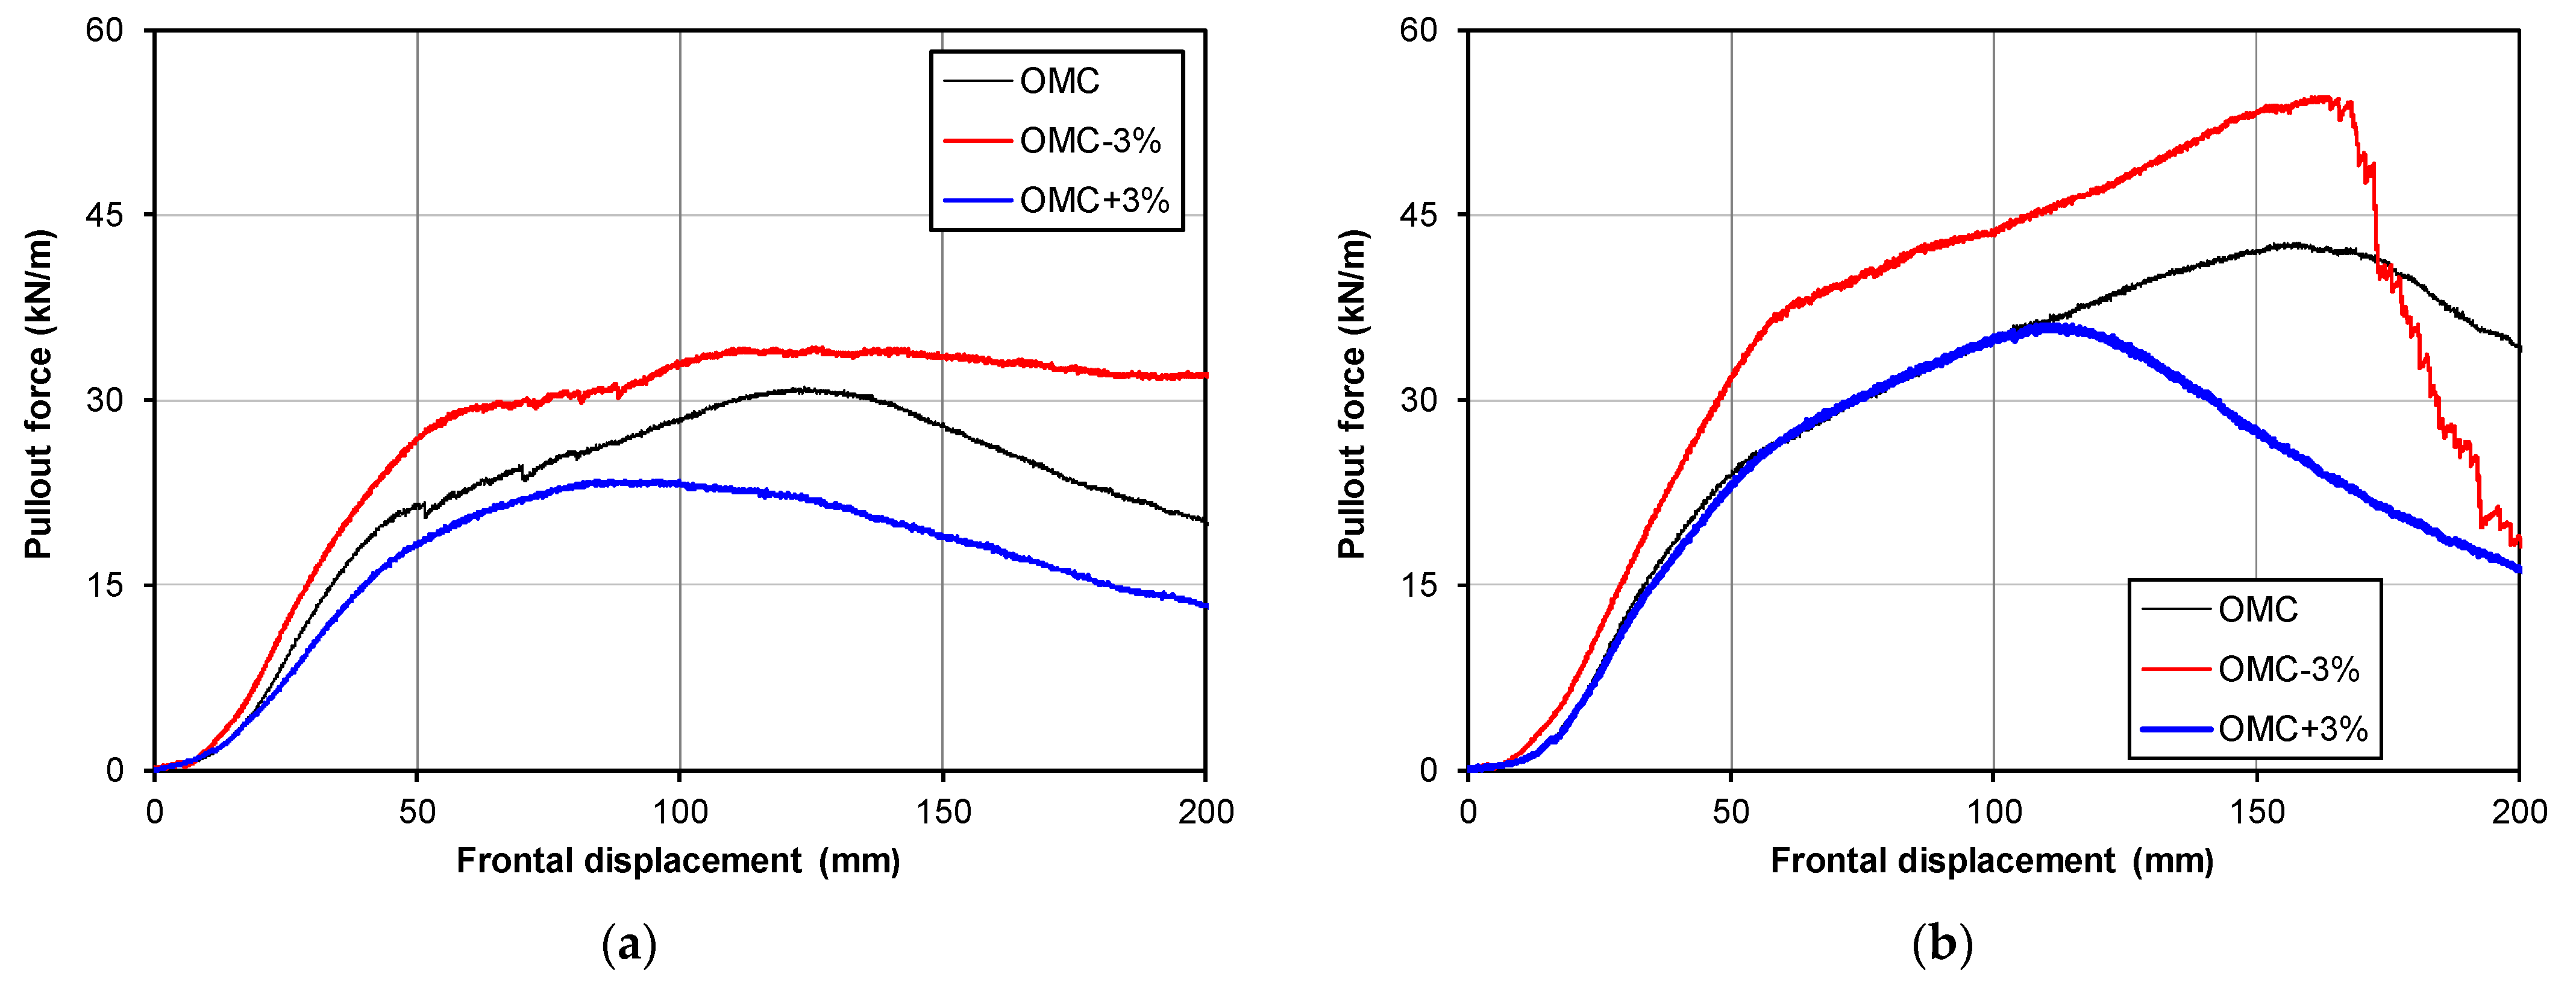
Figure 11 and Figure 12 present the influence of the moisture content of the recycled C&D material on the geogrid and geotextile pullout behaviour, respectively. This effect was evaluated for recycled C&D material compacted to 80% of the maximum dry density (see Table 3). The mean values of the pullout resistance, PR, and corresponding frontal displacement, dPR, for different test conditions are summarized in Table 7 and Table 8.
From the analysis of Figure 11, the first emerging conclusion is that compacting the recycled material above the OMC has a very significant influence on geogrid pullout resistance, not only regarding PR, but also in terms of the behaviour of the geogrid throughout the test. Regardless of the vertical confining pressure, no ruptures of the welded junctions of the transversal bars occurred when the recycled material was compacted above OMC.
The decrease in the compaction moisture content from the optimum (OMC) to OMC−3% led to a small decrease in the geogrid pullout resistance: 7% and 5% on average for σv of 10 kPa and 25 kPa, respectively. One can conclude that this decrease in the moisture content did not significantly affect the pullout capacity of the geogrid.
As observed for the geogrid, compaction of the recycled C&D material above the OMC reduced the geotextile pullout resistance (Figure 12). However, the differences in the pullout behaviour are not so pronounced.
Unlike what was found for the geogrid, the compaction of the recycled C&D material below OMC (OMC−3%) led to an increase in geotextile pullout resistance. This increase was only 7% (on average) for σv = 10 kPa, but was about 22% for σv = 25 kPa (Table 8). For the geotextile, it can be concluded that as the moisture content of the recycled C&D material increased, the geotextile pullout resistance decreased. This conclusion is aligned with the findings of Ferreira et al. [28] for pullout tests performed on a granite residual soil, as these authors concluded that when the soil was compacted at the optimum moisture content, the peak pullout resistance of the geotextiles decreased in comparison with that obtained for the dry soil.
The reduction of the shear strength of soil–geosynthetic interfaces with increasing soil moisture content has also been observed by other authors in direct shear tests [48,50,51]. This behaviour has been associated with the occurrence of positive pore-water pressures and the loss of soil matric suction [48,50,51].
The effect of decreasing the moisture content below the OMC (dry side of the compaction curve) was different for the geogrid and the geotextile: it caused a decrease in geogrid pullout resistance and an increase in the pullout capacity of the geotextile. The increase in the geosynthetic interface’s direct shear strength when the backfill material is compacted below the OMC has been reported by other authors [48,52]; a similar trend would therefore be expected for the pullout resistance. While for the geotextile this trend was observed, the pullout resistance of the geogrid slightly decreased for compaction at OMC−3%. Since the shear strength of the recycled C&D material is higher when it is compacted on the dry side of OMC (see Table 5), the decrease in the pullout resistance of the geogrid may have been caused by a less efficient compaction of the layer immediately above the geogrid, as it is a very hard material.

3.4. Influence of Compaction Degree of the Recycled C&D Material

The effect of the compaction degree of the recycled backfill on the pullout behaviour of both geosynthetics is presented in Figure 13 and Figure 14 for the geogrid and the geotextile, respectively. The results plotted in these figures refer to compaction at OMC (Tests T1, T2, T9 and T10—GGR; Tests T11, T12, T19 and T20—GCR).
Figure 13 shows that the compaction degree of the recycled C&D material has a slight influence on the pullout resistance of the geogrid. While for the confining pressure of 25 kPa (Figure 13b), increasing the degree of compaction lead to a slight increase in the geogrid pullout resistance, for σ = 10 kPa (Figure 13a) a slight decrease of the pullout strength was recorded. This unexpected behaviour can only be explained by the variability of the backfill material or by the difficulty in achieving a high degree of compaction in the layer immediately above the geogrid, as it is a hard material (Figure 3a). It might have been the case that the material was finer (lower grain size) in the tests carried out for 90% MDD and that this resulted in a lower pullout resistance. No other explanations could be found.
Figure 14 clearly shows that the maximum dry density of the backfill material affects the pullout behaviour of the geotextile. The increase in the compaction degree resulted in an increment of the geotextile pullout resistance of about 23% and 17% (on average) for confining pressures of 10 kPa and 25 kPa, respectively. It is also worth pointing out that the increase in MDD led to higher frontal displacements being required to reach the peak pullout resistance.
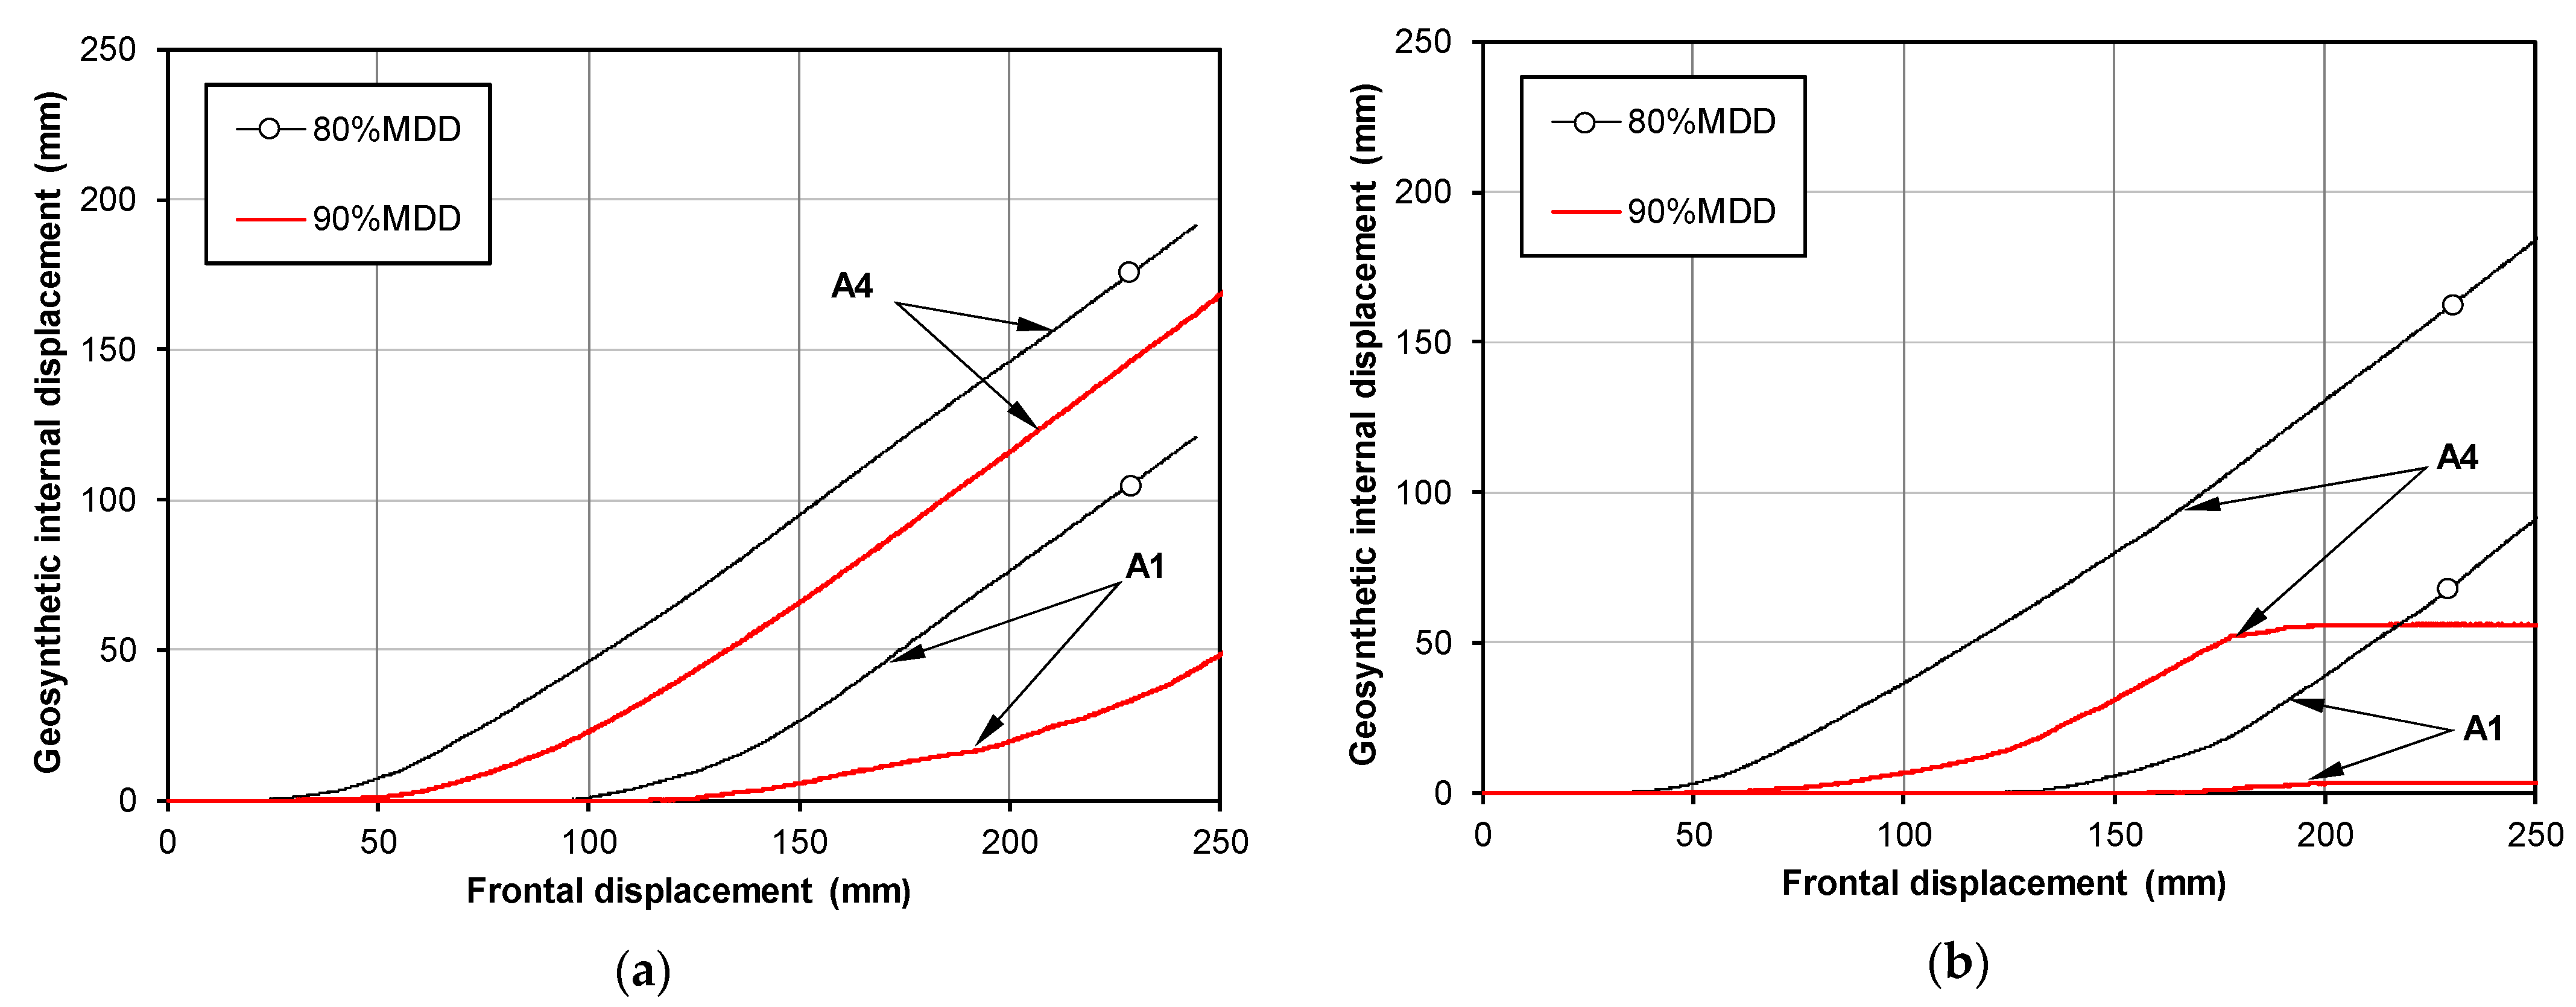
Increasing the compaction degree, in particular for a confining stress of 25 kPa (Figure 14b), resulted in tensile failure of the geotextile. Indeed, for this condition, as confirmed in Figure 15b, the geotextile failed due to insufficient tensile strength. It can be seen from the analysis of this graph that the internal displacements recorded at points A4 and A1 (refer to Figure 5a) remain constant from a front displacement of about 175 mm, meaning that the geotextile failed between the front and location A4.
The development of internal displacements throughout the length of the geotextile shows that, for the remaining compaction conditions, the geotextile pullout failure occurred (not for insufficient tensile strength), evidenced by the continuous evolution of internal displacements during the test (Figure 15).
Figure 15 also shows that increasing the degree of compaction of the backfill material, regardless of the confining pressure, provokes the decrease in the internal displacements, particularly at the geotextile back edge (point A1), which means that the geotextile is more tied to the backfill material. Higher frontal displacements are required to mobilize meaningful internal displacements at locations A4 to A1.

3.5. Summary of Results and Pullout Interaction Coefficients

Table 9 and Table 10 summarize the results of the test programme carried out on the geogrid and on the geotextile, respectively. The pullout resistance, PR, the corresponding frontal displacement, dPR, the maximum shear stress mobilized at the interface during the pullout test, τp, the direct shear strength of the backfill material, τds, and the pullout interaction coefficient, fb, for all the tests are presented in the above-mentioned tables. Since for each test condition three pullout tests were performed, the average value of fb is also presented.
It is worth remarking that the pullout interaction coefficients were calculated by Equation (1), and that the direct shear strength of the backfill material, τds, was estimated by the Mohr–Coulomb failure criterion considering the shear strength parameters presented in Table 5.
The average value of the pullout interaction coefficient, fb, ranged from 0.61 to 1.09 for the geogrid (Table 9) and from 0.67 to 1.25 for the geotextile (Table 10). Regardless of the geosynthetic type, the minimum value of fb was observed for the same test conditions (80% MDD with OMC+3% and σ = 50 kPa)—Tests T8 and T18. The maximum value of fb was achieved for different conditions in both geosynthetics: 90% MDD with OMC for the geotextile and 80% MDD with OMC for the geogrid.
The variation in the water content of the recycled C&D material around the OMC tended to decrease the value of fb (higher values obtained for OMC) for the geogrid. This tendency was also observed in the geotextile but with an exception (test T15-80%MDD with OMC−3%).
As mentioned in Section 3.5, the compaction degree of the recycled C&D material had a slight influence on the pullout resistance of the geogrid. While for the geotextile the increase in the compaction degree led to an increase in the value of fb, this was not the case for the geogrid.
The value of fb tended to decrease with increasing vertical confining pressure, with some exceptions particularly when the recycled C&D material was compacted at lower moisture (OMC−3%). This evidence, also reported by other authors [31,33,53,54], is due to the trend toward geosynthetic tensile failure when the confining stress increases.
Usually, under similar conditions of compaction and for geosynthetics with similar tensile strength, the geogrids tend to exhibit higher pullout interaction coefficients [28,32,53,55]. However, in the present study this occurred only when the recycled C&D material was compacted at its optimum moisture content and for 80% of the maximum dry density. For the remaining compaction conditions of the filling material, higher values of fb were obtained for the geotextile.
The behaviour of this particular geogrid may be due to the premature rupture of the welded junctions of the transversal bars reported earlier (Figure 8) or due to the difficulty in the compaction of the recycled C&D material of the layer immediately above the geogrid.
For all geogrid samples, and for different compaction conditions and vertical confining pressures, the value of fb ranged from 0.59 to 1.20. For the geotextile samples, fb varied within the range 0.58 to 1.30. These values are in the usual range for soil–geosynthetic interfaces, as well as for geosynthetic interfaces concerning alternative backfilling materials.
Values of fb ranging from 0.25 to 1.4 and from 0.30 to 1.7 are reported by Goodhue et al. [54] for different geosynthetics (geogrid, geomembrane and geotextile) when embedded in a uniformly-graded quartz sand and in foundry sands, respectively. Values of pullout interaction coefficients in the range 0.18–0.65 are presented by Hsieh et al. [55] for a high-strength polypropylene geotextile tested in a quartz sand and in a riverbed gravel, while for a uniaxial polyester geogrid fb ranged from 0.51 to 1.25.
Soleimanbeigi et al. [31] concluded that the interaction coefficients for a high-density polyethylene (HDPE) uniaxial geogrid and a woven geotextile embedded in a recycled concrete aggregate decrease with increasing confining pressure and are lower than 0.5. Values of fb ranging from 0.79 to 1.35 for pullout tests carried out on a polyester geogrid installed in a fine-grain recycled C&D material are reported by Vieira et al. [32].

4. Conclusions

An extensive laboratory study to characterize the pullout behaviour of two different geosynthetics (a polyester geogrid and a high-strength composite geotextile) embedded in a recycled C&D material, as well as the physical and mechanical characterization of the filling material, were presented in this paper. The influence of the geosynthetic type, moisture content and compaction degree of the recycled C&D material on the pullout behaviour was evaluated and discussed.
The main conclusions of this study are summarized as follows:
  • In spite of the high fine content of the recycled C&D material, its particle size distribution fulfils the requirements of NCMA for segmental retaining walls and those of FHWA for reinforced soil slopes. However, this recycled material does not meet the gradation limits for backfill materials of mechanically stabilized earth walls.
  • Increasing the moisture content of the recycled C&D material from OMC−3% to OMC+3% led to a decrease in the internal shear strength. As expected, the increase in the compaction dry density (from 80% to 90% of the maximum dry density) induced an increase in the backfill shear strength.
  • Although the two geosynthetics have similar tensile strengths, the pullout resistance of the geogrid was higher than that of the geotextile and was achieved at lower frontal displacements, as a result of the different characteristics of the geogrid, namely its apertures and the consequent passive thrust on the transversal bars and its higher tensile stiffness.
  • The compaction of the recycled material above the OMC had a very significant influence on the behaviour of the geogrid throughout the pullout test. When increasing the material moisture content from the OMC to OMC+3%, the geogrid pullout resistance decreased from 31% to 41% depending on the vertical confining stress. The influence of the increase in the moisture content on the geotextile pullout behaviour was less pronounced; even so, increases in the pullout resistance between 17% and 24% were observed.
  • The reduction in the compaction moisture content from the OMC to OMC−3% induced a slight decrease in the geogrid pullout resistance (ranging from 5% to 7%). Conversely, the pullout capacity of the geotextile increased 7% and 22% (for σv = 10 kPa and σv = 25 kPa, respectively) when the recycled C&D material was compacted at OMC−3%.
  • The expected trend concerning the effect of the degree of compaction on the geogrid pullout resistance was not observed. While for the confining pressure of 25 kPa the increase of the compaction degree induced a slight increase in the geogrid pullout resistance (around 3% on average), unexpectedly a decrease of around 10% was recorded for the geogrid pullout resistance at the lower confining pressure (10 kPa).
  • The influence of the compaction degree of the recycled C&D material on the geotextile pullout resistance was the one anticipated: a higher compaction degree resulted in an increase in the geotextile pullout resistance. Regardless of the value of the confining pressure, the geotextile pullout resistance increased around 20%.
  • The values of the pullout interaction coefficient, fb, tended to decrease with increasing vertical confining pressure and were within the usual range of this parameter for soil–geosynthetic interfaces.
  • The variation of the compaction moisture content of the recycled C&D material around the OMC induced a decrease in the value of fb (higher values obtained for OMC) in the geogrid interface. This tendency was also observed, in general, for the geotextile.
The study reported herein is part of a broader research project regarding the investigation of the long-term behaviour of recycled C&D wastes as backfill material for geosynthetic-reinforced structures. The results obtained to date show that these recycled materials can be seen as an environmentally friendly alternative to the natural resources commonly used.

Author Contributions

C.S.V.: Conceptualization; funding acquisition; methodology; project administration; supervision; data curation; formal analysis; writing—review & editing. P.M.P.: Methodology; data curation; writing—original draft preparation. All authors have read and agreed to the published version of the manuscript.

Funding

This work was financially supported by: Project PTDC/ECI-EGC/30452/2017-POCI-01-0145-FEDER-030452—funded by FEDER funds through COMPETE2020—Programa Operacional Competitividade e Internacionalização (POCI) and by national funds (PIDDAC) through FCT/MCTES; Base Funding—UIDB/04708/2020 of the CONSTRUCT—Instituto de I&D em Estruturas e Construções—funded by national funds through the FCT/MCTES (PIDDAC). The second author would also like to thank Fundação para a Ciência e Tecnologia (FCT) for his research grant: SFRH/BD/147838/2019.
Sustainability 14 01207 i001

Institutional Review Board Statement

Not applicable.

Informed Consent Statement

Not applicable.

Data Availability Statement

The data presented in this study are available on request from the corresponding author.

Acknowledgments

The authors would like to acknowledge the contribution of the company RCD for the supply of the recycled C&D materials and TenCate Iberia and Naue for providing geosynthetic samples.

Conflicts of Interest

The authors declare no conflict of interest. The supplier companies had no role in the design of the study; in the collection, analyses, or interpretation of the data; in the writing of the manuscript; or in the decision to publish the results.

References

  1. Wahlström, M.; Bergmans, J.; Teittinen, T.; Bachér, J.; Smeets, A.; Paduart, A. Construction and Demolition Waste: Challenges and Opportunities in a Circular Economy; Eionet Report—ETC/WMGE 2020/1; European Topic Centre Waste and Materials in a Green Economy: Boeretang, Belgium, 2020. [Google Scholar]
  2. European Commission. Competitiveness of the Construction Industry. A Report Drawn up by the Working Group for Sustainable Construction with Participants from the European Commission, Member States and Industry; European Commission: Brussels, Belgium, 2001. [Google Scholar]
  3. Behera, M.; Bhattacharyya, S.K.; Minocha, A.K.; Deoliya, R.; Maiti, S. Recycled Aggregate from C&D waste & Its Use in Concrete—A Breakthrough towards Sustainability in Construction Sector: A review. Constr. Build. Mater. 2014, 68, 501–516. [Google Scholar] [CrossRef]
  4. Poon, C.S. Reducing construction waste. Waste Manag. 2007, 27, 1715–1716. [Google Scholar] [CrossRef]
  5. Rao, A.; Jha, K.N.; Misra, S. Use of aggregates from recycled construction and demolition waste in concrete. Resour. Conserv. Recycl. 2007, 50, 71–81. [Google Scholar] [CrossRef]
  6. Silva, R.V.; de Brito, J.; Dhir, R.K. Properties and composition of recycled aggregates from construction and demolition waste suitable for concrete production. Constr. Build. Mater. 2014, 65, 201–217. [Google Scholar] [CrossRef]
  7. Santana Rangel, C.; Amario, M.; Pepe, M.; Martinelli, E.; Toledo Filho, R.D. Durability of Structural Recycled Aggregate Concrete Subjected to Freeze-Thaw Cycles. Sustainability 2020, 12, 6475. [Google Scholar] [CrossRef]
  8. Xiao, J.; Zou, S.; Ding, T.; Duan, Z.; Liu, Q. Fiber-reinforced mortar with 100% recycled fine aggregates: A cleaner perspective on 3D printing. J. Clean. Prod. 2021, 319. [Google Scholar] [CrossRef]
  9. Henzinger, C.; Heyer, D. Soil improvement using recycled aggregates from demolition waste. Proc. Inst. Civ. Eng.—Ground Improv. 2018, 171, 74–81. [Google Scholar] [CrossRef]
  10. Cristelo, N.; Fernández-Jiménez, A.; Vieira, C.; Miranda, T.; Palomo, Á. Stabilisation of construction and demolition waste with a high fines content using alkali activated fly ash. Constr. Build. Mater. 2018, 170, 26–39. [Google Scholar] [CrossRef]
  11. Kianimehr, M.; Shourijeh, P.T.; Binesh, S.M.; Mohammadinia, A.; Arulrajah, A. Utilization of recycled concrete aggregates for light-stabilization of clay soils. Constr. Build. Mater. 2019, 227, 116792. [Google Scholar] [CrossRef]
  12. Frías, M.; Martínez-Ramírez, S.; de la Villa, R.V.; Fernández-Carrasco, L.; García, R. Reactivity in cement pastes bearing fine fraction concrete and glass from construction and demolition waste: Microstructural analysis of viability. Cem. Concr. Res. 2021, 148. [Google Scholar] [CrossRef]
  13. Morón, A.; Ferrández, D.; Saiz, P.; Morón, C. Experimental study with cement mortars made with recycled concrete aggregate and reinforced with aramid fibers. Appl. Sci. 2021, 11, 7791. [Google Scholar] [CrossRef]
  14. Poon, C.S.; Chan, D. Feasible use of recycled concrete aggregates and crushed clay brick as unbound road sub-base. Constr. Build. Mater. 2006, 20, 578–585. [Google Scholar] [CrossRef]
  15. Jiménez, J.R.; Ayuso, J.; Galvín, A.P.; López, M.; Agrela, F. Use of mixed recycled aggregates with a low embodied energy from non-selected CDW in unpaved rural roads. Constr. Build. Mater. 2012, 34, 34–43. [Google Scholar] [CrossRef]
  16. Arulrajah, A.; Disfani, M.M.; Horpibulsuk, S.; Suksiripattanapong, C.; Prongmanee, N. Physical properties and shear strength responses of recycled construction and demolition materials in unbound pavement base/subbase applications. Constr. Build. Mater. 2014, 58, 245–257. [Google Scholar] [CrossRef]
  17. Teijón-López-Zuazo, E.; Vega-Zamanillo, Á.; Calzada-Pérez, M.Á.; Robles-Miguel, Á. Use of Recycled Aggregates Made from Construction and Demolition Waste in Sustainable Road Base Layers. Sustainability 2020, 12, 6663. [Google Scholar] [CrossRef]
  18. Rahman, M.A.; Imteaz, M.; Arulrajah, A.; Disfani, M.M. Suitability of recycled construction and demolition aggregates as alternative pipe backfilling materials. J. Clean. Prod. 2014, 66, 75–84. [Google Scholar] [CrossRef]
  19. Vieira, C.S.; Cristelo, N.; Lopes, M.L. Geotechnical and geoenvironmental characterization of recycled Construction and Demolition Wastes for use as backfilling of trenches. In The International Conference Wastes: Solutions, Treatments and Opportunities, 4th ed.; CRC Press Taylor & Francis Group: Porto, Portugal, 2017; pp. 175–181. [Google Scholar]
  20. Santos, E.C.G.; Palmeira, E.M.; Bathurst, R.J. Behaviour of a geogrid reinforced wall built with recycled construction and demolition waste backfill on a collapsible foundation. Geotext. Geomembr. 2013, 39, 9–19. [Google Scholar] [CrossRef]
  21. Arulrajah, A.; Rahman, M.; Piratheepan, J.; Bo, M.; Imteaz, M. Interface Shear Strength Testing of Geogrid-Reinforced Construction and Demolition Materials. ASTM Adv. Civ. Eng. Mater. 2013, 2, 189–200. [Google Scholar] [CrossRef]
  22. Vieira, C.S.; Pereira, P.M. Interface shear properties of geosynthetics and construction and demolition waste from large-scale direct shear tests. Geosynth. Int. 2016, 23, 62–70. [Google Scholar] [CrossRef]
  23. Srivastava, A.; Jaiswal, S.; Chauhan, V.B. Potential Use of Construction and Demolition Recycled Wastes in Geosynthetic-Reinforced Structures. In Lecture Notes in Civil Engineering; Springer: Singapore, 2022; pp. 199–206. [Google Scholar]
  24. Vieira, C.S.; Lopes, M.L.; Caldeira, L.M. Sand-geotextile interface characterisation through monotonic and cyclic direct shear tests. Geosynth. Int. 2013, 20, 26–38. [Google Scholar] [CrossRef]
  25. Alfaro, M.C.; Miura, N.; Bergado, D.T. Soil-geogrid reinforcement interaction by pullout and direct shear tests. Geotech. Test. J. 1995, 18, 157–167. [Google Scholar]
  26. Lopes, M.L.; Ladeira, M. Role of specimen geometry, soil height and sleeve length on the pull-out behaviour of geogrids. Geosynth. Int. 1996, 3, 701–719. [Google Scholar] [CrossRef]
  27. Lopes, M.L.; Ladeira, M. Influence of the confinement, soil density and displacement rate on soil-geogrid interaction. Geotext. Geomembr. 1996, 14, 543–554. [Google Scholar] [CrossRef]
  28. Ferreira, F.B.; Vieira, C.S.; Lopes, M.L. Pullout Behavior of Different Geosynthetics-Influence of Soil Density and Moisture Content. Front. Built Environ. 2020, 6. [Google Scholar] [CrossRef] [Green Version]
  29. Ferreira, F.B.; Vieira, C.S.; Lopes, M.L.; Ferreira, P.G. HDPE geogrid-residual soil interaction under monotonic and cyclic pullout loading. Geosynth. Int. 2020, 27, 79–96. [Google Scholar] [CrossRef]
  30. Moraci, N.; Cardile, G. Influence of cyclic tensile loading on pullout resistance of geogrids embedded in a compacted granular soil. Geotext. Geomembr. 2009, 26, 475–487. [Google Scholar] [CrossRef]
  31. Soleimanbeigi, A.; Tanyu, B.F.; Aydilek, A.H.; Florio, P.; Abbaspour, A.; Dayioglu, A.Y.; Likos, W.J. Evaluation of recycled concrete aggregate backfill for geosynthetic-reinforced MSE walls. Geosynth. Int. 2019, 26, 396–412. [Google Scholar] [CrossRef]
  32. Vieira, C.S.; Pereira, P.M.; Lopes, M.L. Recycled Construction and Demolition Wastes as filling material for geosynthetic reinforced structures. Interface properties. J. Clean. Prod. 2016, 124, 299–311. [Google Scholar] [CrossRef]
  33. Vieira, C.S.; Pereira, P.; Ferreira, F.B.; Lopes, M.L. Pullout Behaviour of Geogrids Embedded in a Recycled Construction and Demolition Material. Effects of Specimen Size and Displacement Rate. Sustainability 2020, 12, 3825. [Google Scholar] [CrossRef]
  34. Vieira, C.S.; Ferreira, F.B.; Pereira, P.M.; Lopes, M.L. Pullout behaviour of geosynthetics in a recycled construction and demolition material—Effects of cyclic loading. Transp. Geotech. 2020, 23, 100346. [Google Scholar] [CrossRef]
  35. Gao, Y.; Hang, L.; He, J.; Zhang, F.; Van Paassen, L. Pullout behavior of geosynthetic reinforcement in biocemented soils. Geotext. Geomembr. 2021, 49, 646–656. [Google Scholar] [CrossRef]
  36. Pierozan, R.C.; Araujo, G.L.S.; Palmeira, E.M.; Romanel, C.; Zornberg, J.G. Interface pullout resistance of polymeric strips embedded in marginal tropical soils. Geotext. Geomembr. 2022, 50, 20–39. [Google Scholar] [CrossRef]
  37. Karnamprabhakara, B.K.; Balunaini, U. Modified axial pullout resistance factors of geogrids embedded in pond ash. Geotext. Geomembr. 2021, 49, 1245–1255. [Google Scholar] [CrossRef]
  38. Chang, J.C.; Hannon, J.B.; Forsyth, R.A. Pullout resistance and interaction of earthwork reinforcement and soil. Transp. Res. Rec. 1977, 640, 1–7. [Google Scholar]
  39. Palmeira, E.M.; Milligan, G.W.E. Scale and other factores affecting the results of pull out tests of grid buried in sand. Géotechnique 1989, 39, 511–524. [Google Scholar] [CrossRef]
  40. Ochiai, H.; Hayashi, S.; Otani, J.; Hirai, T. Evaluation of pull-out resistance of geogrid reinforced soils. Proc. Int. Symp. Earth Reinf. Pract. 1992, 146, 141–146. [Google Scholar]
  41. Fannin, R.J.; Raju, D.M. Large-scale pull out test results on geosynthetics. In Proceedings of Geosynthetics 93 Conference, Vancouver, BC, Canada, 30 March–1 April 1993; pp. 633–643. [Google Scholar]
  42. Moraci, N.; Recalcati, P. Factors affecting the pullout behaviour of extruded geogrids embedded in a compacted granular soil. Geotext. Geomembr. 2006, 24, 220–242. [Google Scholar] [CrossRef]
  43. Ezzein, F.M.; Bathurst, R.J. A new approach to evaluate soil-geosynthetic interaction using a novel pullout test apparatus and transparent granular soil. Geotext. Geomembr. 2014, 42, 246–255. [Google Scholar] [CrossRef]
  44. Moraci, N.; Cardile, G.; Domenio, G.; Mandaglio, M.C.; Calvarano, L.S.; Carbone, L. Soil Geosynthetic Interaction: Design Parameters from Experimental and Theoretical Analysis. Transp. Infrastruct. Geotechnol. 2014, 1, 165–227. [Google Scholar] [CrossRef] [Green Version]
  45. EN 13738. Geotextiles and Geotextile-Related Products—Determination of Pullout Resistance in Soil; European Committee for Standardization: Brussels, Belgium, 2004. [Google Scholar]
  46. NCMA. Design Manual for Segmental Retaining Walls, 3rd ed.; National Concrete Masonry Association: Herndon, VA, USA, 2010; 206p. [Google Scholar]
  47. FHWA. Design and Construction of Mechanically Stabilized Earth Walls and Reinforced Soil Slopes; Berg, R.R., Christopher, B.R., Samtani, N.C., Eds.; FHWA-NHI-10-024: Washington, DC, USA, 2010. [Google Scholar]
  48. Ferreira, F.B.; Vieira, C.S.; Lopes, M.L. Direct shear behaviour of residual soil–geosynthetic interfaces—influence of soil moisture content, soil density and geosynthetic type. Geosynth. Int. 2015, 22, 257–272. [Google Scholar] [CrossRef]
  49. EN ISO 12957-1. Geosynthetics—Determination of the Friction Characteristics—Part 1: Direct Shear Test; CEN—TC 189; CEN: Brussels, Belgium, 2018. [Google Scholar]
  50. Khoury, C.N.; Miller, G.A.; Hatami, K. Unsaturated soil–geotextile interface behavior. Geotext. Geomembr. 2011, 29, 17–28. [Google Scholar] [CrossRef]
  51. Esmaili, D.; Hatami, K.; Miller, G.A. Influence of matric suction on geotextile reinforcement-marginal soil interface strength. Geotext. Geomembr. 2014, 42, 139–153. [Google Scholar] [CrossRef]
  52. Abu-Farsakh, M.; Coronel, J.; Tao, M. Effect of soil moisture content and dry density on cohesive soil–geosynthetic interactions using large direct shear tests. J. Mater. Civ. Eng. 2007, 19, 540–549. [Google Scholar] [CrossRef]
  53. Mohiuddin, A. Analysis of Laboratory and Field Pull-Out Tests of Geosynthetics in Clayey Soils. Master’s Thesis, Faculty of the Louisiana State University and Agricultural and Mechanical College, Baton Rouge, LA, USA, 2003. [Google Scholar]
  54. Goodhue, M.J.; Edil, T.B.; Benson, C.H. Interaction of foundry sands with geosynthetics. J. Geotech. Geoenviron. Eng. 2001, 127, 353–362. [Google Scholar] [CrossRef]
  55. Hsieh, C.; Chen, G.H.; Wu, J.-H. The shear behavior obtained from the direct shear and pullout tests for different poor grades soil-geosynthetic systems. J. GeoEng. 2011, 6, 15–26. [Google Scholar]
Figure 1. Schematic representation of the most suitable laboratory tests for characterization of fill–geosynthetic interfaces (adapted from [24]).
Sustainability 14 01207 g001
Figure 2. Visual appearance of the recycled C&D material used in this study.
Sustainability 14 01207 g002
Figure 3. Geosynthetics: (a) GGR—uniaxial PET geogrid; (b) GCR—high-strength geotextile.
Sustainability 14 01207 g003
Figure 4. Schematic illustration of the pullout test apparatus: (a) longitudinal section; (b) top view at geosynthetic level.
Sustainability 14 01207 g004
Figure 5. Geotextile (GCR) specimens: (a) dimensions of the specimens (in metres) and location of the measurement points; (b) photograph of the specimen inside the pullout box.
Sustainability 14 01207 g005
Figure 6. Particle size distribution of the recycled C&D material and gradation limits recommended by NCMA [46] and FHWA [47].
Sustainability 14 01207 g006
Figure 7. Comparison of the pullout behaviour of the geosynthetics and variability among the three specimens (σ = 10 kPa): (a) Test T1-GGR; (b) Test T11-GCR.
Sustainability 14 01207 g007
Figure 8. Detail of the transversal element rupture of the geogrid (at the end of pullout test).
Sustainability 14 01207 g008
Figure 9. Comparison of the pullout behaviour of the geosynthetics: (a) σ = 25 kPa (Tests T2 and T12); (b) σ = 50 kPa (Tests T3 and T13).
Sustainability 14 01207 g009
Figure 10. Internal displacements recorded along the geotextile’s length (a) σ = 25 kPa—Test T12; (b) σ = 50 kPa—Test T13.
Sustainability 14 01207 g010
Figure 11. Influence of the moisture content on geogrid (GGR) pullout behaviour: (a) σv = 10 kPa; (b) σv = 25 kPa.
Sustainability 14 01207 g011
Figure 12. Influence of the moisture content on geotextile (GCR) pullout behaviour: (a) σv = 10 kPa; (b) σv = 25 kPa.
Sustainability 14 01207 g012
Figure 13. Influence of the compaction degree on geogrid (GGR) pullout behaviour: (a) σ = 10 kPa; (b) σ = 25 kPa.
Sustainability 14 01207 g013
Figure 14. Influence of the compaction degree on geotextile (GCR) pullout behaviour: (a) σ = 10 kPa; (b) σ = 25 kPa.
Sustainability 14 01207 g014
Figure 15. Influence of the compaction degree on the internal geotextile displacements during pullout (points A4 and A1 refer to Figure 5): (a) σ = 10 kPa; (b) σ = 25 kPa.
Sustainability 14 01207 g015
Table 1. Summary of some relevant laboratory studies on pullout behaviour of geosynthetics.
ReferenceDimensions Pullout Box—L × W × H (mm)Geosynthetic TypeFilling MaterialAssessed Parameters
Alfaro et al. [25]1600 × 600 × 500GeogridDense granular soilNew test apparatus
Soil dilatancy
Lopes and Ladeira [26,27]1530 × 1000 × 800GeogridGranular soilSpecimen geometry
Soil height
Sleeve length
Confinement pressure
Soil density
Displacement rate
Ferreira et al. [28]1530 × 1000 × 800Geogrid
Geocomposite
Geotextile
Granite residual soilSoil density
Soil moisture content
Geosynthetic type
Ferreira et al. [29]1530 × 1000 × 800GeogridGranite residual soilCyclic pullout loading
Cyclic load frequency
Cyclic load amplitude
Number of cycles
Soil density
Moraci and Cardile [30]1700 × 600 × 680GeogridGranular soilCyclic pullout loading
Cyclic load amplitude
Cyclic load frequency
Vertical confining stress
Geogrid properties
Soleimanbeigi et al. [31]1270 × 760 × 510Geogrid
Geotextile
Recycled concrete aggregateVertical confining stress
Geosynthetic type
Vieira et al. [32,33]1530 × 1000 × 800Geogrid
Geocomposite (high-strength geotextile)
Fine-grain recycled C&D materialGeosynthetic type
Geogrid specimen size
Displacement rate
Vertical confining pressure
Vieira et al. [34]1530 × 1000 × 800Geogrid
Geocomposite (high-strength geotextile)
Fine-grain recycled C&D materialCyclic pullout loading
Pre-cyclic pullout load level
Cyclic load frequency
Cyclic load amplitude
Geosynthetic type
Table 2. Main properties of the geosynthetics.
GGRGCR
Raw materialPETPP & PET
Aperture dimensions (mm)30 × 73-
Mass per unit area (g/m2)380340
Mean value of the tensile strength (kN/m)8075
Elongation at maximum load (%)≤810
Secant stiffness at 2% strain (kN/m)1920650
Table 3. Pullout test programme.
Test NumberGeosynthetic MaterialMoisture Content (%)% Maximum Dry DensityConfining Pressure (kPa)Number of Specimens
T1 103
T2GGR9 *80253
T3 503
T4GGR680103
T5253
T6 103
T7GGR1280253
T8 503
T9GGR9 *90103
T10253
T11 103
T12GCR9 *80253
T13 503
T14GCR680103
T15253
T16 103
T17GCR1280253
T18 503
T19GCR9 *90103
T20253
* Optimum moisture content (OMC) = 9%.
Table 4. Main physical and mechanical properties of the recycled C&D material.
PropertiesValues
D10 [mm]0.01
D30 [mm]0.27
D50 [mm]0.61
D60 [mm]0.97
Cu97
Cc7.5
Fines fraction (No. 200 sieve) [%]16.9
Minimum void ratio, emin0.434
Maximum void ratio, emax0.877
Particle density, Gs2.58
Maximum dry unit weight, γd,max [kN/m3]20.1
Optimum moisture content, OMC [%]9.0
Table 5. Internal shear strength parameters of the recycled C&D material.
80% MDD 90% MDD
ParameterOMC−3%OMCOMC+3%OMC
Cohesion, c [kPa]21.116.312.418.0
Peak friction angle, φ [°]40.537.637.540.3
Table 6. Comparison of pullout test results for both geosynthetics (80% of MDD and OMC).
GGRGCR
Confining Pressure (kPa)PR (kN/m)dPR (mm)PR (kN/m)dPR (mm)
1036.453.431.8123.9
2553.060.643.4154.7
5061.458.750.7171.0
Table 7. Summary of the results of pullout tests carried out on GGR at different moisture contents.
GGROMC−3%OMCOMC+3%
C. Pressure (kPa)PR (kN/m)dPR (mm)PR(kN/m)dPR (mm)PR (kN/m)dPR (mm)
1033.857.736.453.423.668.5
2550.459.553.060.631.067
50--61.458.742.361.6
Table 8. Summary of the results of pullout tests carried out on GCR at different moisture contents.
GCROMC−3%OMCOMC+3%
C. Pressure (kPa)PR (kN/m)dPR (mm)PR (kN/m)dPR (mm)PR (kN/m)dPR (mm)
1034.1121.531.8123.924.377.8
2554.5168.343.4154.736.8118.9
50--50.7171.042.3130.9
Table 9. Pullout interaction coefficients and summary of results for the geogrid (GGR).
Test NumberC. Pressure (kPa)PR (kN/m)dPR (mm)τp (kPa)τds (kPa)fbfb (Average)
40.252.228.8 1.20
T11032.947.823.424.00.981.09
35.960.326.0 1.08
53.465.039.0 1.10
T22554.864.940.035.61.131.08
50.851.836.4 1.02
64.460.846.7 0.85
T35057.162.041.554.80.760.81
62.653.244.9 0.82
34.251.124.5 0.83
T41035.464.525.829.60.870.82
32.057.323.1 0.78
49.352.135.3 0.83
T52549.962.136.342.50.850.86
52.164.138.0 0.89
24.468.117.9 0.89
T61024.464.317.820.10.890.86
21.973.116.2 0.80
33.379.724.8 0.79
T72527.756.920.031.60.630.72
32.164.423.4 0.74
44.660.632.3 0.64
T85041.165.530.050.80.590.61
41.258.529.8 0.59
34.762.625.3 0.95
T91031.672.023.326.50.880.88
30.345.721.5 0.81
56.084.042.0 1.07
T102550.562.336.739.20.941.04
56.991.143.2 1.10
Table 10. Pullout interaction coefficients and summary of results for the geotextile (GCR).
Test NumberC. Pressure (kPa)PR (kN/m)dPR (mm)τp (kPa)τds (kPa)fbfb (Average)
30.4105.023.6 0.98
T111031.1123.724.824.01.031.06
33.8143.027.8 1.16
48.4148.240.2 1.13
T122542.8158.036.135.61.021.05
43.1142.635.4 1.00
52.4169.545.1 0.82
T135052.8172.545.754.80.830.80
46.9171.040.5 0.74
32.2102.524.8 0.84
T141035.9135.029.229.60.980.92
34.3127.027.5 0.93
53.7175.046.7 1.10
T152554.6163.446.542.51.101.10
55.0166.547.2 1.11
28.889.121.8 1.09
T161020.660.315.020.10.750.90
23.584.117.7 0.88
39.1124.231.3 0.99
T172536.1110.728.231.60.890.92
35.2121.928.0 0.89
46.9128.837.7 0.74
T185036.8120.829.250.80.580.67
43.2143.135.6 0.70
39.4177.334.4 1.30
T191040.5155.634.126.51.291.25
37.8139.431.0 1.17
50.5177.344.1 1.12
T202547.1153.239.539.21.011.12
55.1171.747.6 1.21
Publisher’s Note: MDPI stays neutral with regard to jurisdictional claims in published maps and institutional affiliations.