Article

Research on a Prediction Method for Passenger Waiting-Area Demand in High-Speed Railway Stations

1
Faculty of Urban Construction, Beijing University of Technology, Beijing 100124, China
2
Research Institute of Highway Ministry of Transport, Beijing 100088, China
3
Beijing Key Laboratory of Traffic Engineering, Beijing University of Technology, Beijing 100124, China
*
Author to whom correspondence should be addressed.
Sustainability 2022, 14(3), 1245; https://doi.org/10.3390/su14031245
Submission received: 22 November 2021 / Revised: 16 December 2021 / Accepted: 20 December 2021 / Published: 22 January 2022
(This article belongs to the Special Issue Sustainable Operation and Maintenance of Railway Systems)

Abstract

:
The rapid development of intelligent transportation systems and high-speed railways has shortened the waiting time of passengers and the demand for waiting areas. Large-scale stations not only increase the difficulty for passengers when traveling but also waste a great deal of land resources and construction funds. Therefore, this research analyzes passenger waiting area demand according to the characteristics of urban development, passenger travel characteristics and station departure passenger flow. This paper establishes a prediction model for the number of passengers spending time in the waiting room, taking into account passenger traffic and train departure timetables. We used Beijing South Railway Station, Xi’an North Railway Station, Hefei South Railway Station and Zhoukou East Railway Station as examples to predict the numbers of passengers spending time in waiting rooms of different types and scales of station. Research results show that shortening the length of passengers’ early arrival times can effectively reduce the number of passengers gathered in medium-sized stations, which are located in new first-tier cities. Under the influence of the urban traffic environment and passenger flow, the uncertainties regarding travel time and passenger flow in first-tier cities are lower than those in new first-tier cities and higher than those in third-tier and fourth-tier cities. Therefore, the waiting area demand of passengers departing from medium-sized stations in new first-tier cities is lower than that of passengers from large stations in first-tier cities, and higher than that of passengers from small stations in third-tier and fourth-tier cities.

1. Introduction

In recent years, China’s rapid development of high-speed railway construction has achieved world-renowned levels. By the end of 2020, the track length of high-speed railway networks reached 37,900 km [1], which ranks the country first in the world. In the future, the total scale of China’s railway network is predicted to reach 200,000 km by 2035 [2]. The development of high-speed railways is inevitably accompanied by the construction of a large number of high-speed passenger stations. After the latest adjustment and planning of the railway network by the Chinese government in 2008, the construction of railway passenger stations has achieved much. Many major cities now offer beautifully shaped and functionally comprehensive stations. For example, about 300 new stations in south Beijing, Tianjin and south Guangzhou have been put into service, and about 240 new stations in north Guiyang and south Hangzhou are under construction [3]. This means that the number of high-speed railway stations in many cities has increased from none to many, or from one to multiple stations.
When observing the construction scales of completed and new stations in China, it can be seen that the main problems in the construction of station buildings are reflected in the different standards regarding the scale of stations [4]. The design homogeneity of several high-speed railway passenger stations is profound. During the planning and construction of the first batch of high-speed railway hubs in China, under the influence of institutional investment, cognition and other aspects, the construction of high-speed railway stations in many cities is on a grand scale. For example, the floor area of Xi’an North Station and the site area of Shanghai Hongqiao Station rank as the largest in China. The building area of Nanjing North Railway Station is known as the largest in Asia. The waiting room area of Beijing South Station is about seven football fields in size [5]. Throughout railway stations around the world, most of the buildings for railway stations are in the form of commercial complexes, integrating bus, business, and entertainment services. Passengers merely use the entry hall or the public service spaces inside the station to wait for trains. For example, Japan’s Tokyo Station covers an area of 182,000 square meters [6], which is one-third of the area of Beijing South Station. However, there are 4000 trains in and out of the station every day, and the average daily passenger flow reaches 271,000 people [7]. There is no large waiting area in Tokyo Station; only a small waiting room with a capacity of about 30 people is provided in the passenger area for the Shinkansen train [8]. In addition, the construction area of Turin’s Porta Susa TGV station in Italy is 30,000 square meters [9], and presents a major hub of urban, regional and international railway traffic in Turin. In New York, the Central Railway Station covers an area of about 200,000 square meters, which is half the area of Nanjing South Station [10]. Conversely, in Arequipa, the railway station undertakes the function of passenger transport, and staff pay attention to improve the passengers’ travel satisfaction on the train; the area of the station waiting room is small and only has six tables [11].
In planning and design, the entire station serves as a waiting space, transfer space and commercial space. Therefore, comparing the huge differences in the scale of construction and waiting-room design features of foreign stations, people may question the massive construction scale of domestic high-speed railway passenger stations in China. While foreign experience is not transferable to the Chinese railway situation, the scale of domestic stations should be carefully considered with regard to the characteristics of urban development and passenger travel in China.
China has become one of the countries with the most rapid railway development in the world [4]. The high-speed railway station network has now spread to large, medium, and small-sized cities in China. By shortening the distance between cities, this also brings great convenience to people in terms of travel and changes their lifestyles, travel patterns and consumption concepts. These are mainly reflected in the following three areas.
(1)
Passengers’ carry-on luggage is gradually reduced and miniaturized. The travel process is more convenient and shortens the total travel time within the city, as well as the time spent in the station.
(2)
With the development of intelligent transportation systems, the reliability of the timetables for transportation has increased and shortened the waiting times of passengers. In particular, the waiting times in small and medium-sized cities are now shorter than those in first-tier cities. Therefore, with the decreasing necessity of waiting for trains, the waiting pattern in stations has changed from “waiting” to “waiting and passing through”.
(3)
By November 2020, the number of elderly tourists in China accounted for more than 20% of the total number of tourists in the country [12]. With the increasing demand for outbound travel among the elderly, a convenient and fast ride process and a quiet and comfortable station environment undoubtedly improve the travel satisfaction experienced by the elderly.
Not only may the large scale of stations extend the walking distances within the station but it also increases the difficulty encountered by passengers in getting on and off the train, and the difficulty for passengers entering and leaving the station. In addition, in large and medium-sized cities where every inch of land is valuable, large-scale stations will waste the available urban land and increase construction costs. When designing railway passenger stations, usually, the maximum number of passengers spending time in the waiting room is taken as an important reference index [13]. Therefore, with the changing of passenger travel patterns and waiting modes, scientific prediction of the number of passengers spending time in the waiting room, and analysis of changing patterns after the upcoming adjustment to the train operation network are important for guiding the scaled construction of station buildings. It is also important to promote the sustainable development of cities, and to reduce the wastage of land resources and construction funds, using traditional empirical means and static methods to resolve these challenges.

2. Literature Review

A high-speed railway station can be regarded as a typical queuing system model, and the process from entering the station to checking tickets mid-journey obeys the mixed structure of multiple service desks. All the activities of passengers in the station are completed through selective queuing at each service desk, waiting time and walking the different routes between the service stations, such as when purchasing and picking up tickets, checking your identity at the station, undergoing security checks, etc.
In view of the phenomenon of passenger queuing in railway stations, Janice P. Li. [14] used a simulation method to analyze the phenomenon of passenger queuing in railway stations, evaluate the station design, assess toll facilities and carry out policy formulation. Igor, Bychkov et al. [15] proposed an approach to transport hub modeling using multiphase queuing systems, using a batch Markovian arrival process (BMAP) to specify the incoming transport flow. Xu, X.Y. et al. [16] created a queuing network with an analytical model of a station to calculate subway station capacity (SSC), which is built with an M/G/C/C state-dependent queuing network and discrete-time Markov chain (DTMC). Then, they developed an SSC optimization model to optimize SSC with a satisfactory rate of waiting passengers. In terms of station space and capacity when occupied by passengers, Train et al. [17] considered the comfort and demands of passengers in order to determine the standard occupancy space for passengers during peak hours, applying their knowledge of queuing theory and mathematical statistics to establish an optimization model, which is based on the deterministic queuing theory. Station systems have a complex multi-level structure, and the incoming traffic flow often has a stochastic character.
In calculating the number of passengers spending time in waiting rooms, earlier scholars usually analyze statistics garnered via surveys at different periods.
Zhao [18] established a large-scale high-speed rail passenger station waiting room capacity calculation model and calculated the maximum number of passengers spending time in the waiting room and the departure volume of passengers leaving in peak-time. Chen [19] used an improved graphical algorithm to establish a general formula for the number of passengers gathered in railway passenger stations and took Zhengzhou Railway station as an example to conduct theoretical analysis and empirical research. From the perspective of definition and passenger flow organization. Zhang et al. [20] averaged the maximum number of passengers gathering in each peak period and improved the original calculation model of the maximum number of passengers spending time in the waiting room by using the correction coefficient, taking Lanzhou Station as an example for analysis. He et al. [21] used the simulation calculation method to study the calculation of the maximum number of aggregated passengers in existing stations.
Later, other scholars analyzed the aggregation habits of passengers and predicted the aggregation number based on statistical data. Guo et al. [22] obtained passenger arrival time data to carry out data fitting and predicted the passenger aggregation patterns of certain train operations. However, this research did not analyze the changing patterns of the number of passengers spending time in the waiting room from the perspective of the station as a whole. Lu et al. [23] based their research on the patterns of passenger gathering, using the K-Nearest Neighbor (KNN) regression algorithm and introduced a time-varying weight coefficient to predict the number of passengers gathered in station areas.
To sum up, previous studies generally used queuing theory and other theoretical knowledge, combined with mathematical models, to simulate the phenomenon of passenger arrivals at the station and optimize station service facilities to reduce the number of passengers queuing. In terms of the number of passengers spending time in the waiting room, it is usually calculated in terms of the number of passengers, based on the arrival time, and using to the actual statistical data to predict the number of passengers gathered. However, passenger arrival habits are affected by the urban traffic environment and passenger flow [24,25]. At different periods, the arrival patterns of passengers departing from different stations are variable. Therefore, traditional prediction methods cannot establish the number of passengers spending time in the waiting rooms of different types of stations, based on regular train operation. This research takes the number of passengers spending time in the waiting rooms of high-speed railway stations as the research object, establishing a prediction model, considering passenger arrival habits and train departure, to assess the number of passengers spending time in a station waiting room. Selecting Beijing South Railway Station to represent a first-tier city station, Xi’an North Railway Station for a new first-tier city station, and Hefei South Railway Station and Zhoukou East Railway Station as third-tier city stations, representing large, medium and small stations respectively, we assumed that the passenger arrival pattern obeys the log-normal distribution. Thus, we predicted the number of passengers spending time in the station waiting room, analyzing the differences in the changing pattern of the number of passengers spending time in the station waiting rooms of different types of stations.

3. Methods

3.1. Problem Description

During normal train operations, passengers constantly arrive and depart from the waiting room. Therefore, the number of waiting passengers is in the process of constant change. The passenger transit process of high-speed railway stations and the changing numbers of passengers spending time in the waiting room are shown in Figure 1.
Figure 1 shows that passengers arrive at the station before the departure of the train, then passengers pass through the stages of status and security checks and progress to the station waiting room. Let the number of passengers arriving be Q i n . When the station announcements inform the departing passenger that they should check their tickets, the passenger leaves the station waiting room. Let the number of passengers leaving be Q o u t . Therefore, the number of passengers spending time in the station waiting room can be expressed as the difference between the number of passengers arriving in the waiting room and the number of passengers leaving it.

3.2. Model Setting

The number of arriving passengers is usually related to the passenger arrival time in the waiting room, and the number of leaving passengers is usually related to the departure time of the train. Therefore, it is necessary to analyze the pattern of passenger arrival and departure according to the passenger travel time process, and then calculate the number of passengers spending time in the station waiting room.
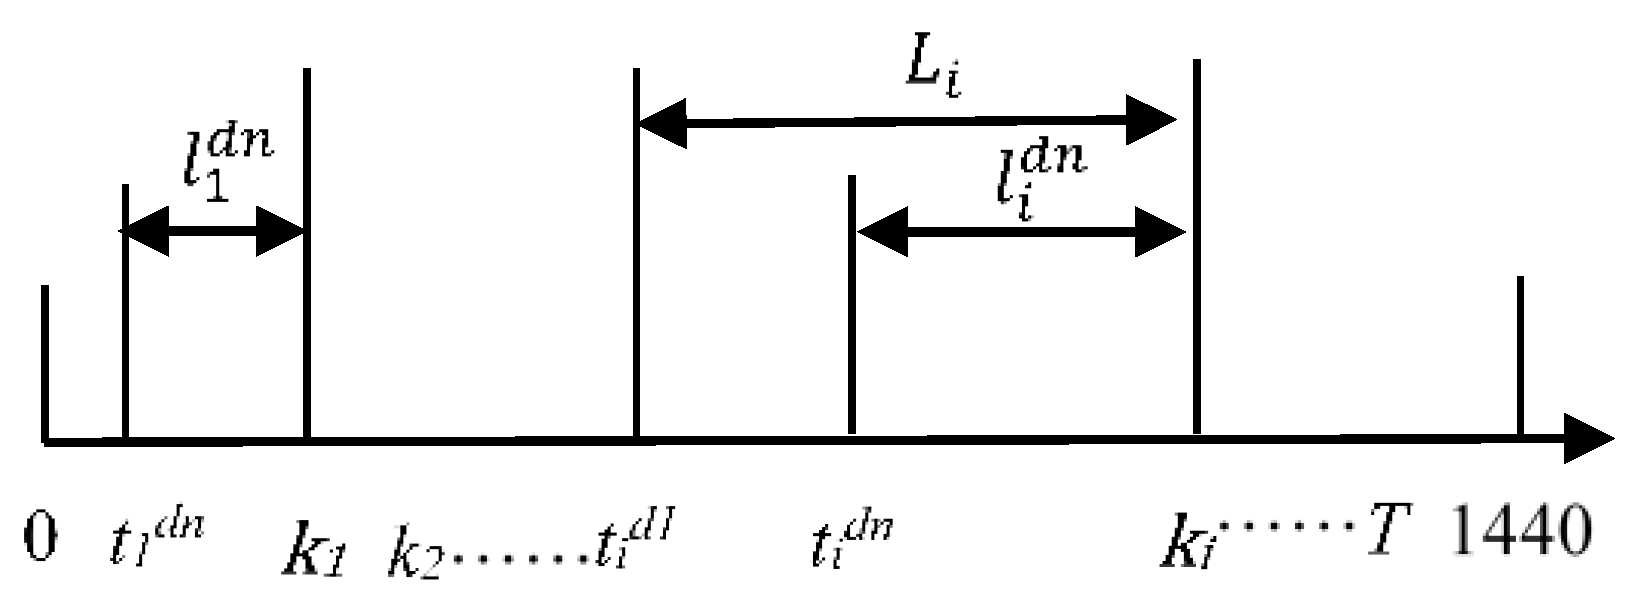
The passenger travel time process is shown in Figure 2.
From Figure 2, it can be seen that during a 24-h day, the train departure times specified in the train timetable will happen one after another, within 0~T. Assuming that all passengers arrive at the station waiting room before the train leaves, set k 1 indicates the departure time of the first train at the station. Before the first train leaves in the morning, passengers arrive at the station at time t 1 d n , when the passengers begin to gather in the waiting room. At this time, the waiting room enters the stage of gathering passengers, and the length of the advanced arrival time is l 1 d n . The first passenger on the departing train is at time k i. Those passengers that then arrive are at time t 1 d 1 , and the length of time until the departure time of the train is L i . The rest of the passengers of the train arrived at time t i d n , and the length of advanced arrival time is l i d n . This pattern continues until the last train from the station leaves at time T, the passenger gathering phase ends, and the number of passengers waiting in the waiting room is zero.
Based on the above analysis, it is assumed that passengers who take the train depart at time k and arrive at the station at time t before the departure of the train, and the length of time for passengers to arrive in advance is l , as shown in Equation (1):
l = k t
Therefore, the number of passengers spending time in the waiting room at time t in a 24-h day can be expressed as the difference between the cumulative number of passengers arriving in the station waiting room at time t and the cumulative number of passengers leaving the waiting room at time t . Q ( t ) is shown in Equation (2), where t ϵ [ 0 , 1440 ] (unit: min):
Q ( t ) = Q i n ( t ) Q o u t ( t )

3.3. Model Development

3.3.1. Number of Passengers Leaving

Let the number of passengers leaving the waiting room at time k be F ( k ) . Therefore, the number of passengers leaving the waiting room at time t can be expressed as the integral function of F ( k ) , which is shown in Equation (3):
Q o u t ( t ) = 0 t F ( k ) d k
The number of passengers leaving the waiting room is related to the number of trains and departing passengers at that time, let the number of trains departure at time k be f ( k ) . Therefore, the number of passengers leaving the waiting room at time k is shown in Equation (4):
F ( k ) = A j θ 1 f j ( k )
where A j is the number of train fixed passengers. Large and medium-sized high-speed railway passenger stations have about 600~800 passengers for departing trains, 300~400 passengers for passing trains, and 100 passengers for small stations; j is the type of station; θ 1 is the train’s full load rate, according to the literature, at θ 1 = 0.85 [20,21];
Taking Equation (4) into Equation (3) yields the cumulative number of passengers leaving the waiting room at time t, as shown in Equation (5):
Q o u t ( t ) = A j θ 1 0 t f j ( k ) d k

3.3.2. Number of Passengers Arriving

The passengers in the station waiting room include passengers departing as well as members of staff. The statistical distribution of passenger arrival habits affects the number of arrivals in the passenger station. Let the arrival rate of passengers at time t be P ( t ) , so the cumulative number of passenger arrivals in the station waiting room at time t is Q i n ( t ) , which can be expressed as an integral function of arrival rate P ( t ) from time 0 to time t , as shown in Equation (6):
Q i n ( t ) = 0 t P ( t ) d t
Among these variables, the passenger arrival rate is mainly related to the passenger arrival habits of the passenger station and the number of train departures. The passenger arrival habits in the railway station can be regarded as the probability density distribution function of the passenger arrival time in advance. Let the distribution function be ρ ( l ) , indicating the number of passengers arriving at the waiting room in advance of the l length of time as a proportion of the total number of passengers departing from the train.
Based on the above analysis and combined with Equation (1), the arrival rate of departing passengers at time t can be obtained as shown in Equation (7):
P ( t ) = A j θ 1 ( 1 + θ 2 ) t + a t + L ρ ( k t ) f j ( k ) dk
where θ 2 is the proportion of the number of passengers on the train, and large and medium-sized stations are θ 2 = 0.1, and small stations, θ 2 = 0 [20,26]. a is the length of time that the train stops for checking-in before departure. Domestic stations usually take 5 min. L is the length of time that the first passenger of a train departing at time k arrives at the waiting room before the train departure.
From Equations (6) and (7), the cumulative number of passenger arrivals in the waiting room at time k is shown in Equation (8):
Q i n ( t ) = A j θ 1 ( 1 + θ 2 ) 0 t ( t + a t + L ρ ( k t ) f j ( k ) d k ) d t
A simplified Equation (8) yields the cumulative number of passenger arrivals in the waiting room at time t, as shown in Equation (9):
Q i n ( t ) = A j θ 1 ( 1 + θ 2 ) 0 t ( a L ρ ( l ) f j ( t + l ) d l ) d t
From Equations (5) and (9), the number of passengers spending time in the waiting room at time t is shown in Equation (10).
Q ( t ) = A j θ 1 ( 1 + θ 2 ) 0 t ( a L ρ ( l ) f j ( t + l ) d l ) d t A j θ 1 0 t f j ( t ) d t

3.4. Model Validation

Combined with the relevant statistical data of Changsha South Railway Station as a reference [27], we used the model to calculate the variables, then compared the calculation results with statistical data to verify the calculation accuracy of the model.
It can be seen from Reference [27] that the early arrival time of passengers from Changsha South Railway Station obeys a log-normal distribution. The distribution function is shown in Equation (11):
ρ ( l ) = { 1 σ l 2 π e ( ln l μ ) 2 2 σ 2 , 0 < l L 0   , l = 0 μ = 3.6596 σ = 0.679932
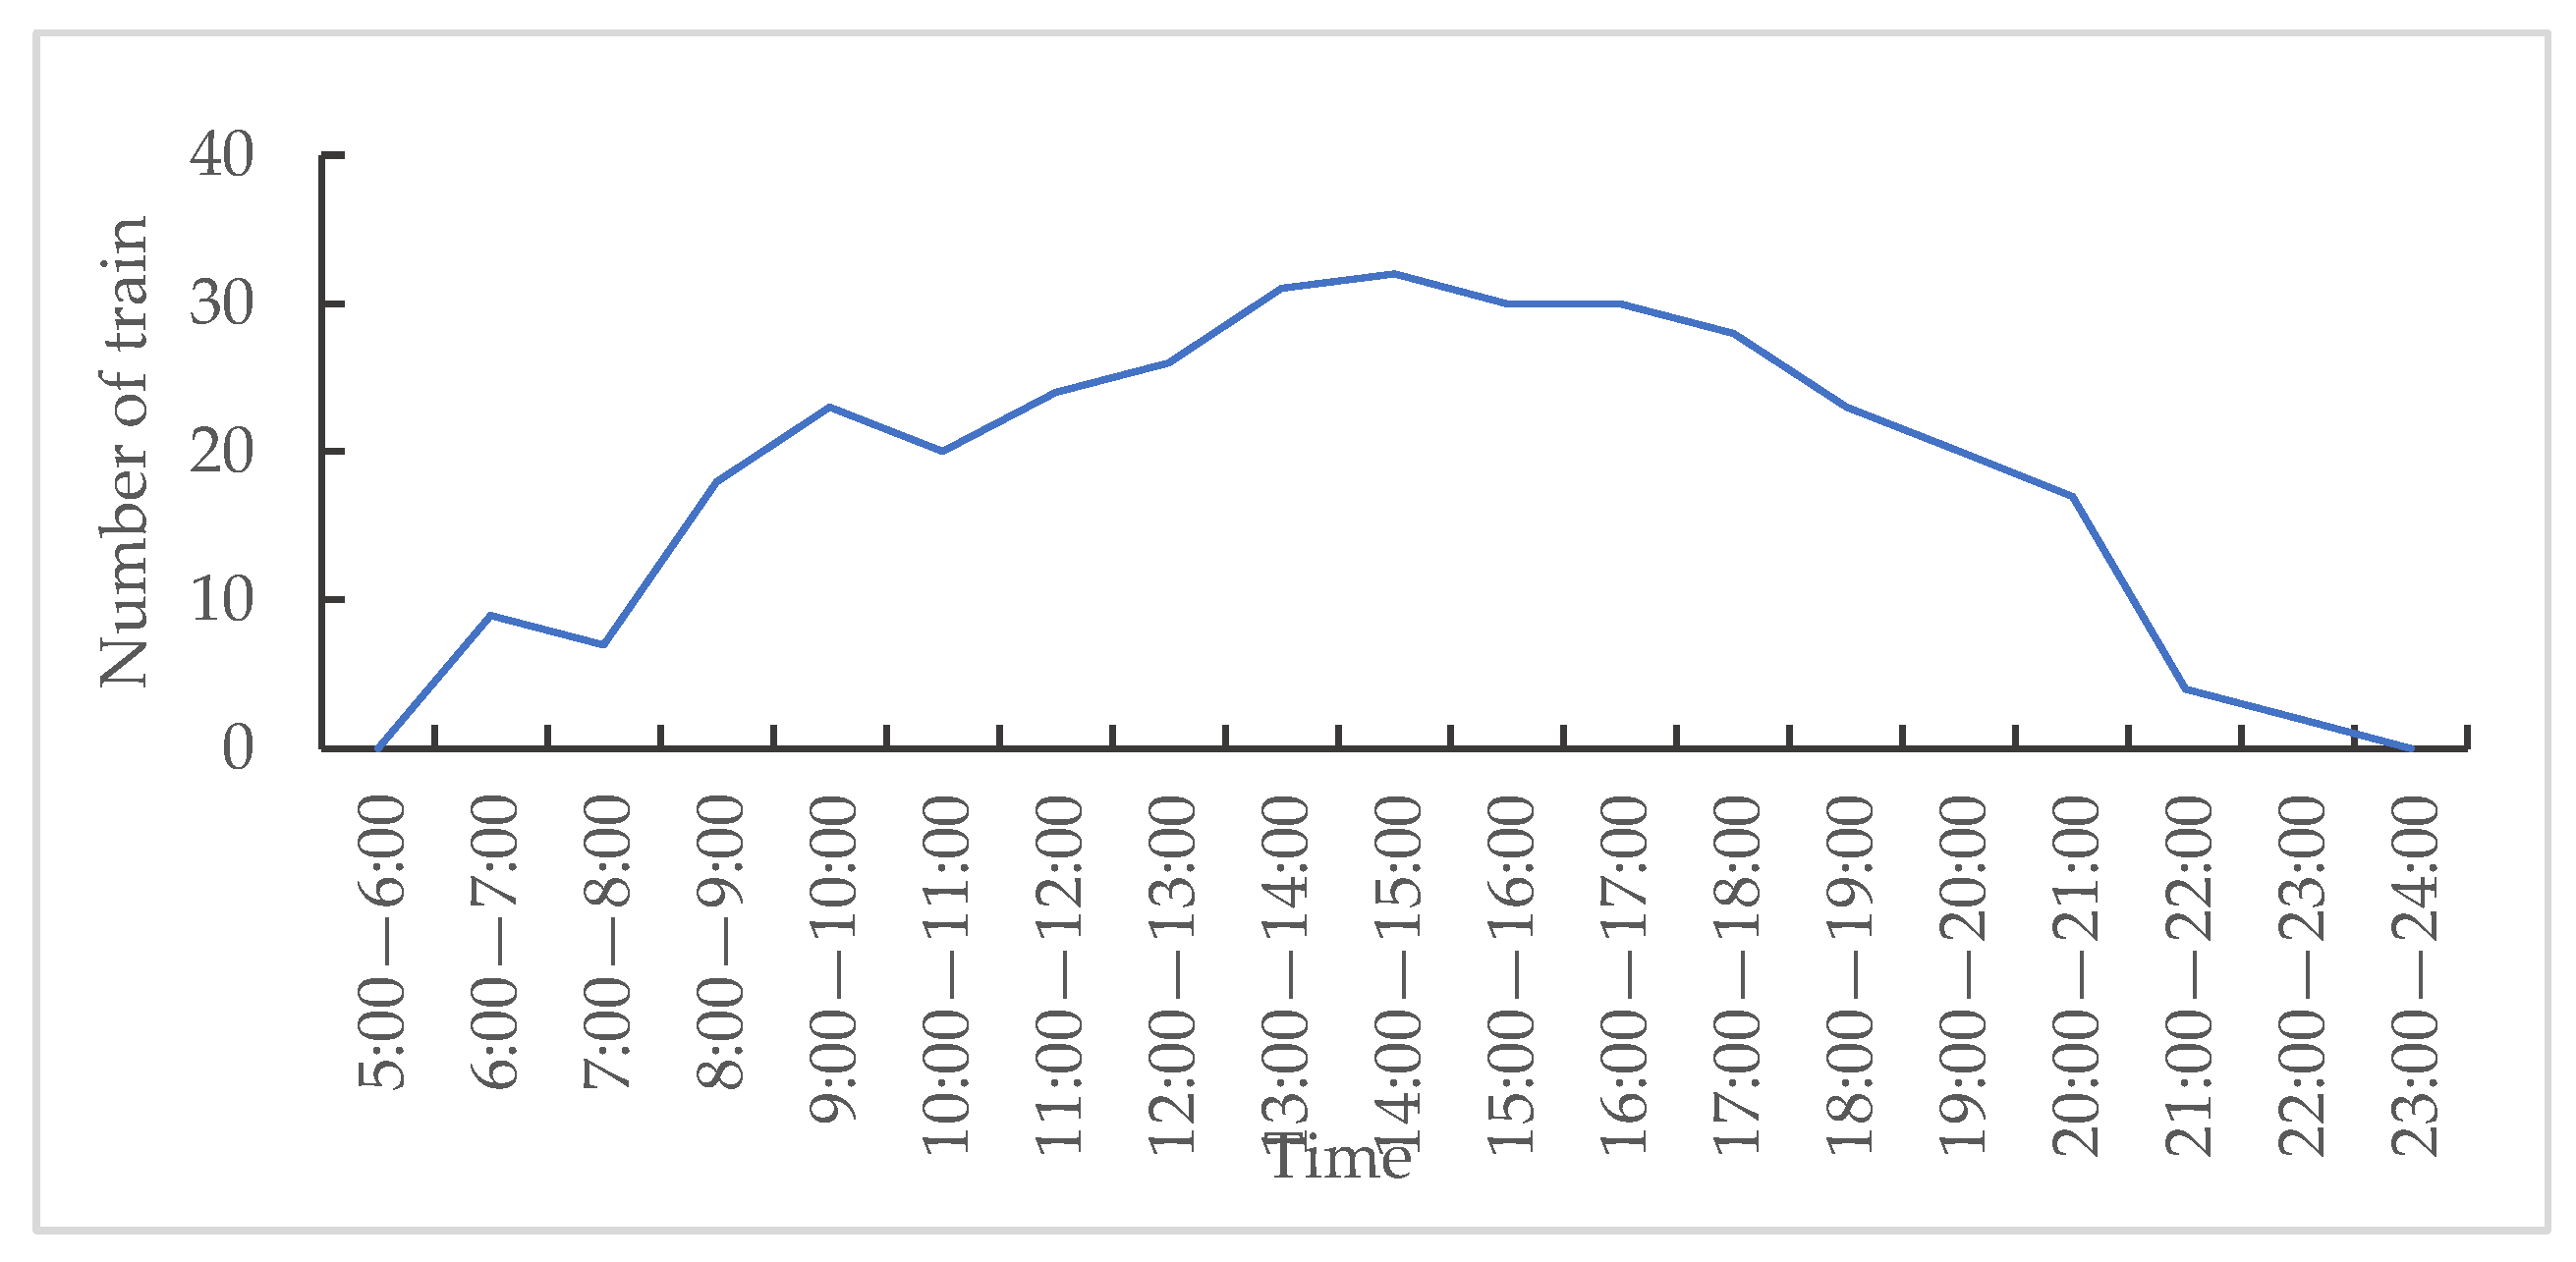
During weekdays, the number of trains departing from Changsha South Railway Station is 344, including 272 transfer trains and 72 initial trains. The number of assumed passengers on the stopping train is 375, the number of assumed passengers on the starting train is 800, and the train full load rate is 0.95. There are no station personnel included. The departure times and the number of trains departing from the station are shown in Figure 3.
The departure times of the trains from the station is not continuous. To facilitate this calculation, we assume that the departure times of trains over a particular day are a continuous function, and the train departure varies continuously with respect to the train departure time. When calculating the continuous function relationship between the train departure frequency f ( k ) and departure time k of each high-speed railway passenger station during weekdays, the regression analysis of train departure time and number in Figure 3 is carried out using the method of polynomial fitting. The continuous function relationship between the train departure frequency f ( k ) and departure time k is shown in Equation (12), where R 2 = 0.9416:
f ( t ) = 3.18 × 10 10 t 3 9.48 × 10 7 t 2 + 0.0025 t 0.7619
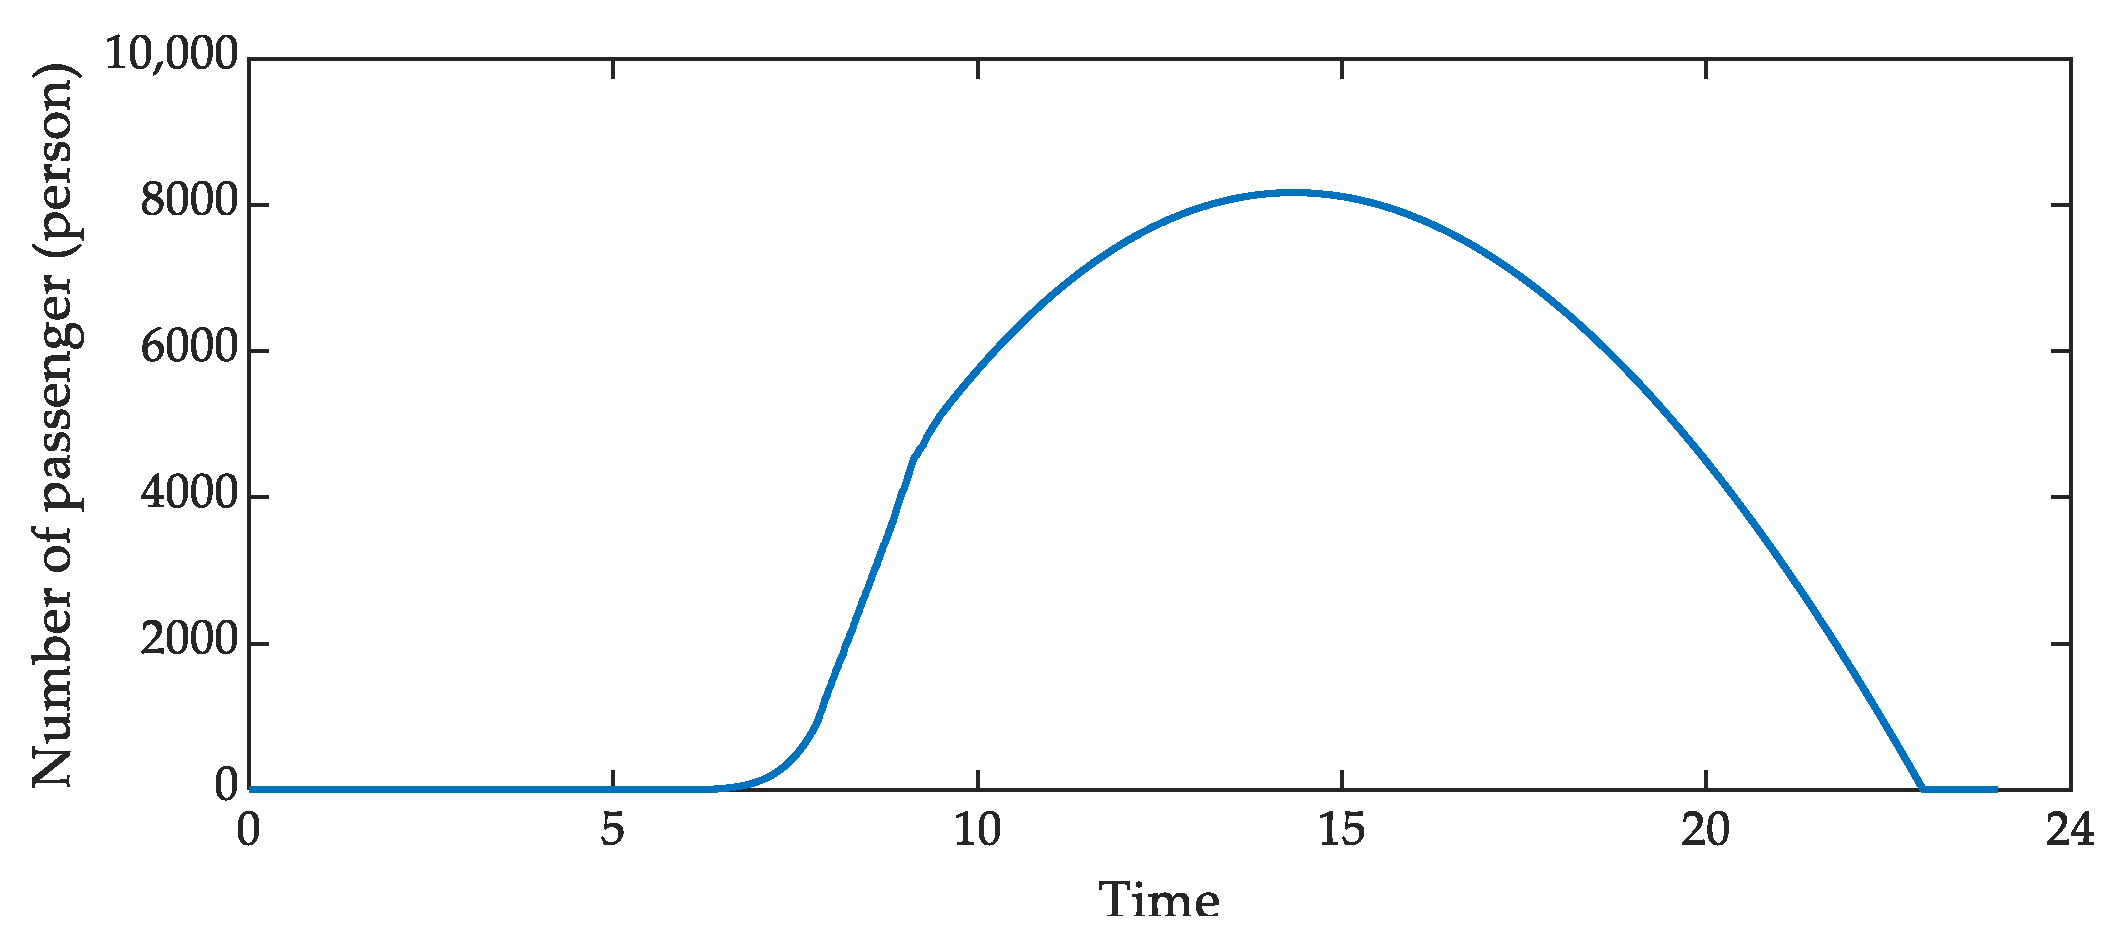
As can be seen from Figure 4, the maximum number of passengers spending time in the waiting room of Changsha South Railway Station was 8168 when the time was 2.20 p.m., while in the literature [27], the maximum number of passengers spending time in the waiting room was 8083 when the time was 2.10 p.m. Therefore, compared with the literature [27], the resulting error is 1.05%, and the peak time appears 10 min later. Therefore, the model for calculating the number of passengers spending time in the waiting room is more accurate.

4. Case Study

In order to specifically analyze the influence of the difference between passenger arrival patterns and train departure patterns on the number of passengers spending time in station waiting rooms, this chapter presents a case study using the waiting-room gathering prediction model established in Section 3.

4.1. Data Preparation

Considering the differences in the passenger arrival parameters of different cities and the train departure rules of different scales, when selecting the case study, these stations are divided into three grades, according to the scale of construction, namely, large, medium, and small-sized. Because the number of departing passengers will influent the number of passengers spending time in the waiting room when analyzing the pattern changes in the number of passengers spending time in the station waiting rooms during holidays and weekdays, this paper aims to determine the number of passengers departing on trains during both peak and off-peak periods.

4.1.1. Selection of High-Speed Railway Stations

In this paper, Beijing South Railway Station in a first-tier city represents large-sized stations, Hefei South Railway Station in a new first-tier city represents medium-sized stations, and Zhoukou East Railway Station in a third-tier city represents small-sized stations. During holidays, since urban functions affect passenger flow in the station, Xi’an North Railway Station is selected as a representative of a new first-tier tourist city. The construction area, platform scale and the approximate value of the effective waiting area for stations are shown in Table 1.

4.1.2. Determination of the Seating Capacity of Passenger Train

The number of seating capacity of passenger train is based on the results of the research on the ticket allocation of high-speed railway trains [15], as well as the passenger flow of stations during holidays and weekdays. The number of seating capacity of passenger train at different stations and in different periods is shown in Table 2.

4.1.3. Passenger Arrival Rule

The passenger arrival rule can be regarded as the probability density distribution function regarding the length of passenger arrival time. Jesper Bláfoss Ingvardson et al. [32] analyzed passenger arrival patterns affected by train issuance frequency and station characteristics during peak hours and off-peak hours. Finally, they established a mixed distribution framework consisting of uniform distribution and β distribution, that was used to estimate passenger waiting time. Luethi, M. et al. [33] established a passenger arrival law prediction model based on mixed distribution. Guo [34], Sun [35] and Zhang [20] conducted statistical analyses of the survey data, and the results showed that the passenger arrival rule conformed to the log-normal distribution. Yang [36] analyzed the passenger arrival rule through curve fitting, and the results showed that passenger waiting time obeyed the patterns of rational distribution and Gaussian distribution. Based on the previous research, this paper assumes that the passenger arrival rule obeys a log-normal distribution.
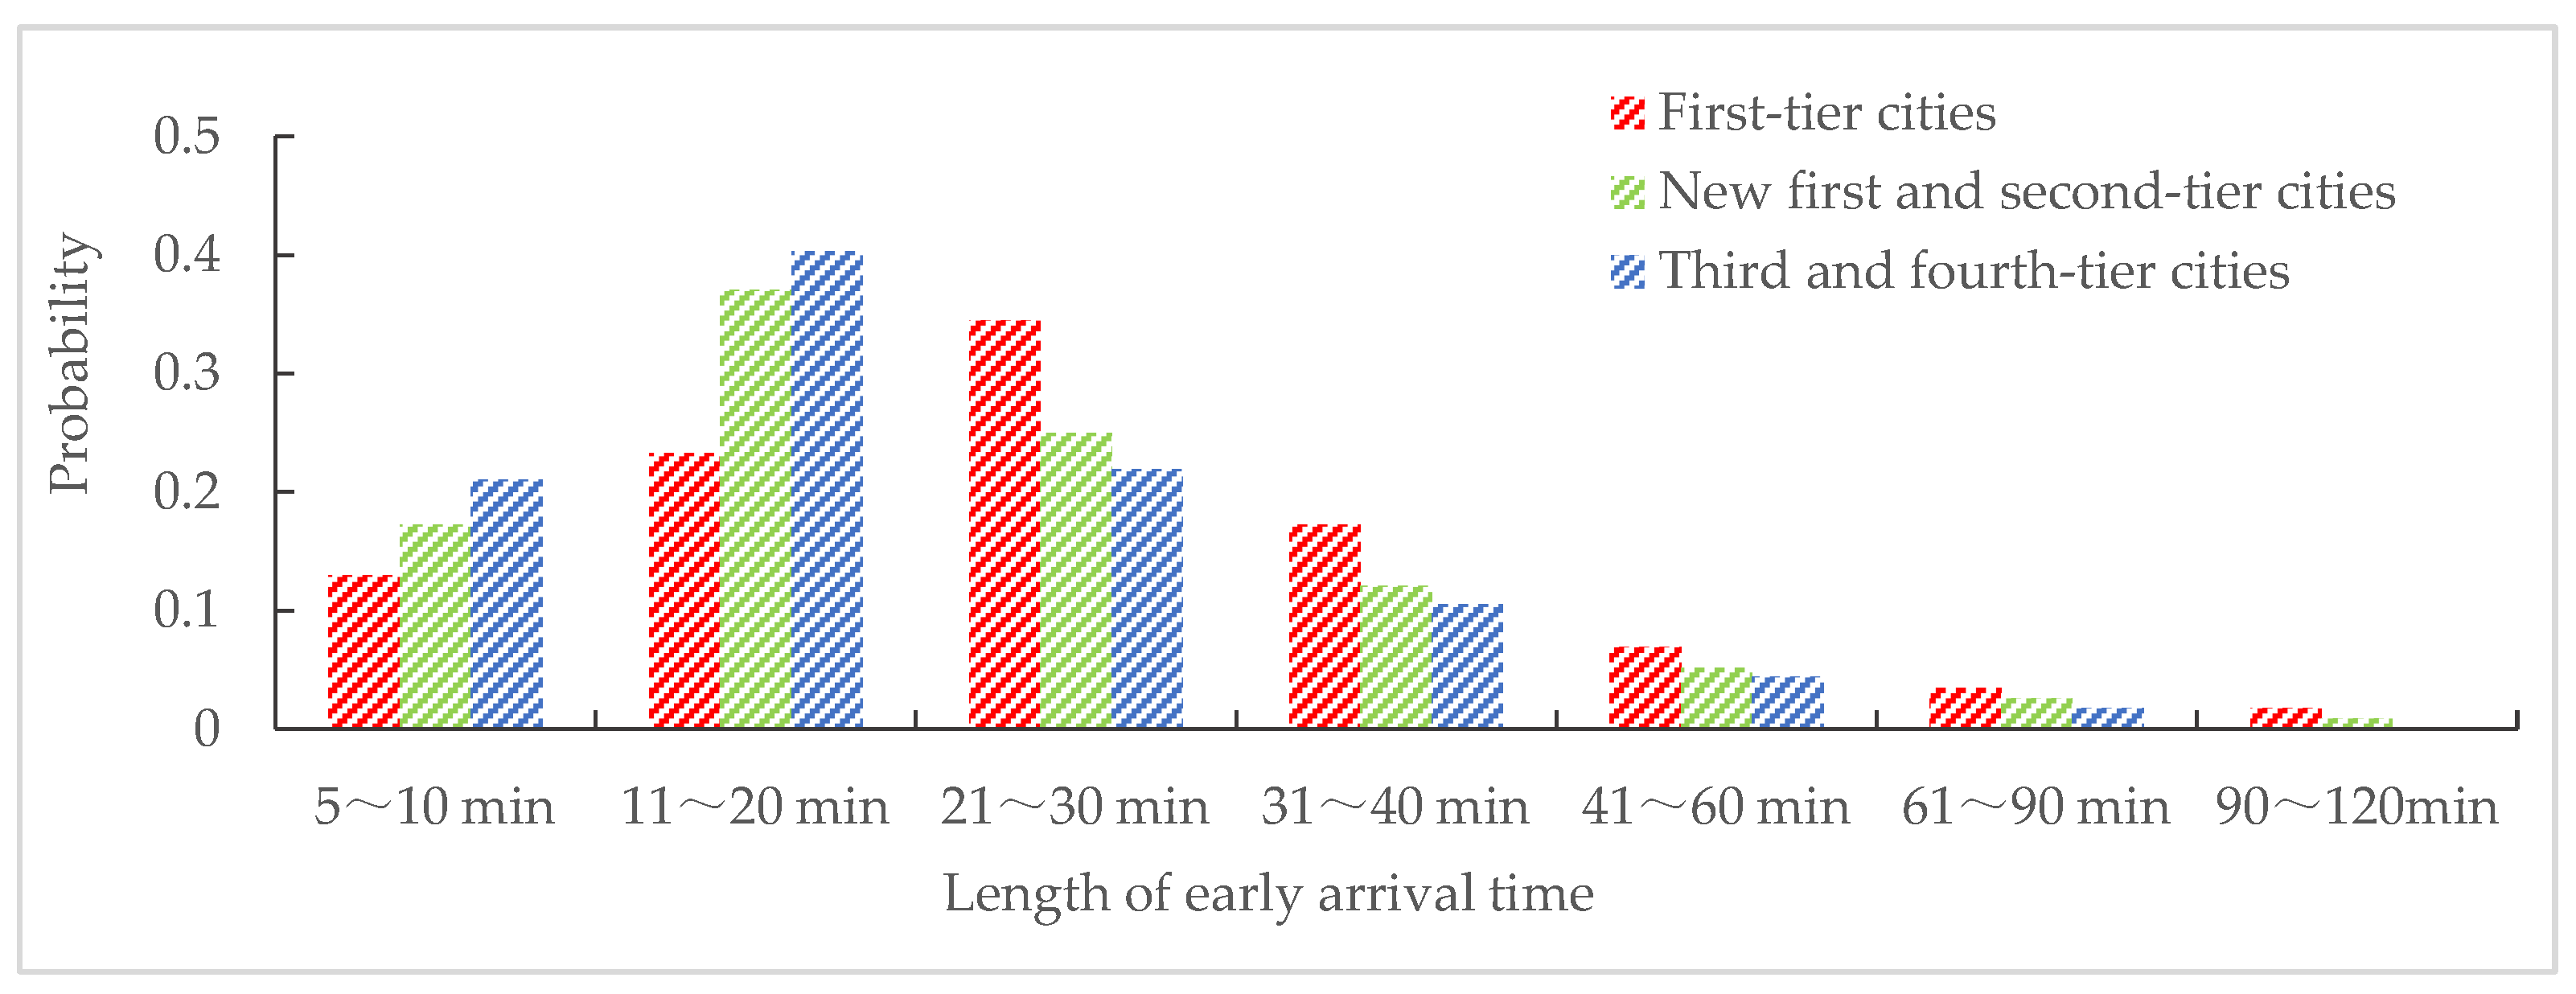
In order to analyze the differences in passenger travel characteristics at different types of stations, we conducted an online questionnaire in 2021. The content of the questionnaire survey assesses the lengths of the early arrival times of high-speed rail passengers. Eventually, a total of 205 questionnaires were collected. According to the results of the questionnaire, the distribution of the length of early arrival times of passengers in different types of cities is obtained. The result is shown in Figure 5.
As can be seen from Figure 5, compared with other types of cities, the arrival times of high-speed rail passengers in first-tier cities are longer than those of other types of stations, and the distribution of passenger arrival time is wider. This may be due to the difference between the train delivery volume at the station and the travel time reliability of urban vehicles. In this paper, Xi’an North Station and Hefei South Station are located in new first-tier cities, Beijing South Station is located in a first-tier city, and Zhoukou East Station is located in a third-tier city. Therefore, according to the type of city, and combined with the results of the questionnaire collection, we set the length of early arrival time of passengers departing from Beijing South Railway Station, Xi’an North Railway Station, Hefei South Railway Station and Zhoukou East Railway Station at 0–120 min, 0–90 min, 0–90 min and 0–60 min, respectively. In order to distinguish the differences between the arrival patterns of passengers from different types of stations, according to the literature [13,19,20,22,37] and the results of questionnaire analysis, we assumed the parameter values of probability distribution functions shown in Table 3.

4.2. The Number of Passengers Spending time in the Waiting Room on Weekdays

4.2.1. Train Departure Frequency

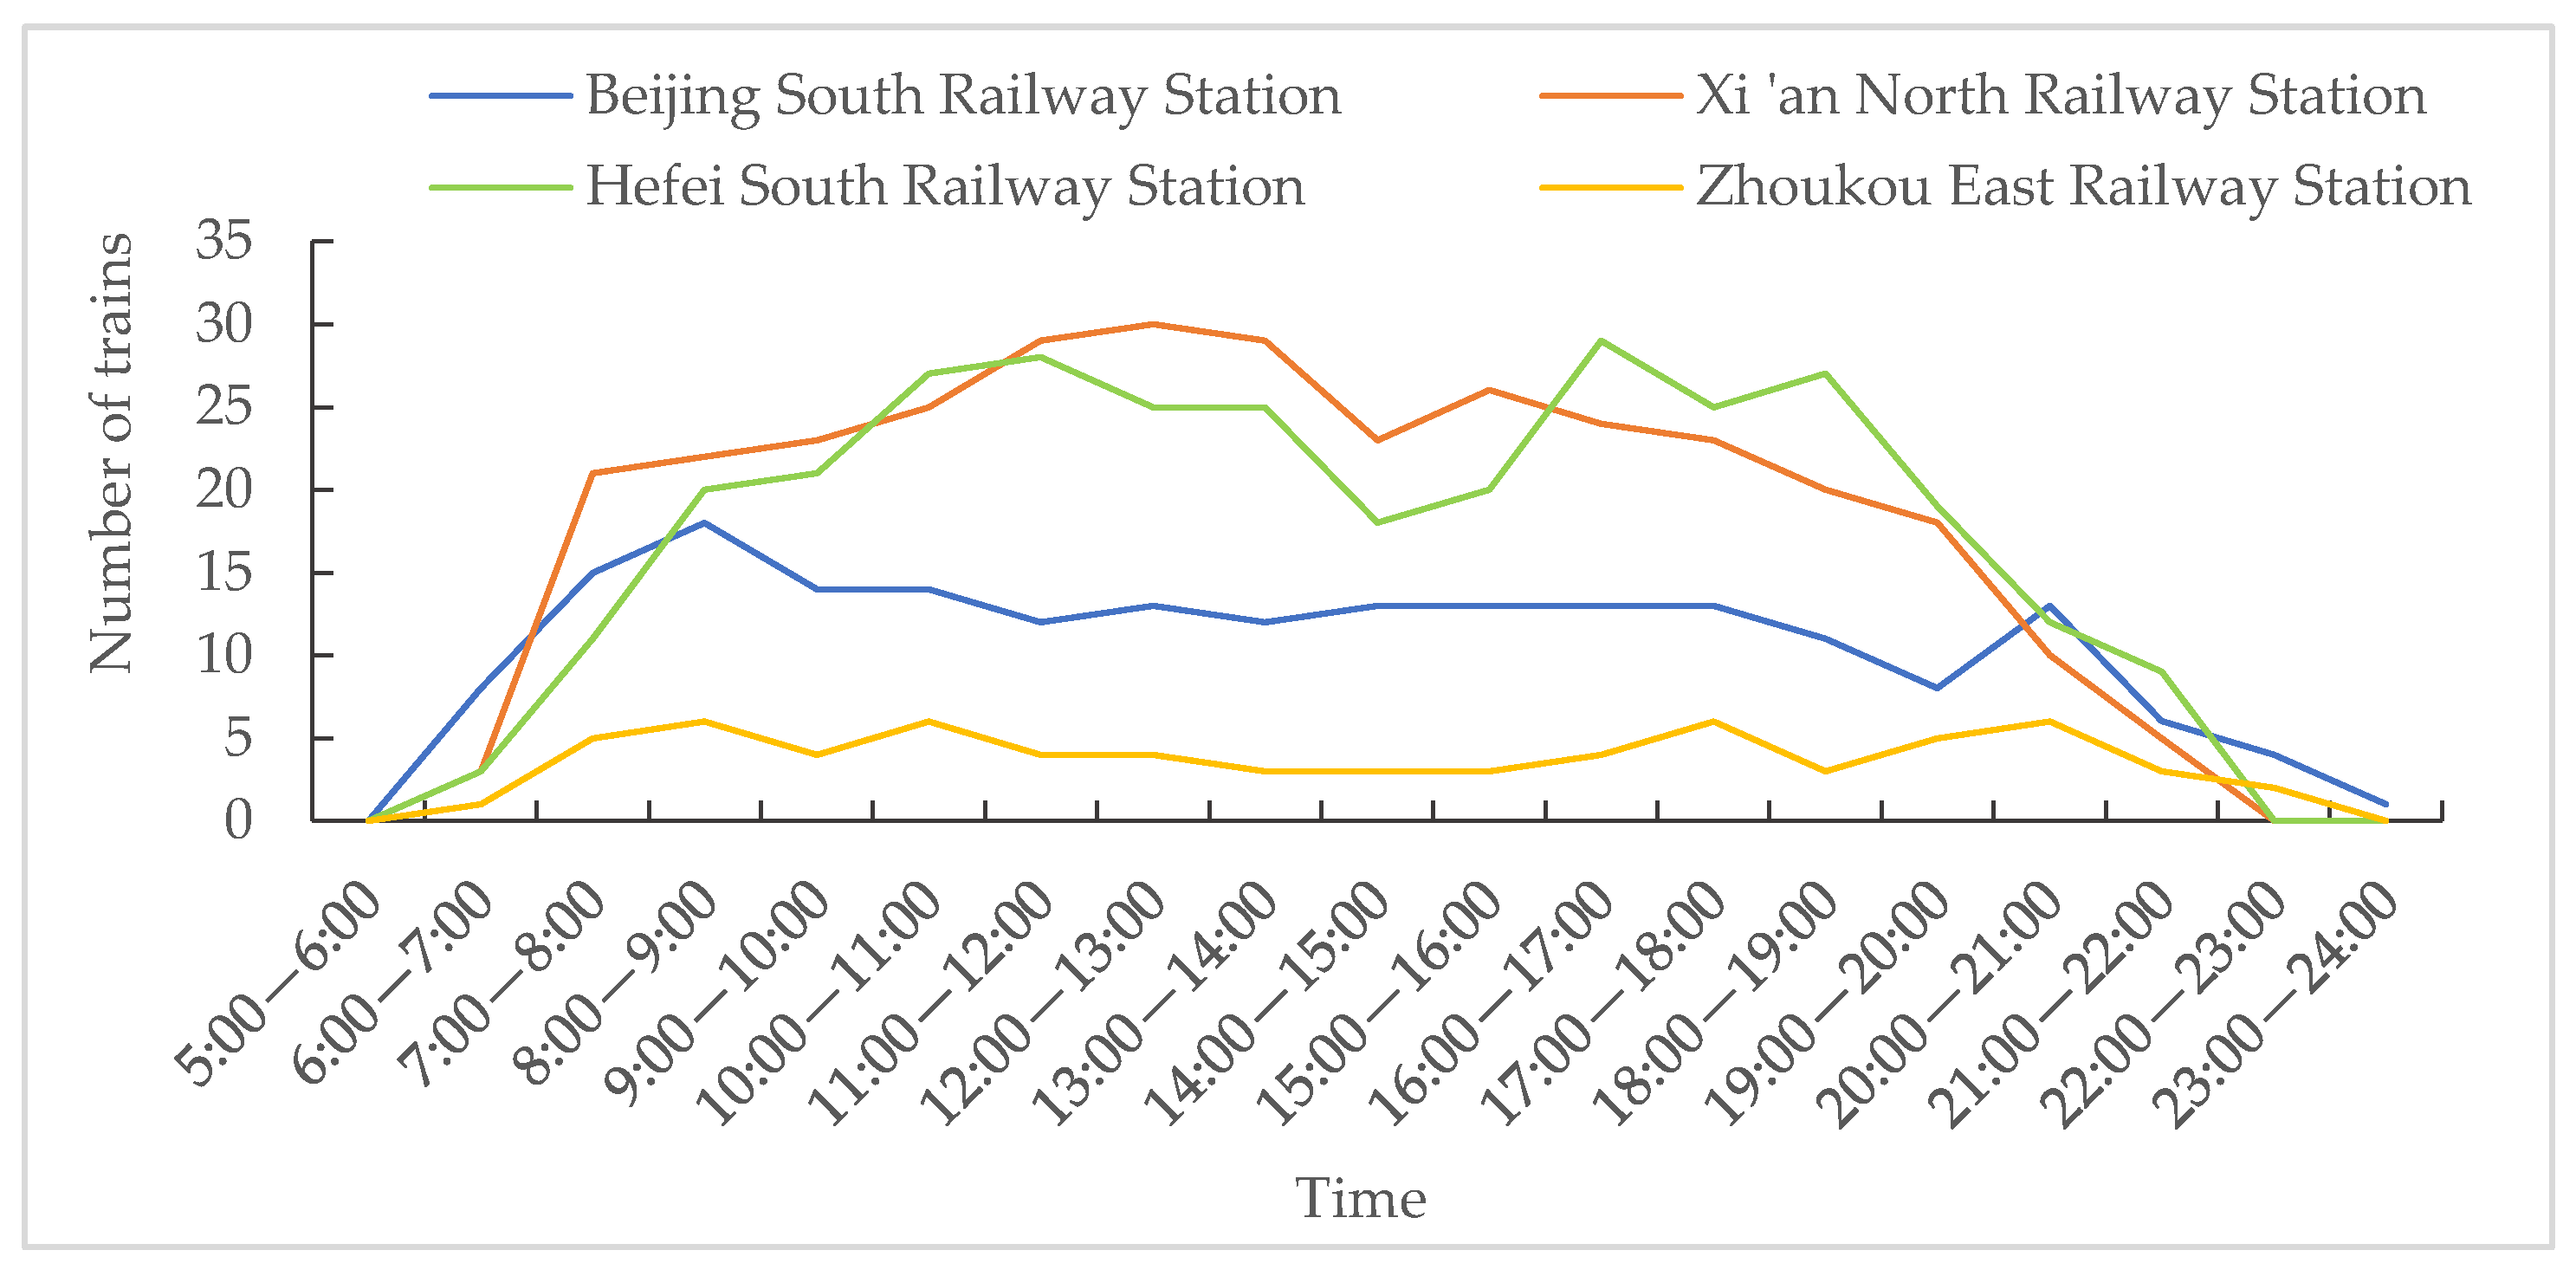
Through a query posed to the website, statistics are calculated based on the departure times and the issued number of trains at various high-speed railway stations on a weekday in 2021, as shown in Figure 6.
The departure times of the trains from the station are not continuous. To facilitate the calculation, we assume that the departure time of trains in a day is a continuous function, and the train departure varies continuously with respect to the train departure time. When calculating the continuous function relationship between the train departure frequency f ( k ) and the departure time k of each high-speed railway passenger station during weekdays, the regression analysis of the train departure time and number, shown in Figure 2, is carried out using the method of polynomial fitting. In addition, the continuous function relationship between the train departure frequency f ( k ) and departure time k for each high-speed railway station is obtained, as shown in Table 4.

4.2.2. The Number of Passengers Spending Time in the Waiting Room

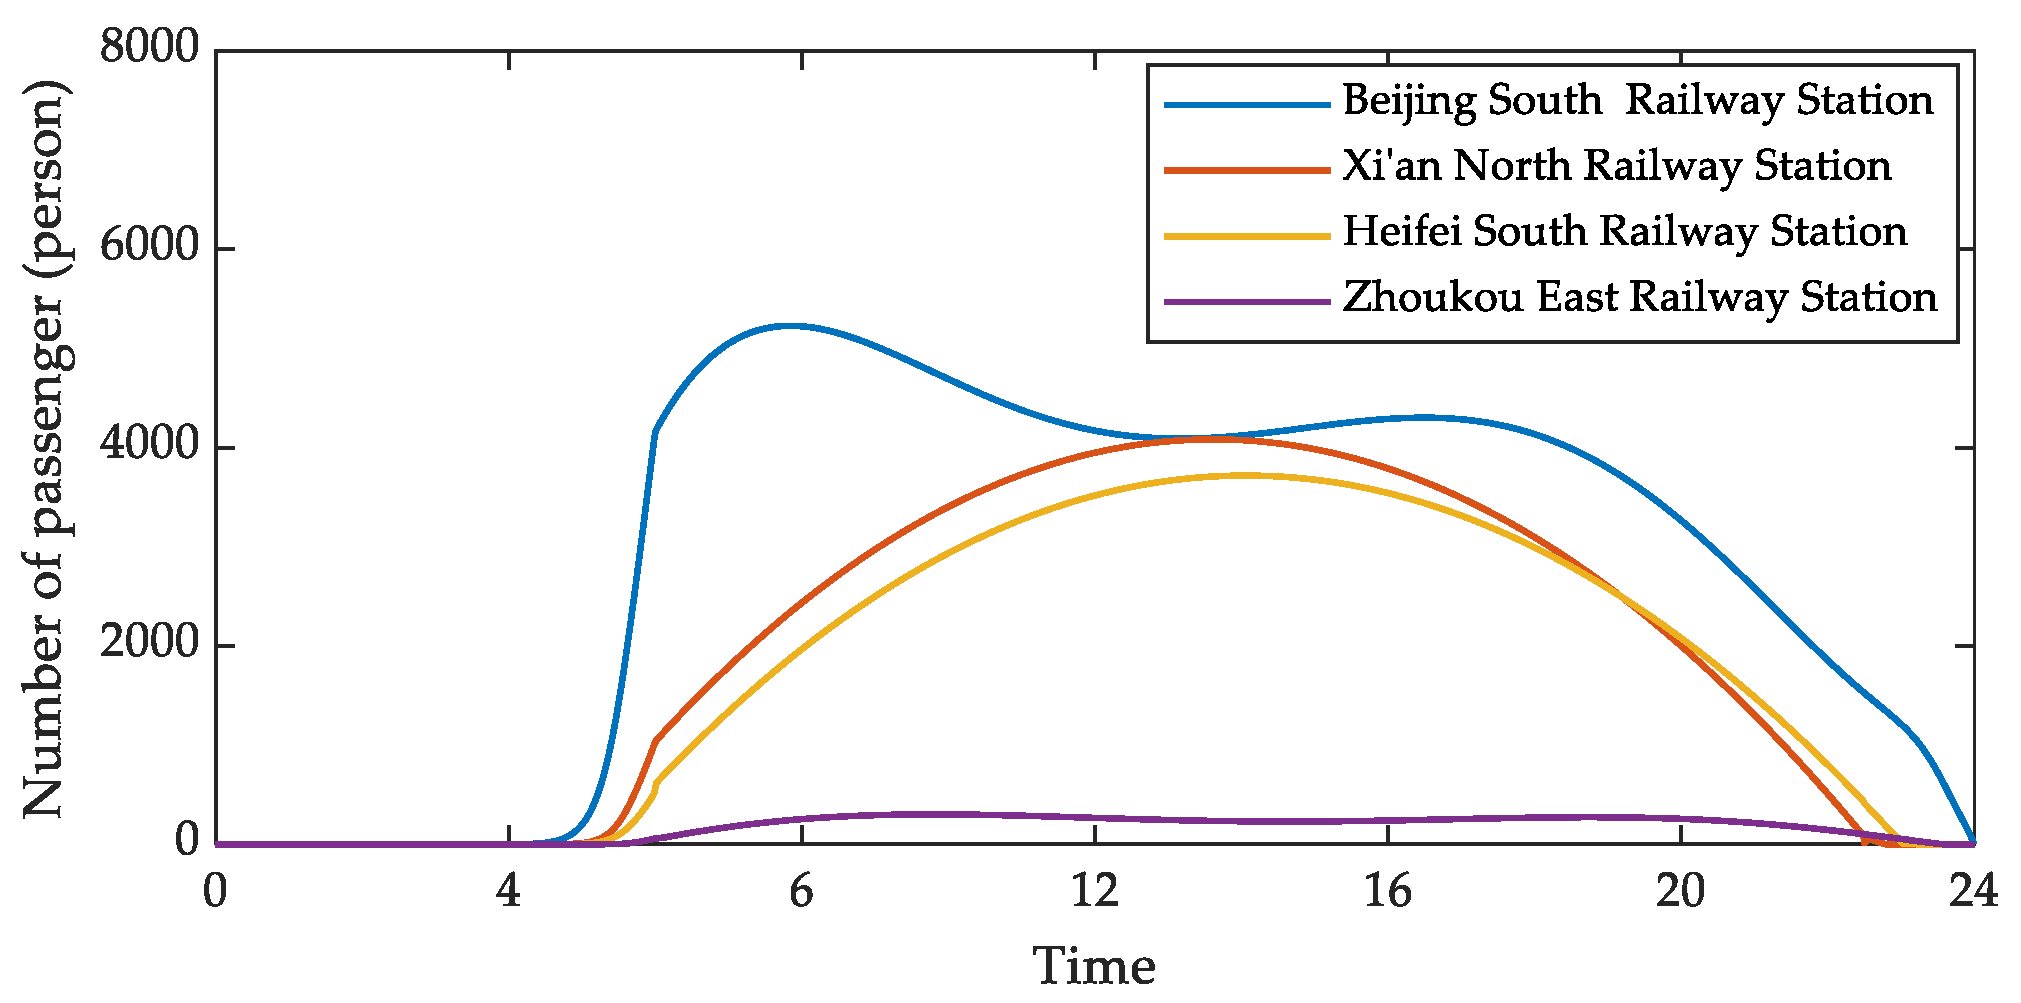
According to the pattern of passenger arrival and train departure, the number of passengers spending time in the waiting room of high-speed railway station on weekdays is calculated using the model, with the number of passengers spending time in the waiting room. The results are shown in Figure 7.
From Figure 7, it can be seen that the changing pattern of the number of passengers gathering in waiting rooms at stations of different sizes is different. In terms of curve changes, the curves showing the number of passengers spending time in the waiting rooms at Zhoukou East Railway Station and Beijing South Railway Station show a double peak during weekdays. This is the same as in the changing pattern of the train departure schedule in Figure 6, and the morning and evening peak periods are the same times as peak periods of urban travel. The curve of the number of passengers spending time in the waiting rooms at Hefei South Railway Station and Xi’an North Railway Station shows a single peak, whereas the curve variation rule of Hefei South Railway Station has a different pattern of change from that showing the number of trains departing at the station in Figure 6.

4.3. The Number of Passengers Spending Time in the Waiting Room during Holidays

4.3.1. Train Departure Frequency

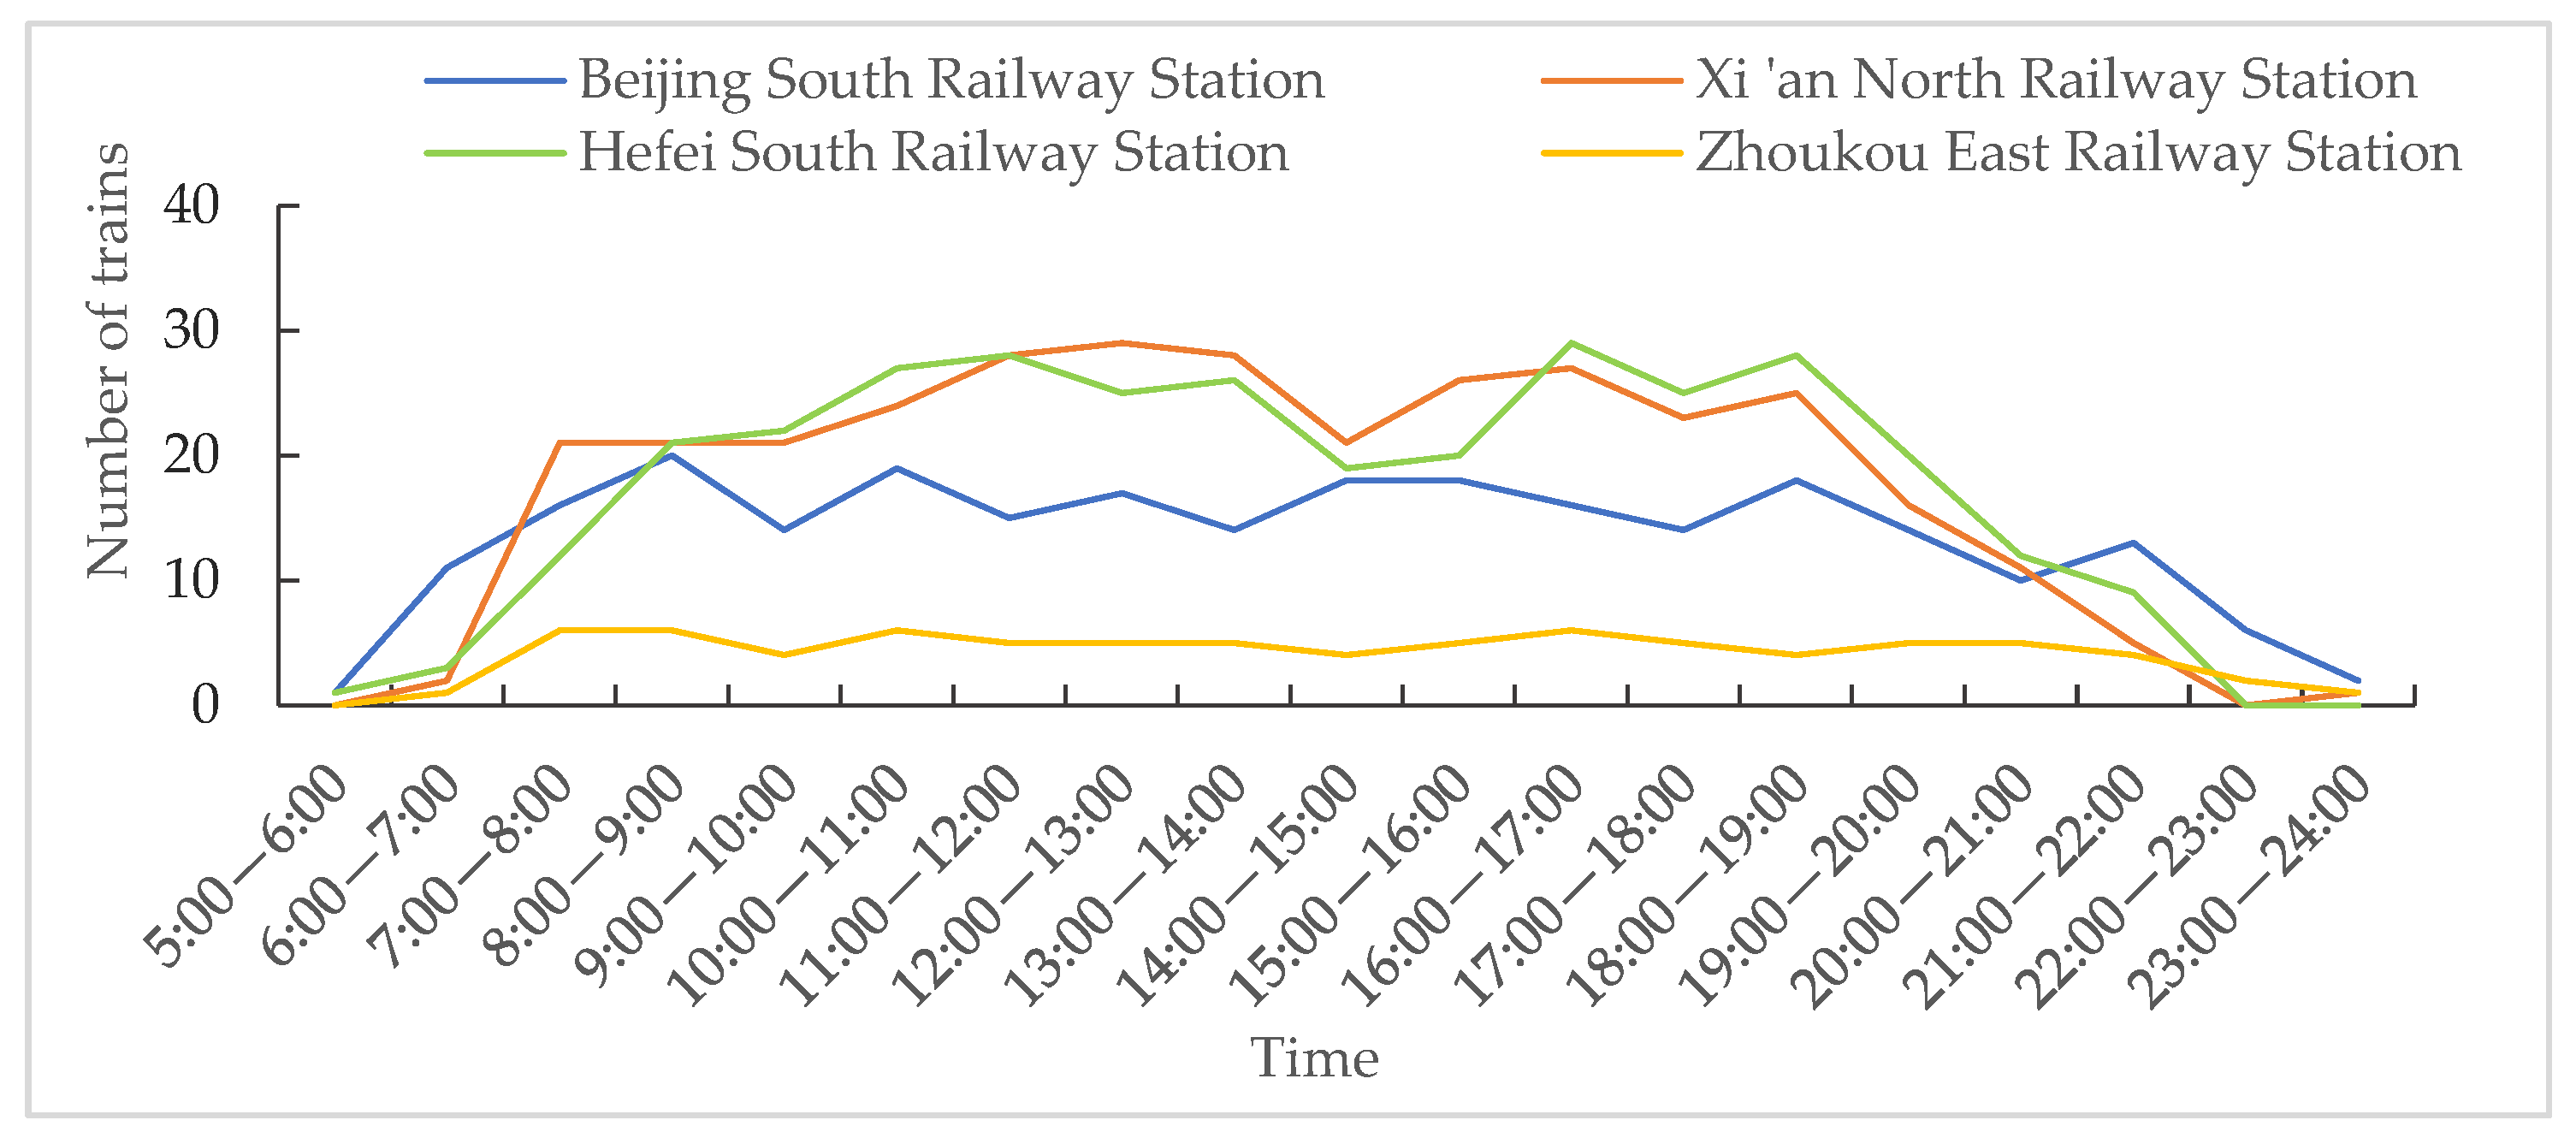
These figures are based on the train schedule during National Day, analyzing the changes in the number of passengers spending time in the waiting rooms of high-speed railway stations during holidays. The departure times and the number of trains departing the station are shown in Figure 8.
The relationship between station train departure frequency and departure time during holidays is shown in Table 5.

4.3.2. Number of Passengers Spending Time in the Station Waiting Room

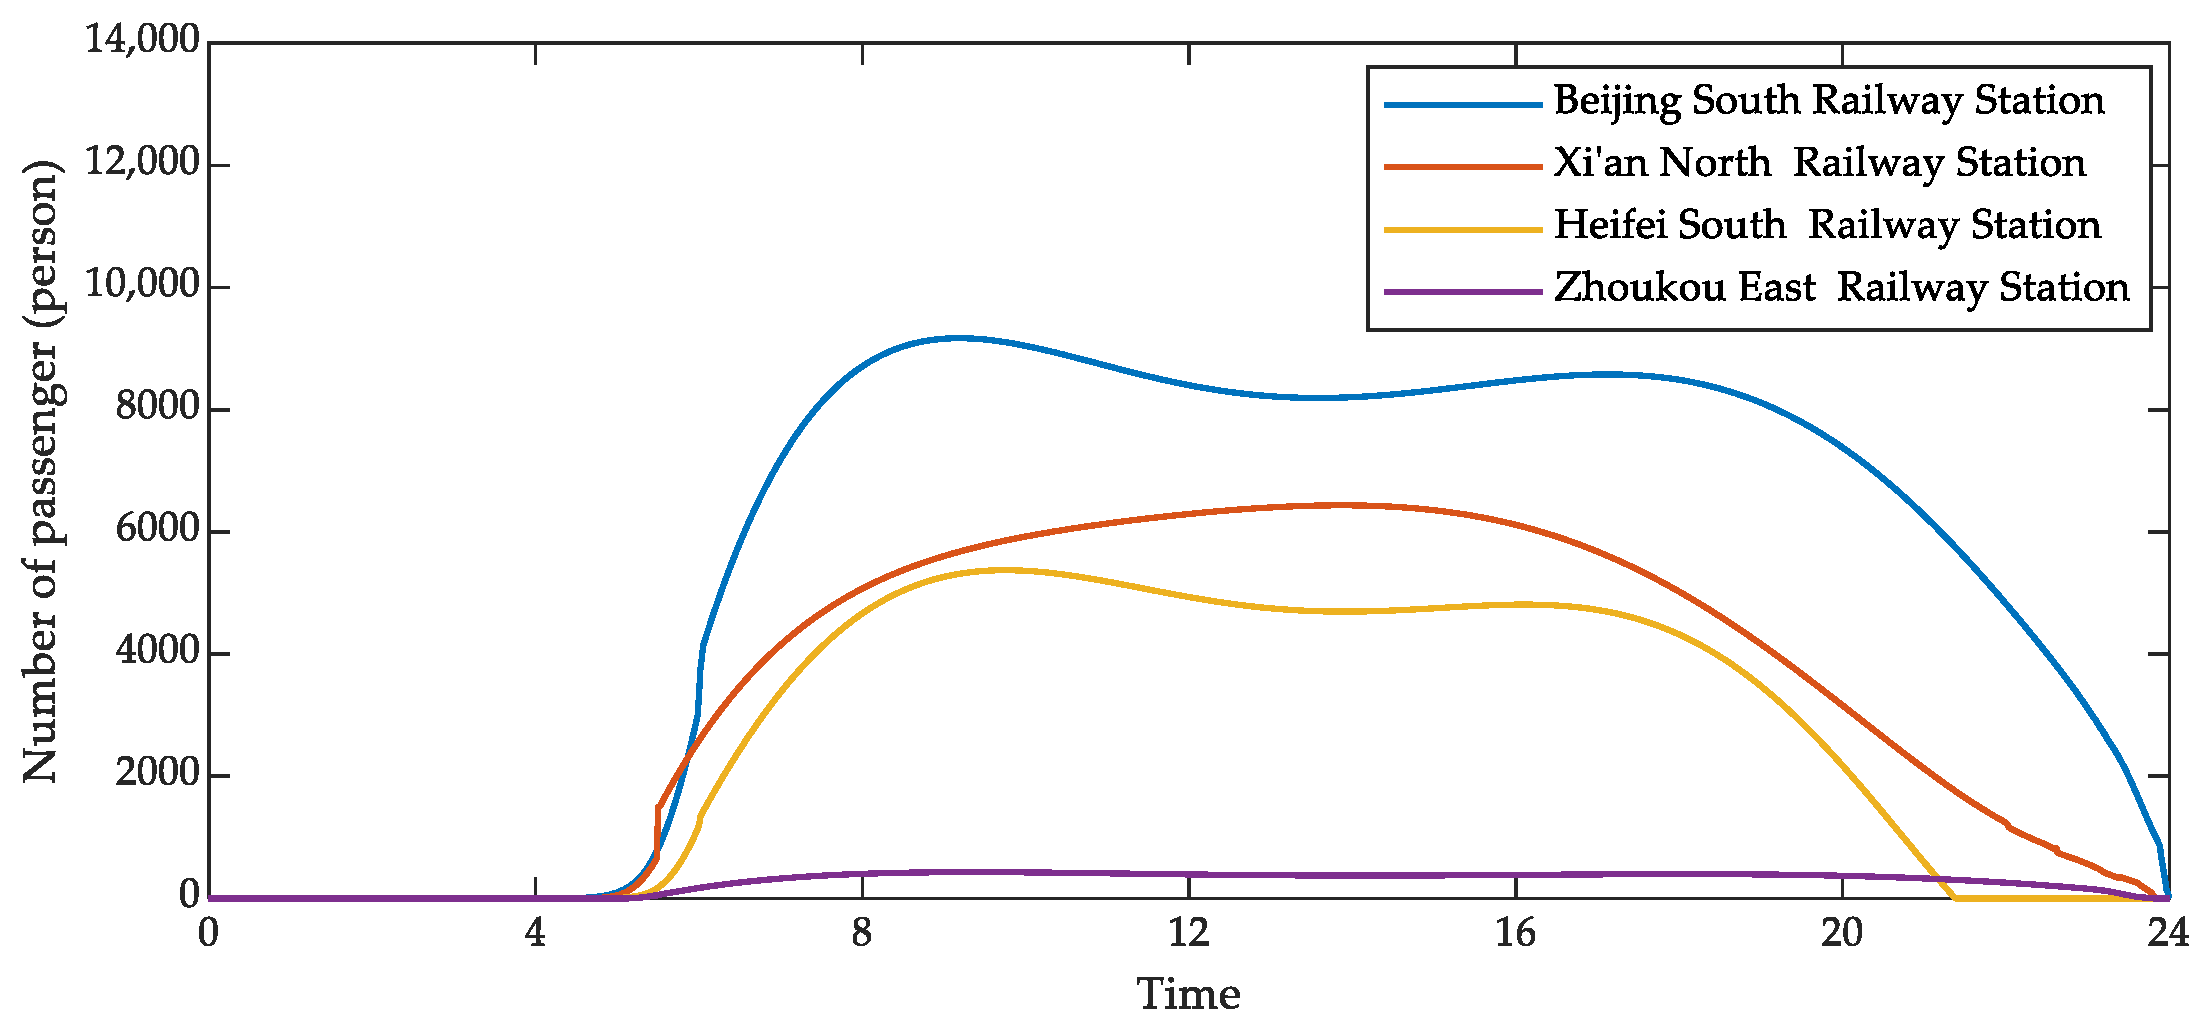
According to the law of passenger arrival and train departure, the number of passengers spending time in the waiting room of a high-speed railway station on holidays is calculated using the model for the number of passengers gathering in the waiting room. The results are shown in Figure 9.
As can be seen from Figure 9, the changing pattern of the number of passengers spending time in the waiting rooms at Zhoukou East Railway Station and Beijing South Railway Station is the same as that on weekdays, and the curves have double peaks. The peak periods are the same as the peak travel periods of passengers in the city. The changing pattern of the number of passengers spending time in the waiting room of Hefei South Railway Station during holidays is different from that on weekdays, and the curves of the number of passengers spending time in the waiting room are double peaks during holidays. During holidays, the number of passengers spending time in the waiting room of Xi’an North Station maintained a single peak.

5. Discussion

Based on the regular pattern of train departures and the habits of passengers regarding arrival times, we established a prediction model for the number of passengers spending time in the waiting room. Using this model, we predicted the number of passengers spending time in the waiting room of high-speed railway passenger stations during holidays and working days, and present here a discussion of the results.

5.1. Maximum Number of Passengers Spending Time in the Waiting Room

The maximum number of passengers gathered refers to the maximum monthly average value of the maximum number of passengers (including station passengers) who spent time in the waiting room (8 min~10 min) during both day and night [21].
Let the maximum number of passengers spending time in the waiting room of a high-speed railway station be Q max ( t ) , as shown in Equation (13):
Q max ( t ) = max ( A j θ 1 ( 1 + θ 2 ) 0 t ( 5 L ρ ( l ) f j ( t + l ) d l ) d t A j θ 1 0 t f j ( t ) d t )
During holidays, due to station departure passenger flow and an increase in train line numbers, the number of passengers spending time in the waiting rooms of the four stations has increased to a certain extent, compared with weekdays. Let the growth rate be ξ , as shown in Equation (14):
ξ = Q 1 Q 2 Q 2 × 100 %
where Q 1 is the maximum number of passengers spending time in the waiting room of a high-speed railway station during holidays. Q 2 is the maximum number of passengers spending time in the waiting room of a high-speed railway station during workdays.
Using Equations (13) and (14), the maximum number of passengers spending time in the waiting room of a high-speed railway station and the growth rate of the maximum number of passengers gathering during holidays and days are calculated, and the results are shown in Figure 10.
The following results can be obtained from an analysis of Figure 10.
(1) By analyzing the number of passengers spending time in the waiting room of Beijing South Railway Station in Figure 10 and the growth rate during holidays, it can be seen that the maximum number of passengers spending time in the waiting room of Beijing South Railway Station, representing first-tier cities, increases by 65.60% during holidays. This indicates that during holidays, the demand for waiting areas by high-speed railway passengers in first-tier cities is greater than in other types of cities. In addition, the travel dates are more concentrated so in large stations, which are located in first-tier cities, the growth rate of the number of passengers spending time in waiting rooms is larger than that in other stations.
(2) Figure 10 shows that the maximum number of passengers spending time in the waiting room and the growth rate of Xi’an North Railway Station are higher than that of Hefei South Railway Station during holidays. This shows that when the station’s passenger arrival pattern is the same, the maximum number of passengers spending time in the waiting room is related to the functioning of the station and the nature of the city where it is located. Xi’an North Railway Station is the city transformation node for Xi’an tourism, as well as being an important node in China’s high-speed railway network. Therefore, the growth rate of the maximum number of passengers spending time in the station waiting room is larger during holidays in the tourist cities, as represented by Xi’an North Railway Station.
(3) As can be seen from Table 3 and Figure 8, the average daily passenger flow of Beijing South Railway Station during holidays is 7.29 times that of Zhoukou East Railway Station. However, the maximum number of passengers spending time in the waiting room of Beijing South Railway Station during holidays is 12.76 times that of Zhoukou East Railway Station. This indicates that the travel time uncertainty of high-speed railway passengers in third-tier and fourth-tier cities is smaller; the early arrival time of passengers is shorter, so the waiting-room demand from passengers is lower. Therefore, when designing the station scale of high-speed railway stations in third-tier and fourth-tier cities, the arrival patterns of passengers should be fully considered. In addition, compared with weekdays, the growth rate of the maximum number of passengers spending time in the waiting room of Zhoukou East Railway Station is the lowest during holidays. This indicates that in small stations located in third-tier cities, changes in the number of departing passengers during holidays have the weakest influence on the maximum number of passengers spending time in the station waiting room, reflecting the difference in passengers’ reasons for travel and the number of passengers leaving from station.

5.2. Analysis of the Utilization Rate of Waiting Capacity in Station Waiting Rooms

(1) The utilization rate of the waiting room capacity can reflect the capacity utilization level of the station waiting room, as shown in Equation (15) [18]:
φ = N 1 N 2 × 100 %
where φ is the utilization rate of waiting capacity in the waiting room; N 1 is the actual waiting-room demand; N 2 is the existing waiting-room capacity of the waiting room.
The actual waiting demand and the existing waiting capacity of the waiting room are shown as Equations (16) and (17) [18]:
N 1 = ω × Q max γ
N 2 = S γ
where S is the effective waiting room area for passengers, as shown in Table 1; γ is the per capita occupancy area, according to the literature [18], γ = 1.3 m 2 / person; ω is the required waiting area, corresponding to the peak hourly transport volume of the station. For some extra-large, large and medium-sized stations ω = 1.2 m 2 /person, and small stations ω = 1.6 m 2 / person [18].
Bringing Equations (16) and (17) into Equation (15), we can calculate the waiting capacity utilization rate of the waiting room in each high-speed railway station during holidays and working days, as shown in Figure 11.
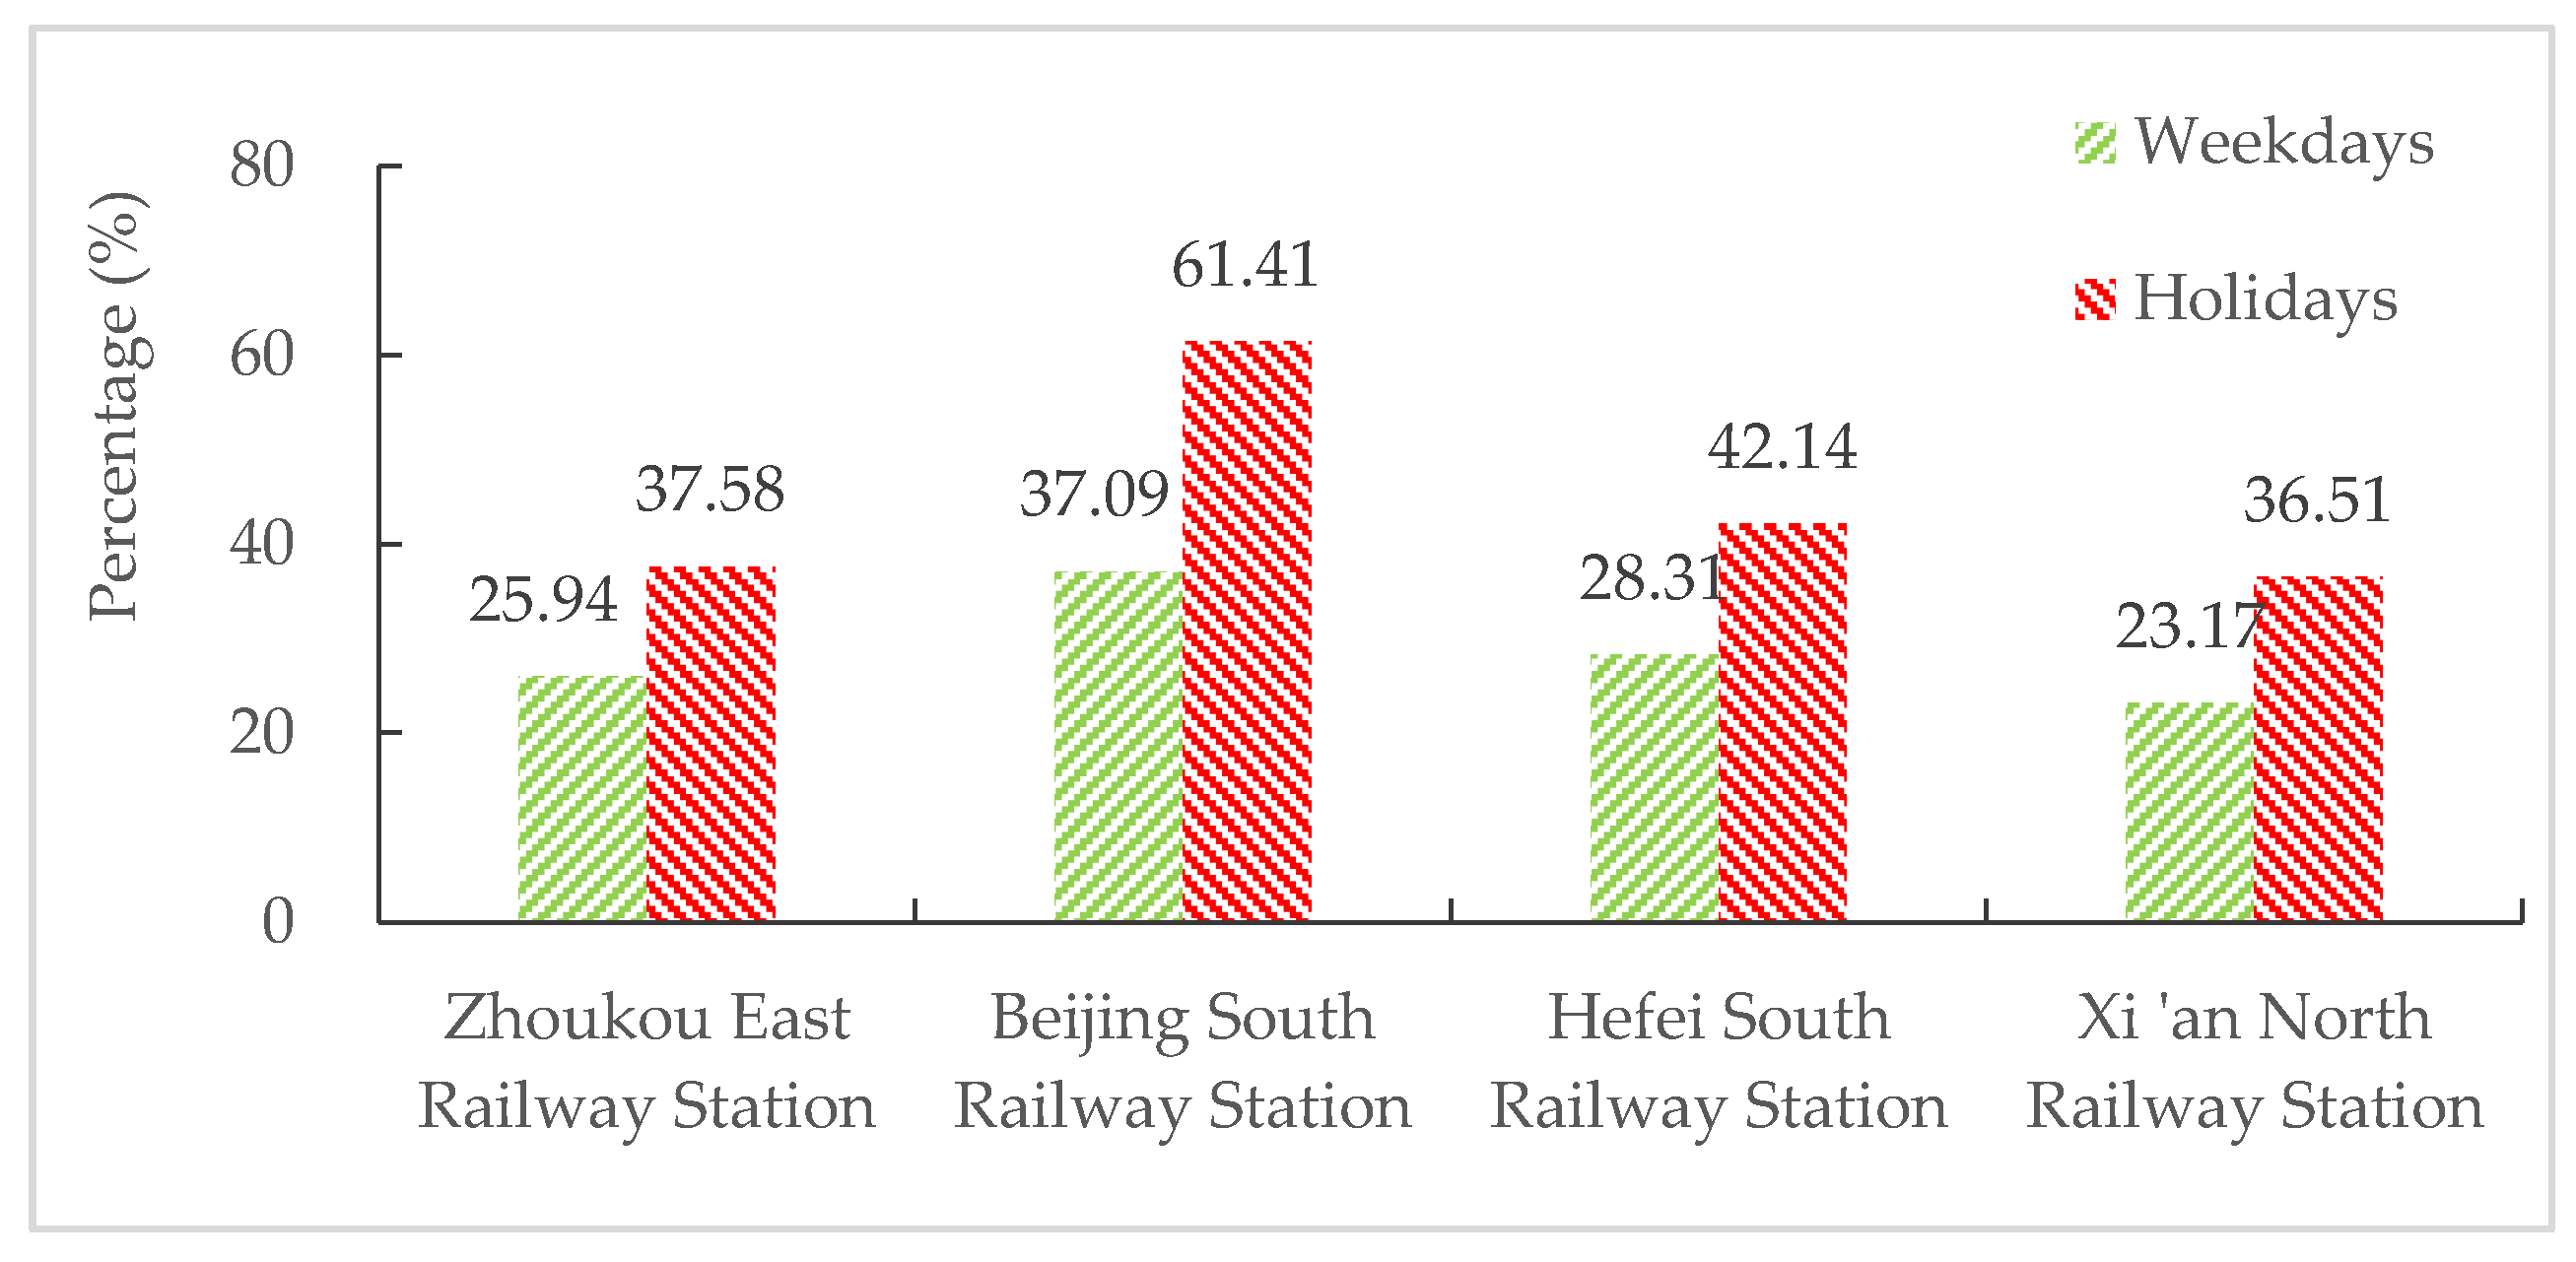
Figure 11 shows that the utilization rate of the waiting room of Beijing South Railway Station is 61.41% during holidays. However, the waiting room capacity utilization rate of Zhoukou East Railway Station is 37.58%. This indicates that in small stations located in third-tier and fourth-tier cities, the waiting capacity of the existing station waiting rooms far exceeds the actual waiting needs of passengers, which may be due to the low uncertainty of intra-city travel time in third-tier and fourth-tier cities and the high level of passenger reservations, so the number of passengers in the waiting rooms decreases.

5.3. Effect of the Duration of Passengers’ Early Arrival Times on the Maximum Number of Passengers Spending Time in the Station Waiting Room

It is assumed that the arrival habits of high-speed railway passengers can be changed by improving the reliability of vehicle travel time or improving the information content available. The duration of early arrival times of passengers from Beijing South Railway Station, Xi’an North Railway Station and Hefei South Railway Station to the station waiting rooms are shortened from 0–120 min, 0–90 min, and 0–90 min to 0–90 min, 0–60 min, and 0–60 min, respectively. The timetables of train movement do not change, the passenger arrival pattern obeys log-normal distribution, and the parameter values in the distribution function do not change.
By changing the habits of passenger arrivals, according to Equation (12), we can analyze the changing pattern of the number of passengers spending time in the station waiting room during holidays and workdays. The result is shown in Figure 12a,b.
Looking at Figure 7, Figure 9 and Figure 12, when assessing the shorter duration of passenger early arrival times, the number of passengers spending time in waiting rooms shows a decreasing trend during holidays and weekdays. Therefore, let the rate of reduction of the maximum number of passengers spending time in the station waiting room, after changing the passenger arrival pattern, be τ i , as shown in Equation (18):
τ i = Q 4 Q 3 Q 3 × 100 %
where Q 3 is the maximum number of passengers spending time in the station waiting room when the arrival habits of passengers are not changed. Q 4 is the maximum number of passengers spending time in the station waiting room after changing the arrival habits of passengers; i = 1, 2, 3. The values represent Beijing South Railway Station, Xi’an North Railway Station and Hefei South Railway Station, respectively.
From Equations (13) and (18), we can calculate the maximum number of passengers spending time in the waiting room of a high-speed railway station during holidays and workdays and the reduction rate of the maximum number of passengers spending time in the waiting room of a high-speed railway station after changing passenger arrival habits. The results are shown in Figure 13.
Analyzing the curve changes in Figure 13, certain results can be identified:
(1)
During holidays, shortening the length of passengers’ early arrival time makes the reductions in the maximum number of passengers gathered greater than on weekdays.
(2)
By shortening the length of passengers’ early arrival time, the reduction rate in the maximum number of passengers spending time in the waiting room is greatest for Hefei South Railway Station and the least for Beijing South Railway Station. This indicates that reducing the length of early passenger arrival times in new first-tier cities, compared to first-tier cities, can effectively reduce the maximum number of passengers spending time in waiting rooms at medium-sized stations. This may be related to the development of urban public transportation facilities, external travel demand and the travel habits of frequent passengers and others.

6. Conclusions

The purpose of this study was to predict the passenger waiting-area demand of high-speed railway passenger stations. Therefore, we take the number of passengers spending time in the waiting room of a high-speed railway station as the research object, establishing a prediction model of the number of passengers spending time in the waiting rooms, taking into account passenger arrival habits and the train departure timetable. According to the city type and station building scale, we selected four different types of high-speed railway passenger stations to analyze and assumed that passenger arrival habits obey a lognormal distribution. When the duration of passengers’ early arrivals and the patterns of train departure were changed, we analyzed the changing pattern of the number of passengers spending time in the waiting rooms of different types of stations.
The results show that the changing pattern of the number of passengers spending time in waiting rooms of different types and different scales of high-speed railway passenger stations is affected by passenger arrival habits and train frequency. Therefore, when planning and designing station construction, the number of passengers spending time in the waiting room should be predicted scientifically, according to the requirements of urban development, passenger travel characteristics and departing passenger flow. Then, reasonable planning of station scale can be achieved.
The results of this study are presented from three aspects:
(1)
Due to the influence of the urban traffic environment and passenger flow, the departing passengers of large railway stations in first-tier cities have a longer waiting time, meaning more passengers in the waiting room. For small stations located in third-tier and fourth-tier cities, passengers’ early arrival time is shorter, and the number of passengers spending time in the waiting room is, thus, smaller. During holidays, the growth in the rate of passengers using the waiting room and the utilization rate of the waiting capacity of large stations in first-tier cities is higher than that of medium-sized stations in new first-tier cities and of small stations in third-tier and fourth-tier cities.
(2)
Without changing the habits of passengers regarding train departure, shortening the early arrival time of passengers and reducing the maximum number of passengers spending time in the waiting room of medium-sized stations in new first-tier cities can be achieved more easily than in the case of large stations in first-tier cities. With regard to shortening the early arrival time of passengers, the decrease in the maximum number of passengers gathering during weekdays is higher than the decrease during holidays.
(3)
Urban functionality will affect the changing pattern of the number of passengers spending time in station waiting rooms. The growth rate of the maximum number of passengers spending time in the waiting rooms of high-speed railway stations that are tourist city transition nodes is higher than that seen at a regular station during holidays. When shortening the length of the early arrival times of passengers, the rate of reduction in the maximum number of passengers in the waiting room is less than that in a regular station.
To sum up, compared with other research methods, this paper can accurately analyze the change mechanism of the number of passengers spending time in the waiting room. It can also effectively analyze the changes in the number of passengers spending time in the waiting room under different passenger arrival patterns, and the differences between different types of stations. There are still some deficiencies in this research. The probability distribution function and parameter values of the departure/passenger arrival pattern for the four types of high-speed railway stations are assumed based on the station type, the results of a small-scale network questionnaire survey, and previous research results. The purpose is to analyze the impact of the differences in passenger arrival patterns on the number of passengers spending time in the waiting room. In the future, the authors will conduct field research on four types of stations and analyze the differences in passenger travel characteristics in different types of high-speed railway stations, based on the survey results. Thus, the changing mechanism of the number of passengers spending time in the waiting room of a high-speed railway passenger station can be analyzed more accurately.
For example, by analyzing the factors that affect the choices behind passengers’ early arrival time, such as passengers’ socio-economic attributes, travel characteristics and psychological factors, we can dynamically analyze the pattern of passenger arrival and predict the impact of the difference between travel time and the departure station on the number of passengers spending time in the waiting room.

Author Contributions

Methodology, data curation, writing original draft, Y.C.; conceptualization, funding acquisition, writing—review and editing, H.G.; supervision, T.L., Y.H. and J.Z. All authors have read and agreed to the published version of the manuscript.

Funding

This research was funded by the National Natural Science Foundation of China (grant number 71971005) and the project sponsored by the Natural Science Foundation of Beijing, China (grant number 8202003).

Institutional Review Board Statement

Not applicable.

Informed Consent Statement

Not applicable.

Data Availability Statement

The data used to support the findings of this study are available from the corresponding author upon request, and the train schedule data used in this paper are from China Railway 122306. https://kyfw.12306.cn/otn/czxx/init. (accessed on 3 October 2021 and 16 April 2021).

Conflicts of Interest

The authors declare that there is no conflict of interest regarding the publication of this paper.

References

  1. Around the Beijing-Tianjin Network. The Operating Mileage of China’s High-Speed Railway Has Reached 37900 km, Ranking First in the World. Available online: https://baijiahao.baidu.com/s?id=1689835624278543525&wfr=spider&for=pc (accessed on 25 January 2021).
  2. Xiong, J.; Shen, Z. The rise and future development of high-speed railways in China. J. Transp. Eng. 2021, 21, 6–29. [Google Scholar] [CrossRef]
  3. Han, L.F.; Yang, B.Y. A study on the rational coupling of high-speed railway station space efficiency, order and directness—Taking the new high-speed railway passenger stations at home and abroad in the past decade as an example. Huazhong Archit. 2021, 39, 65–69. [Google Scholar] [CrossRef]
  4. Liang, Y.; Song, W.; Dong, X. Evaluating the Space Use of Large Railway Hub Station Areas in Beijing toward Integrated Station-City Development. Land 2021, 10, 1267. [Google Scholar] [CrossRef]
  5. Beijing Evening News. Beijing South Railway Station “Beautician” Cleaning Area Is Equivalent to 7 Football Fields. Available online: http://beijing.qianlong.com/2017/0116/1319409.html (accessed on 16 January 2017).
  6. Why Tokyo Station, Which Has a Population of One Million People per Day, Is in Good Order. Available online: http://blog.sina.com.cn/s/blog_4cd1c1670102xp15.html (accessed on 3 April 2018).
  7. Riders at Each Station. Available online: https://www.jreast.co.jp/passenger/index.html (accessed on 7 November 2020).
  8. Why Can Tokyo Station in Japan Improve the Boarding and Landing Efficiency When the Station Building Is Smaller. Available online: https://www.zhihu.com/question/291372835 (accessed on 17 April 2019).
  9. Zhang, S.S. Based on the comprehensive development of large-scale stations along the railway line—Talking about the reform of Xi’an Station with the complex of Kyoto Railway Station in Japan. Railw. Stand. Des. 2016, 60, 114–118. [Google Scholar] [CrossRef]
  10. Google Maps View. Available online: http://www.williamlong.info/google/archives/482.html (accessed on 10 October 2007).
  11. After Reading This Article, You May Come to South America for a Train. Available online: https://baijiahao.baidu.com/s?id=1589127766619833919&wfr=spider&for=pc (accessed on 9 January 2018).
  12. The “Slow” Service in the high-Speed Rail Era Makes the Travel of Elderly Passengers Warmer. Available online: http://news.gaotie.cn/pinglun/2020-11-30/559801.html (accessed on 17 November 2020).
  13. Zhang, T.W. Study on the rule of passenger aggregation in railway passenger stations. J. Railw. 2009, 31, 31–34. [Google Scholar]
  14. Li, J.P. Train Station Passenger Flow Study. In Proceedings of the 2000 Winter Simulation Conference Proceedings, Winter, Orlando, FL, USA, 10–13 December 2000; Volume 2, pp. 1173–1176. [Google Scholar]
  15. Bychkov, I.; Kazakov, A.; Lempert, A.; Zharkov, M. Modeling of Railway Stations Based on Queuing Networks. Appl. Sci. 2021, 11, 2425. [Google Scholar] [CrossRef]
  16. Xu, X.Y.; Liu, J.; Li, H.Y.; Hu, J.Q. Analysis of subway station capacity with the use of queueing theory. Transp. Res. Part C Emerg. Technol. 2014, 38, 28–43. [Google Scholar] [CrossRef]
  17. Train, K.E. Discrete Choice Methods with Simulation; Cambridge University Press: Cambridge, UK, 2003. [Google Scholar]
  18. Zhao, W.R. Study on Waiting Capacity of Waiting Room of Large-Scale High-Speed Railway Passenger Station; Beijing Jiaotong University: Beijing, China, 2017; p. 118. [Google Scholar]
  19. Chen, X.C.; Wang, Y.Q. Passenger agglomeration rule of railway passenger station. Based on improved graphic method. J. Lanzhou Jiaotong Univ. 2015, 34, 90–94, 106. [Google Scholar]
  20. Zhang, R.B. Analysis and Calculation Method of Waiting Capacity of Railway Passenger Station; Beijing Jiaotong University: Beijing, China, 2011; p. 78. [Google Scholar]
  21. He, Y.Q.; Mao, B.H.; Chen, S.K. Study on the calculation method of the maximum number of passengers gathered in railway passenger stations. J. China Railw. Soc. 2006, 1, 6–11. [Google Scholar] [CrossRef]
  22. Guo, S.; Fu, Z.N. Analysis of passenger aggregation Rule of departure Train in High- Speed Railway Station. Transp. Sci. Technol. Econ. 2017, 19, 34–38. [Google Scholar] [CrossRef]
  23. Lu, K.; Wei, W.; Lin, G.R.; Tian, X.; Xu, J.M. Combined forecasting method of gathering number of passenger transport hub based on KNN regression. J. Jilin Univ. 2021, 51, 1241–1250. [Google Scholar] [CrossRef]
  24. Zhu, C.F.; Li, H.J.; Wang, Q.R. Research on Operation Arrangement for Waiting Hall in Railway Passenger Station. J. Softw. 2013, 8, 101–109. [Google Scholar] [CrossRef] [Green Version]
  25. Yuan, H.; He, S.; Chun, Y.J. Analysis on the Main Factors Influencing the High-Speed Railway Passenger Flow. Adv. Mater. Res. 2014, 3149, 919–921. [Google Scholar] [CrossRef]
  26. Hassannayebi, E.; Zegordi, S.H.; Yaghini, M.; Amin-Naseri, M.R. Timetable optimization models and methods for minimizing passenger waiting time at public transit terminals. Transp. Plan. Technol. 2017, 40, 278–304. [Google Scholar] [CrossRef]
  27. Yao, J.L.; Zhao, S.Y. Computational modeling of the highest aggregation number in large HSR stations. J. Railw. Sci. Eng. 2019, 16, 34–41. [Google Scholar] [CrossRef]
  28. The Preliminary Design of Zhoukou East Station of Zheng the High-Speed Railway Is Scheduled to Start in September. Available online: https://henan.qq.com/a/20170706/009982.htm (accessed on 6 April 2017).
  29. Of the 10 Railway Stations with the Largest Construction Area in China, Nanjing South Railway Station Can only Be Ranked Second! Available online: https://new.qq.com/rain/a/20210820a00i9b00 (accessed on 20 August 2021).
  30. Xi’an North Railway Station Officially Opened on the 11th to Build Tang Feng Han Yun. Available online: https://news.qq.com/a/20110110/000020.htm (accessed on 10 January 2011).
  31. High-Speed Rail: The Five Largest High-Speed Railway Stations in China, the Second in Hefei South Railway Station. Available online: https://3g.163.com/dy/article/EJLNQDC30544518N.html (accessed on 9 April 2019).
  32. Ingvardson, J.B.; Nielsen, O.A.; Raveau, S.; Nielsen, B.F. Passenger arrival and waiting time distributions dependent on train service frequency and station characteristics: A smart card data analysis. Transp. Res. Part C 2018, 90, 292–306. [Google Scholar] [CrossRef] [Green Version]
  33. Marco, L.; Ulrich, W.; Andrew, N. Passenger arrival rates at public transport stations. In Proceedings of the Transp. Res. Board 86th Annual Meeting, Washington, DC, USA, 21–25 January 2007. [Google Scholar]
  34. Guo, S.; Yu, L.; Chen, X.M.; Zhang, Y. Modelling waiting time for passengers transferring from rail to buses. Transp. Plan. Technol. 2011, 34, 795–809. [Google Scholar] [CrossRef]
  35. Sun, X.K. Study on the Rule of Passenger Arrival at Railway Passenger Station; Southwest Jiaotong University: Chengdu, China, 2011; p. 79. [Google Scholar]
  36. Yang, X.; Ma, C.X.; Song, J.Y.; Liu, B. Analysis of the Rule for Passenger Waiting Time at Lanzhou Station. Procedia Soc. Behav. Sci. 2014, 138, 29–36. [Google Scholar] [CrossRef] [Green Version]
  37. Yao, J.L.; Mo, X. Study on the rule of passenger arrival and service of real-name ticket inspection in large-scale high speed railway station. Logist. Technol. 2018, 41, 66–70. [Google Scholar] [CrossRef]
  38. Wei, Z.; Wei, L.F.; Jin, W.; David, F. Complete Estimation Approach for Characterizing Passenger Travel Time Distributions at Rail Transit Stations. J. Transp. Eng. Part A Syst. 2020, 146, 04020050. [Google Scholar] [CrossRef]
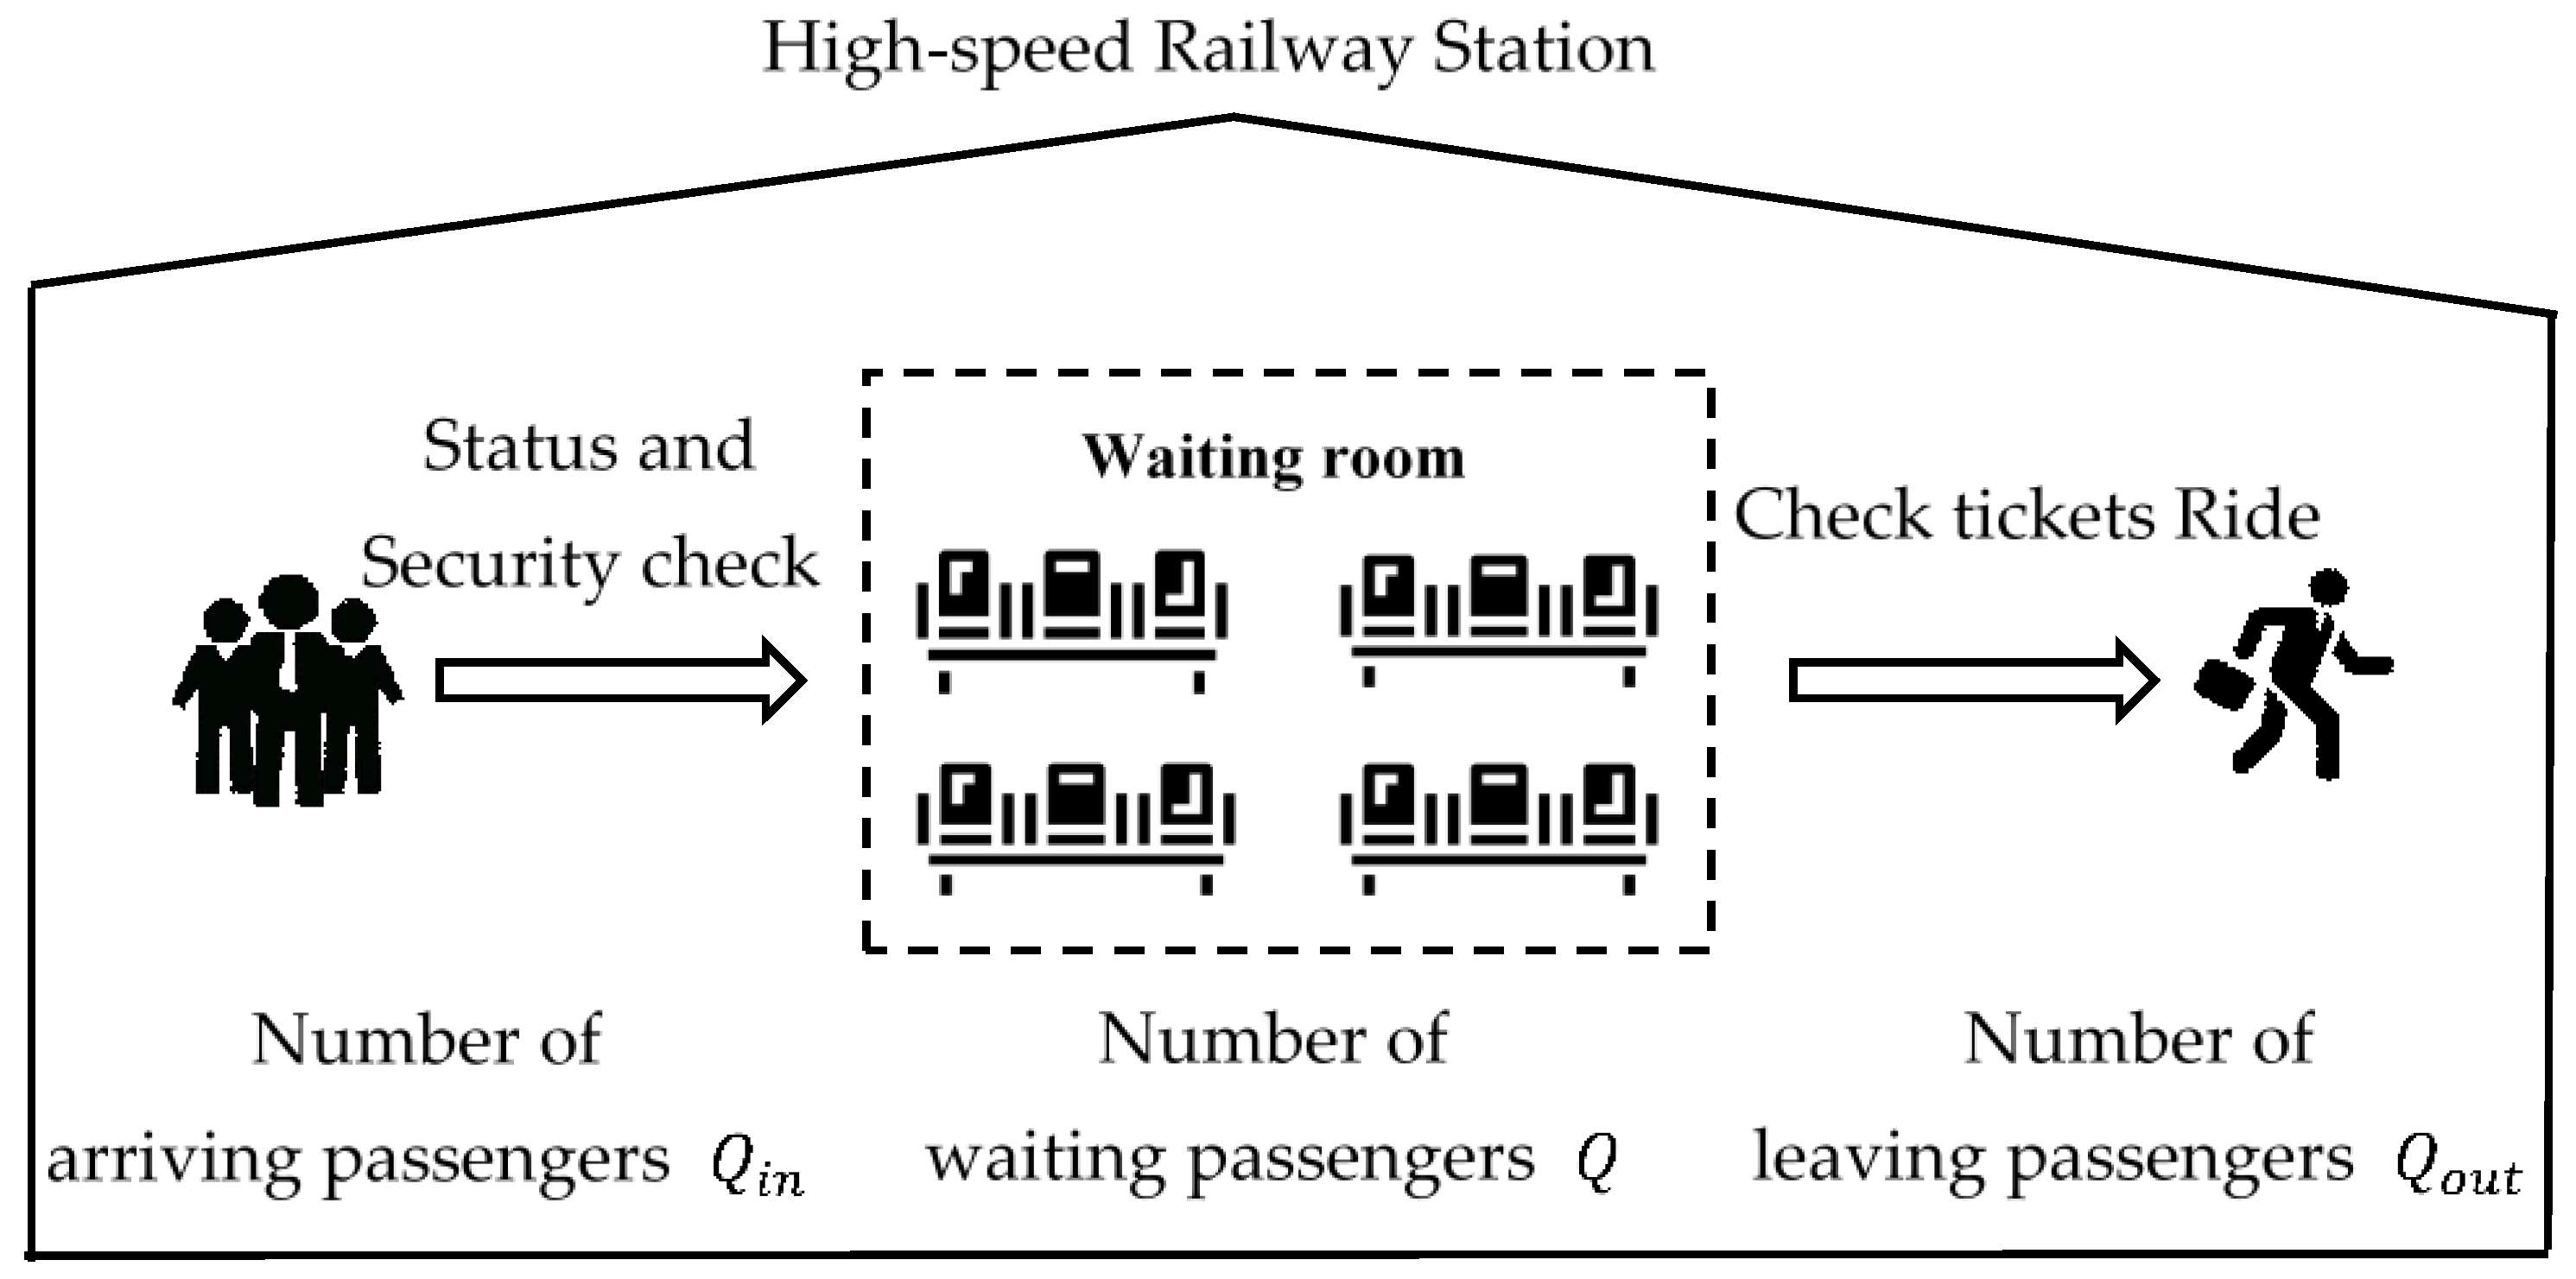
Figure 1. The changing process of passenger flow and the number of passengers spending time in the waiting room of a high-speed railway station.
Sustainability 14 01245 g001
Figure 2. Passenger travel time process.
Sustainability 14 01245 g002
Figure 3. Schedule of Changsha South railway station.
Sustainability 14 01245 g003
Figure 4. The number of passengers spending time in the waiting room.
Sustainability 14 01245 g004
Figure 5. Lengths of the early arrival times of passengers in different cities.
Sustainability 14 01245 g005
Figure 6. Schedule of high-speed trains during weekdays.
Sustainability 14 01245 g006
Figure 7. The number of passengers spending time in the station waiting room.
Sustainability 14 01245 g007
Figure 8. Schedule of high-speed railway stations during holidays.
Sustainability 14 01245 g008
Figure 9. The number of passengers spending time in the station waiting room.
Sustainability 14 01245 g009
Figure 10. The maximum number of passengers spending time in the waiting room in different periods.
Sustainability 14 01245 g010
Figure 11. The utilization rate of waiting capacity in station waiting rooms.
Sustainability 14 01245 g011
Figure 12. The number of passengers spending time in the station waiting room; (a) number of passengers spending time in the station waiting room during weekdays; (b) number of passengers spending time in the station waiting room during holidays.
Sustainability 14 01245 g012
Figure 13. Rate of reduction of the maximum number of passengers gathering at high-speed railway stations.
Sustainability 14 01245 g013
Table 1. Basic information of high-speed railway stations [28,29,30,31].
High-Speed Railway StationConstruction Area
(×104 m2)
Platform ScaleEffective Waiting Area
(×104 m2)
Zhoukou East Railway Station6.663 platforms, 8 lines0.29
Beijing South Railway Station42.0013 platforms, 24 lines1.69
Hefei South Railway Station49.0012 platforms, 26 lines1.53
Xi’an North Railway Station33.6618 platforms, 34 lines2.12
Table 2. The number of seating capacity of passenger train.
High-Speed Railway StationWeekdaysHolidays
Zhoukou East Railway Station228320
Beijing South Railway Station480720
Hefei South Railway Station253407
Xi’an North Railway Station320500
Table 3. Parameter values of probability density distribution function [13,37,38].
Typel (min)μσ
1[0,60]3.23690.2908
2[0,90]3.57690.3006
3[0,120]3.67420.3106
Table 4. The fitting curves of train departure frequency during weekdays.
High-Speed Railway StationTrain Departure FrequencyR2
Zhoukou East Railway Station f 1 ( k ) = 8 × 10 16 k 5 6 × 10 12 k 4 + 2 × 10 8 k 3 2 × 10 5 k 2 + 0.0086 k 1.506 0.75
Beijing South Railway Station f 2 ( k ) = 1 × 10 12 k 5 5 × 10 9 k 4 + 9 × 10 6 k 3 8.1 × 10 3 k 2 + 3.6197 k 610.75 0.80
Hefei South Railway Station f 3 ( k ) = 9 × 10 5 k 2 + 0.1583 k 42.358 0.85
Xi’an North Railway Station f 4 ( k ) = 3 × 10 6 k 5 2 × 10 4 k 4 + 4.4 × 10 3 k 3 0.049 × 10 3 k 2 + 0.287 k 0.2929 0.88
Table 5. The fitting curves of train departure frequency during holidays.
High-Speed Railway StationTrain Departure FrequencyR2
Zhoukou East Railway Station f 1 ( k ) = 2 × 10 15 k 5 9 × 10 12 k 4 + 2 × 10 8 k 3 2 × 10 5 k 2 + 0 . 0087 k 1.4854 0.80
Beijing South Railway Station f 2 ( k ) = 8 × 10 15 k 5 4 × 10 11 k 4 + 8 × 10 8 k 3 7 × 10 5 k 2 + 0.313 k 5.0453 0.87
Hefei South Railway Station f 3 ( k ) = 5 × 10 15 k 6 2 × 10 11 k 5 + 5 × 10 8 k 4 6 × 10 5 k 3 + 33.5 × 10 3 k 2 9.6999 k + 1093.1 0.95
Xi’an North Railway Station f 4 ( k ) = 1 × 10 14 k 5 5 × 10 11 k 4 + 9 × 10 8 k 3 8 × 10 5 k 2 + 0.0336 k 5.5031 0.92
Publisher’s Note: MDPI stays neutral with regard to jurisdictional claims in published maps and institutional affiliations.