Article

Influence of Urea on Organic Bulk Fertilizer of Spent Coffee Grounds and Green Algae Chlorella sp. Biomass

by
Dovilė Ragauskaitė
* and
Rasa Šlinkšienė
Department of Physical and Inorganic Chemistry, Kaunas University of Technology, LT-50254 Kaunas, Lithuania
*
Author to whom correspondence should be addressed.
Sustainability 2022, 14(3), 1261; https://doi.org/10.3390/su14031261
Submission received: 14 December 2021 / Revised: 18 January 2022 / Accepted: 19 January 2022 / Published: 23 January 2022

Abstract

:
To maintain high production and growing rates of plants, synthetically obtained fertilizers are commonly used. Excessive amounts of fertilizers damage the natural ecosystem and cause various environmental problems. In relation to the environment and its sustainability, another great environmental, economic, and social issue is food loss and waste. This paper aims to evaluate the impact of spent coffee grounds (SCG) on soil properties, rye growth, and their possibilities to be used as the biodegradable and organic material in the production of organic bulk fertilizer. This study demonstrated that spent coffee grounds contain primary nutrients; moreover, SCG could increase the content of soil organic matter. The addition of 4 wt% to 8 wt% SCG increased the number of spore-forming bacteria from <103 colony forming units/g soil (CFU/g soil) to 3 × 10⁴ CFU/g soil, along with nitrogen assimilating bacteria (plain soil resulted in 5.0 × 10⁵ CFU/g, and addition of SCG increased the value to 5.0 × 10⁷ CFU/g). Since spent coffee grounds have a relatively high porosity and absorbance (25.3 ± 3.4 wt% in a water vapor environment and 4.0 ± 0.6 wt% in the environment of saturated sodium nitrate solution), they could be used to reduce the amount of water required for irrigation. To fully exploit their nutritional value for plants, spent coffee grounds were mixed with green algae biomass along with urea, and, during the research, higher value products (organic bulk fertilizer) were obtained.

1. Introduction

The main purpose of agriculture is to provide people with necessary goods and commodities such as food and textiles. According to the data of the Population Reference Bureau (PRB), the world’s population is bound to reach nearly 10 billion by 2050. In the pursuit to meet the growing demand for food, countries still resort to cost-inefficient and also resource-intensive methods of farming, which require hard labor. To satisfy market needs, industrialized farming uses huge quantities of fertilizers and pesticides, and utilizes water resources in an unsustainable manner [1,2].
To maintain high rates of plant growth and production, synthetically obtained fertilizers are commonly used [3]. Nitrogen (N) and phosphorus (P) are some of the most essential nutrients for plants, and their deficiency limits the flourishing and growth of plants [4]. Studies have shown that plants are not able to uptake all the nutrients provided for them. In addition, about 50% of total nitrogen and up to 90% of phosphorus applied to the soil are inevitably lost due to volatilization, leaching, runoff, etc. [1,5,6]. In total, mineral fertilizer losses account for 50–70% [7]. High crop yield requires overfertilization, which poses a variety of environmental, economic, and social problems. Excessive amounts of fertilizers damage the natural ecosystem and cause various environmental problems [2,8].
Recently, agriculture has faced the major challenges of environment protection and sustainability [9]. Bio-fertilizers and environmentally-friendly fertilizers/slow-release fertilizers are some of the latest concepts that have been introduced into the field of agriculture [2,9,10]. Bio-fertilizers were defined in 2005 by Fuentes-Ramirez and Caballero-Mellado as “a product that contains living microorganisms, which exert direct or indirect beneficial effects on plant growth and crop yield through different mechanisms” [11,12]. Chitosan, polysaccharides, and other agricultural residues are listed under the definition of environmentally-friendly fertilizers (or enhanced efficiency fertilizers) [13,14,15,16]. These compounds and materials are commonly used to coat fertilizers to reduce their dissolution rate and meet the crop nutrient demand throughout the season [15,17]. According to Harza (2014), the use of enhanced efficiency fertilizers decreases the fertilizer application rate by 10–40% and could possibly produce the same crop yield compared to mineral fertilizers, involving savings in the spread costs [3,17,18].
Food loss and waste is another great environmental, economic, and social issue, related to the environment and its sustainability. According to The Food and Agriculture Organization of the United Nations (FAO) the term food wastage is a general convention that encompasses all the food that is lost and wasted in the food supply chain (FSC) [19].
Coffee is one of the most traded agricultural commodities in the world [20]. The two main cultivated species are Coffea arabica L. and Coffea canephora Pierre ex A. Froehner. In the international market, Coffea arabica L. beans account for 70% of total sales [21,22]. According to the International Coffee Organization (ICO), more than 10 billion kilograms of coffee were consumed worldwide between 2019 and 2020 [23]. Due to its high consumption, the coffee industry generates a large amount of waste [24].
This article focuses on the solid residue left after a pressure method used to prepare espresso coffee. The residue is referred to as spent coffee grounds. During the preparation of ready-to-drink coffee, 1 g of ground coffee on average produces 0.9 g of SCG [25]. Due to the presence of hazardous organic compounds, the spent coffee grounds pose a great risk to the environment [24,26]. There are several organic pollutants such as caffeine, polyphenols, chlorogenic acid, and tannin compounds that are left after high pressure extraction [27,28]. Moreover, a big hazard lies behind the large amounts of discarded SCG in landfills. The putrefaction of SCG demands a large amount of oxygen [29]. The most common way of utilizing spent coffee grounds is by using them as fuel. The generated heat value of dry spent coffee grounds is 24,912.80 kJ/kg, while wood produces 22,781.00 kJ/kg [30,31]. On the other hand, to obtain fuel from SCG, they have to be dried out to remove the moisture content, and this process generates additional costs. Recent studies have shown that SCG could also be applied in agriculture as an alternative organic fertilizer that improves the physical and chemical properties of the soil and promotes plant growth [32,33]. To fully exploit their nutritional value for plants, spent coffee grounds could be composted or mixed with other environmentally friendly/renewable materials such as green algae Chlorella sp. biomass (GACh). Our chemical analysis studies have shown that GACh biomass contains essential plant nutrients (3.50 wt% (N); 2.10 wt% (P2O5); 0.50 wt% (K2O)) together with secondary nutrients and trace elements (Fe, Mn, Cu, Zn). It is worth mentioning that GACh does not contain any heavy metals. Additionally, other researchers have found that green algae biomass contains amino acids and various biologically active substances, which promote plant growth. Moreover, GACh cultivation requires CO2, which is another great advantage of green algae usage [34].
This paper aims to evaluate the impact of spent coffee grounds on soil properties, rye growth, along with their possibilities to be used as the biodegradable and organic material in the production of organic bulk fertilizer.

2. Materials and Methods

2.1. Preparation of Collected Raw Materials

Spent coffee grounds is a solid material of dark color, obtained after the process of coffee ground extraction in commercial espresso machines, using high-pressure vapors. SCG, kindly supplied by cafés located in Kaunas, Lithuania, were used for this research. The moisture content for each batch collected was determined with a KERN MLS 50-3HA160N (KERN & Sohn GmbH, Balingen Germany) electronic moisture analyzer. To perform chemical and instrumental analysis, one part of the collected SCG was separated and placed in a drying oven for 2 days or until a constant weight was reached (the temperature in the oven was set at 60 °C). Dried SCG has longer storage time and the drying process helps to prevent various undesirable biological changes. To carry out the above-mentioned studies, particles of dried SCG, ≤2 mm in diameter, were used. Another part of the collected SCG was used for the granulation process. Thermally untreated spent coffee grounds, left at ambient temperature and humidity, tend to rot. To maintain the moisture in the SCG and extend their period of suitability, collected SCG were stored in a hermetic plastic container in the refrigerator (at 7.8 ± 1.2 °C temperature) until needed. To ensure that the moisture content in SCG did not decrease during the storage, it was measured before every granulation process. Another material used for this research was the green algae Chlorella sp. cultivated at the Agriculture Academy at Vytautas Magnus University. Algae biomass was produced in a tubular reactor illuminated by fluorescent lamps of cool white light, under ambient temperature conditions. The nutrient solution for algae cultivation consisted of a landfill leachate, BG-11 medium, and technical glycerol. The initial moisture of the algae was determined using a KERN MLS 50-3HA160N electronic moisture analyzer.

2.2. Determination of Organic Matter Content

This analysis was performed according to the modified LST EN 13039:2012 standard. The analyzed samples were dried, weighed with an accuracy of ±0.001 g and reduced to ash at 900 °C in a muffle furnace. The amount of organic matter (or ash) in the samples was calculated from the weight loss [35].

2.3. Concentration of Humic Substances

The modified Nikitin–Turin method was used to determine the concentration of humic substances in SCG, which are soluble in 0.1 M NaOH solution. During the analysis, the absorbance was measured at 590 nm using a PG Instruments Limited T70/T80 UV–VIS (PG Instruments Limited, Lutterworth, UK) spectrophotometer and 10 mm path optical glass cuvettes. The standard stock solution was prepared by diluting 2.5 g of D-glucose in 1 dm3 distilled water (this refers to 1 mgC/cm3 concentration solution). Following this, a stock solution was used to make a dilution series for a calibration curve, and all samples were analyzed in triplicate [36].

2.4. Impact of Spent Coffee Grounds on Rye (Secale cereale L.) Growth

To perform the evaluation study, Secale cereale L. was grown in the laboratory. A rye growing medium was prepared by mixing topsoil and SCG. Four growing media of different compositions were prepared, containing 4 wt%, 8 wt%, 12 wt%, and 16 wt% of SCG, respectively. In parallel, a blank sample (control) was composed without the addition of SCG. Each sample was prepared in triplicate, and the experiment was repeated twice at different times. To conduct the experiment, a total of 135 rye grains was swollen in water for 2–3 days and planted (27 grains were planted in each germination container filled with growing medium of different composition). The rye samples were grown for 12 days under the following environmental conditions: 22.6 ± 0.8 °C temperature and 29.5 ± 1.8% humidity. Such a period was enough for the rye to start turning yellow. The watering frequency was visually determined; thereby, every 3 to 5 days, 10 cm3 of distilled water was used to water the plants.

2.5. Hygroscopicity of Spent Coffee Grounds

The study was performed by placing the samples in a desiccator of two different environments: saturated water vapor and saturated sodium nitrite solution. During the experiment, the temperature in the desiccator filled with water was 19.5 ± 0.2 °C, and the relative humidity was 94.5 ± 1.6%. The temperature in the desiccator filled with saturated sodium nitrite solution was 20.8 ± 1.6 °C, with a humidity of 60.4 ± 1.0%. To determine the amount of moisture absorbed, the analyzed samples were weighed daily until constant weight, or until various changes began to occur in the samples (mold, pellet swelling, etc.). Every test was performed in duplicate.

2.6. Count of Soil Microorganisms

The colony forming units (CFU) of microorganisms were counted in soil samples using the dilution plate technique. The samples (four mixtures of topsoil and SCG of different compositions as previously described) were placed into 90 cm3 of sterile saline solution of 8.5 wt% concentration. Obtained mixtures were stirred for 10 min and then allowed to settle down. After diluting the samples 10 times, an aliquot of 0.0001 dm3 solution was seeded superficially on the medium in a sterile 90 mm diameter Petri dishes and spread with a Drigalski spatula. Plates were incubated at a temperature of 30 °C for 36 h. Results of colony forming units are expressed as the arithmetic mean of the three measurements.

2.7. Color of Spent Coffee Grounds and Soil Samples

The color of the tested samples was measured with a portable Konica Minolta CR-400 (Konica Minolta, Tokyo, Japan) chroma meter, using the CIELAB system. The samples (SCG and soil mixtures) were kept in ambient conditions for 12 days. Measurements were performed on the surface of the tested samples at 4–5 different locations. In addition, other characteristics of color, such as hue and chroma, were calculated with the following formulas:
h = arctan (b*/a*)
C* = ((a*)2 + (b*)2)1/2
where, a*—redness, b*—yellowness, h—hue, C—chroma.

2.8. Granulation of Fertilizers

A laboratory drum granulator–dryer was used to granulate SCG with additives [37]. In this research, the laboratory drum granulator used is a prototype of the granulator that is used in the production of commercial bulk fertilizers. The ratio of length and width of the drum granulator is directly proportional to the commercial one. The granulation process was carried out according to the following conditions: drum tilt angle was 3°, rotation speed was 26 rpm/min, operating temperature ranged from 62.1 ± 1.4 to 74.1 ± 2.0 °C, granulation cycle time was 5–6 min. Such temperature range was chosen considering the thermal stability of the raw materials and in order to prevent urea decomposition.

2.9. Size Distribution of Raw Material and Granular Product Particles

The particle distribution by diameter was determined using a RETSCH woven wire sieves with aperture sizes ranging from 0.2 mm to 7.0 mm. Each fraction of different diameter granules was collected, weighed and expressed as a percentage by mass.

2.10. pH Determination

According to the ISO 10390:2005 standard, the pH values of the suspension composed of SCG and soil mixture (ratio 1:5 v/v) were determined in a 1 mol/dm3 KCl solution. To measure the pH values of the granular product, the granules were dissolved in water (10 wt% concentration solution). Furthermore, every test sample was prepared in duplicate and a Whatman Grade 589/3, blue ribbon filter was used to filter the obtained suspensions. Following that, the pH values were determined with a HANNA instruments pH 211 microprocessor (HANNA Instruments, Woonsocket, RI, USA) pH meter [38].

2.11. Crushing Strength of Granules

Commercial fraction granules of 2.0–3.15 mm and 3.15–4.0 mm in diameter were used for the crushing strength measurements. It is crucial to obtain the appropriate granule strength to maintain its shape and form throughout all handling procedures (from various manufacturing stages to application). To perform this study, at least 20 granules similar in size and shape were selected from each fraction. A custom-made ultimate tensile machine ИПГ-2 (АО “УНИХИМ с ОЗ“, Yekaterinburg, Russia) was used during the experiment [39]. The crushing strength is defined as the amount of stress applied to the granule until the first crack. Results were expressed as N/granule.

2.12. Loose Bulk Density

The bulk density was determined according to the gravimetric method by pouring the material into a graduated cylinder of a certain volume, described in the ISO 7837:2001 standard. To determine the density, first the empty cylinder and then the cylinder containing the granules was weighed. The calculated mass difference is equal to the mass of freely poured material per volume unit [40]. Each measurement was repeated twice.

2.13. Chemical Analysis

The concentration of primary plant nutrients (N, P, and K) in the collected topsoil and granular fertilizers was determined using the following methods. Each sample was analyzed three or more times. The nitrogen concentration was determined according to the Kjeldahl method. Distillation was performed with a Gerhardt VAPODEST 45s (C. Gerhardt GmbH & Co. KG, Koenigswinter, Germany) distiller. The yellow color spectrophotometric method was used to determine the phosphorus content in the materials. The absorbance was measured with a PG Instruments Limited T70/T80 UV–VIS (PG Instruments Limited, Lutterworth, UK) spectrophotometer, using standard rectangular 10 mm path optical glass cuvettes. The standard stock solution was prepared by dissolving 1.9175 g of KH2PO4 in concentrated H2SO4 and then diluting it to 1 dm3 with distilled water. Samples of different dilutions of stock solution were used to plot the calibration curve. Absorbance was measured against the blank, at 450 nm [41]. Flame photometry was used to determine the potassium concentration in the tested samples. A JENWAY Model PFP7 (Cole-Parmer Ltd., Staffordshire, UK) flame photometer was used for this study. An aqueous 0.1 mg/cm3 concentration solution of potassium chloride was used as a standard stock solution. The calibration curve was plotted by the same previously described technique. Micronutrients were determined by atomic absorption spectroscopy (AAS). Analysis was performed with a Perkin Elmer AANALYST 400 (PerkinElmer, Waltham, USA) spectrophotometer with a measurement accuracy of a ±0.01 mg/cm3.

2.14. Nutrient Leaching Study

The collected layer of topsoil was used to perform a nutrient leaching test. In total, 40 g of air-dried soil was placed in the glass funnel filter along with ±2 g of each granular fertilizer. Each sample was prepared in duplicate. Before the test, each filter was carefully washed and then dried in the drying oven. The water permeability of the filter was also taken into account.
To perform the leaching test, samples were irrigated with 50 cm3 of distilled water. The run-off solution was diluted in the volumetric flask to the desired volume and then taken for further analysis. The second irrigation was carried out after the test sample dried out completely. The test was continued until the collected solution had no traces of primary nutrients. Solutions were analyzed no less than three times for every nutrient, following the previously described chemical analysis methods.

2.15. Instrumental Analysis

2.15.1. Simultaneous Thermal Analysis

The analysis was performed using a Linseis STA PT1600 (Linseis Messgeraete GmbH, Selb, Germany) device (at measurement accuracy of ±1%) in the temperature range of 30–800 °C. The test sample was placed in a platinum crucible. During the test, the following parameters were maintained: a temperature increase rate of 10 °C/min; the atmosphere in the furnace was nitrogen (20 cm3/min).

2.15.2. Fourier Transform Infrared Spectroscopy (FTIR)

The FTIR spectrum of the analyzed materials was recorded in the range of 400–4000 cm−1 with a Perkin Elmer SPECTRUM GX 2000 (PerkinElmer, Waltham, MA, USA) spectrometer. The pellet for analysis was made of an extruded mixture of KBr and the test sample. The KBr transmittance spectra was used as a blank.

2.15.3. Optical Microscopy

A Zeiss Discovery V12 stereo optical microscope (ZEISS, Oberkochen, Germany) with a PlanApoS 1.5× main objective was used to obtain images of granular fertilizer at a 30× zoom level. In this test, to analyze the inner structure, granules were cut in half. Images of the granule surface were also presented.

2.16. Statistical Analysis

The results were expressed as the arithmetic mean of no less than two measurements ± standard deviation (SD). The results were calculated with 95% probability. In all cases, the significance level was p ≤ 0.05. One-way analysis of variance (ANOVA) was used to evaluate the differences of the means between groups.

3. Results

3.1. Chemical Composition of Spent Coffee Grounds

To use spent coffee grounds as a soil improving or plant growth-promoting substance, the concentration of humic substances in the SCG was determined. To perform the analysis, dried SCG with 5.83 ± 0.04 wt% moisture content was used. The study showed that the concentration of humic substances, soluble in 0.1 M sodium hydroxide solution, was equal to 2.00 ± 0.09 wt%. According to the studies presented by the other researchers, low concentrations of humic substances (that are soluble in alkaline solution) could be explained by the fact that during the roasting process of coffee beans, carbon is eliminated as the oxide or fully carbonized to a form that is not decomposable [42,43].
During this research, the organic matter content in SCG was determined. The results showed that the total organic matter content in the SCG, determined by the dry burning method, was equal to 98.66 ± 0.48 wt%. Similar results were presented by Cruz-Lopes et al. [44].
Our previous studies have shown that spent coffee grounds contain primary plant nutrients (N, P, K). The nitrogen concentration in the spent coffee grounds varied in the range of 1.94 ± 0.30 wt%. The concentration of phosphorus (calculated to P2O5) in SCG was insignificant (0.46 ± 0.20 wt%). In addition, it is to be noted that all phosphorus in SCG was found to be water soluble. The concentration of potassium (soluble in mineral acid solution) was equal to 2.32 ± 0.36 wt% (calculated to K2O), and 0.55 ± 0.07 wt% easily absorbed by plants (water soluble).
According to Regulation (EU) 2019/1009 of the European Parliament and of the Council of 5 June 2019, it could be stated that the concentrations of the primary plant nutrients are high enough for the spent coffee grounds to be classified as organic fertilizers.
No less important are the secondary plant nutrients: calcium, magnesium, and sulfur. The concentration of magnesium oxide determined in all tested samples was higher than that of calcium oxide. The magnesium oxide concentration range was 0.55 ± 0.08 wt%. The determined concentration of calcium oxide was two times lower than that of magnesium and resulted in 0.22 ± 0.02 wt%. Along with that, it was discovered that SCG contain micronutrients (MN), such as Fe, Mn, Cu, Cr, and Zn.

3.2. Agronomic Evaluation of Spent Coffee Grounds on Rye Growth

For this in vitro study, topsoil samples were collected in Kaunas, Lithuania (arable layer, 0–20 cm). The distribution of the used soil particles by diameter is presented in Table 1.
Before the study, the physical and chemical properties of the collected topsoil were determined, and also chemical composition analysis was performed. The results showed that the moisture of air-dried soil samples was 2.26 ± 0.15 wt%, and the pH value of aqueous 10% v/v solutions resulted in 6.90 ± 0.00 and 7.62 ± 0.06 in 1 M KCl. Chemical composition analysis showed that the collected soil sample was low in primary nutrients (0.29 ± 0.05 wt% N, 0.02 ± 0.003 wt% P2O5, 0.03 ± 0.002 wt% K
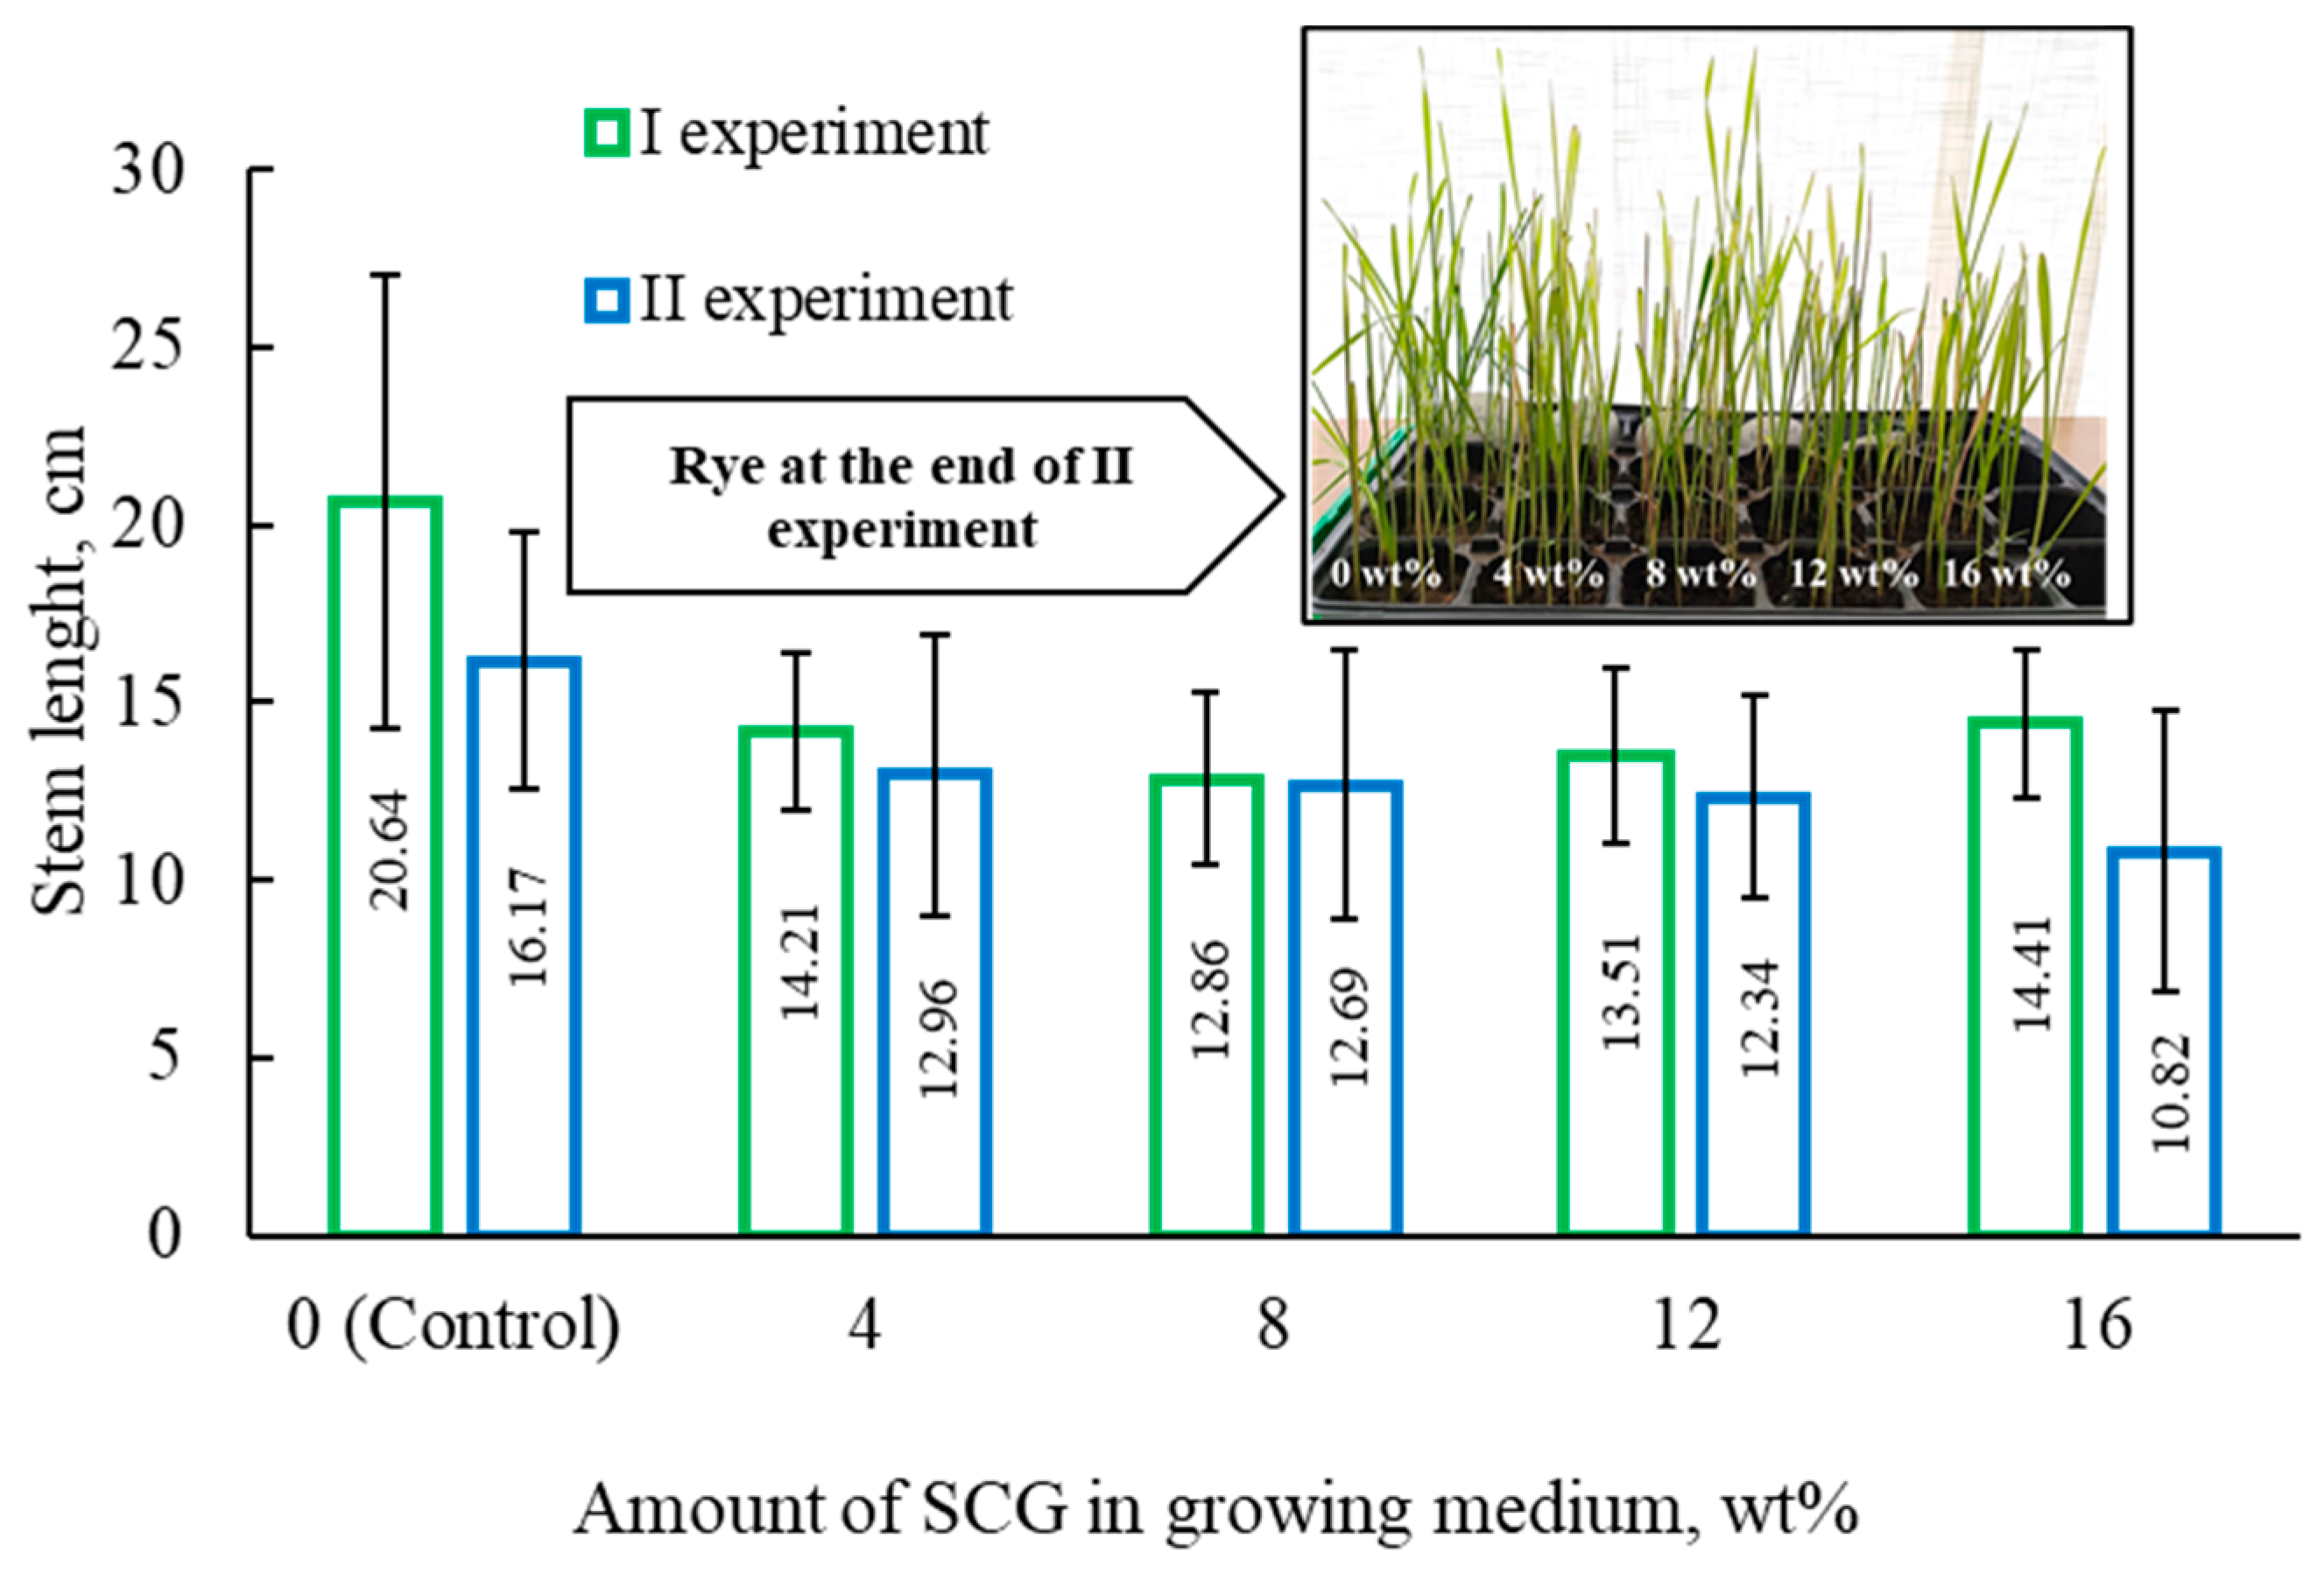
2O). It is to be mentioned that the low concentrations of nutrients in the topsoil allowed us to determine the impact of SCG on rye growth more accurately. After 12 days, the grown rye was cut. To determine the impact of the SCG additive, each rye plant was weighed, and the length of each stem was measured (Figure 1). For complete determination, the number of leaves on each stem was counted. To determine the ash content, rye plants were burned in a muffle furnace.
As can be seen from the results (Table 2), the addition of spent coffee grounds had a negative impact on rye growth. The planned comparison of two independent experiments revealed that the stem weight, number of leaves, and stem length of the control samples were higher than those grown in a medium that contained SCG.
After analyzing the data obtained, it could be stated that increasing the amount of SCG in the mixture (from 4 wt% to 16 wt%) changed the results very insignificantly. During the experiment, rye was reduced to ash. From the obtained results, it is clear that SCG interfered and did not allow for the accumulation of nutrients. The mineral content in the control samples was higher compared to that of the samples grown in mediums containing SCG. The higher concentration of SCG resulted in less mineral content in the tested samples. These results tie well with the findings reported by Gomez et al. Researchers performed an evaluation study on the impact of fresh and composted coffee grounds on lettuce (Lactuca sativa L.) growth [45]. The conducted experiment demonstrated that a small amount of fresh SCG improved lettuce growth compared to the control sample (plain soil). The same result was observed with composted SCG. Optimal results were achieved when fresh SCG accounted for 2.5–5.0% v/v in the growing mixture. Higher concentrations of spent coffee grounds had a notable negative impact on lettuce growth, due to increased concentrations of phytotoxic elements and reduced nutrient uptake. In the research paper by Ronga et al., evaluation studies of composted spent coffee grounds as an alternative component of a growing medium were conducted [46]. The presented results suggested that a moderate amount of composted SCG in a growing medium enhanced plant (basil and tomatoes) growth. Summarizing the results of the in vitro study, it could be concluded that the addition of SCG (under the studied conditions) had a negative impact on the growth of Secale cereale L. Nevertheless, it is very important to highlight that during the experiment, it was noticed that water needed for irrigation was inversely proportional to the amount of SCG in the mixture. Mixtures with higher quantity of SCG required less frequent watering.

3.3. Hygroscopicity of Spent Coffee Grounds

Spent coffee grounds have a relatively high porosity and absorption capacity [47,48]. During rye cultivation, it was observed that a higher amount of SCG additive in the germination containers resulted in less frequent watering. To prove this statement, a study of the hygroscopicity of spent coffee grounds was performed. The obtained results showed that the maximum amount of water, absorbed by the SCG, was reached within 9 days, and after that samples started to rot. The maximum water vapor absorption of SCG was equal to 25.3 ± 3.4 wt% (Figure 2).
To simulate environmental conditions (according to the ASHRAE 55-2017 and 62.1-2016 standards, respectively, the conventional temperature is approximately 20 °C and the relative humidity is less than 65%), the hygroscopicity of the SCG was also determined by storing test samples in an environment of saturated sodium nitrite solution vapor. As can be seen from the results, the amount of moisture absorbed was significantly lower than in a saturated water vapor environment, and it resulted in 4.0 ± 0.6 wt%.

3.4. Impact of Spent Coffee Grounds on the Counts of Microorganisms in Soil

This study was performed to evaluate the microbiological effect of the SCG additive on the soil. Mixtures of SCG and topsoil of previously-described compositions were used for the experiment (Table 3). The mixtures were left for 10 days at a temperature of 22.6 ± 0.8 °C and 29.5 ± 1.8% humidity. Each sample was irrigated with 10 cm3 of distilled water. The watering frequency was determined depending on the moisture content in the germination containers, taking into account the temperature and humidity of the environment.
The results of the effect of SCG on soil microorganisms showed that the addition of 4 wt% to 8 wt% of SCG increased the number of spore-forming bacteria from <103 CFU/g soil to 3 × 10⁴ CFU/g soil. The opposite effect was observed by further increasing the amount of SCG in the mixture. This could be due to the increased amount of hazardous organic compounds that are left in SCG after high pressure extraction. The performed study did not show any significant differences in the count of actinomycetes in the soil. Nevertheless, total bacteria count in the mixtures with SCG was slightly higher than in a control sample. It is very important to mention that the number of mineral nitrogen assimilating bacteria in plain soil resulted in 5.0 × 10⁵ CFU/g, and by addition of SCG, it increased to 5.0 × 10⁷ CFU/g. Overall, these findings are in agreement with the findings reported by other researchers. Gryndler et al. found that in soils treated with organic materials, counts of CFU increased significantly. The opposite effect was observed with actinomycetes [49].

3.5. Color of Spent Coffee Grounds and Soil Samples

Soil color can indicate the mineral and organic content in the soil along with the physical, chemical, and biological properties. Recent studies introduced a correlation between the color of soil and the amount of organic matter in it. To quickly determine the organic content in the tested soil, the CIE-L*a*b* system defined by the International Commission on Illumination was used. In this universal color space in Cartesian coordinates, L* indicates the lightness, a* the redness, and b* the yellowness. The axes of a* and b* are boundless, while 0 on the L axis defines the color black, and 100 stands for white [50]. This study was performed to determine any changes in soil color by adding different amounts of SCG.
The results presented in Table 4 show that collected topsoil was lighter (39.55 ± 1.78) compared to the SCG (31.30 ± 0.88), and that by adding SCG to the growing medium, the lightness of the test samples decreased from 39.55 ± 1.78 to 35.79 ± 0.12. The highest value of the red component was observed in SCG as well, and this value slightly increased in the mixtures with more SCG. The b* parameter in the performed study was statistically insignificant. The spent coffee grounds resulted in less yellowness than the topsoil, but the addition of SCG to the growing medium did not show a distinct path or repeatability. Since hue (h) was used to distinguish one color from another, the obtained results indicated that the addition of a different amount of SCG had no significant impact, while the value of C (chroma) increased and was directly proportional to the added amount.

3.6. Granulation of Spent Coffee Grounds with Green Algae Chlorella sp. Biomass and Urea

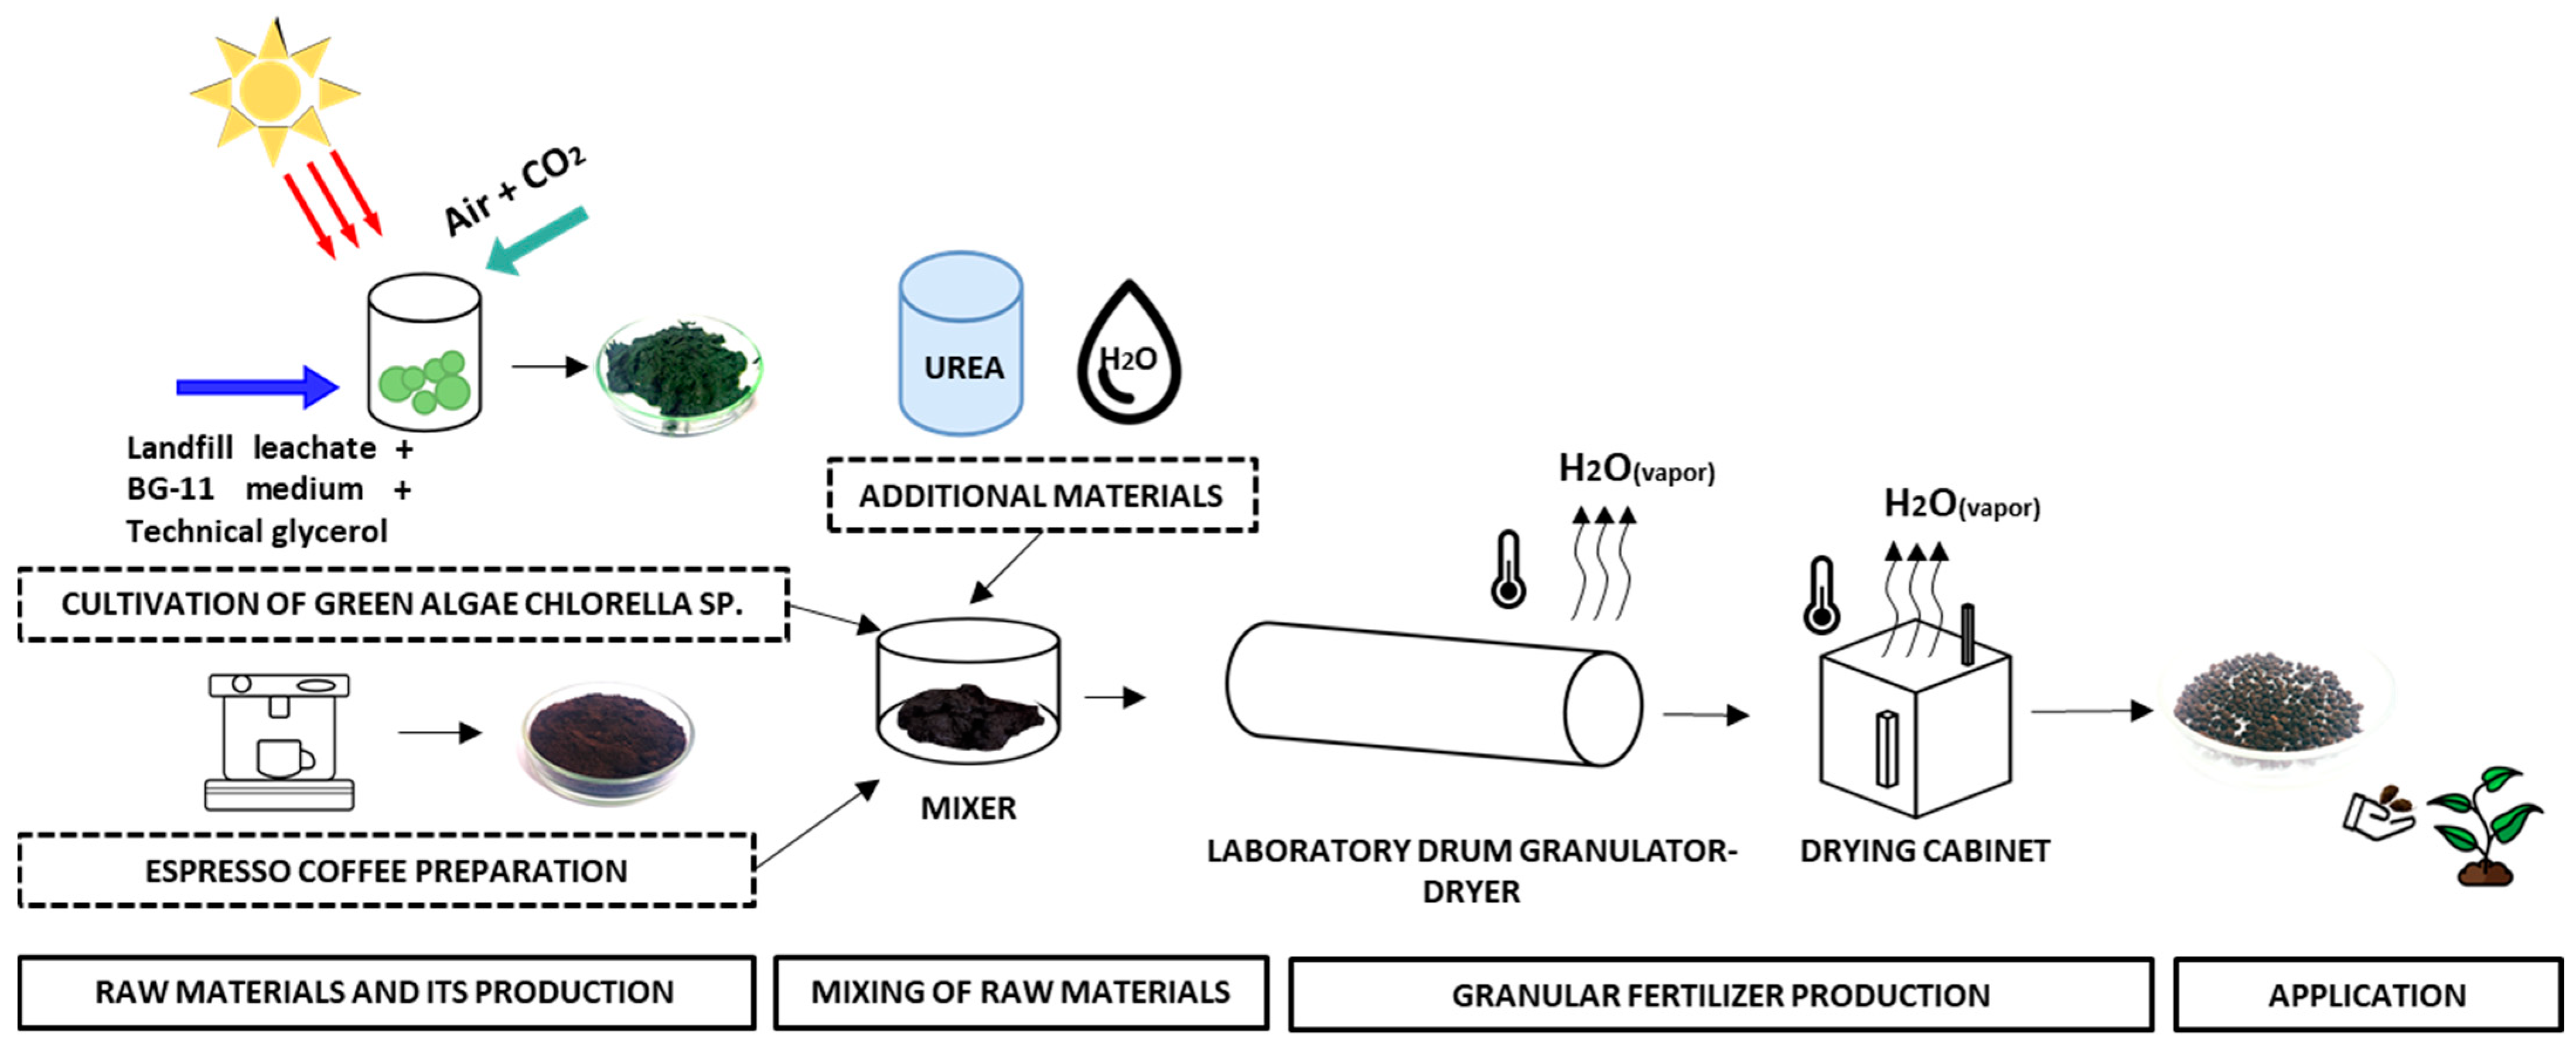
Spent coffee grounds were mixed with green algae Chlorella sp. biomass, a renewable and environmentally-friendly material, to obtain environmentally-friendly organic bulk fertilizers. The direct application of a mixture with such a composition is very complicated, due to high moisture content of raw materials. Initial moisture of GACh was equal to 84.58 ± 1.60 wt%, and for SCG it resulted in 53.95 ± 1.27 wt%. After a short period of time, under ambient temperature and humidity conditions, mixed components start to rot, and because of this, that kind of mixture cannot be stored for a long time and used when needed. Another limiting factor is the uniform distribution of the fertilizing mixture on the soil surface.
For this reason, to prolong the storage time of the fertilizing mixture and to avoid the limitations mentioned, the mixture was granulated with a laboratory drum granulator. Granulation is the key process in the fertilizer industry. Granulated fertilizers are easier to store, transfer, and handle. Moreover, they can be stored for a long period of time under ambient conditions. The principal scheme of laboratory fertilizer production using the described raw materials is presented in Figure 3.
Two mixtures with different compositions were granulated during this research. To obtain the first, SCG were mixed with GACh (ratio 2:1 w/w). The mixture of the second composition was prepared by adding a 10 wt% urea additive to the previous one. To determine the grade of fertilizers with such composition, a chemical analysis was performed (
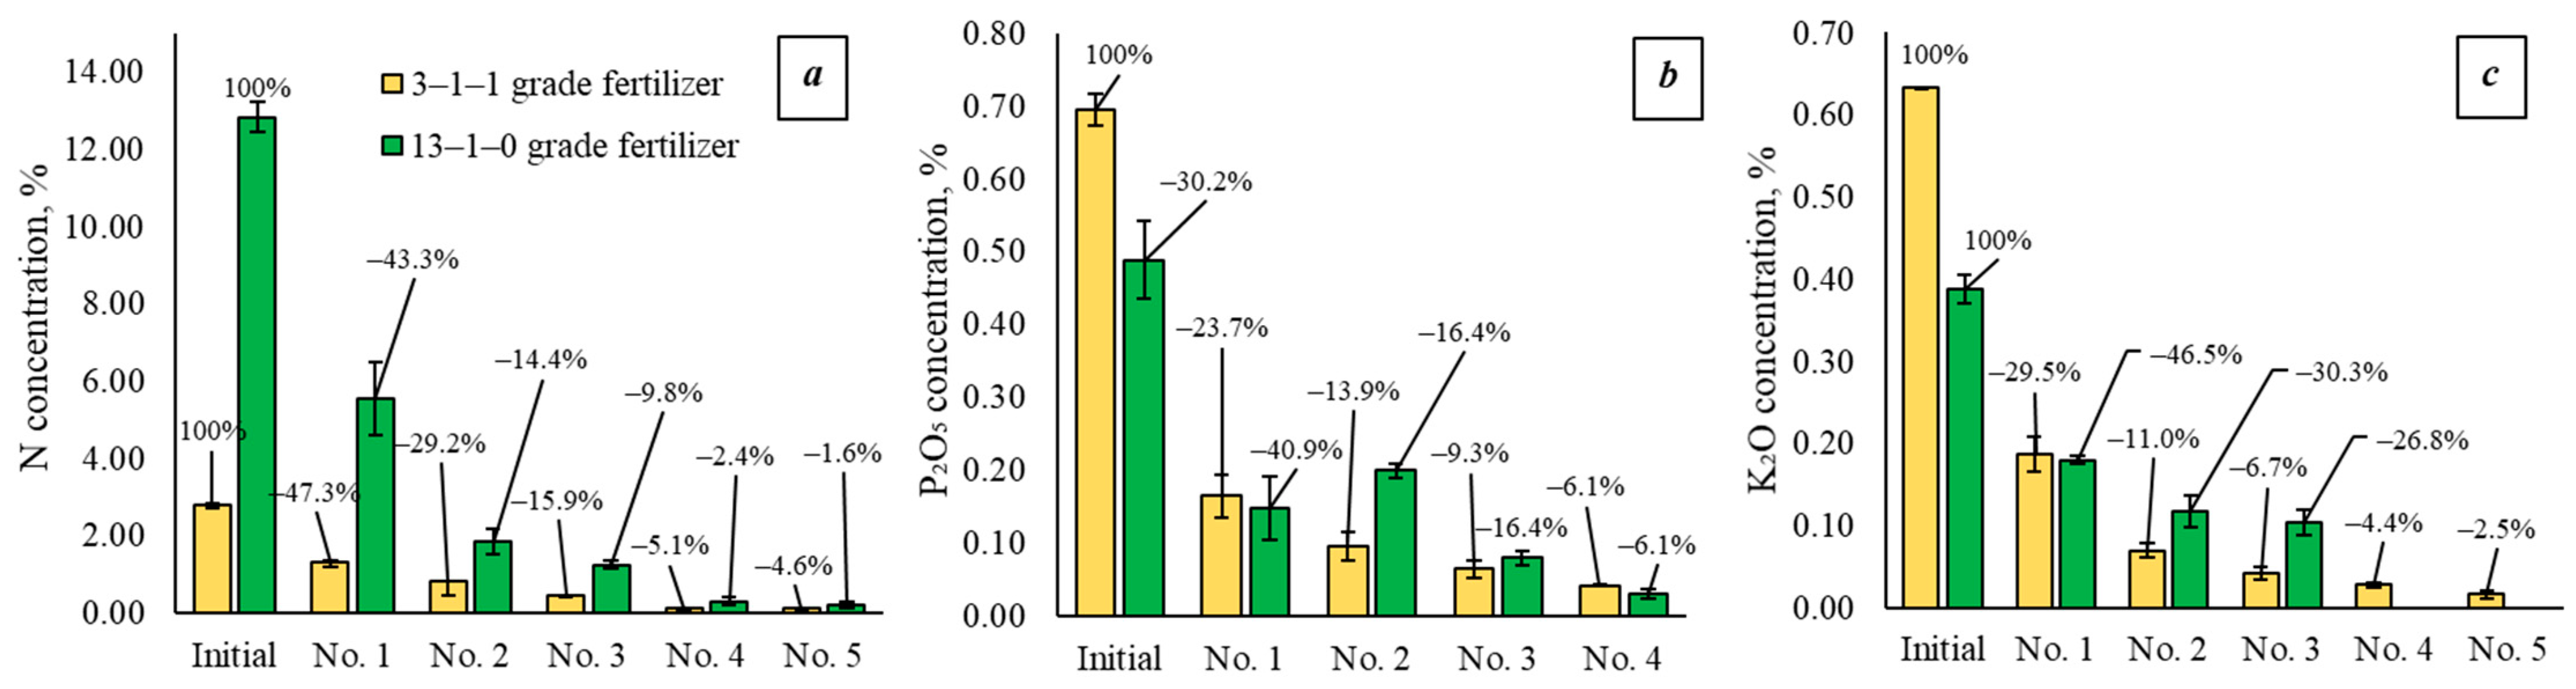
Table 5). The most abundant primary nutrient in the SCG and GACh mixture was nitrogen, and its concentration was equal to 2.82 ± 0.09 wt%. By adding urea, the concentration increased to 12.85 ± 0.09 wt% (N). Chemical analysis showed that the SCG and GACh mixture contained 0.70 ± 0.02 wt% phosphorus and 0.63 ± 0.02 wt% potassium. By adding urea, the concentration of these primary nutrients decreased to 0.49 ± 0.05 wt% and 0.39 ± 0.00 wt%, respectively. After testing the chemical composition of both mixtures, it was possible to determine the grade of fertilizers. For mixture with the first composition, it was set to 3–1–1+MN and 13–1–0+MN for the second one (Table 5).
Prepared mixtures of raw materials were granulated using a laboratory drum granulator. The raw material granulation was performed at a low temperature range (62.1 ± 1.4–74.1 ± 2.0 °C) due to the thermal stability of urea. After granulation, granules were dried in the drying oven until a constant weight was reached. Once the finished product was dried, the granulometric composition was determined (Figure 4). The initial moisture content of the SCG and GACh mixture was equal to 61.3 wt%, and small diameter granules (less than 2 mm) were dominant in the product. Moisture content in the following mixtures was increased by adding water. Four mixtures of different moisture contents were prepared, namely 61.8 wt%, 62.9 wt%, 63.6 wt%, and 66.9 wt%, respectively. In this way, the influence of the moisture content on the diameter of the granules was determined.
The results showed that to obtain the maximum quantity of commercial fraction (composed of 2.0–3.15 mm and 3.15–4.0 mm diameter granules), the optimal moisture content of the raw material mixture was equal to 66.9 wt%. By further increasing the moisture content in the mixture, the diameter of the formed granules was greater than 5 mm. During the granulation process of the SCG+GACh+urea mixture, the same process parameters were maintained. Five different mixtures of SCG, GACh, and urea were prepared with a moisture content of 56.6 wt%, 57.1 wt%, 57.3 wt%, 57.6 wt%, and 58.0 wt%, respectively. The moisture content of the mixture with no added water was equal to 56.6 wt%. After granulating the mixture of such initial moisture, fine particles (less than 2.0 mm) were predominant in the resulting product. A slight increase of the added water amount resulted in larger diameter of granules. From the obtained results it could be claimed that the maximum quantity of commercial fraction was obtained by granulating the mixture with 57.6 wt% moisture. Granulation of a 58.0 wt% moisture mixture resulted in granules larger than 5 mm. Images of the granular fertilizers obtained are presented in Figure 5. As can be seen from the figure, granules of both compositions were similar to each other, and the form was close to a sphere shape. The shape of the granules has a huge impact on crushing strength and loose bulk density. Moreover, shape influences storage, transportation, and distribution of the fertilizers. Granules containing urea were paler, due to recrystallization of urea on the surfaces of the granules (Figure 5g). There were no significant differences in the inside of the granules, since almost all urea was recrystallized on the surface (Figure 5d,h).
To summarize the data of granulometric composition, it could be stated that by increasing the moisture content in the mixture of raw materials, the diameter of granules also increased. The obtained results highlight that even a small change in the moisture content of the raw materials has a huge impact on the granulometric composition of the finished product. Furthermore, it was observed that by adding urea, less moisture was needed for granules to form. This last statement fully complies with one of the key principles of granulation, which states that using such hygroscopic salts (i.e., urea) makes it easier for crystallization bridges to form and facilitates the agglomeration process of particles. During this study, other physical and chemical properties, such as moisture content, loose bulk density, pH value, and the crushing strength of the finished product were determined. All measurements of the parameters listed were performed for 2.0–3.15 mm and 3.15–4.0 mm diameter granules (Table 6).
Since the raw materials used in this study were high in moisture, the moisture content of the granules was quite high even after drying. Residual moisture values ranged from 5.44 wt% to 6.26 wt% for the product composed of SCG and GACh. It is clear from the results that the urea additive not only decreased the amount of moisture needed for granule formation, but also the moisture content of the dried product was lower (3.97–5.53 wt%) compared to the fertilizer granules of 3–1–1+MN grade.
The loose bulk density of granules composed of SCG, GACh, and urea was slightly higher than of those without urea. The maximum loose bulk density value of granules composed of SCG and GACh biomass was 370.9 kg/m3, while the maximum value of loose bulk density of granules with urea additive was 423.1 kg/m3. In conclusion, the obtained results indicate that by adding urea, the loose bulk density of the finished product increased. Before the granulation process, the pH values of raw materials were determined. The measured pH value of the GACh suspension was equal to 8.53 ± 0.04, and for the aqueous solution of spent coffee grounds with 10 wt% concentration it was 5.6 ± 0.02. The aqueous 10 wt% urea solution accounted for a pH of 6.97 ± 0.14. Solutions of the same concentration were prepared to determine the pH value of obtained granular fertilizers. As could be concluded from Table 6, pH values of 3–1–1 grade fertilizer ranged from 6.28 to 6.43, while the pH values of second grade granules resulted in 6.88–7.05. Granules composed of SCG, green algae Chlorella sp., and urea were almost neutral, due to the decreased amount of spent coffee grounds in the mixture and the addition of alkaline properties containing urea. The crushing strength of the obtained granules was measured for the commercial fraction. The present study confirmed that the urea additive also improved the crushing strength of the obtained granular fertilizers. The maximum force to crush the granule of SCG, algae, and urea was almost 1.5 times greater than without the urea additive. Although the urea additive improved some physical and chemical properties of the finished product, it is important to note that the presence of urea had a negative impact on hygroscopicity of the granules. The results confirmed that urea is a highly hygroscopic substance, and during the experiment, granules containing urea absorbed much more moisture, regardless of the environment in the desiccator. As can be seen from Figure 6a, after spending 8 days in the water vapor environment, granules released water. The absorbed water content was 72.0 wt%. In the environment of the saturated NaNO2 solution, absorbance was lower (9.7 wt%). A slight fluctuation in the amount of water absorbed during the experiment could be explained by changes in temperature and humidity in the desiccator.
Clearly, better results were observed during the absorbance study of the SCG and algae biomass granules. After seven days, in water vapor environment granules started to mold (Figure 6a). By the eighth day, absorbed water content was 24.9 wt% and the study was completed. The results of the hygroscopicity study in the environment of saturated sodium nitrite solution were equal to those previously described (weight of the granules increased by 3.6 wt%). Thus, the results demonstrated that the urea additive improved the chemical and physical properties of the obtained granules.

3.7. Nutrient Leaching Study

Nitrogen loss is one of the main issues that modern agriculture faces [2,51]. Urea absorbs water very easily and is lost due to hydrolysis from solid to liquid nitrogen. Volatilization of ammonia causes various economic and environmental problems. Ammonium emissions not only cause air pollution but also results in the application of excessive amounts of fertilizers to meet plant nutrition needs. The experiment was performed on each grade of fertilizers (Figure 7). The results of the conducted nutrient leaching study demonstrated that during the first irrigation (marked as No. 1) leaching nitrogen concentration of the 13–1–0+MN grade fertilizer was equal to 5.57 wt% and 1.33 wt% for the 3–1–1 grade. The second irrigation (No. 2) resulted in 1.84 wt% and 0.82 wt%, respectively. By the third time (No. 3), the mixture composed of SCG, GACh, and urea solution released 1.26 wt% nitrogen, and for the SCG, GACh mixture it was 0.45%. Insignificant concentrations of nitrogen were determined to leach after the fourth (No. 4) and fifth (No. 5) irrigation. The results led to the conclusion that approximately 3.67 wt% of nitrogen from the granules containing urea was lost due to ammonium volatilization. Fertilizers composed only of SCG and algae biomass released nitrogen consistently, without any volatilization losses.
During the experiment, other concentrations of plant nutrients were also determined. Since the initial concentration of phosphorus and potassium was not very significant, it is not expedient to draw any conclusions. It is clear from the results that the mixtures contained water soluble phosphorus and potassium and that the concentrations of these nutrients decreased proportionally with each irrigation. Nevertheless, it is very important to note that not all P and K were leached from the soil. Alternatively, it could be explained that some of the phosphorus and potassium were bounded by soil colloids [52].

3.8. Instrumental Analysis of the Raw Materials and Finished Product

To determine the thermal stability of the obtained granules, TGA and DSC analyses were performed. For granules of 3–1–1+MN grade, the continuous weight loss up to 3 wt% was observed at the temperature up to 250 °C. As shown by previous studies, granules of such composition contain 5.44 wt% to 6.26 wt% moisture, and this weight loss is related to the water evaporation from the granules. Water evaporation was also indicated by the small endothermic effect obtained by the DSC analysis (Figure 8).
The second weight loss in the thermal decomposition profile occurred due to the volatilization of organic compounds. An intensive peak at around 325 °C was attributed to the fragmentation of hydrocarbon chains of fatty acids in algae biomass. A similar pattern of results was obtained by other researchers [53,54]. The second stage of weight loss could also be attributed to the SCG devolatilization, resulting in the formation of CO and CO2. The DSC curve indicates decomposition of hemicellulose at around 360 °C. The following step is decomposition of cellulose in the 400–500 °C temperature range. The third stage is due to lignin, and it starts at 450 °C until the test sample completely burns down at 800 °C, resulting in 94% of total weight loss [55]. A similar pattern of results was obtained with 13–1–0 grade fertilizers. However, slight changes in the thermal decomposition profile were observed due to the added urea. A low intensity peak of heat absorption was observed at 116 °C when urea starts to melt; then it was followed by a more intensive peak in the temperature range of 150–250 °C. This process leads to emission of gases because of the urea decomposition. During this stage, 20% of the total mass of test sample was lost [56]. The following stages in the thermal decomposition profile are the same as previously described for the mixture of SCG and algae biomass.
To compare the finished products with the raw materials, FTIR analysis was performed on SCG and GACh separately, along with granules of both grades (Figure 9). The FTIR transmittance spectra (Figure 9) were recorded in the range of 400–4000 cm−1. To perform this analysis, GACh was dried to constant weight and then crushed into fine particles of less than 200 µm diameter.
An intensive spectral peak at 3677–3000 cm−1 belongs to the stretching vibration of the O–H group, indicating the presence of phenols, carboxylic acid, and absorbed water in b, c, and d test samples [57]. A sharp peak in a range of 2920 cm−1 to 2850 cm−1 indicates an asymmetric and symmetric C–H stretching of cellulose components [58]. Elongation of the carbonyl bond in esters is clearly seen from the peak at 1750 cm−1 in the FTIR transmittance spectra of spent coffee grounds. The absorption of the C–N stretching could be indicated by a less intensive peak at 1500 cm−1. A spectrum of a different pattern was obtained for the GACh biomass. The presence of proteins in algae biomass is indicated by vibrations of N–H at 1400–1600 cm−1. Aromatic and aliphatic amines could be determined from the peaks of C–N stretching in the 1000–1300 cm−1 range. An intensive peak at 3500–3200 cm–1 represents symmetric and asymmetric stretching of the N–H bonds [59]. The results demonstrate that the FTIR transmittance spectra of SCG and obtained granules is very similar, because granular product is mainly composed of SCG (ratio of SCG and GACh is 2:1). Moreover, GACh biomass with an initial moisture of 84.58 ± 1.60 wt% was used during the granulation process. For this reason, no significant peaks of amine functional groups were observed in FTIR spectra of the finished product. In addition, no additional chemical compounds formed by mixing SCG with GACh biomass. Nevertheless, it is very important to highlight that the green algae biomass improved granulation process, and significant changes in the strength of the formed granules were observed.

4. Conclusions

The study showed that the spent coffee grounds contain 2.00 ± 0.09 wt% humic substances, which are soluble in 0.1 M sodium hydroxide solution.
The addition of SCG (under the studied conditions) had a negative impact on the growth of Secale cereale L., but during the experiment it was observed that mixtures with higher quantity of SCG required less frequent watering. The maximum water vapor absorption of SCG was equal to 25.3 ± 3.4 wt% in the saturated water vapor environment, and in the environment of saturated sodium nitrite solution it resulted in 4.0 ± 0.6 wt%.
The results of the SCG effect on soil microorganisms showed that the addition of 4 wt% to 8 wt% of SCG increased the number of spore-forming bacteria and nitrogen assimilating bacteria. The opposite effect was observed by further increasing the amount of SCG in the mixture. The performed study showed no significant differences in the count of actinomycetes in the soil.
Organic bulk fertilizers were made of spent coffee grounds, green algae Chlorella sp., and a urea additive. Obtained fertilizer grades were as follows: 3–1–1+MN for the mixture of spent coffee grounds and green algae Chlorella sp., and 13–1–0+MN for the mixture with the urea additive. This study showed that the urea additive improved the physical and chemical properties of the finished product, although it had a negative impact on the hygroscopicity of the granules.
A nutrient leaching study indicated that approximately 3.67 wt% of nitrogen was lost from the granules containing urea, due to ammonium volatilization, and for the fertilizers composed only of SCG and algae biomass, nitrogen was released consistently, without any volatilization losses.

Author Contributions

Conceptualization, D.R. and R.Š.; methodology, R.Š.; validation, D.R. and R.Š.; formal analysis, D.R. and R.Š.; investigation, D.R.; resources, R.Š.; data curation, R.Š.; writing—original draft preparation, D.R.; writing—review and editing, D.R. and R.Š.; visualization, D.R.; supervision, R.Š. All authors have read and agreed to the published version of the manuscript.

Funding

This research did not receive any specific grant from funding agencies in the public, commercial, or not-for-profit sectors.

Institutional Review Board Statement

Not applicable.

Informed Consent Statement

Not applicable.

Data Availability Statement

Data sharing not applicable.

Conflicts of Interest

The authors declare no conflict of interest.

References

  1. Singh, R.P.; Kumar, S.; Sainger, M.; Sainger, P.A.; Barnawal, D. Eco-friendly Nitrogen Fertilizers for Sustainable Agriculture. In Adaptive Soil Management: From Theory to Practices; Springer: Singapore, 2017; pp. 227–246. [Google Scholar] [CrossRef]
  2. Chen, J.; Lü, S.; Zhang, Z.; Zhao, X.; Li, X.; Ning, P.; Liu, M. Environmentally friendly fertilizers: A review of materials used and their effects on the environment. Sci. Total Environ. 2018, 613, 829–839. [Google Scholar] [CrossRef] [PubMed]
  3. Hazra, G. Different Types of Eco-Friendly Fertilizers: An Overview. Sustain. Environ. 2016, 1, 54. [Google Scholar] [CrossRef] [Green Version]
  4. Hirel, B.; Krapp, A. Nitrogen Utilization in Plants I Biological and Agronomic Importance. In Encyclopedia of Biochemistry, 3rd ed.; Elsevier: Amsterdam, The Netherlands, 2020. [Google Scholar] [CrossRef]
  5. Schröder, J.J. The Position of Mineral Nitrogen Fertilizer in Efficient Use of Nitrogen and Land: A Review. Nat. Resour. 2014, 05, 936–948. [Google Scholar] [CrossRef] [Green Version]
  6. Ye, L.; Zhao, X.; Bao, E.; Li, J.; Zou, Z.; Cao, K. Bio-organic fertilizer with reduced rates of chemical fertilization improves soil fertility and enhances tomato yield and quality. Sci. Rep. 2020, 10, 177. [Google Scholar] [CrossRef] [PubMed] [Green Version]
  7. Timilsena, Y.; Adhikari, R.; Casey, P.; Muster, T.; Gill, H.; Adhikari, B. Enhanced efficiency fertilisers: A review of formulation and nutrient release patterns. J. Sci. Food Agric. 2015, 95, 1131–11422. [Google Scholar] [CrossRef] [PubMed]
  8. Hakeem, K.R.; Bhat, R.A.; Qadri, H. (Eds.) Bioremediation and Biotechnology; Springer: Cham, Switzerland, 2020. [Google Scholar]
  9. Das, J.; Jha, S.; Goyal, M.K.; Surampalli, R.Y. Challenges of Sustainability in Agricultural Management. Sustainability 2020, 4, 339–356. [Google Scholar] [CrossRef]
  10. Adesemoye, A.O.; Kloepper, J.W. Plant–microbes interactions in enhanced fertilizer-use efficiency. Appl. Microbiol. Biotechnol. 2009, 85, 1–12. [Google Scholar] [CrossRef] [Green Version]
  11. Fuentes-Ramirez, L.E.; Caballero-Mellado, J. Bacterial Biofertilizers. In PGPR: Biocontrol and Biofertilization; Springer: Dordrecht, The Netherlands, 2006; pp. 143–172. [Google Scholar] [CrossRef]
  12. Malusa, E.; Vassilev, N. A contribution to set a legal framework for biofertilisers. Appl. Microbiol. Biotechnol. 2014, 98, 6599–6607. [Google Scholar] [CrossRef] [Green Version]
  13. Thomas, S.K.; Parameswaranpillai, J.; Krishnasamy, S.; Begum, P.S.; Nandi, D.; Siengchin, S.; George, J.J.; Hameed, N.; Salim, N.; Sienkiewicz, N. A comprehensive review on cellulose, chitin, and starch as fillers in natural rubber biocomposites. Carbohydr. Polym. Technol. Appl. 2021, 2, 100095. [Google Scholar] [CrossRef]
  14. Fryczkowska, B.; Gabryś, T. Preparing and Using Cellulose Granules as Biodegradable and Long-Lasting Carriers for Artificial Fertilizers. J. Ecol. Eng. 2018, 19, 111–122. [Google Scholar] [CrossRef]
  15. Lu, P.; Zhang, M.; Li, Q.; Xu, Y. Structure and Properties of Controlled Release Fertilizers Coated with Thermosetting Resin. Polym. Technol. Eng. 2013, 52, 381–386. [Google Scholar] [CrossRef]
  16. Wu, L.; Liu, M.; Liang, R. Preparation and properties of a double-coated slow-release NPK compound fertilizer with superabsorbent and water-retention. Bioresour. Technol. 2008, 99, 547–554. [Google Scholar] [CrossRef] [PubMed]
  17. Shaviv, A. Advances in controlled-release fertilizers. Adv. Agron. 2001, 71, 1–49. [Google Scholar] [CrossRef]
  18. Hazra, G.; Das, T. A Review on Controlled Release Advanced Glassy Fertilizer. Glob. J. Sci. Front. Res. B Chem. 2014, 14, 33–44. [Google Scholar]
  19. The Food and Agriculture Organization of the United Nations (FAO). Food Wastage Footprint. Impact on Natural Resources. Available online: https://www.fao.org/3/i3347e/i3347e.pdf (accessed on 15 November 2021).
  20. Vivek, V.; Bermúdez, S.; Larrea, C. Global Market Report: Coffee; The International Institute for Sustainable Development: Winnipeg, MB, Canada, 2019. [Google Scholar]
  21. Belitz, H.D.; Grosch, W.; Schieberle, P. Food Chemistry, 4th ed.; Springer: Berlin/Heidelberg, Germany, 2009; p. 1070. [Google Scholar]
  22. Defernez, M.; Wren, E.; Watson, A.D.; Gunning, Y.; Colquhoun, I.J.; Le Gall, G.; Williamson, D.; Kemsley, E.K. Low-field 1H NMR spectroscopy for distinguishing between arabica and robusta ground roast coffees. Food Chem. 2017, 216, 106–113. [Google Scholar] [CrossRef] [PubMed] [Green Version]
  23. International Coffee Organization. Coffee Market Report 2021. Available online: http://www.ico.org/prices/po-production.pdf (accessed on 18 September 2021).
  24. Murthy, P.S.; Naidu, M.M. Sustainable management of coffee industry by-products and value addition—A review. Resour. Conserv. Recycl. 2012, 66, 45–58. [Google Scholar] [CrossRef]
  25. Blinová, L.; Sirotiak, M.; Bartošová, A.; Soldán, M. Review: Utilization of Waste From Coffee Production. Res. Pap. Fac. Mater. Sci. Technol. Slovak Univ. Technol. 2017, 25, 91–101. [Google Scholar] [CrossRef] [Green Version]
  26. Fernandes, A.; e Mello, F.D.V.C.; Filho, S.T.; Carpes, R.; Honório, J.; Marques, M.; Felzenszwalb, I.; Ferraz, E. Impacts of discarded coffee waste on human and environmental health. Ecotoxicol. Environ. Saf. 2017, 141, 30–36. [Google Scholar] [CrossRef] [PubMed]
  27. Mitraka, G.-C.; Kontogiannopoulos, K.; Batsioula, M.; Banias, G.; Assimopoulou, A. Spent Coffee Grounds’ Valorization towards the Recovery of Caffeine and Chlorogenic Acid: A Response Surface Methodology Approach. Sustainability 2021, 13, 8818. [Google Scholar] [CrossRef]
  28. Sharma, H. A Detail Chemistry of Coffee and Its Analysis. In Coffee—Production and Research; IntechOpen: London, UK, 2020. [Google Scholar] [CrossRef] [Green Version]
  29. Atabani, A.; Mercimek, S.; Arvindnarayan, S.; Shobana, S.; Kumar, G.; Cadir, M.; Al-Muhatseb, A.H. Valorization of spent coffee grounds recycling as a potential alternative fuel resource in Turkey: An experimental study. J. Air Waste Manag. Assoc. 2018, 68, 196–214. [Google Scholar] [CrossRef] [Green Version]
  30. Silva, M.A.; Nebra, S.A.; Machado Silva, M.J.; Sanchez, C.G. The Use of Biomass Residues in the Brazilian Soluble Coffee Industry. Biomass Bioenergy 1998, 14, 457–467. [Google Scholar] [CrossRef]
  31. Nosek, R.; Tun, M.M.; Juchelkova, D. Energy Utilization of Spent Coffee Grounds in the Form of Pellets. Energies 2020, 13, 1235. [Google Scholar] [CrossRef] [Green Version]
  32. Campos-Vega, R.; Loarca-Piña, G.; Vergara-Castañeda, H.A.; Oomah, B.D. Spent coffee grounds: A review on current research and future prospects. Trends Food Sci. Technol. 2015, 45, 24–36. [Google Scholar] [CrossRef]
  33. Yamane, K.; Kono, M.; Fukunaga, T.; Iwai, K.; Sekine, R.; Watanabe, Y.; Iijima, M. Field Evaluation of Coffee Grounds Application for Crop Growth Enhancement, Weed Control, and Soil Improvement. Plant Prod. Sci. 2014, 17, 93–102. [Google Scholar] [CrossRef]
  34. Romanowska-Duda, Z.; Szufa, S.; Grzesik, M.; Piotrowski, K.; Janas, R. The Promotive Effect of Cyanobacteria and Chlorella sp. Foliar Biofertilization on Growth and Metabolic Activities of Willow (Salix viminalis L.) Plants as Feedstock Production, Solid Biofuel and Biochar as C Carrier for Fertilizers via Torrefaction Process. Energies 2021, 14, 5262. [Google Scholar] [CrossRef]
  35. UNE EN 13039:2012; Soil Improvers and Growing Media—Determination of Organic Matter Content and Ash. Available online: https://www.en-standard.eu/une-en-13039-2012-soil-improvers-and-growing-media-determination-of-organic-matter-content-and-ash/ (accessed on 28 October 2021).
  36. Liaudanskiene, I.; Slepetiene, A.; Velykis, A.; Satkus, A. Distribution of organic carbon in humic and granulodensimetric fractions of soil as influenced by tillage and crop rotation. Estonian J. Ecol. 2013, 62, 53. [Google Scholar] [CrossRef] [Green Version]
  37. Paleckienė, R.; Sviklas, A.M.; Šlinkšienė, R.; Štreimikis, V. Processing of rape straw ash into compound fertilizers using sugar factory waste. Pol. J. Environ. Stud. 2012, 21, 993–999. [Google Scholar]
  38. ISO 10390:2005; Soil Quality—Determination of pH. Available online: https://www.iso.org/standard/40879.html (accessed on 1 November 2021).
  39. LST CR 1233:2006. Fertilizers–Crushing Strength Determination on Fertilizer Grains; Lithuanian Standards Board: Vilnius, Lithuania, 2006.
  40. UNE EN ISO 7837:2001 Fertilizers; Determination of Bulk Density (Loose) of Fine-Grained Fertilizers. Available online: https://www.en-standard.eu/une-en-iso-7837-2001-fertilizers-determination-of-bulk-density-loose-of-fine-grained-fertilizers-iso-7837-1992/ (accessed on 1 November 2021).
  41. Gupta, A.P.; Neue, H.U.; Singh, V.P. Phosphorus determination in rice plants containing variable manganese content by the phospho-molybdo-vanadate (yellow) and phosphomolybdate (blue) colorimetric methods. Commun. Soil Sci. Plant Anal. 1993, 24, 1309–1318. [Google Scholar] [CrossRef]
  42. Wang, X.; Lim, L.-T. Effect of roasting conditions on carbon dioxide degassing behavior in coffee. Food Res. Int. 2014, 61, 144–151. [Google Scholar] [CrossRef]
  43. Kitou, M.; Okuno, S. Decomposition of coffee residue in soil. Soil Sci. Plant Nutr. 1999, 45, 981–985. [Google Scholar] [CrossRef]
  44. Cruz-Lopez, L.; Domingos, I.; Ferreira, J.; Esteves, B. A new way of using spent coffee ground. J. Int. Sci. Publ. 2017, 5, 85–93. [Google Scholar]
  45. Gomes, T.; Pereira, J.A.; Ramalhosa, E.; Casal, S.; Baptisa, P. Effect of fresh and composted spent coffee grounds on lettuce growth, photosynthetic pigments and mineral composition. In VII Congreso Ibérico de Agroingenieria y Ciencias Horticolas; SECH e SEAgIng: Madrid, Spain, 2013. [Google Scholar]
  46. Ronga, D.; Pane, C.; Zaccardelli, M.; Pecchioni, N. Use of Spent Coffee Ground Compost in Peat-Based Growing Media for the Production of Basil and Tomato Potting Plants. Commun. Soil Sci. Plant Anal. 2016, 47, 356–368. [Google Scholar] [CrossRef]
  47. Kim, M.-S.; Kim, J.-G. Adsorption Characteristics of Spent Coffee Grounds as an Alternative Adsorbent for Cadmium in Solution. Environments 2020, 7, 24. [Google Scholar] [CrossRef] [Green Version]
  48. Kovalcik, A.; Obruca, S.; Marova, I. Valorization of spent coffee grounds: A review. Food Bioprod. Process. 2018, 110, 104–119. [Google Scholar] [CrossRef]
  49. Gryndler, M.; Hršelová, H.; Klír, J.; Kubát, J.; Votruba, J. Long-term fertilization affects the abundance of saprotrophic microfungi degrading resistant forms of soil organic matter. Folia Microbiol. 2003, 48, 76–82. [Google Scholar] [CrossRef] [PubMed]
  50. Vodyanitskii, Y.; Savichev, A. The influence of organic matter on soil color using the regression equations of optical parameters in the system CIE- L*a*b*. Ann. Agrar. Sci. 2017, 15, 380–385. [Google Scholar] [CrossRef]
  51. Skorupka, M.; Nosalewicz, A. Ammonia Volatilization from Fertilizer Urea—A New Challenge for Agriculture and Industry in View of Growing Global Demand for Food and Energy Crops. Agriculture 2021, 11, 822. [Google Scholar] [CrossRef]
  52. Konrad, A.; Billiy, B.; Regenbogen, P.; Bol, R.; Lang, F.; Klumpp, E.; Siemens, J. Forest Soil Colloids Enhance Delivery of Phosphorus Into a Diffusive Gradient in Thin Films (DGT) Sink. Front. For. Glob. Chang. 2021, 3, 577364. [Google Scholar] [CrossRef]
  53. Gibertini, E.; Liberale, F.; Dossi, C.; Binda, G.; Mattioli, B.; Bettinetti, R.; Maspero, A.; Fiore, M.; Ruffo, R.; Magagnin, L. Algae-derived hard carbon anodes for Na-ion batteries. J. Appl. Electrochem. 2021, 51, 1665–1673. [Google Scholar] [CrossRef]
  54. Adamakis, I.-D.; Lazaridis, P.A.; Terzopoulou, E.; Torofias, S.; Valari, M.; Kalaitzi, P.; Rousonikolos, V.; Gkoutzikostas, D.; Zouboulis, A.; Zalidis, G.; et al. Cultivation, characterization, and properties of Chlorella vulgaris microalgae with different lipid contents and effect on fast pyrolysis oil composition. Environ. Sci. Pollut. Res. 2018, 25, 23018–23032. [Google Scholar] [CrossRef]
  55. Polat, S.; Sayan, P. Assessment of the thermal pyrolysis characteristics and kinetic parameters of spent coffee waste: A TGA-MS study. Energy Sources Part A Recovery Util. Environ. Eff. 2020, 8, 1–14. [Google Scholar] [CrossRef]
  56. Jones, J.M.; Rollinson, A.N. Thermogravimetric evolved gas analysis of urea and urea solutions with nickel alumina catalyst. Thermochim. Acta 2013, 565, 39–45. [Google Scholar] [CrossRef] [Green Version]
  57. Hao, L.; Wang, P.; Valiyaveettil, S. Successive extraction of As(V), Cu(II) and P(V) ions from water using spent coffee powder as renewable bioadsorbents. Sci. Rep. 2017, 7, 42881. [Google Scholar] [CrossRef] [PubMed] [Green Version]
  58. Essabir, H.; Raji, M.; Laaziz, S.A.; Rodrique, D.; Bouhfid, R.; Qaiss, A. Thermo-mechanical performances of polypropylene biocomposites based on untreated, treated and compatibilized spent coffee grounds. Compos. Part B Eng. 2018, 149, 1–11. [Google Scholar] [CrossRef]
  59. Jena, J.; Pradhan, N.; Dash, B.P.; Sukla, L.B.; Panda, P.K. Biosynthesis and Characterization of silver nanoparticles using microalga Chlorococcum humicola and its antibacterial activity. Int. J. Nanomater. Biostruct. 2013, 3, 1–8. [Google Scholar]
Figure 1. Effect of the SCG additive on the length of the rye stem.
Sustainability 14 01261 g001
Figure 2. Hygroscopicity of SCG in saturated H2O vapor and saturated NaNO2 solution environment.
Sustainability 14 01261 g002
Figure 3. The principal scheme of laboratory fertilizer production using SCG and GACh and urea.
Sustainability 14 01261 g003
Figure 4. Granulometric composition and quantity of commercial fraction of the finished products: (a) mixture of SCG+GACh (3–1–1+MN grade); (b) mixture of SCG+GACh+urea (13–3–0+MN grade).
Sustainability 14 01261 g004
Figure 5. Granules composed of SCG and GACh ((a) 2.0–3.15 mm and (b) 3.15–4.0 mm diameter granules (c) surface (30×), (d) surface of the granule cut in half (30×)) and SCG+GACh+urea ((e) 2.0–3.15 mm and (f) 3.15–4.0 mm diameter granules (g) surface (30×), (h) surface of the granule cut in half (30×)).
Sustainability 14 01261 g005
Figure 6. Hygroscopicity of the granules in: (a) saturated H2O vapor environment; (b) saturated NaNO2 solution environment.
Sustainability 14 01261 g006
Figure 7. Primary nutrient leaching: (a) nitrogen; (b) phosphorus (P2O5); and (c) potassium (K2O) concentration in the run-off solutions.
Sustainability 14 01261 g007
Figure 8. Simultaneous thermal analysis of granules: (a) 3–1–1+MN grade fertilizer; (b) 13–1–0+MN grade fertilizer.
Sustainability 14 01261 g008
Figure 9. FTIR analysis curves: (a) GACh; (b) SCG; (c) 3–1–1+MN grade fertilizer; (d) 13–1–0+MN grade fertilizer.
Sustainability 14 01261 g009
Table 1. Distribution of particles by diameter.
Distribution of Particles by Diameter, wt%
>2 mm1–2 mm500–1000 µm200–500 µm<200 µm
Topsoil
938221516
SCG
3617695
Table 2. Effect of spent coffee ground additives on rye (Secale cereale L.) growth.
SCG Content in the Mixture, wt%I ExperimentII Experiment
Physical and Chemical Properties of Secale cereale L.
Stem Weight, gNumber of Leaves, pcsMineral Content, wt%Stem Weight, gNumber of Leaves, pcsMineral Content, wt%
Control0.11 ± 0.042.41 ± 0.6419.41 ± 0.0030.09 ± 0.022.00 ± 0.0016.21 ± 0.002
40.09 ± 0.031.77 ± 0.4214.78 ± 0.0020.07 ± 0.031.90 ± 0.3212.96 ± 0.001
80.08 ± 0.091.77 ± 0.4213.32 ± 0.0020.06 ± 0.021.91 ± 0.289.99 ± 0.001
120.07 ± 0.021.80 ± 0.4011.60 ± 0.0030.06 ± 0.021.92 ± 0.289.29 ± 0.003
160.07 ± 0.021.81 ± 0.3910.59 ± 0.0020.05 ± 0.031.81 ± 0.4010.50 ± 0.001
Table 3. SCG impact on the counts of microorganisms in soil.
SCG Content in the Mixture, wt%Ammonifying Bacteria (AB) CFU/g SoilMineral Nitrogen Assimilating Bacteria CFU/g
Spore-Forming BacteriaActinomycetesTotal Bacteria Count (TBC)pHKCl
Control<1033.0 × 1061.2 × 1075.0 × 1056.95 ± 0.07
44 × 1041.8 × 1069.2 × 1076.0 × 1066.95 ± 0.00
83 × 1042.6 × 1061.2 × 1085.6 × 1066.83 ± 0.04
12<1034.6 × 1062.0 × 1081.5 × 1076.70 ±0.00
16<1034.0 × 1058.0 × 1075.0 × 1076.70 ± 0.00
Table 4. Color of SCG and soil samples.
ColorSample
SCGTopsoilGrowing Medium with Different Amounts of SCG, wt%
481216
CharacteristicsValue
L*31.30 ± 0.8839.55 ± 1.7840.79 ± 1.6637.96 ± 1.1837.40 ± 0.2835.79 ± 0.12
a*7.00 ± 0.113.13 ± 0.063.48 ± 0.073.43 ± 0.083.42 ± 0.093.63 ± 0.10
b*4.80 ± 0.695.94 ± 0.614.83 ± 0.525.13 ± 0.275.82 ± 0.135.60 ± 0.14
h0.60 ± 0.061.08 ± 0.040.94 ± 0.060.98 ± 0.021.04 ± 0.021.00 ± 0.01
C8.50 ± 0.466.72 ± 0.565.96 ± 0.406.18 ± 0.266.75 ± 0.086.67 ± 0.15
Table 5. Chemical composition of mixtures.
Mixture CompositionPrimary NutrientFertilizer Grade
Nitrogen (N)Phosphorus (P2O5)Potassium (K2O)
Concentration, %
SCG and GACh2.82 ± 0.090.70 ± 0.020.63 ± 0.023–1–1+MN
SCG, GACh, and urea12.85 ± 0.380.49 ± 0.050.39 ± 0.0013–1–0+MN
Table 6. Physical and chemical properties of granular fertilizers.
Moisture Content of Raw Materials Mixture, wt%Physical and Chemical Properties of Obtained Granules
Moisture Content, wt%Loose Bulk Density, kg/m3pH Value of 10% SolutionCrushing Strength, N/Granule
2.0–3.15 mm3.15–4.0 mm2.0–3.15 mm3.15–4.0 mm2.0–3.15 mm3.15–4.0 mm
Mixture of SCG and GACh (3–1–1+MN grade)
61.35.58 ± 0.055.86 ± 0.01317.2 ± 0.3314.1 ± 0.06.28 ± 0.046.9 ± 1.56.9 ± 1.8
61.85.44 ± 0.646.10 ± 0.05343.2 ± 0.3315.0 ± 1.26.40 ± 0.006.3 ± 1.35.7 ± 0.4
62.95.70 ± 0.145.97 ± 0.04351.0 ± 1.1326.0 ± 0.06.23 ± 0.046.2 ± 0.87.1 ± 1.0
63.65.57 ± 0.056.17 ± 0.15342.4 ± 8.6343.1 ± 0.26.38 ± 0.048.0 ± 2.27.3 ± 1.6
66.95.93 ± 0.206.26 ± 0.23370.9 ± 7.8335.8 ± 4.36.43 ± 0.146.7 ± 1.08.0 ± 2.1
Mixture of SCG, GACh and urea (13–1–0+MN grade)
56.64.40 ± 0.025.39 ± 0.09358.3 ± 5.2359.3 ± 0.06.88 ± 0.049.1 ± 3.36.2 ± 0.5
57.13.97 ± 0.045.11 ± 0.18359.4 ± 4.3348.7 ± 0.06.85 ± 0.0010.3 ± 1.810.3 ± 0.1
57.34.19 ± 0.175.53 ± 0.38378.3 ± 2.6338.3 ± 0.46.93 ± 0.049.0 ± 1.410.0 ± 1.3
57.65.00 ± 0.474.90 ± 0.32423.1 ± 4.0420.3 ± 2.27.05 ± 0.0010.7 ± 1.710.1 ± 1.3
58.04.99 ± 0.014.99 ± 0.26417.4 ± 5.8411.0 ± 2.57.00 ± 0.0011.4 ± 1.412.6 ± 1.9
Publisher’s Note: MDPI stays neutral with regard to jurisdictional claims in published maps and institutional affiliations.

