Article

Novel Application of Tagua Shell (Phytelephas aequatorialis) as Adsorbent Material for the Removal of Pb(II) Ions: Kinetics, Equilibrium, and Thermodynamics of the Process

by
Gino Alexander Chávez-Prado
1,
Adams Brayan Benavides-García
1,
Luis Angel Zambrano-Intriago
2,3,
Naga Raju Maddela
2,4,
Luis Santiago Quiroz-Fernández
5,
Ricardo José Baquerizo-Crespo
1 and
Joan Manuel Rodríguez-Díaz
1,3,*
1
Departamento de Procesos Químicos, Facultad de Ciencias Matemáticas, Físicas y Químicas, Universidad Técnica de Manabí, S/N, Avenida Urbina y Che Guevara, Portoviejo 130104, Ecuador
2
Instituto de Investigación, Universidad Técnica de Manabí, Portoviejo 130105, Ecuador
3
Laboratorio de Análisis Químicos y Biotecnológicos, Instituto de Investigación, Universidad Técnica de Manabí, S/N, Avenida Urbina y Che Guevara, Portoviejo 130104, Ecuador
4
Departamento de Ciencias Biológicas, Facultad de Ciencias de la Salud, Universidad Técnica de Manabí, Portoviejo 130105, Ecuador
5
Instituto de Posgrado, Universidad Técnica de Manabí, S/N, Avenida Urbina y Che Guevara, Portoviejo 130104, Ecuador
*
Author to whom correspondence should be addressed.
Sustainability 2022, 14(3), 1309; https://doi.org/10.3390/su14031309
Submission received: 23 December 2021 / Revised: 20 January 2022 / Accepted: 21 January 2022 / Published: 24 January 2022

Abstract

:
Tagua shell is a material generated in the handcrafted jewelry industry, which is discarded since it does not have a specific use. The present study evaluates this material as an adsorbent for the removal of lead (II) in aqueous media. The adsorbent was characterized through the point of zero charge technique, X-ray microanalysis, scanning electron microscopy, and Fourier-transform infrared spectroscopy. Tests were carried out in a static system using a lead (II) solution of 100 mg·L−1 to establish the process conditions, setting a pH of 5, an adsorbent dose of 1.8 g/100 mL, and a contact time of 60 min. The kinetic study performed showed that the experimental data had a better fit with the pseudo-second order model. The experimental equilibrium data were correlated using the Langmuir, Freundlich, Toth, Redlich–Peterson, and Sips models, of which the Langmuir and Sips models proved to be the best to represent the adsorption process due to the high coefficient of determination they presented at the different temperatures, being between 0.9629–0.9899 and 0.9819–0.9900, respectively. The maximum amount of lead adsorbed was 22.0348 mg·g−1 at a temperature of 298 K. Finally, the thermodynamics study indicated that the process is endothermic, spontaneous, and thermodynamically stable.

1. Introduction

Water pollution is one of the most important environmental problems nowadays. This pollution has been caused by the increase in toxic substances coming mostly from untreated industrial effluent discharges. An example of this substance is lead (Pb), a heavy metal that, due to its nonbiodegradable nature, tends to accumulate in the ecosystem, generating an imbalance in the trophic chain and affecting human health [1]. According to the Environmental Protection Agency (EPA) and World Health Organization (WHO), the entry of Pb into the body either by ingestion, inhalation, or through the skin, can lead to serious problems, such as a lower intelligence quotient, hyperactivity, anemia, encephalopathy, miscarriages, cardiovascular problems, and decreased renal function [2,3,4].
The removal of lead and other heavy metals in water is performed by conventional methods, such as chemical precipitation, ion exchange, and reverse osmosis. These methods can be costly due to the technology used, and, in addition, they can generate other types of contaminants, such as sludge. Adsorption and especially the use of new adsorbents that do not require physical or chemical treatment for their use become a viable alternative for the treatment of heavy metals such as lead [1]. Adsorption is a separation process in which certain components present in a fluid are transferred to the surface of a porous solid material called an adsorbent [5]. When materials of biological origin are used as adsorbents, such as microorganisms (e.g., fungi and algae) and plant residue, it is known as biosorption [6]. A wide variety of materials of biological origin have been used to remove lead in aqueous solutions, for example, cocoa residues [7], Eichhornia crassipes [8], pineapple leaf fiber [9], and tomato waste and apple juice residue [10]. Tagua is a seed enveloped by a brown-colored coat. It comes from the Phytelephas aequatorialis palm commonly found in the west of Ecuador. The nanocellulose of this seed has been employed in the removal of heavy metals, such as cobalt, copper, and silver, being for the latter metal where a higher percentage of removal was achieved (>98%) [11]. However, there are no reports in the literature where tagua shell (TSH) has been used as an adsorbent for contaminants of any nature.
For this reason, the aim of the present study is the evaluation for the first time of TSH as an adsorbent material for the removal of Pb(II) in aqueous media. For this purpose, the adsorption mechanism is specifically analyzed through kinetic, equilibrium, and thermodynamic studies.

2. Materials and Methods

2.1. Adsorbent and Adsorbate

TSH was obtained in the community of Sosote, Manabí, Ecuador. TSH was triturated, sieved, and washed with abundant distilled water and dried in an oven (Memmert, Buechenbach, Germany) at 105 °C until a constant weight was obtained. PbNO3 (obtained from Merk ≥ 99.5%) was used to prepare solutions of 20, 40, 60, 80, 100, 120, and 140 mg·L−1 of Pb(II). These solutions were prepared daily and stored at room temperature in amber glass vials. Concentrations were quantified using Inductively Coupled Plasma Optical Emission Spectroscopy (ICP-OES) instrument (Thermo Scientific ICap 6500 series inductively coupled plasma optical emission spectrometer) following the analytical standards detailed in “Standard Methods for the Analysis of Water and Wastewater” for Pb(II) detection [12]. All experiments were conducted in triplicate to ensure the reliability of the results.

2.2. Characterization

The point of zero charge (pHpzc) of TSH was determined by analyzing the variation in pH (2–11) of 25 mL of distilled water in contact with 0.1 g of adsorbent for 24 h at 300 rpm [13]. The pH was quantified using a Benchtop Fisher Scientific accumet AB150 pH meter. TSH surface morphology was determined through Scanning Electron Microscopy (SEM) and X-ray microanalysis (SEM/EDX) on a high resolution Scanning Electron Microscope (Schottky), with X-ray microanalysis and Electron Diffraction Pattern Analysis Retrodispersed: Quanta 400FEG ESEM/EDAX Genesis X4M. The specific surface area was calculated from the N2 adsorption/desorption isotherms by using a surface area analyzer (Nova Station Quantachrome) and applying the Brunauer–Emmett–Teller (BET) equation [14]. The IR spectra of TSH before and after adsorption were performed in a NICOLET iS5 THERMO SCIENTIFIC Spectrometer, with a fast recovery deuterated triglycine sulfate detector (DTGS) and an optimized KBr/Ge medium infrared beam splitter. Spectra were obtained in the range of 4000 to 600 cm−1.

2.3. Experimental Conditions of the Adsorption Process

The effect of the initial pH of the medium was studied using the HYDRA program developed by Ignasi Puigdomenech (2004) of the Division of Inorganic Chemistry, Royal Institute of Technology, Sweden. The diagrams were obtained with the lowest and highest concentration values of the metal species used. It is important to note that these diagrams were made considering only the properties of the aqueous solutions (concentration, pH, and ionic strength), without any consideration of the influence of the properties (shape, charge, mass, etc.) of the TSH used as adsorbent material.
The experimental adsorption tests were carried out in a static system, using an orbital shaker (New Brunswick Excella E24/E24R) with temperature control, in 250 mL flasks, with 100 mL of Pb(II) solution at 298 ± 1 K. All processed samples were filtered with Whatman quantitative filter paper (ashless, grade 589/3 blue ribbon). The adsorbent effect of the filter paper was analyzed, for which it showed nonsignificant differences < 1%. All tests were performed in triplicate with a variation of less than 5%. The adsorption capacity and the percentage of removal were obtained using Equations (1) and (2)
q e = ( C o C e ) V w
% R = ( C o C t ) C o   ×   100
where qe (mg·g−1) is the adsorption capacity of the adsorbate-adsorbent system, Co (mg·L−1) is the initial adsorbate concentration, Ce (mg·L−1) is the adsorbate concentration at equilibrium, V (mL) is the solution volume, and w (mg) is the mass of adsorbent. R is the percentage removal rate.
The adsorbent dose, effect of contact time, initial concentration, and temperature were evaluated in batch adsorption experiments. All experiments were performed by stirring 100 mL of Pb(II) solution at the required concentration with a dose of TSH in a 250 mL Erlenmeyer flask with stirring at a constant speed of 300 rpm. This shaking speed of 300 rpm was decided based on preliminary tests and published literature [15,16,17].
The effect of adsorbent dose (w) was studied by shaking a 100 mg·L−1 Pb(II) solution with different doses of TSH, ranging from 0.2 to 3.0 g per 300 min, at 298 K and pH 5.
The effect of contact time was performed with a solution of 100 mg·L−1 of Pb(II) applying the optimal w of TSH, 298 K, and pH 5, taking aliquots at times of 1, 3, 5, 10, 15, 20, 30, 40, 60, and 120 min.
The initial concentrations tested for the Pb(II) equilibrium study were in the range of 20 to 140 mg·L−1, at a time of 60 min, 298 K, and pH 5.

2.4. Adsorption Kinetics and Equilibrium

The kinetic and equilibrium parameters were determined by employing nonlinear fitting methods using the Statistica 10.0 software.
The kinetic models of pseudo-first order, pseudo-second order, Elovich, Bangham, and Weber–Morris intraparticle diffusion were applied to interpret the kinetic data.
The pseudo-first order model is represented by the Lagergren equation (Equation (3)), where qe and qt are the amount of lead adsorbed at equilibrium and at time t (mg·g−1), respectively, and k1 (min−1) is the adsorption rate constant [17].
l o g 10 ( q e q t q e ) = k 1 2.303 t
The pseudo-second order kinetic model is also based on the adsorption capacity of the solid phase and shows the behavior of the process along the contact time phase. It is represented by Equation (4), where K2 is the adsorption rate constant (g·mg−1·min−1), and qe and qt (mg·g−1) are the amount of lead adsorbed at equilibrium and at time t (min) [17].
q t = t K 2 q e 2 1 + t K 2 q e
The Bangham kinetic model can be used to verify if pore diffusion is the only rate-controlling step in the adsorption system employing this equation (Equation (5)), where KB (mg·g−1·s) and αB (<1) are the empirical constants of the equation, and qt (mg·g−1) is the amount of adsorbate retained per unit adsorbent. If the experimental data can be represented by the equation, the adsorption kinetics can be limited by diffusion in the adsorbent pores [17,18].
q t = K B t a B
For the Elovich model (Equation (6)), α (mg·g−1·min−1) and β (g·mg−1) are Elovich constants obtained from the slope and the intercept of the linear plot of qt vs. Lnt. This model assumes that the active sites of the bioadsorbent are heterogeneous and thus exhibit different activation energies, based on a second-order reaction mechanism [19].
q t = 1 β L n ( α β ) + 1 β L n t
The Weber–Morris model is used to determine if the limiting step of the adsorption process occurs by intraparticle diffusion. Plotting the adsorption capacity of the adsorbent versus the square root of time, a straight line through the origin of the plane should be obtained. In Equation (7), Kdif (mg·g−1·min−0.5) is the Weber–Morris kinetic constant, and C is the constant related to the boundary layer. The authors have added this factor to provide an accurate representation of the possible difference in regression at the origin of the graph [17].
q t = k d i f t 0.5 + C
On the other hand, for the equilibrium study, the Langmuir, Freundlich, Toth, Redlich–Peterson, and Sips models were applied.
In the Langmuir model (Equation (8)), qmax (mg·g−1) is the maximum amount of adsorbate per unit weight of adsorbent required to form a complete monolayer on the surface at high Ce, and KL (L·mg−1) is determined by graphing Ce/qe vs. Ce [17].
q e = K L q m a x C e 1 + K L C e
With respect to the Freundlich model (Equation (9)), KF and n are the constants (KF is (mg·g−1).(L·mg−1)1/n, and n is dimensionless) [17].
q e = K F C e 1 / n
The Redlich–Peterson model, due to its versatility, allows the representation of an equilibrium adsorption system for a wide range of concentrations and can be applied for both homogeneous and heterogeneous adsorption processes. The nonlinear equation of this model is represented by Equation (10), where qe (mg·g−1) is the adsorption capacity at equilibrium, Ce (mg·L−1) is the concentration of solute present in the solution at equilibrium; KRP (L·g−1), αRP (L·mg−1), and g are Redlich–Peterson parameters.
q e = K R P C e 1 + a R P C e g
The constant g (0 ≤ g ≥ 1) can characterize an isotherm. If g is close to 1, the isotherm is closer to the Langmuir isotherm, whereas if g is close to 0, the isotherm is closer to the Freundlich isotherm [20].
In the Toth model (Equation (11)), KT (mg·g−1) and αT (L·mg−1) are adsorption constants. z is a component that describes the degree of heterogeneity of the adsorption systems [20].
q e = K T C e [ α T + C e z ] 1 z
In the Sips model (Equation (12)), qms (mg·g−1) is the maximum amount of adsorbate adsorbed, Ce (mg·L−1) is the concentration of the aqueous phase at equilibrium, and Ks (L·mg−1) and ns are Sips constant [20].
q e = q m s K s C e n s 1 + K s C e n s

2.5. Adsorption Thermodynamics

The effect of temperature on the adsorption process was determined at temperatures of 288, 298, 308, and 318 K. The experiments were carried out using 100 mL of Pb(II) solution at different initial concentrations between 20 and 140 mg·L−1, at pH 5, w appropriate, for 60 min at 300 rpm. The thermodynamic parameters, Gibbs free energy (ΔG°) was calculated following Van ’t Hoff equation (Equation (13)), where Kc is the constant obtained by multiplying the equilibrium constant by 55.5 and by 1000, and R is the gas constant (8.314 J·mol−1·K−1). The adsorption enthalpy (ΔH°) and adsorption entropy (ΔS°) were calculated by employing the adsorption data at different temperatures using Equation (14). The magnitude of ΔH° and ΔS° was calculated by the slope and the intersection of the lnKc vs. 1/T graph [17].
Δ G ° = R T l n ( K c )
l n ( K c ) = Δ S R Δ H R T

3. Results and Discussion

3.1. TSH Characterization

The pHpzc has an important significance in adsorption processes, which indicates how the surface charge of the adsorbent is dependent on the pH of the solution. The pHpzc of TSH was measured by employing the pH drift method, as developed by Xie et al. [21]. Figure 1 shows the curves of the final pH of TSH vs. the initial pH and the initial pH (x axis) = final pH (y axis).
The interception with the function y = x is considered to be the pHpzc, which is seven. In this context, the following can be explained:
  • The surface charge is positive when the pH of the solution is below seven, which favors anion adsorption;
  • The surface charge is negative when the solution pH is above seven, which favors cation adsorption, and;
  • The net charge of the adsorbents is zero when the pH is close to pHpzc.
However, in this study, according to the effect of the solution pH on metal speciation (next section), the adsorption of Pb2+ cation as a function of pHpzc is not related. In this context, it is considered that other interactions may be stronger than the electrostatic forces alone so that the effect of surface charge is not so important. However, a cation often forms complexes with ligands, which are possibly negatively charged. In such a case, the cation is a negative complex, which can adsorb very well on a positively charged surface [22].
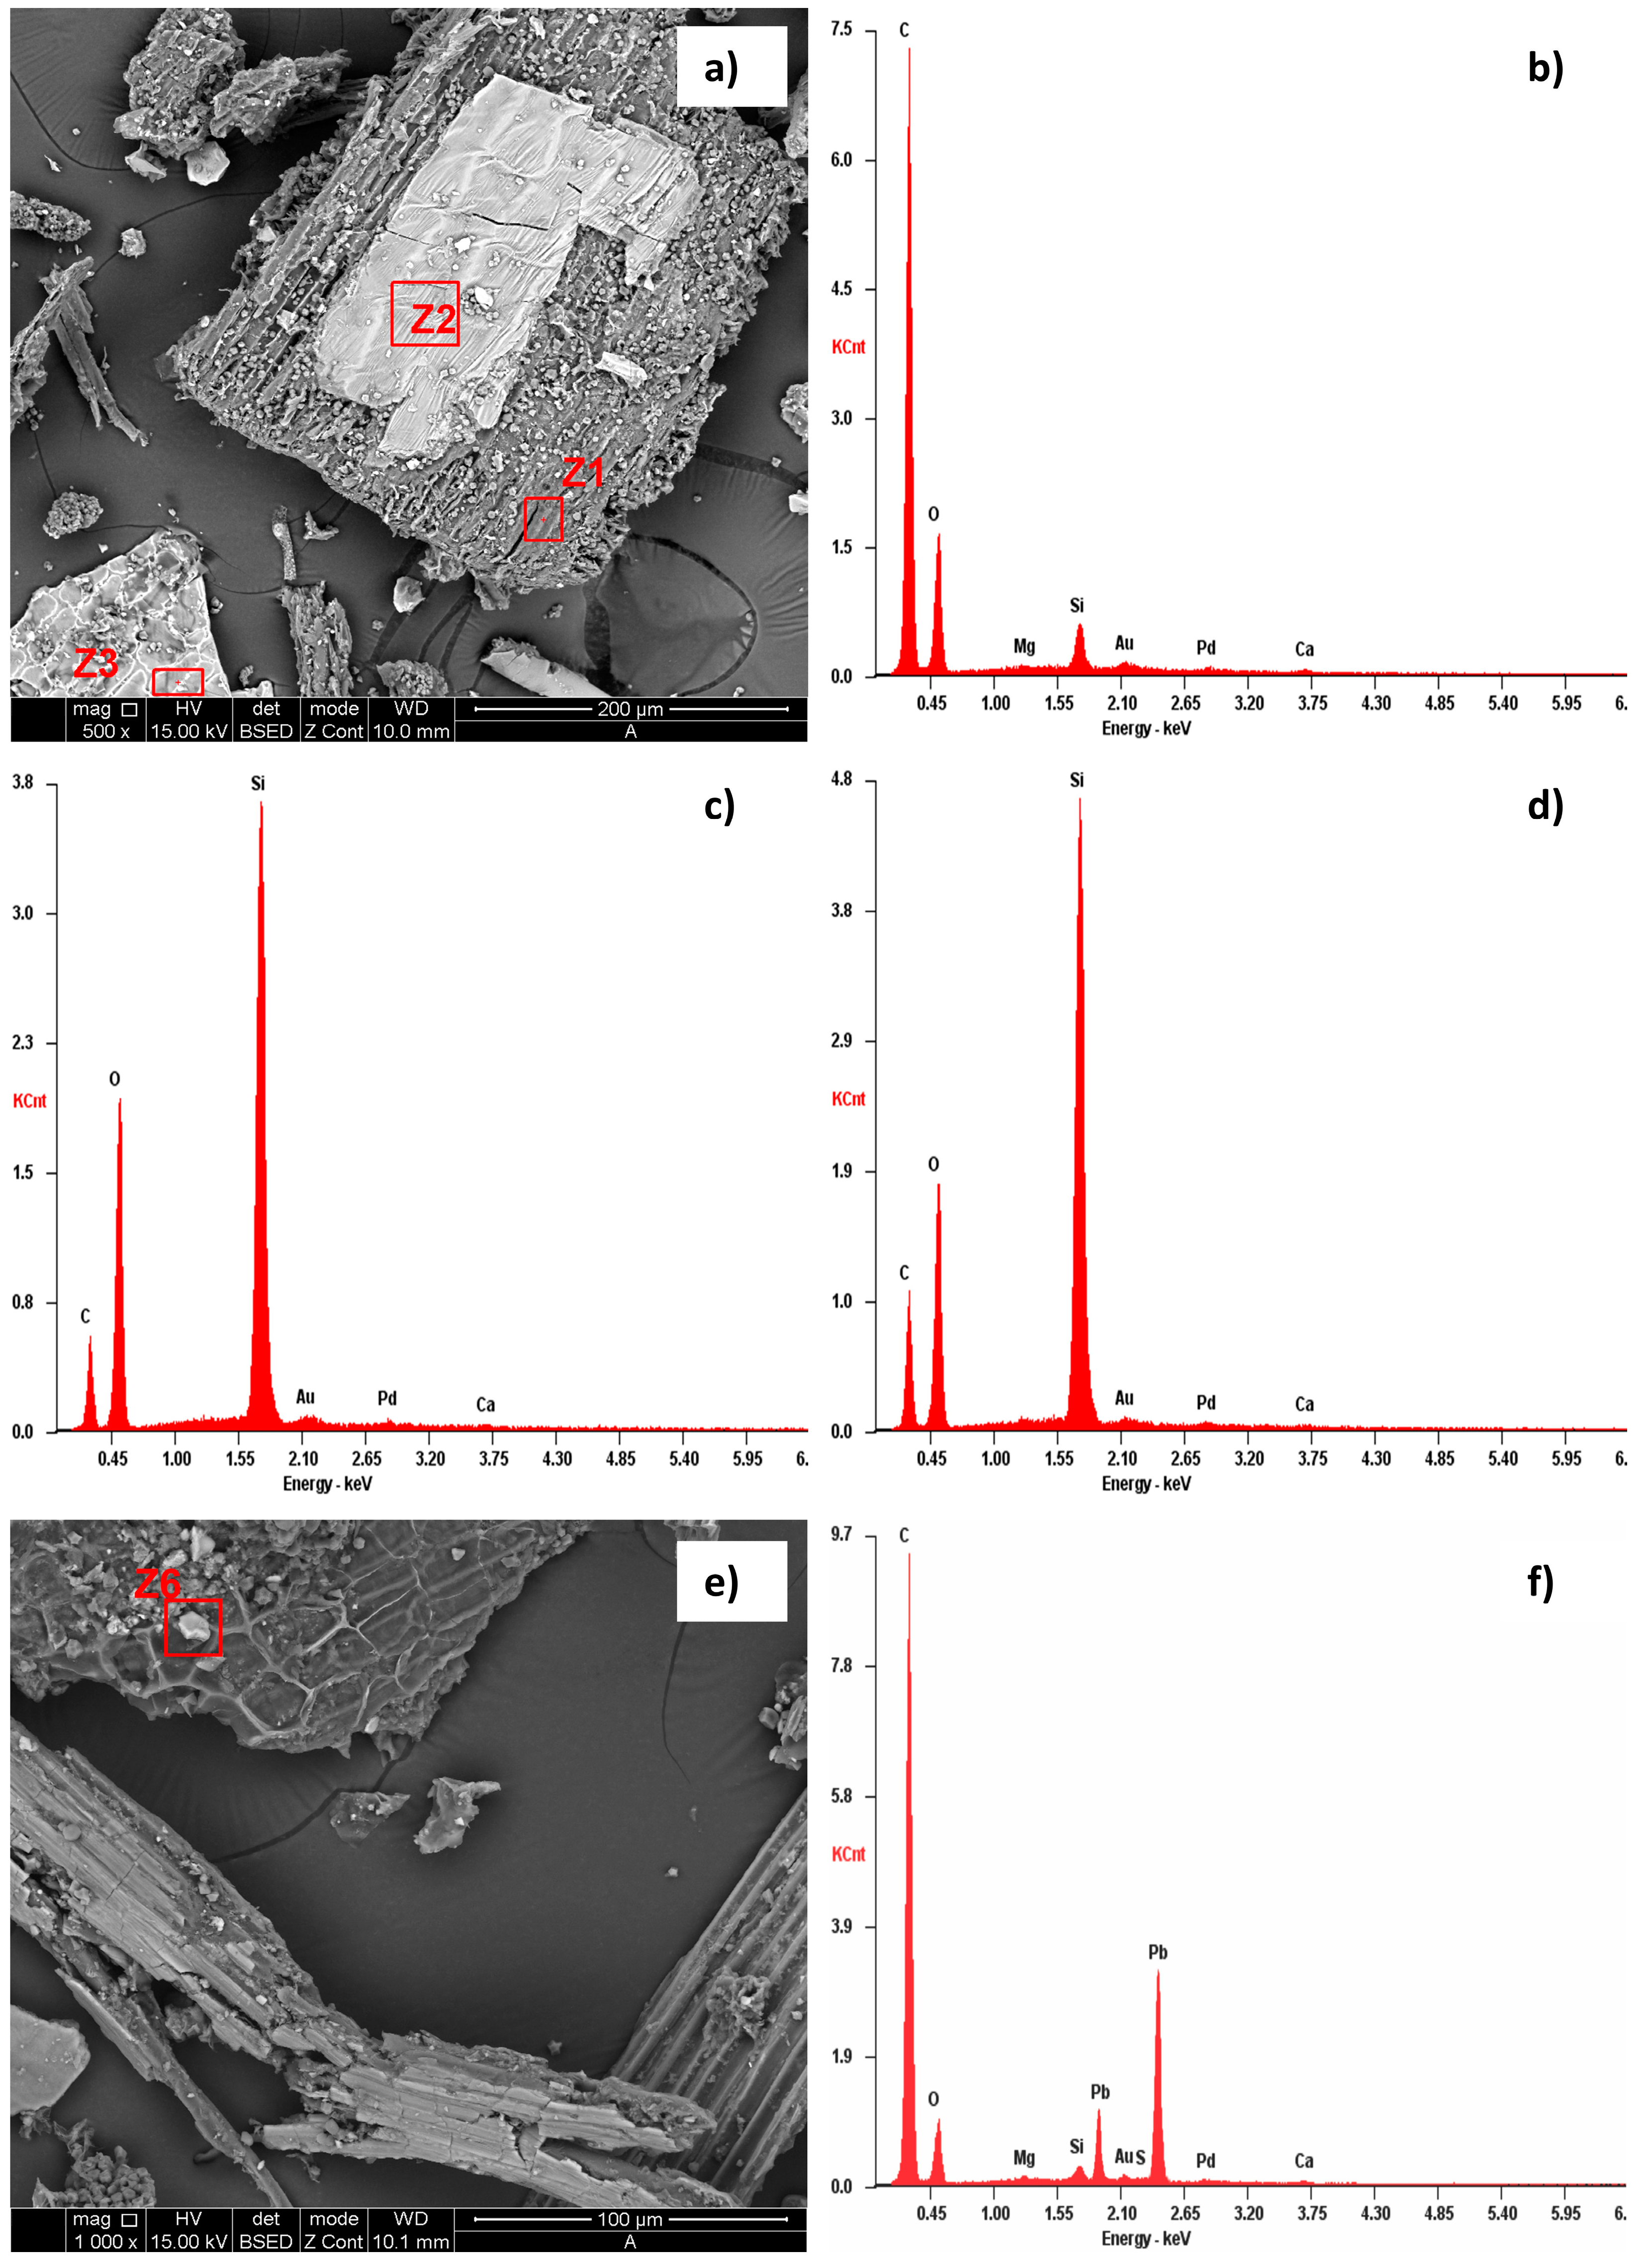
The adsorbent morphology was determined through the study of the micrograph (Figure 2a,e) obtained from SEM analysis. Irregular and rectangular fragments were observed, in the form of a skeletal structure, with the presence of linear fibers with pore-shaped holes. Positive energy spectrograms with X-ray microanalysis (EDX), obtained from SEM micrographs, show that TSH has regions with a high presence of C (darker fragments (Figure 2b; Z1)) and high proportions of Si and O (Figure 2c,d; Z2 and Z3). The high presence of Si in TSH is due to the high abundance of this mineral in the earth’s crust, which is absorbed by plants and distributed mainly in the fruit peel. The C content is mainly due to the organic constitution of the plant with the presence of lignin, cellulose, and hemicellulose. In addition, the presence of various functional groups that have an affinity for metal complexation can be related, in many cases, in a nonselective manner, which favors Pb2+ adsorption. For this reason, the presence of Pb2+ on the adsorbent after adsorption was verified by EDX (Figure 2f; Z6). This behavior has been reported by different investigations using spectroscopic techniques that facilitate the complexation of metals [23].
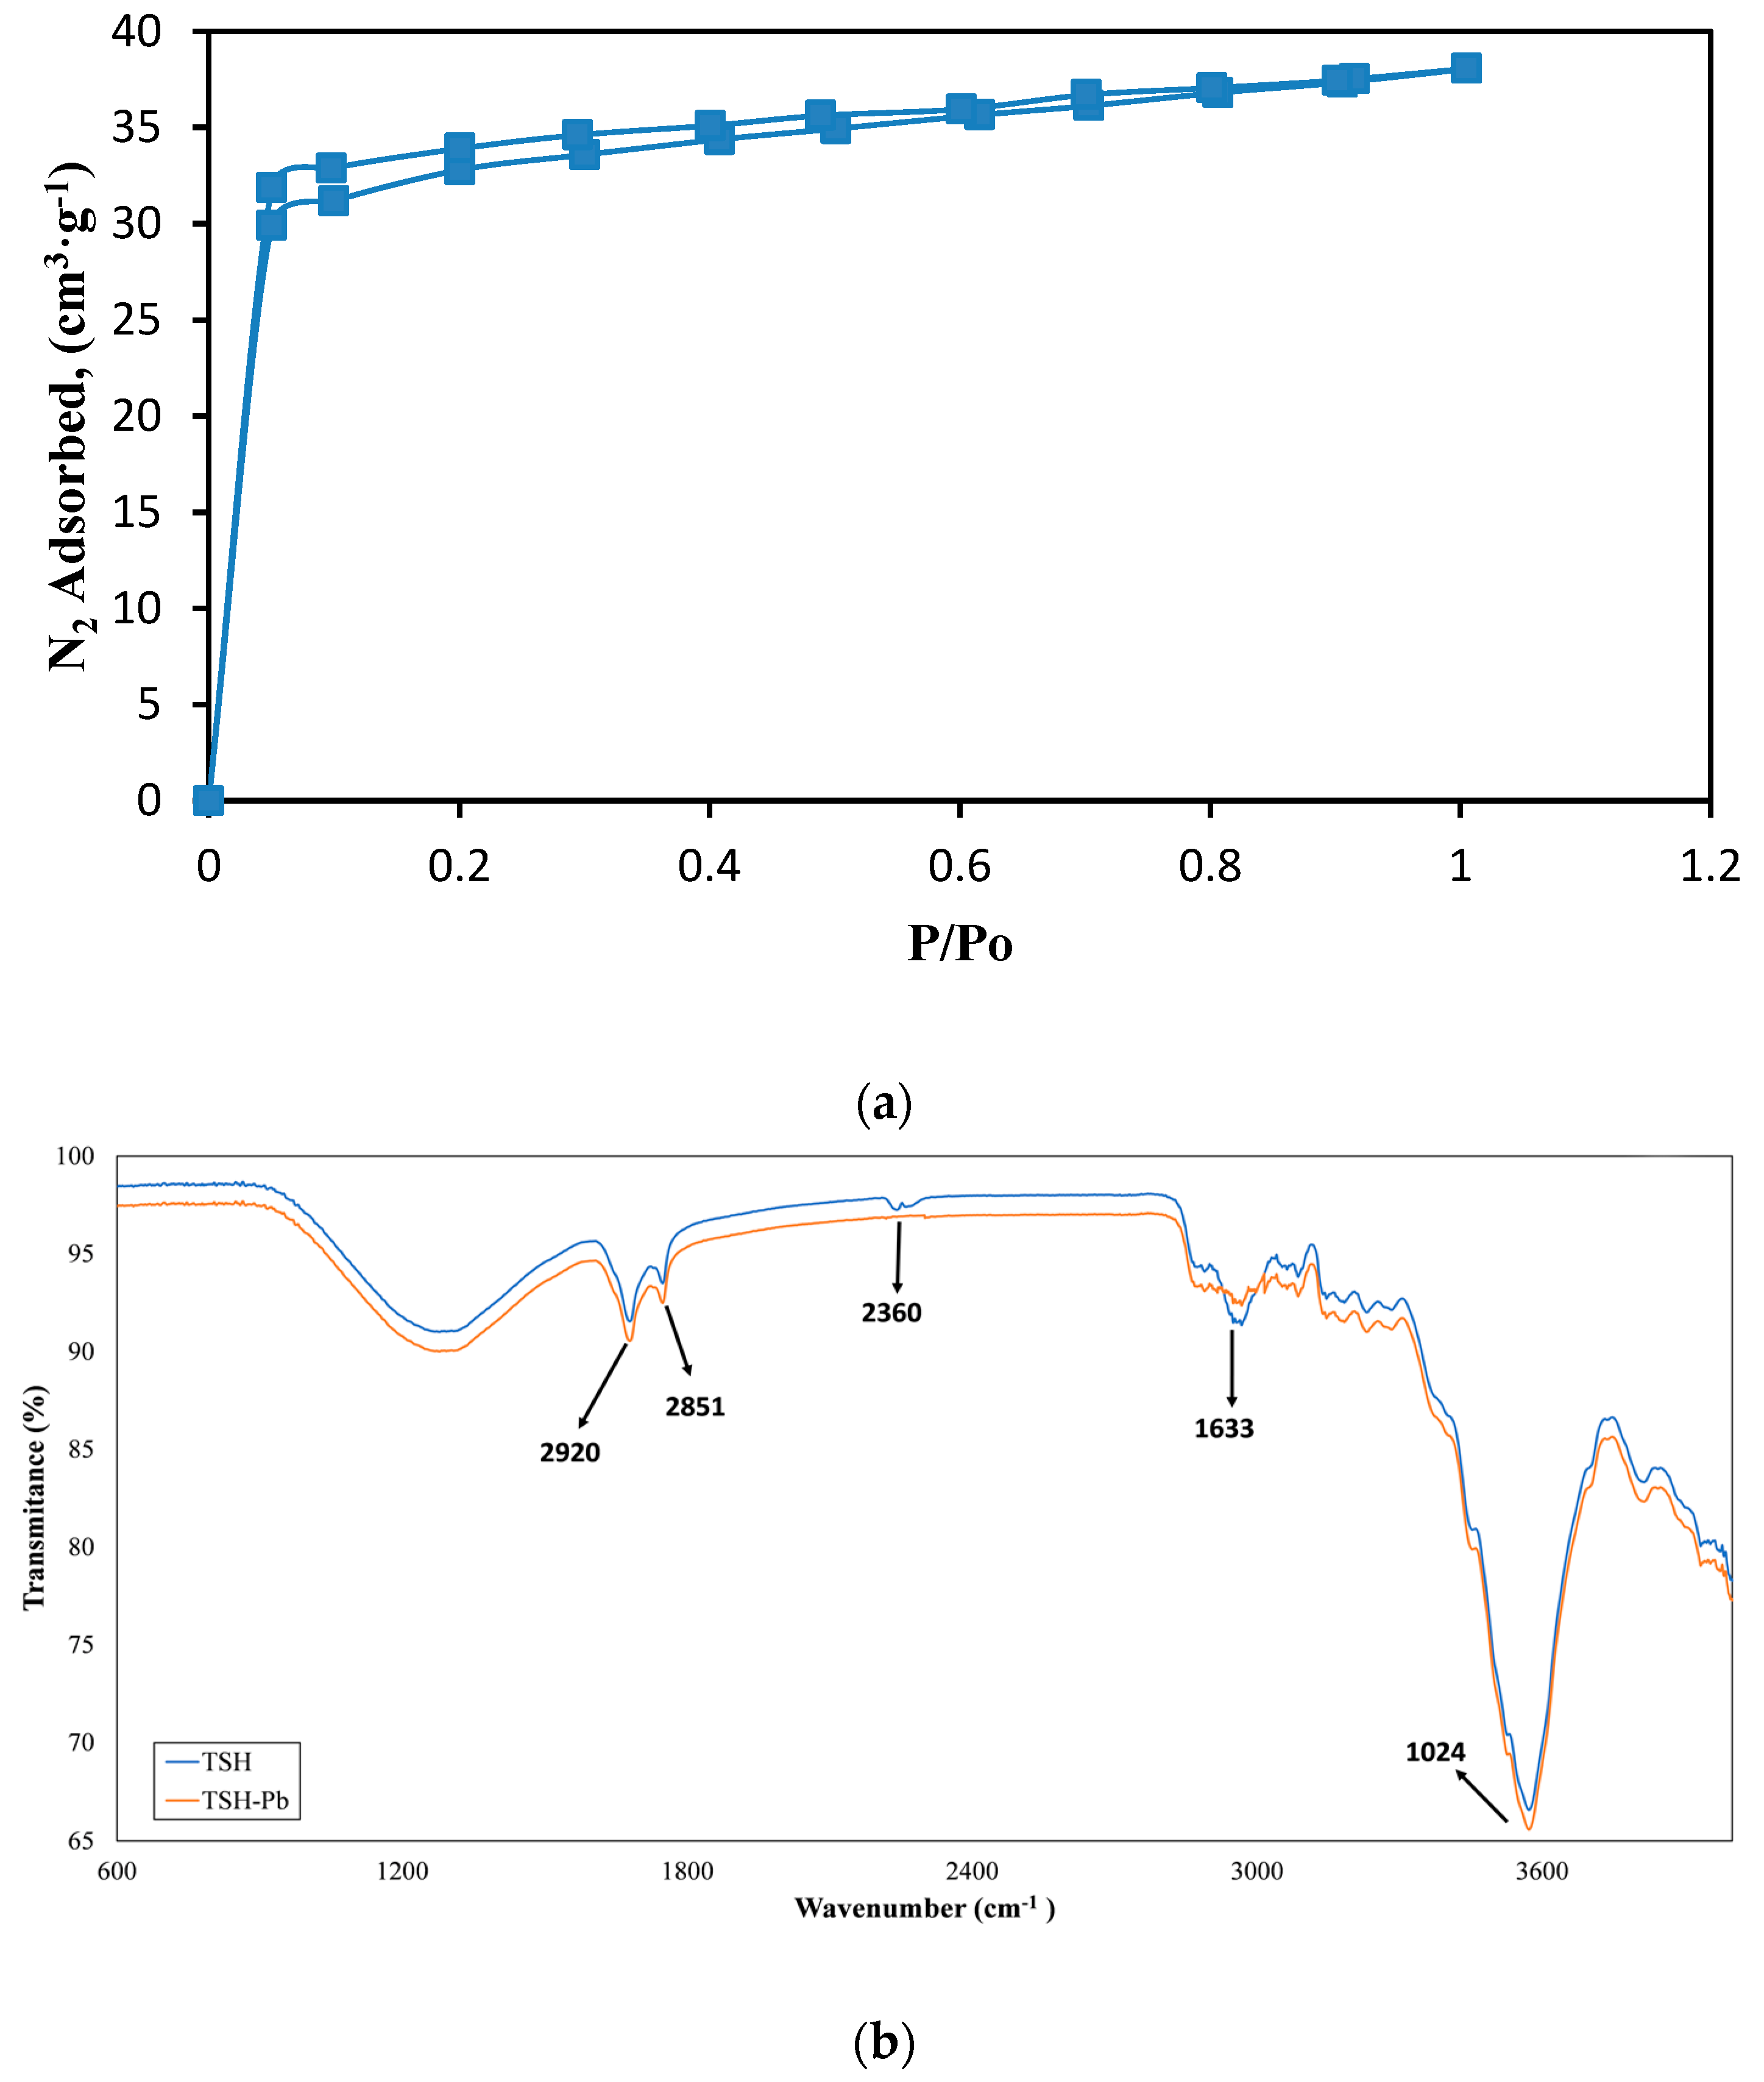
The BET adsorption/desorption isotherms (Figure 3a) obtained by nitrogen physisorption showed a behavior corresponding to type IV, according to Brunauer’s classification [24], typical of mesoporous materials. The high surface area determined, with a value of 100.58 m2·g−1, is due to the high content of organic matter present in TSH.
On the other hand, the FTIR spectra of TSH and TSH-Pb(II) are shown in Figure 3b. For this, the functional groups interacting in the adsorption were recognized. The FTIR revealed a band between 3000 and 3700 cm−1, indicating the presence of hydrogen-bonded free OH groups and Si–OH groups on the surface of the adsorbent. After adsorption, this band showed a small stretching, related to the stretching of the OH band of the Si–OH group and the water adsorbed on the surface [25]. The peaks at 2920 and 2851 cm−1 were related to the stretching of the OH groups attached to methyl radicals. The peak at 2360 cm−1 was associated with the stretching of the –OH or C=O group of carboxylic acid. Then in TSH-Pb(II), this peak disappeared, showing the possible interaction of these groups with Pb(II). The peak at 1633 cm−1 in TSH confirmed the stretching of (–CO). However, it decreased at TSH-Pb(II), revealing the complex nature of the adsorption [26]. Finally, the stretching of the band at 1024 cm−1 could be assigned to the C–O of alcohols and carboxylic acids associated with the charge with the metal.

3.2. Effect of pH in Solution

Figure 4 shows the distribution diagram of lead in solution as a function of the pH for the concentration ranges studied (20−140 mg·L−1). It can be observed that for a pH lower than 6.1 the Pb2+ species remained constant. From pH 6.1 (lower concentration) and pH 5.7 (higher concentration), it can be observed that lead begins to precipitate forming Pb(OH)2; this suggests that the process should be carried out at a pH lower than 5.7 to avoid the coexistence of two phenomena: adsorption and precipitation. This can be corroborated by several other lead biosorption studies where results were obtained at a pH between 4 and 5.5 [27,28,29]. Based on the above, it was decided to use a pH of 5 for the following tests.

3.3. Adsorbent Dose

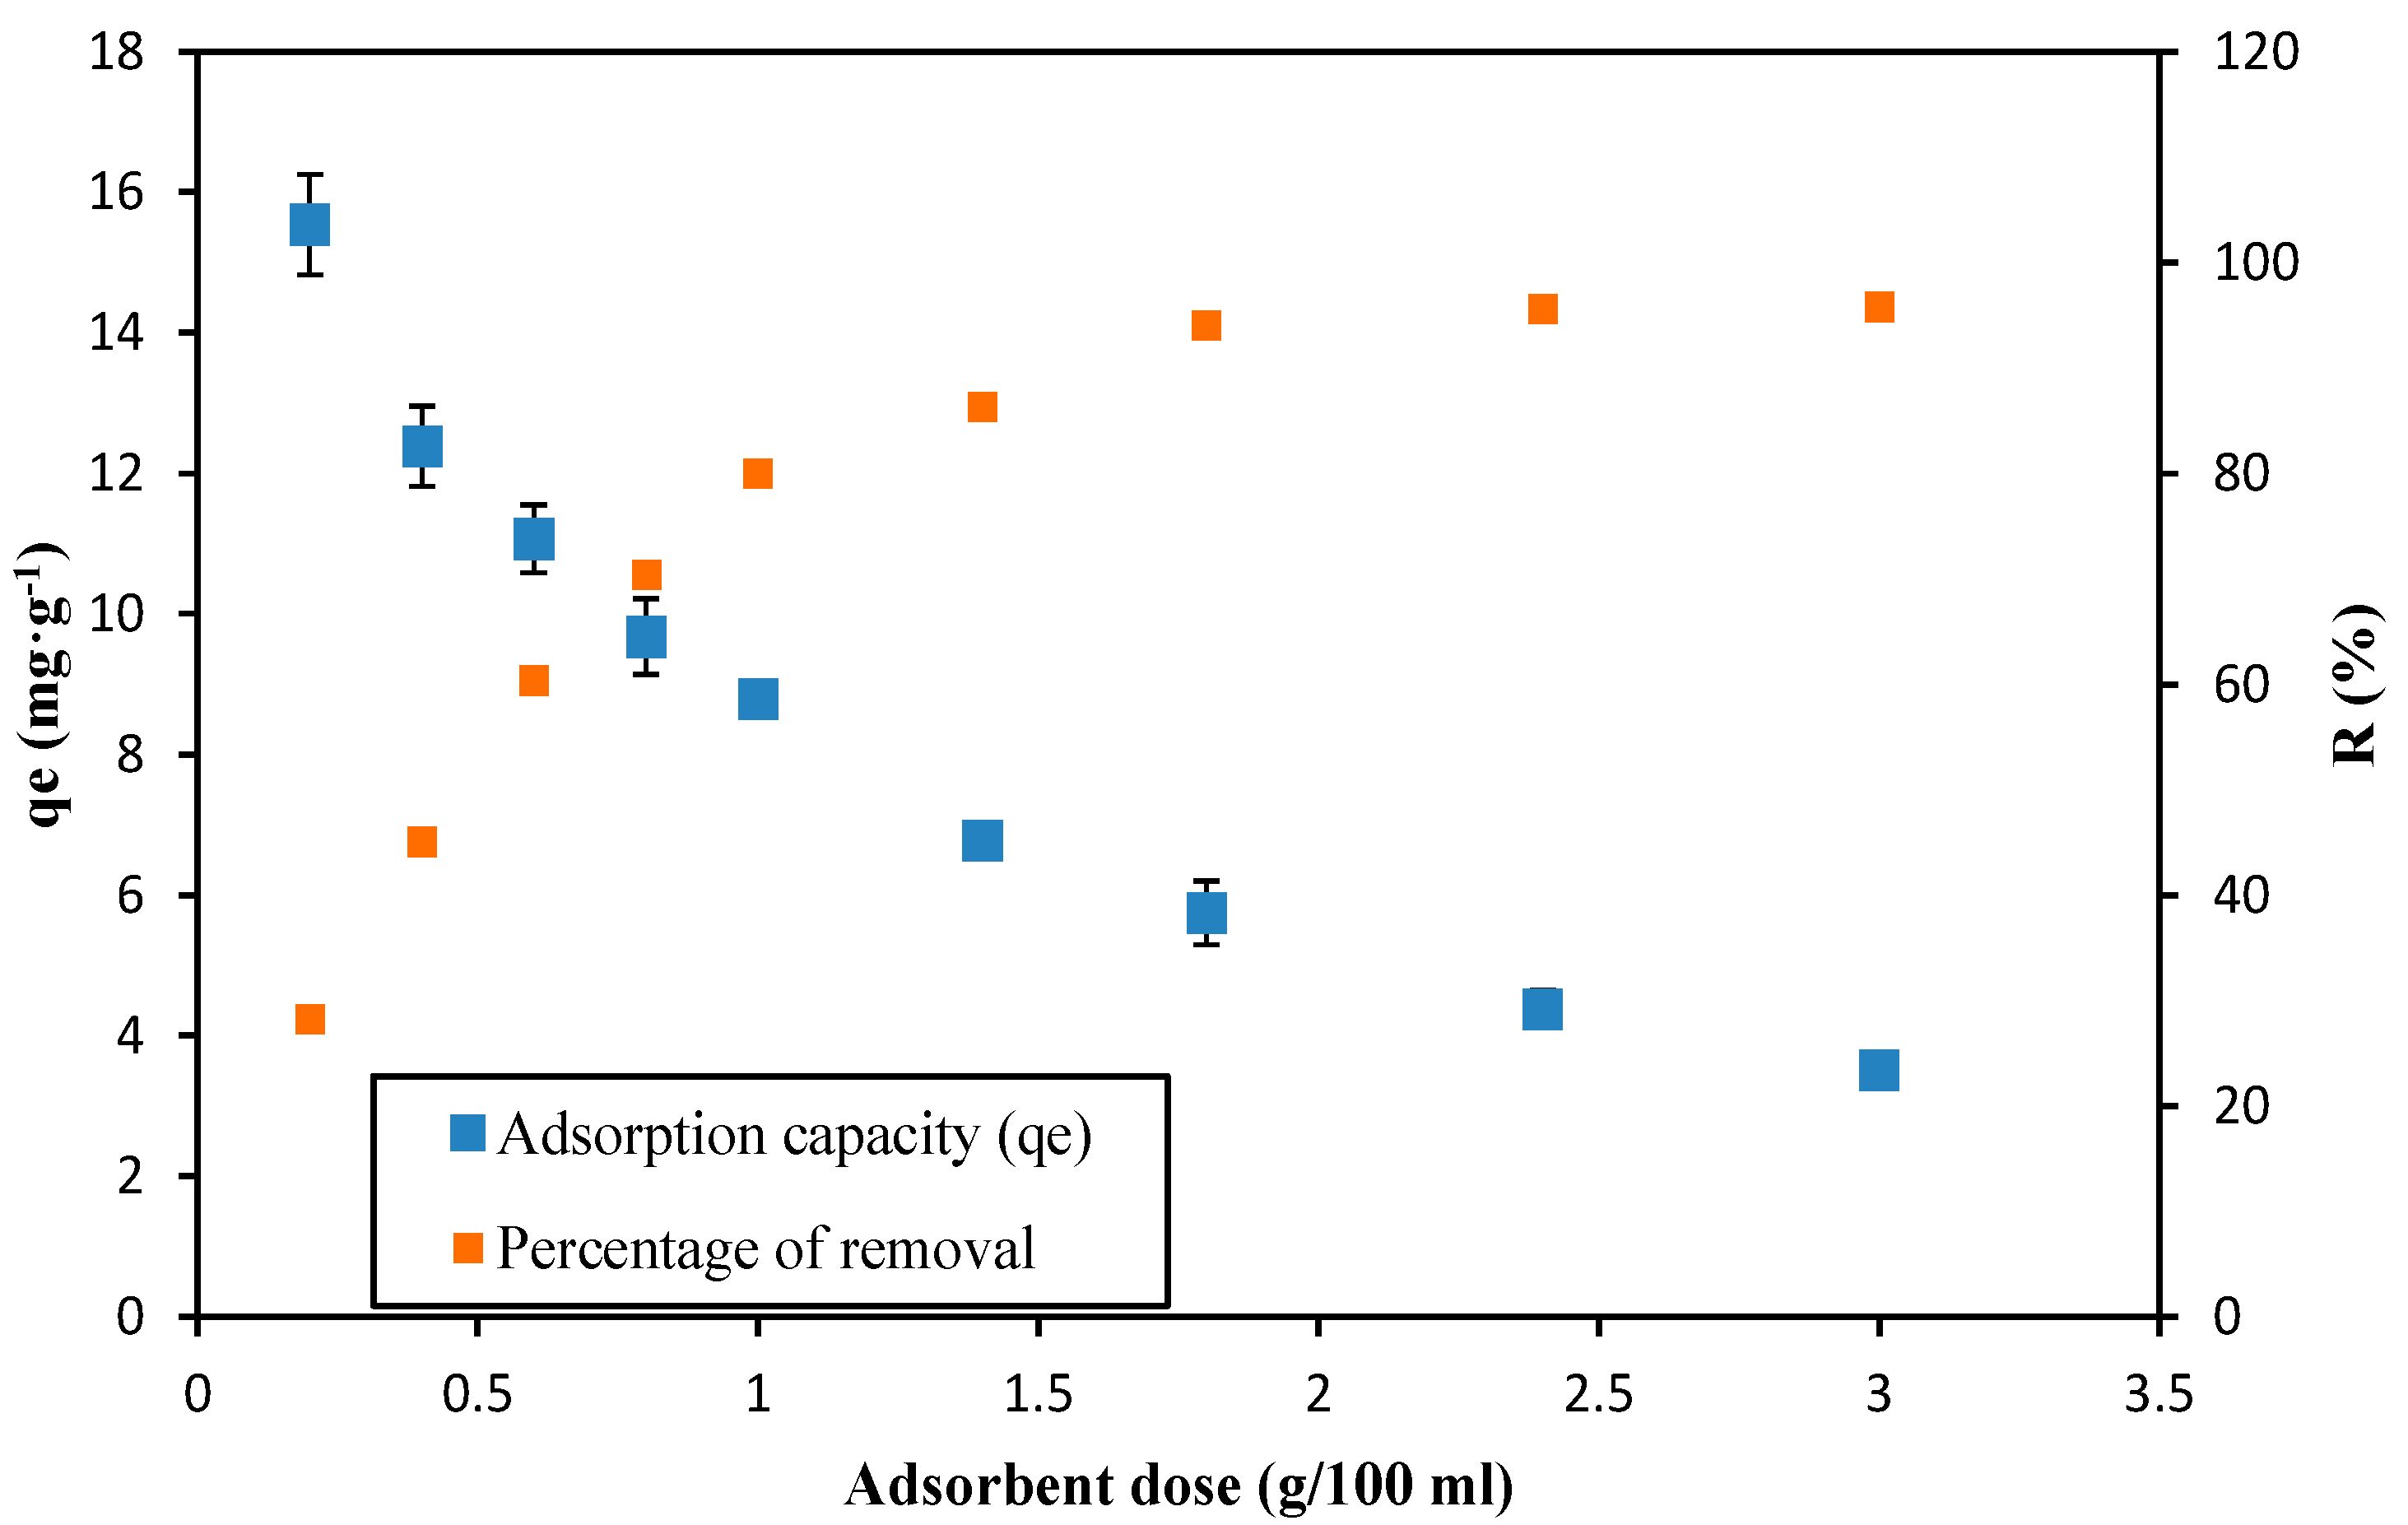
Upon analyzing the adsorption capacity as a function of adsorbent dose (w) (Figure 5), in the range between 0.2 and 0.8 g/100 mL, there is a marked decrease in adsorption capacity, which subsequently remains constant. In numerical terms, 0.2 g/100 mL would indicate that this is the appropriate dose since it represents the highest adsorption capacity among the doses used. However, this represents an error of analysis due to the fact that Equation (1) contains w as the denominator, and when values < 1 are applied, the results will be higher [16]. This behavior can be corroborated by analyzing the R(%) curve, where it is clearly shown that the removal of Pb(II) is directly proportional to the increase in the dose used. Starting at 1.8 g of adsorbent, adsorbate removal did not vary significantly concerning higher amounts of biomass, which is why this amount was considered the appropriate dose for the following tests.

3.4. Contact Time

Figure 6 shows how lead removal increases as time passes. In the first 15 min of contact, adsorption occurred rapidly, removing about 90% of the lead. From this point on, the process occurred slowly until it reached equilibrium after 60 min, removing up to 96% of the metal.

3.5. Adsorption Kinetics

The kinetic models used were the pseudo-first order, pseudo-second order, Elovich, Bangham, and intraparticle diffusion models. The parameters and fits of the kinetic models used are shown in Table 1 and Figure 7. The choice of the model that best fit the experimental data was made using the coefficient of determination (R2) and the chi-square (X2).
The pseudo-first order, Elovich, and Bangham models presented an R2 value of 0.7915, 0.8904, and 0.8402 respectively, which were less than 0.9. Likewise, they presented a high X2 value compared to the pseudo-second order model. Therefore, the pseudo-second order model was the best fit to the experimental data, presenting an R2 of 0.9736. The fit to this model suggests that the removal mechanism is by chemisorption which implies the formation of chemical bonds between the adsorbate molecules and the adsorbent surface [30]. These results agree with studies conducted by Jeyakumar and Chandrasekaran [28] and Qaiser et al. [31], who used marine green algae and Ficus religiosa leaves, respectively, for the removal of lead ions and whose data were fit to the pseudo-second order model.
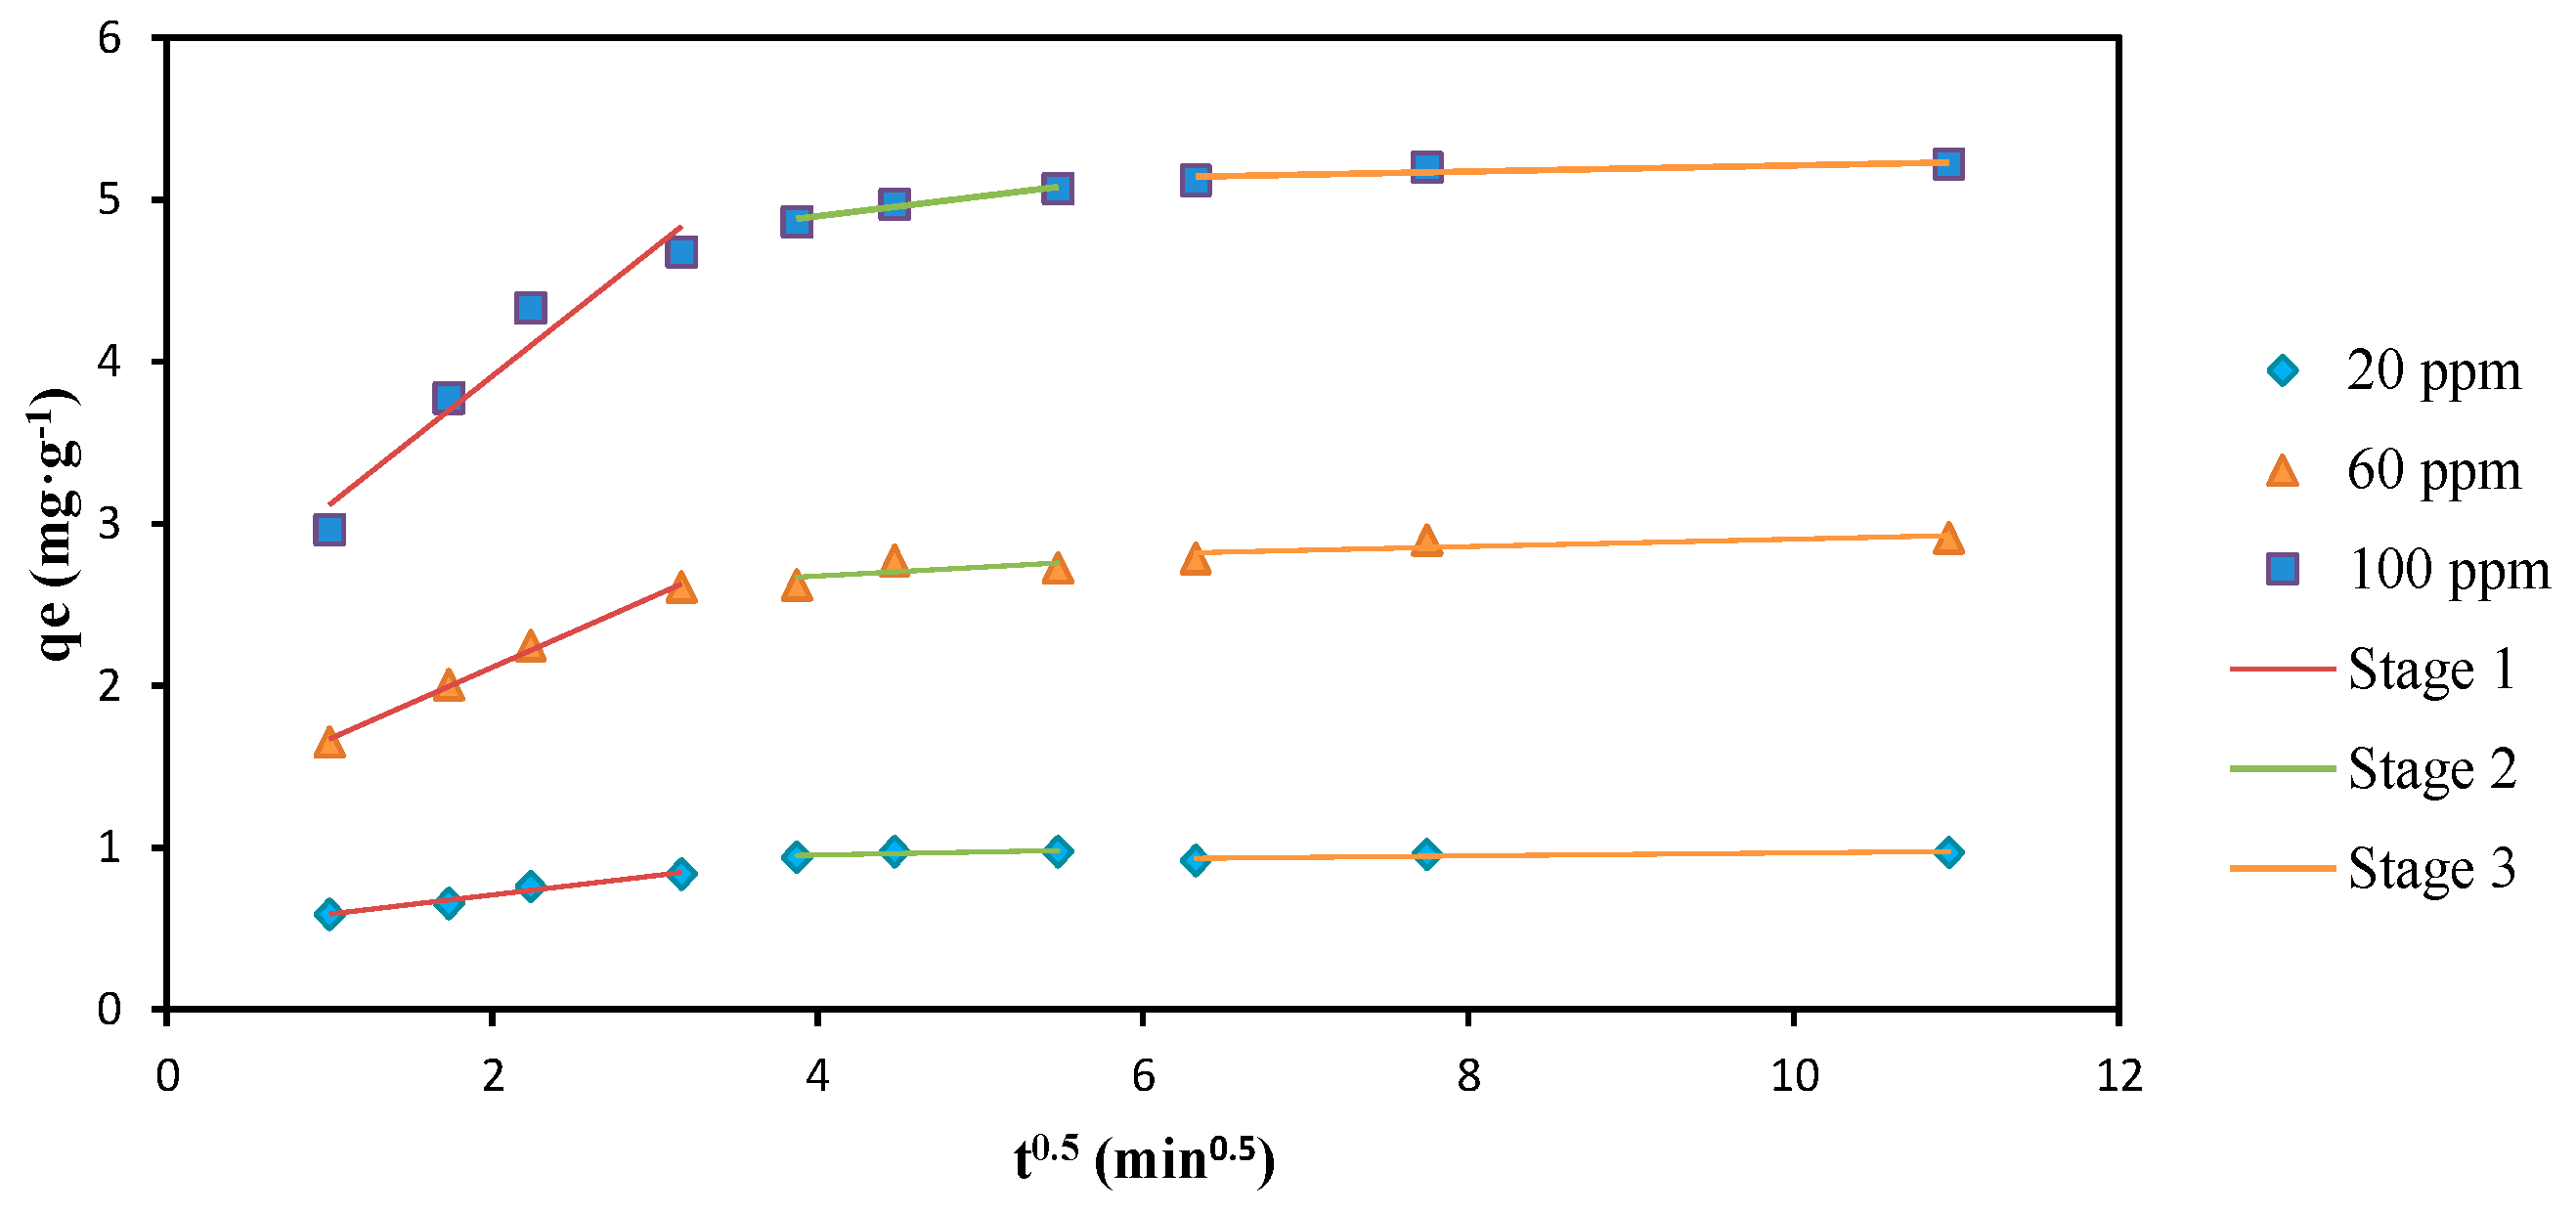
To obtain a better interpretation of the adsorption mechanism of the process, the Weber–Morris intraparticle diffusion model was used. The graphical representation of this model (qt vs. t0.5) is given by three stages with a linear relationship and establishes that if any of these stages passes or is projected toward the origin of the graph, intraparticle diffusion will be the limiting stage of the process. However, if none of the stages meets this condition or if there is multilinearity in the experimental data, the adsorption process can be controlled by several steps or a combination of them [17].
Figure 8 shows that all the stages behave in a linear way, and none passes through the origin, which means that intraparticle diffusion is not the limiting stage that controls the adsorption process. Despite this, this model allows us to describe the predominant mechanism by making an individual analysis for each stage. Through the values of the coefficients of determination R2 and the diffusion constant Kdif of the first and second stages (Table 1), it can be indicated that the present adsorption process also has pore diffusion as a mechanism. Thus, there is a mass transfer or diffusion of Pb(II) from the solution to the adsorbent film and diffusion of Pb(II) over the pores of the adsorbent. On the other hand, the increase in C values from one stage to the other indicates that there is a greater effect on the boundary layer.

3.6. Adsorption Isotherms

To optimize the design of the adsorption system, it is important to establish the most appropriate correlation. At this stage, the equilibrium study was carried out at different temperatures of 288, 298, 308, and 318 K. For their analysis, the Langmuir, Freundlich, Toth, Redlich–Peterson, and Sips models were applied, whose parameters and adjustments are shown in Table 2 and Figure 9. All models had a good fit to the experimental data at all temperatures studied; however, the best fit compared to the others were the Langmuir and Sips models with R2 between 0.9629−0.9899 and 0.9819–0.9900, respectively. In this context, the Langmuir model indicates that in the adsorption process there is the formation of lead monolayers on the surface of the adsorbent and states that there are a finite number of identical and specific adsorption sites [32,33]. Its RL value was between 0 and 1 at all temperatures, indicating that the lead removal process has a favorable isothermal behavior. Also, it is shown that the maximum amount of adsorbed lead (qmax) was 22.0348 mg·g−1.
On the other hand, the Sips isotherm is a model that combines the Langmuir and Freundlich expressions. It is used to predict heterogeneous adsorption systems and is very similar to the Langmuir isotherm with the difference that the Sips isotherm has a finite limit for very high concentrations. The way this model works is that at low adsorbate concentrations, it reduces to the Freundlich isotherm and at high concentrations, it reduces to the Langmuir isotherm, which predicts monolayer adsorption [17]. Therefore, based on the good fit obtained, it can be confirmed that monolayers are formed on the adsorbent surface when working with high concentrations, as established by the Langmuir model. In addition, this behavior corroborates that the mechanism of diffusion in the pores exists, according to the result of the Weber–Morris model.

3.7. Adsorption Thermodynamics

Thermodynamic parameters such as Gibbs free energy (ΔG°), enthalpy (ΔH°), and entropy (ΔS°) obtained from Langmuir and Sips constants are shown in Table 3. The ΔG° was obtained from the Van ’t Hoff equation, which also allowed us to obtain ΔH° and ΔS by graphing LnK vs. 1/T. It can be observed that the value of ΔG° decreases as the temperature increases, indicating that the lead adsorption process on TSH is spontaneous and thermodynamically stable. The positive value of ΔH° in both the Langmuir and Sips models indicates that the adsorption process is naturally endothermic. This result can be reaffirmed with the research conducted by Sekar et al. [34] and Ghahremani et al. [35], who used activated carbon prepared from coconut shell and nano Tricalcium phosphate, respectively, for the removal of lead ions from aqueous solutions and whose positive ΔH° values showed that the process exhibits an endothermic nature. Finally, the positive values of ΔS° indicate that there is an increase in randomness at the solute–liquid interface as the temperature increases. Furthermore, having positive ΔS° indicates that there is an increase in the degrees of freedom of the adsorbed species, and thus the high ΔS° indicates that there is a strong preference of Pb(II) for the adsorbent surface, suggesting the possibility of some structural change or rearrangement in the Pb(II)/TSH adsorption complex during the adsorption process.

4. Conclusions

The results demonstrate that TSH, a byproduct of the handcrafted jewelry industry, can be used as an economical, selective, and efficient adsorbent for the treatment of wastewater contaminated with Pb(II). Residual TSH used in the present study was efficient for the adsorption of Pb(II) in aqueous media; using a minimum amount of adsorbent, it achieved a removal rate close to 96% in 60 min. The good fit of the experimental data with the pseudo-second order model and the multilinearity in the intraparticle diffusion of the Weber–Morris model, indicated that the predominant mechanisms of the system were chemisorption and film and pore diffusion, respectively. Through the equilibrium study, it was determined that the Langmuir and Sips isotherms had the best fits to the experimental data, indicating that in the adsorption process, adsorbate–adsorbent monolayer formation occurs. In this context, as a result of the good fit of the Langmuir and Sips isotherms, the thermodynamic equilibrium of the system was described with good accuracy, representing positive enthalpies that demonstrate that the process is endothermic, spontaneous, and thermodynamically stable.

Author Contributions

Writing—original draft preparation, G.A.C.-P. and A.B.B.-G.; writing—review and editing, L.A.Z.-I., N.R.M., L.S.Q.-F., R.J.B.-C. and J.M.R.-D. All authors have read and agreed to the published version of the manuscript.

Funding

This research received no external funding.

Institutional Review Board Statement

Not applicable.

Informed Consent Statement

Not applicable.

Data Availability Statement

The data presented in this study are available on request from the corresponding author.

Acknowledgments

To the UNIVERSIDAD TÉCNICA DE MANABÍ for financing the Project “Evaluación del uso de biomasas para la remediación de contaminantes ambientales” PYT235-CONV2019-FCMFQ0018.

Conflicts of Interest

The authors declare no conflict of interest.

References

  1. Barakat, M.A. New trends in removing heavy metals from industrial wastewater. Arab. J. Chem. 2011, 4, 361–377. [Google Scholar] [CrossRef] [Green Version]
  2. EPA. Learn about Lead. Available online: https://www.epa.gov/lead/learn-about-lead (accessed on 3 November 2021).
  3. Wani, A.L.; Ara, A.; Usmani, J.A. Lead toxicity: A review. Interdiscip. Toxicol. 2015, 8, 55–64. [Google Scholar] [CrossRef] [PubMed] [Green Version]
  4. WHO. Lead Poisoning and Health. Available online: https://www.who.int/news-room/fact-sheets/detail/lead-poisoning-and-health (accessed on 3 November 2021).
  5. McCabe, W.L.; Smith, J.C.; Harriott, P. Unit Operations of Chemical Engineering, 5th ed.; McGraw-Hill: Singapore, 1993. [Google Scholar]
  6. Shamim, S. Biosorption of Heavy Metals. Biosorption 2018, 2, 21–49. [Google Scholar] [CrossRef] [Green Version]
  7. Tejada-Tovar, C.; Lopez-Cantillo, K.; Vidales-Hernandez, K.; Villabona-Ortíz, A.; Acevedo-Correa, D. Kinetics and bioadsortion equilibrium of lead and cadmium in batch systems with cocoa shell (Theobroma Cacao L.). Contemp. Eng. Sci. 2018, 11, 1111–1120. [Google Scholar] [CrossRef] [Green Version]
  8. Shekinah, P.; Kadirvelu, K.; Kanmani, P.; Senthilkumar, P.; Subburam, V. Adsorption of lead(II) from aqueous solution by activated carbon prepared from Eichhornia. J. Chem. Technol. Biotechnol. 2002, 77, 458–464. [Google Scholar] [CrossRef]
  9. Daochalermwong, A.; Chanka, N.; Songsrirote, K.; Dittanet, P.; Niamnuy, C.; Seubsai, A. Removal of Heavy Metal Ions Using Modified Celluloses Prepared from Pineapple Leaf Fiber. ACS Omega 2020, 5, 5285–5296. [Google Scholar] [CrossRef]
  10. Heraldy, E.; Lestari, W.W.; Permatasari, D.; Arimurti, D.D. Biosorbent from tomato waste and apple juice residue for lead removal. J. Environ. Chem. Eng. 2018, 6, 1201–1208. [Google Scholar] [CrossRef]
  11. Noboa Zaldumbide, M.A. Nanocelulosa de Tagua Como Agente Para Captación y Recuperación de Metales Pesados y Preciosos en Cuerpos de Agua; Pontificia Universidad Católica del Ecuador: Quito, Ecuador, 2017. [Google Scholar]
  12. Baird, R.B.; Eaton Andrew, D.; Rice Eugene, W. Standard Methods for the Examination of Water and Wastewater, 23rd ed.; American Public Health Association: Washington, DC, USA, 2017. [Google Scholar]
  13. Campos, N.F.; Barbosa, C.M.B.M.; Rodríguez-Díaz, J.M.; Duarte, M.M.M.B. Removal of naphthenic acids using activated charcoal: Kinetic and equilibrium studies. Adsorpt. Sci. Technol. 2018, 36, 1405–1421. [Google Scholar] [CrossRef] [Green Version]
  14. Rodríguez-Díaz, J.M.; García, J.O.P.; Sánchez, L.R.B.; da Silva, M.G.C.; da Silva, V.L.; Arteaga-Pérez, L.E. Comprehensive Characterization of Sugarcane Bagasse Ash for Its Use as an Adsorbent. BioEnergy Res. 2015, 8, 1885–1895. [Google Scholar] [CrossRef]
  15. Jaerger, S.; dos Santos, A.; Fernandes, A.N.; Almeida, C.A.P. Removal of p-Nitrophenol from Aqueous Solution Using Brazilian Peat: Kinetic and Thermodynamic Studies. Water Air Soil Pollut. 2015, 226, 236. [Google Scholar] [CrossRef]
  16. Andrade, C.A.; Zambrano-Intriago, L.A.; Oliveira, N.S.; Vieira, J.S.; Quiroz-Fernández, L.S.; Rodríguez-Díaz, J.M. Adsorption Behavior and Mechanism of Oxytetracycline on Rice Husk Ash: Kinetics, Equilibrium, and Thermodynamics of the Process. Water Air Soil Pollut. 2020, 231, 103. [Google Scholar] [CrossRef]
  17. Zambrano-Intriago, L.A.; Gorozabel-Mendoza, M.L.; Córdova Mosquera, A.; Delgado-Demera, M.H.; Duarte, M.M.M.B.; Rodríguez-Díaz, J.M. Kinetics, equilibrium, and thermodynamics of the blue 19 dye adsorption process using residual biomass attained from rice cultivation. Biomass Convers. Biorefinery 2020. [Google Scholar] [CrossRef]
  18. Nguyen, D.T.C.; Le, H.T.N.; Do, T.S.; Pham, V.T.; Lam Tran, D.; Ho, V.T.T.; Tran, T.V.; Nguyen, D.C.; Nguyen, T.D.; Bach, L.G.; et al. Metal-Organic Framework MIL-53(Fe) as an Adsorbent for Ibuprofen Drug Removal from Aqueous Solutions: Response Surface Modeling and Optimization. J. Chem. 2019, 2019, 5602957. [Google Scholar] [CrossRef] [Green Version]
  19. Tovar, C.; Herrera, A.; Ruiz, E. Kinetic and isotherms of biosorption of Hg(II) using citric acid treated residual materials. Ing. Y Compet. 2016, 18, 117–127. [Google Scholar] [CrossRef] [Green Version]
  20. Wang, J.; Guo, X. Adsorption isotherm models: Classification, physical meaning, application and solving method. Chemosphere 2020, 258, 127279. [Google Scholar] [CrossRef] [PubMed]
  21. Xie, A.; Dai, J.; Chen, X.; He, J.; Chang, Z.; Yan, Y.; Li, C. Hierarchical porous carbon materials derived from a waste paper towel with ultrafast and ultrahigh performance for adsorption of tetracycline. RSC Adv. 2016, 6, 72985–72998. [Google Scholar] [CrossRef]
  22. Ambaye, T.G.; Vaccari, M.; van Hullebusch, E.D.; Amrane, A.; Rtimi, S. Mechanisms and adsorption capacities of biochar for the removal of organic and inorganic pollutants from industrial wastewater. Int. J. Environ. Sci. Technol. 2021, 18, 3273–3294. [Google Scholar] [CrossRef]
  23. Sud, D.; Mahajan, G.; Kaur, M.P. Agricultural waste material as potential adsorbent for sequestering heavy metal ions from aqueous solutions—A review. Bioresour. Technol. 2008, 99, 6017–6027. [Google Scholar] [CrossRef]
  24. Brunauer, S.; Emmett, P.H.; Teller, E. Adsorption of Gases in Multimolecular Layers. J. Am. Chem. Soc. 1938, 60, 309–319. [Google Scholar] [CrossRef]
  25. Lakshmi, U.R.; Srivastava, V.C.; Mall, I.D.; Lataye, D.H. Rice husk ash as an effective adsorbent: Evaluation of adsorptive characteristics for Indigo Carmine dye. J. Environ. Manag. 2009, 90, 710–720. [Google Scholar] [CrossRef]
  26. Riyap, H.I.; Bewa, C.N.; Banenzoué, C.; Tchakouté, H.K.; Rüscher, C.H.; Kamseu, E.; Bignozzi, M.C.; Leonelli, C. Microstructure and mechanical, physical and structural properties of sustainable lightweight metakaolin-based geopolymer cements and mortars employing rice husk. J. Asian Ceram. Soc. 2019, 7, 199–212. [Google Scholar] [CrossRef] [Green Version]
  27. Alghamdi, A.A.; Al-Odayni, A.-B.; Saeed, W.S.; Al-Kahtani, A.; Alharthi, F.A.; Aouak, T. Efficient Adsorption of Lead (II) from Aqueous Phase Solutions Using Polypyrrole-Based Activated Carbon. Materials 2019, 12, 2020. [Google Scholar] [CrossRef] [PubMed] [Green Version]
  28. Jeyakumar, R.P.S.; Chandrasekaran, V. Adsorption of lead (II) ions by activated carbons prepared from marine green algae: Equilibrium and kinetics studies. Int. J. Ind. Chem. 2014, 5, 10. [Google Scholar] [CrossRef] [Green Version]
  29. Salihi, I.U.; Kutty, S.R.M.; Isa, M.H. Adsorption of Lead ions onto Activated Carbon derived from Sugarcane bagasse. IOP Conf. Ser. Mater. Sci. Eng. 2017, 201, 012034. [Google Scholar] [CrossRef]
  30. Staroń, P.; Płecka, A.; Chwastowski, J. Lead Sorption by Chrysanthemum indicum: Equilibrium, Kinetic, and Desorption Studies. Water Air Soil Pollut. 2021, 232, 22. [Google Scholar] [CrossRef]
  31. Qaiser, S.; Saleemi, A.R.; Umar, M. Biosorption of lead from aqueous solution by Ficus religiosa leaves: Batch and column study. J. Hazard. Mater. 2009, 166, 998–1005. [Google Scholar] [CrossRef] [PubMed]
  32. Kul, A.R.; Caliskan, N. Equilibrium and Kinetic Studies of the Adsorption of Zn(II) Ions onto Natural and Activated Kaolinites. Adsorpt. Sci. Technol. 2009, 27, 85–105. [Google Scholar] [CrossRef] [Green Version]
  33. Chwastowski, J.; Staroń, P. Influence of Saccharomyces cerevisiae yeast cells immobilized on Cocos nucifera fibers for the adsorption of Pb(II) ions. Colloids Surf. A Physicochem. Eng. Asp. 2022, 632, 127735. [Google Scholar] [CrossRef]
  34. Sekar, M.; Sakthi, V.; Rengaraj, S. Kinetics and equilibrium adsorption study of lead(II) onto activated carbon prepared from coconut shell. J. Colloid Interface Sci. 2004, 279, 307–313. [Google Scholar] [CrossRef]
  35. Ghahremani, D.; Mobasherpour, I.; Mirhosseini, S.A. Sorption thermodynamic and kinetic studies of Lead removal from aqueous solutions by nano Tricalcium phosphate. Bull. Soc. R. Sci. Liege 2017, 86, 96–112. [Google Scholar] [CrossRef]
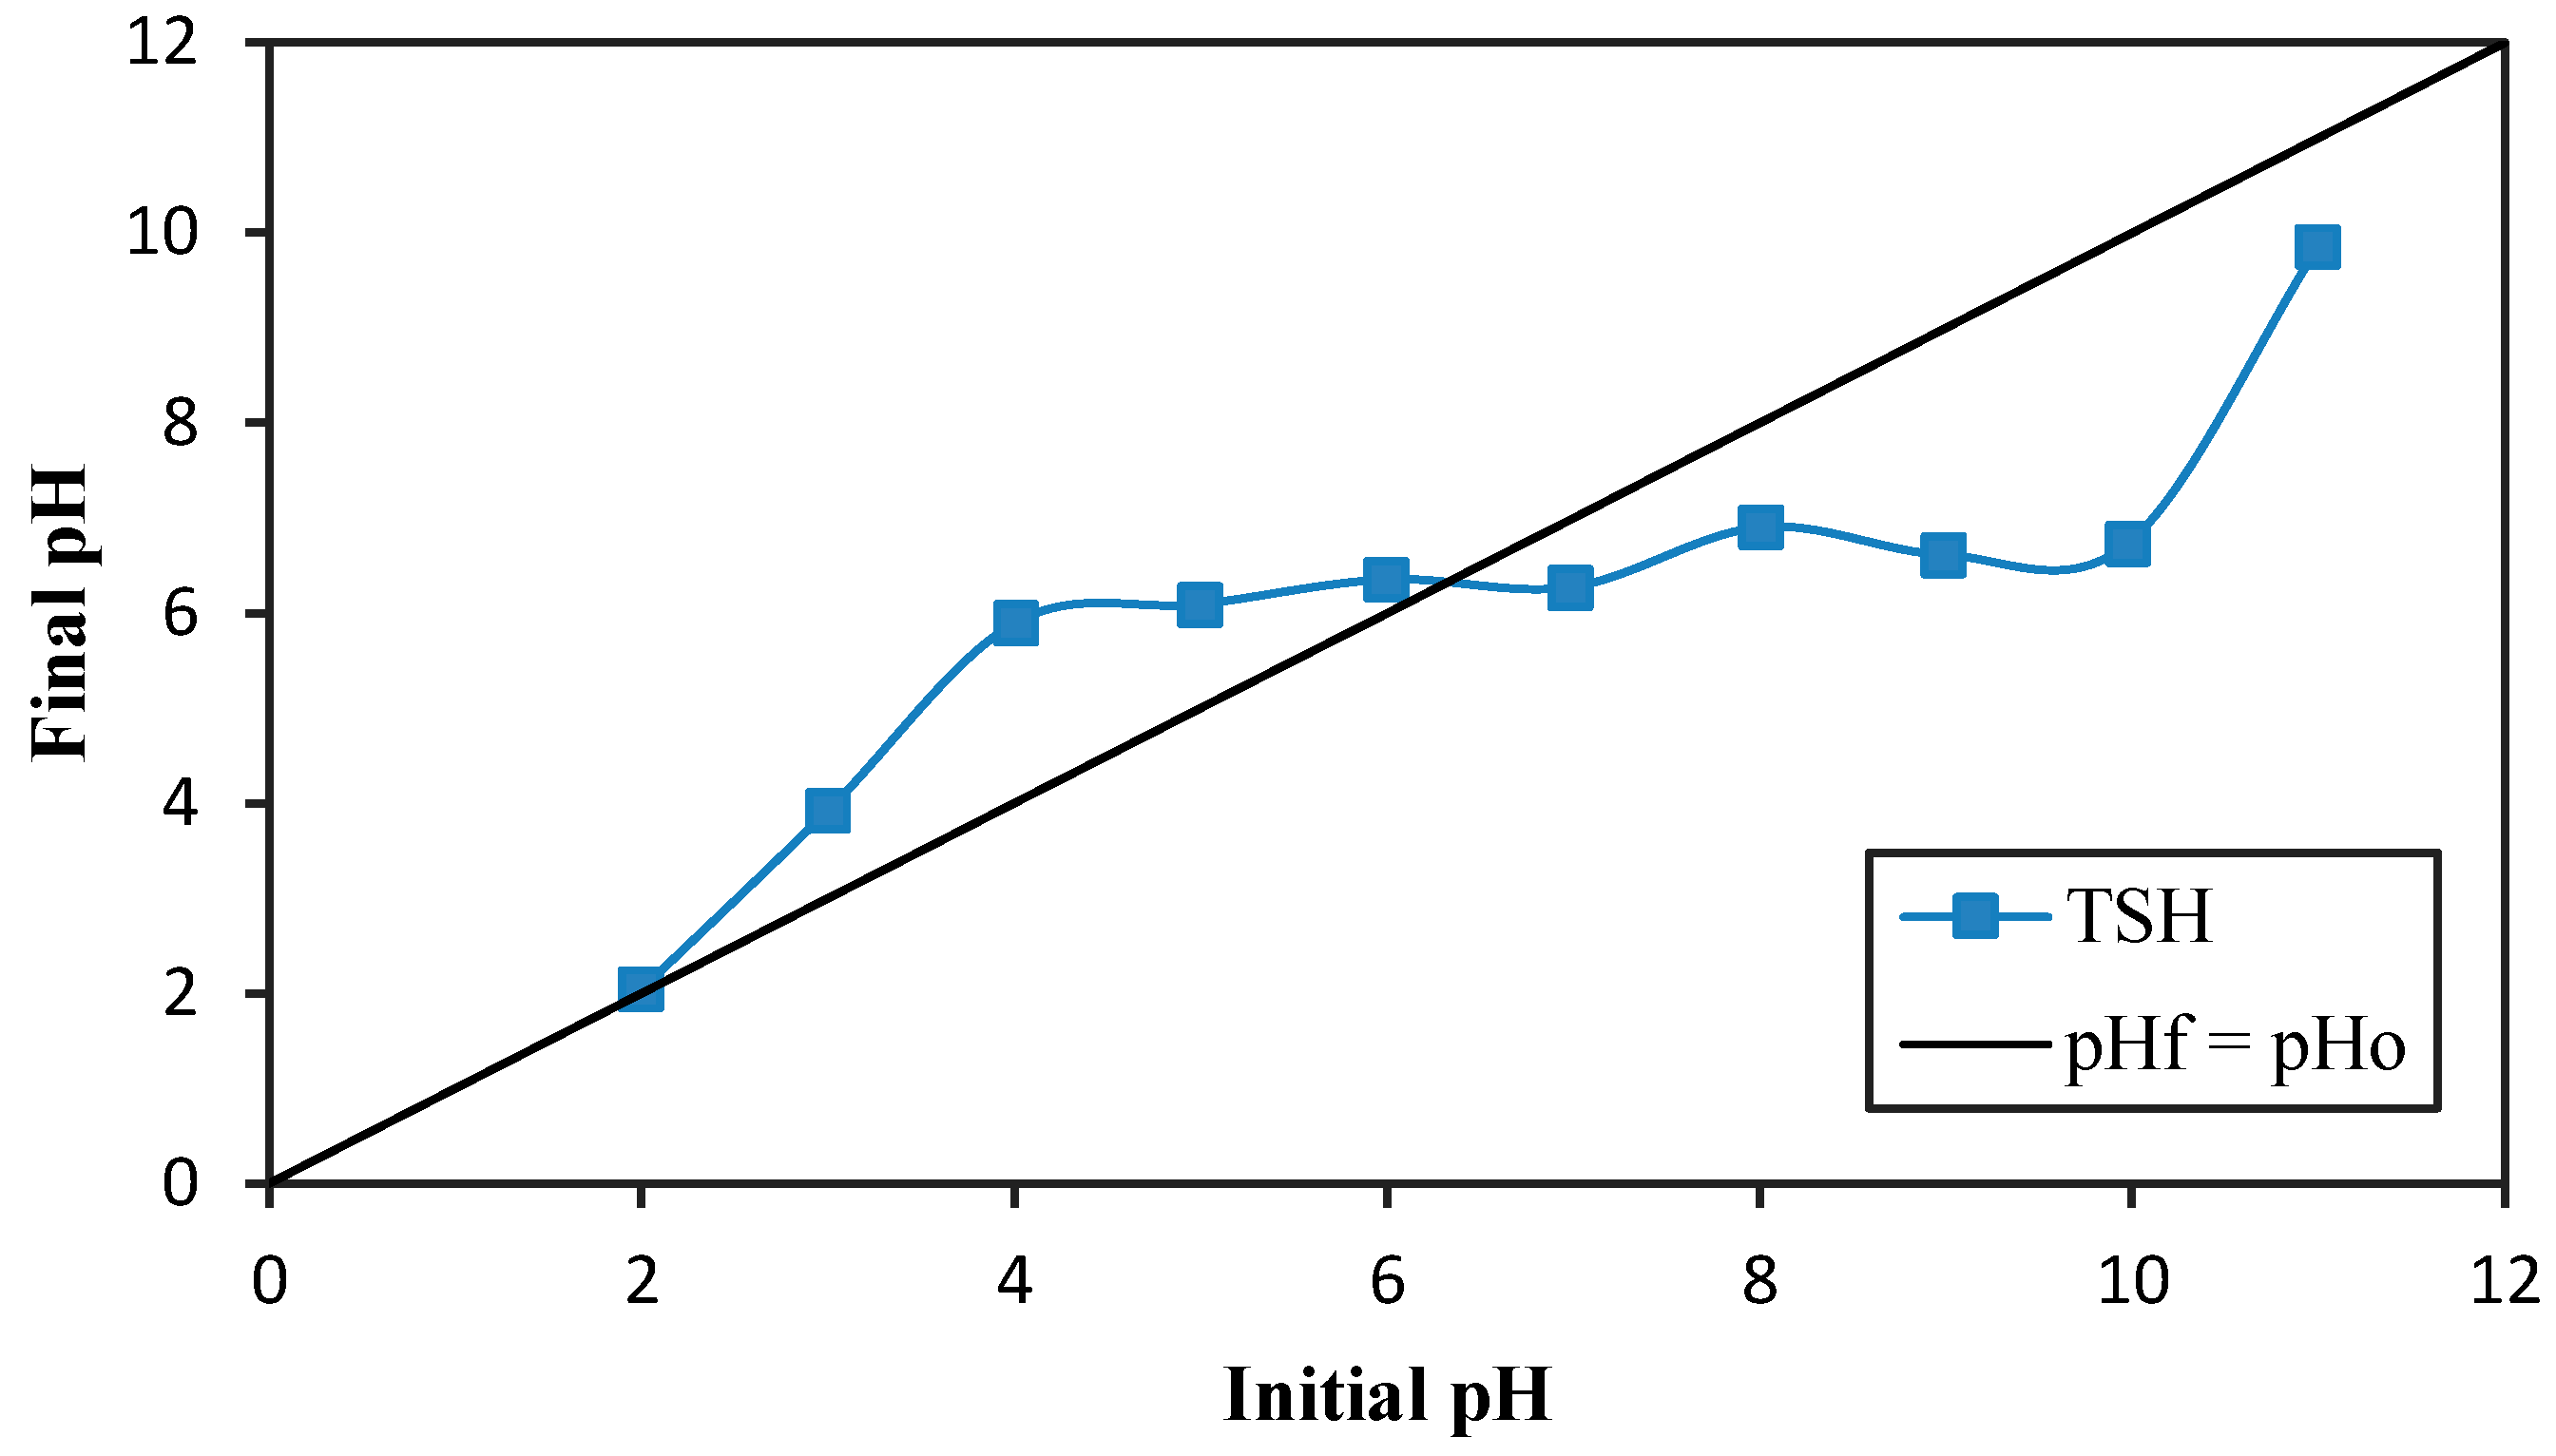
Figure 1. The point of zero charge (pHpzc) of TSH.
Sustainability 14 01309 g001
Figure 2. Scanning electron micrograph with SEM of TSH (a) and EDX spectrum of Z1 (b), Z2 (c), Z3 (d), Scanning electron micrograph with SEM of TSH/Pb(II) (e) and EDX spectrum of Z6 (f).
Sustainability 14 01309 g002
Figure 3. (a) Nitrogen adsorption and desorption isotherm at 77 K. (b) FT-IR spectrum for TSH and TSH-Pb(II).
Sustainability 14 01309 g003
Figure 4. Distribution diagram of lead (II) complexes at various pHs.
Sustainability 14 01309 g004
Figure 5. Effect of adsorbent dose on the removal of Pb(II) using TSH (T = 298 K, t = 300 min, and Co = 100 mg·L−1).
Sustainability 14 01309 g005
Figure 6. Effect of contact time on the removal of Pb(II) using TSH (T = 298 K, t = 120 min, Co = 100 mg·L−1, and pH = 5).
Sustainability 14 01309 g006
Figure 7. Pseudo-first order, pseudo-second order, Bangham, and Elovich kinetic models fitted to experimental data (w = 1.8 g and V = 100 mL) for different initial concentrations: (a) 20 mg·L−1, (b) 60 mg·L−1, and (c) 100 mg·L−1.
Sustainability 14 01309 g007
Figure 8. Weber–Morris intraparticle diffusion model fitted to experimental data with an initial concentration of 20, 60, and 100 mg·L−1 (T = 298 K, w = 1.8 g, V = 100 mL, and pH = 5).
Sustainability 14 01309 g008
Figure 9. Langmuir, Freundlich, Toth, Redlich–Peterson and Sips adsorption isotherms: (a) 288 K, (b) 298 K, (c) 308 K, (d) 318 K. (w = 1.8 g, V = 100 mL, and t = 60 min).
Sustainability 14 01309 g009
Table 1. Kinetic parameters of the pseudo-first order, pseudo-second order, Elovich, Bangham, and intraparticle diffusion models at a concentration of 20, 60, and 100 mg·L−1.
ParametersCo (mg·L−1)
2060100
qe,exp0.9594 ± 0.06722.9022 ± 0.12655.2000 ± 0.1875
Pseudo-first order
qe,cal (mg·g−1)0.92112.70814.9353
k1 (min−1)0.63330.62980.6743
R20.60750.70880.7915
X20.11360.24200.2775
Pseudo-second order
qe,cal (mg·g−1)0.96872.85245.1885
k2 (g·mg−1·min−1)1.11760.36870.2171
R20.86200.93200.9736
X20.03690.05470.0362
Elovich
β (g·mg−1)11.03103.62032.0958
α (mg·g−1·min−1)83.1308179.1824530.8156
R20.84230.91640.8904
X20.03330.05330.1223
Bangham
KB (mg·g−1·s–α)0.64911.88133.5107
αB0.10210.10660.0997
R20.79820.87240.8402
X20.04380.08480.1831
Intraparticle diffusion
Kdif1 (mg·g−1·min–0.5)0.11980.44190.7950
C10.46831.23202.3217
R210.96810.99670.9351
Kdif2 (mg·g−1·min−0.5)0.01800.05280.1231
C20.88322.46704.4025
R220.63880.30600.9630
Kdif3 (mg·g−1·min–0.5)0.00950.02310.0189
C30.87282.67545.0231
R230.80200.62630.7359
X20.00210.00510.0279
Table 2. Parameters obtained from equilibrium models at different temperatures.
IsothermsParametersTemperature (K)
288298308318
qe,exp6.9468 ± 0.18387.0366 ± 0.30677.1277 ± 0.49896.7492 ± 0.3571
Langmuirqmax(mg·g−1)21.588622.034818.259810.8976
KL(L·mg−1)0.03720.04170.05770.0912
RL0.57–0.160.55–0.150.46–0.110.35–0.07
R20.96290.96380.98430.9899
X20.30200.29880.15990.0767
FreundlichKF [(mg·g−1)·(L·mg−1)1/n]0.89890.99971.15741.2587
1/n0.80870.81140.76510.5958
R20.94970.95090.98510.9779
X20.39490.38980.19600.2018
TothKT (mg·g−1)0.902418.72261.52531.8444
αT (L·mg−1)−0.051122.89951.88391.8410
1/z0.19330.96280.33160.5241
R20.94960.96370.98600.9855
X20.40100.22600.16690.1161
Redlich–PetersonKRP (L·g−1)3.80571.01532.29800.9100
αRP (L·mg−1)β3.21500.09861.04870.0525
g0.23910.76380.36251.1452
R20.95050.96030.98550.9900
X20.39760.33520.18320.0799
Sipsqms (mg·g−1)8.94549.103613.017910.3128
Ks (L·mg−1)0.03160.04000.07340.0923
ns1.82961.817511.5151.0454
R20.98190.98230.98180.9900
X20.42210.41340.16040.0802
Table 3. Thermodynamic parameters of the lead adsorption process.
Temperature (K)ΔG° (KJ·mol−1)ΔH° (KJ·mol−1)ΔS° (J·K−1)
Langmuir
288−18.046822.7687141.7204
298−19.4640
308−20.8812
318−22.2984
Sips
288−17.695726.2589152.6201
298−19.2219
308−20.7481
318−22.2743
Publisher’s Note: MDPI stays neutral with regard to jurisdictional claims in published maps and institutional affiliations.