Abstract
Diverse factors influence the energy profile of an urban development including density, shape of buildings and their types, energy demand, and available energy resources. A systematic investigation of the energy characteristics of urban areas, involves the determination of representative archetypes of urban developments. This study presents a comparison of energy performance and resources between two categories of traditionally built urban development building clusters (BCs) in the North American urban context, and neighborhood units (NUs) designed with various sustainable principles and considerations. The study presents a methodology to optimize the mix of energy resources of individual building clusters and neighborhoods, as well as the optimization of energy sharing among the individual urban units of each category. Optimal energy sharing is determined based on the best combination of energy deficit and energy surplus of various clusters and neighborhoods. The study shows that in general neighborhood units encompassing diverse building uses and designed to allow different amenities within a walking distance perform better than commonly built building clusters with low usage diversity. Highly diverse neighborhoods that combine large commercial areas to high density residential buildings can generate up to 84% of their annual electrical and up to 37% of their annual thermal consumption. PV generation accounts for major part of the electrical energy generation of both individual urban units (BCs and NUs) and combination of these units. This can reach up to 92% of the total energy consumption of some combinations of NUs, while the remaining energy requirement is fulfilled by wind and waste to energy (3.4% and 4.9%, respectively). On the other hand, the study shows that thermal energy is mostly supplied by alternative energy sources, since building surfaces prioritize the accommodation of PV modules.
1. Introduction
Challenges of meeting sustainability goals such as reducing energy consumption and mitigating environmental impact can be better analyzed at a small but representative urban development defined as a neighborhood unit [1]. A functional neighborhood unit (NU) can be considered as a small urban development that contains all the facilities and amenities that an average family needs to achieve a comfortable living, within a walking distance [1,2]. A neighborhood unit can be useful to undertake detailed modeling, simulations, and analysis for various urban level energy systems providing an opportunity to perform a detailed study of the interaction of energy systems, that might not be feasible at a city scale [3].
Integration of energy efficiency strategies [4] together with renewable and alternative low impact energy sources, and various sustainable design considerations (e.g., diversified amenities, low impact transportation) is crucial to achieve environmentally sustainable development [5,6]. An optimal energy resource or a mix of energy resources depends on building types within a neighborhood and their design and requires efficient methods to manage local energy consumption and production [7,8]. Individual energy sources such as solar [9,10], wind energy [11], district heating [12], and waste to energy [13] and their application to whole urban areas [14] are investigated and reported in various researches. While the investigation of individual renewable and alternative energy sources is relatively widely conducted, evaluation of the impact of the mix of energy sources and connection to neighborhood designs is still restricted. For instance, an early study claims that the optimal combination of renewable energy production for an urban development (in Switzerland) combines solar captors with seasonal storage for office buildings, solar captors for housing, and wood-burning heating for schools [15]. This study was conducted at the early design process of a neighborhood in Neuchâtel (Switzerland), considering environmental, energetic, and financial criteria. Other studies highlight the role of renewable-based district energy systems in achieving low-environmental impact communities, by providing sustainable methods to deliver heating, domestic hot water, and cooling to these communities (e.g., [16,17]).
While research findings agree on the challenge faced in achieving energy and carbon neutrality at a neighborhood level [5], few investigations indicate that a flexible mix of integrated energy sources allows reaching an energy-neutral status at a neighborhood scale [18,19]. Integrated energy systems such as hybrid energy hubs can be designed to combine an amalgam of individual energy consumers and producers, allowing to take into account variable loads, energy sources, control, and storing components [20,21,22,23]. The benefits of such integrated systems are increased reliability and efficiency gains through synergistic effects and increased energy sharing potential [20,24]. The design of an energy hub is determined based on the type of buildings within a cluster or neighborhood (i.e., residential, commercial, or a mixture of both) [25,26,27]. For instance, Longxi et al. [28] proposed a multi-objective design approach for the planning of distributed energy resources in a small residential-commercial cluster, minimizing annual cost and GHG emissions. Ma et al. [29] proposed a model to simulate the performance of an energy hub together with an optimization method for 24 hours operational optimization. Qi et al. [30] developed an optimized approach to model a smart energy hub that integrates combined heat and power, energy storage, and energy demand. Ghanbari et al. [31] presented a method to plan the optimal operation of networks of microgrids integrating multiple energy hubs. For a mixed-use neighborhood, Hachem-Vermette and Singh [7] presented an optimization method supporting energy hub design to attain maximum synergy between distributed clean energy sources and the grid. The perspective of off-grid operation of on-site resources is also included in this analysis. Furthermore, Singh and Hachem-Vermette studied economic parameters (i.e., tariff schemes, return on investment, and payback) affecting the operation and planning of distributed energy resources in a mixed-use neighborhood. Some other studies made the attempt to propose optimal planning methods for distributed energy resources considering various techno-economic aspects [32,33]. Tooryan et al. [34] developed an optimization method to improve the operational cost of a hybrid residential microgrid that combines various energy sources including wind, solar energy, and storage systems.
The current paper presents an innovative approach to the design of archetypes of sustainable neighborhood developments that provide various amenities for comfortable living while increasing their energy efficiency and their energy resources. The innovation of this work resides in developing archetypes of neighborhoods that reflect traditional developments and sustainable practices, and to study the energy performance of each of them individually as well as the energy performance of optimal combinations of these neighborhood archetypes. Developing and employing representative urban archetypes to study various energy strategies is a challenging task that requires careful consideration of commonly designed neighborhoods in specific areas and understanding sustainable practices that can be applied to improve their overall performance. A unique comparison method of the energy performance of the sustainable neighborhood units to existing approach in designing North American traditional neighborhoods was developed and applied. In addition, an optimization methodology was developed to plan distributed energy resources within individual neighborhood units and building clusters, as well as to maximize energy sharing potential among them. The energy resources planning includes an optimal blend of renewable, alternative, and conventional energy resources to provide sustainable energy solutions. This paper provides a unique insight into the best combinations of small-scale sustainable neighborhood units leading to a high-performance large-scale urban development.
2. Methods
This investigation includes the analysis of energy performance and optimal mix of energy resources of two types of neighborhoods: those that are commonly built in North America, and those that are more sustainable. A distinction is made in this work between traditional neighborhoods- named building clusters and the developed sustainable neighborhoods- called neighborhood units. Neighborhood units (NUs) are developed based on the concept of providing main amenities and public green areas within a walking distance. Building clusters (BCs) on the other hand, only consider building types that constitute these clusters and their number.
A method of comparing the traditional building clusters and sustainable neighborhood units was developed and utilized to allow appropriate comparison, especially since the number and types of buildings vary between the two categories. An energy optimization methodology was then developed to optimize the mix of energy sources as well as to investigate potential sharing between multiple neighborhoods and to identify optimal combinations of BCs and NUs to achieve an energy-neutral status.
2.1. Neighborhoods Design
Both types of developments (i.e., BCs and NUs) assume a land area of about 20,000 m2 or 5 acres and the same types of buildings, optimized to achieve high energy performance. The number and types of buildings change among traditional building clusters (BCs) and sustainable neighborhood units (NUs). The main assumptions of the design of these developments are presented below.
2.1.1. Design of Building Clusters (BCs)
A dozen clusters of buildings are designed to represent commonly built cluster types, in Canada. The energy performance of the buildings constituting these clusters is optimized by employing excessive parametric simulations (reported in detail in [35]).
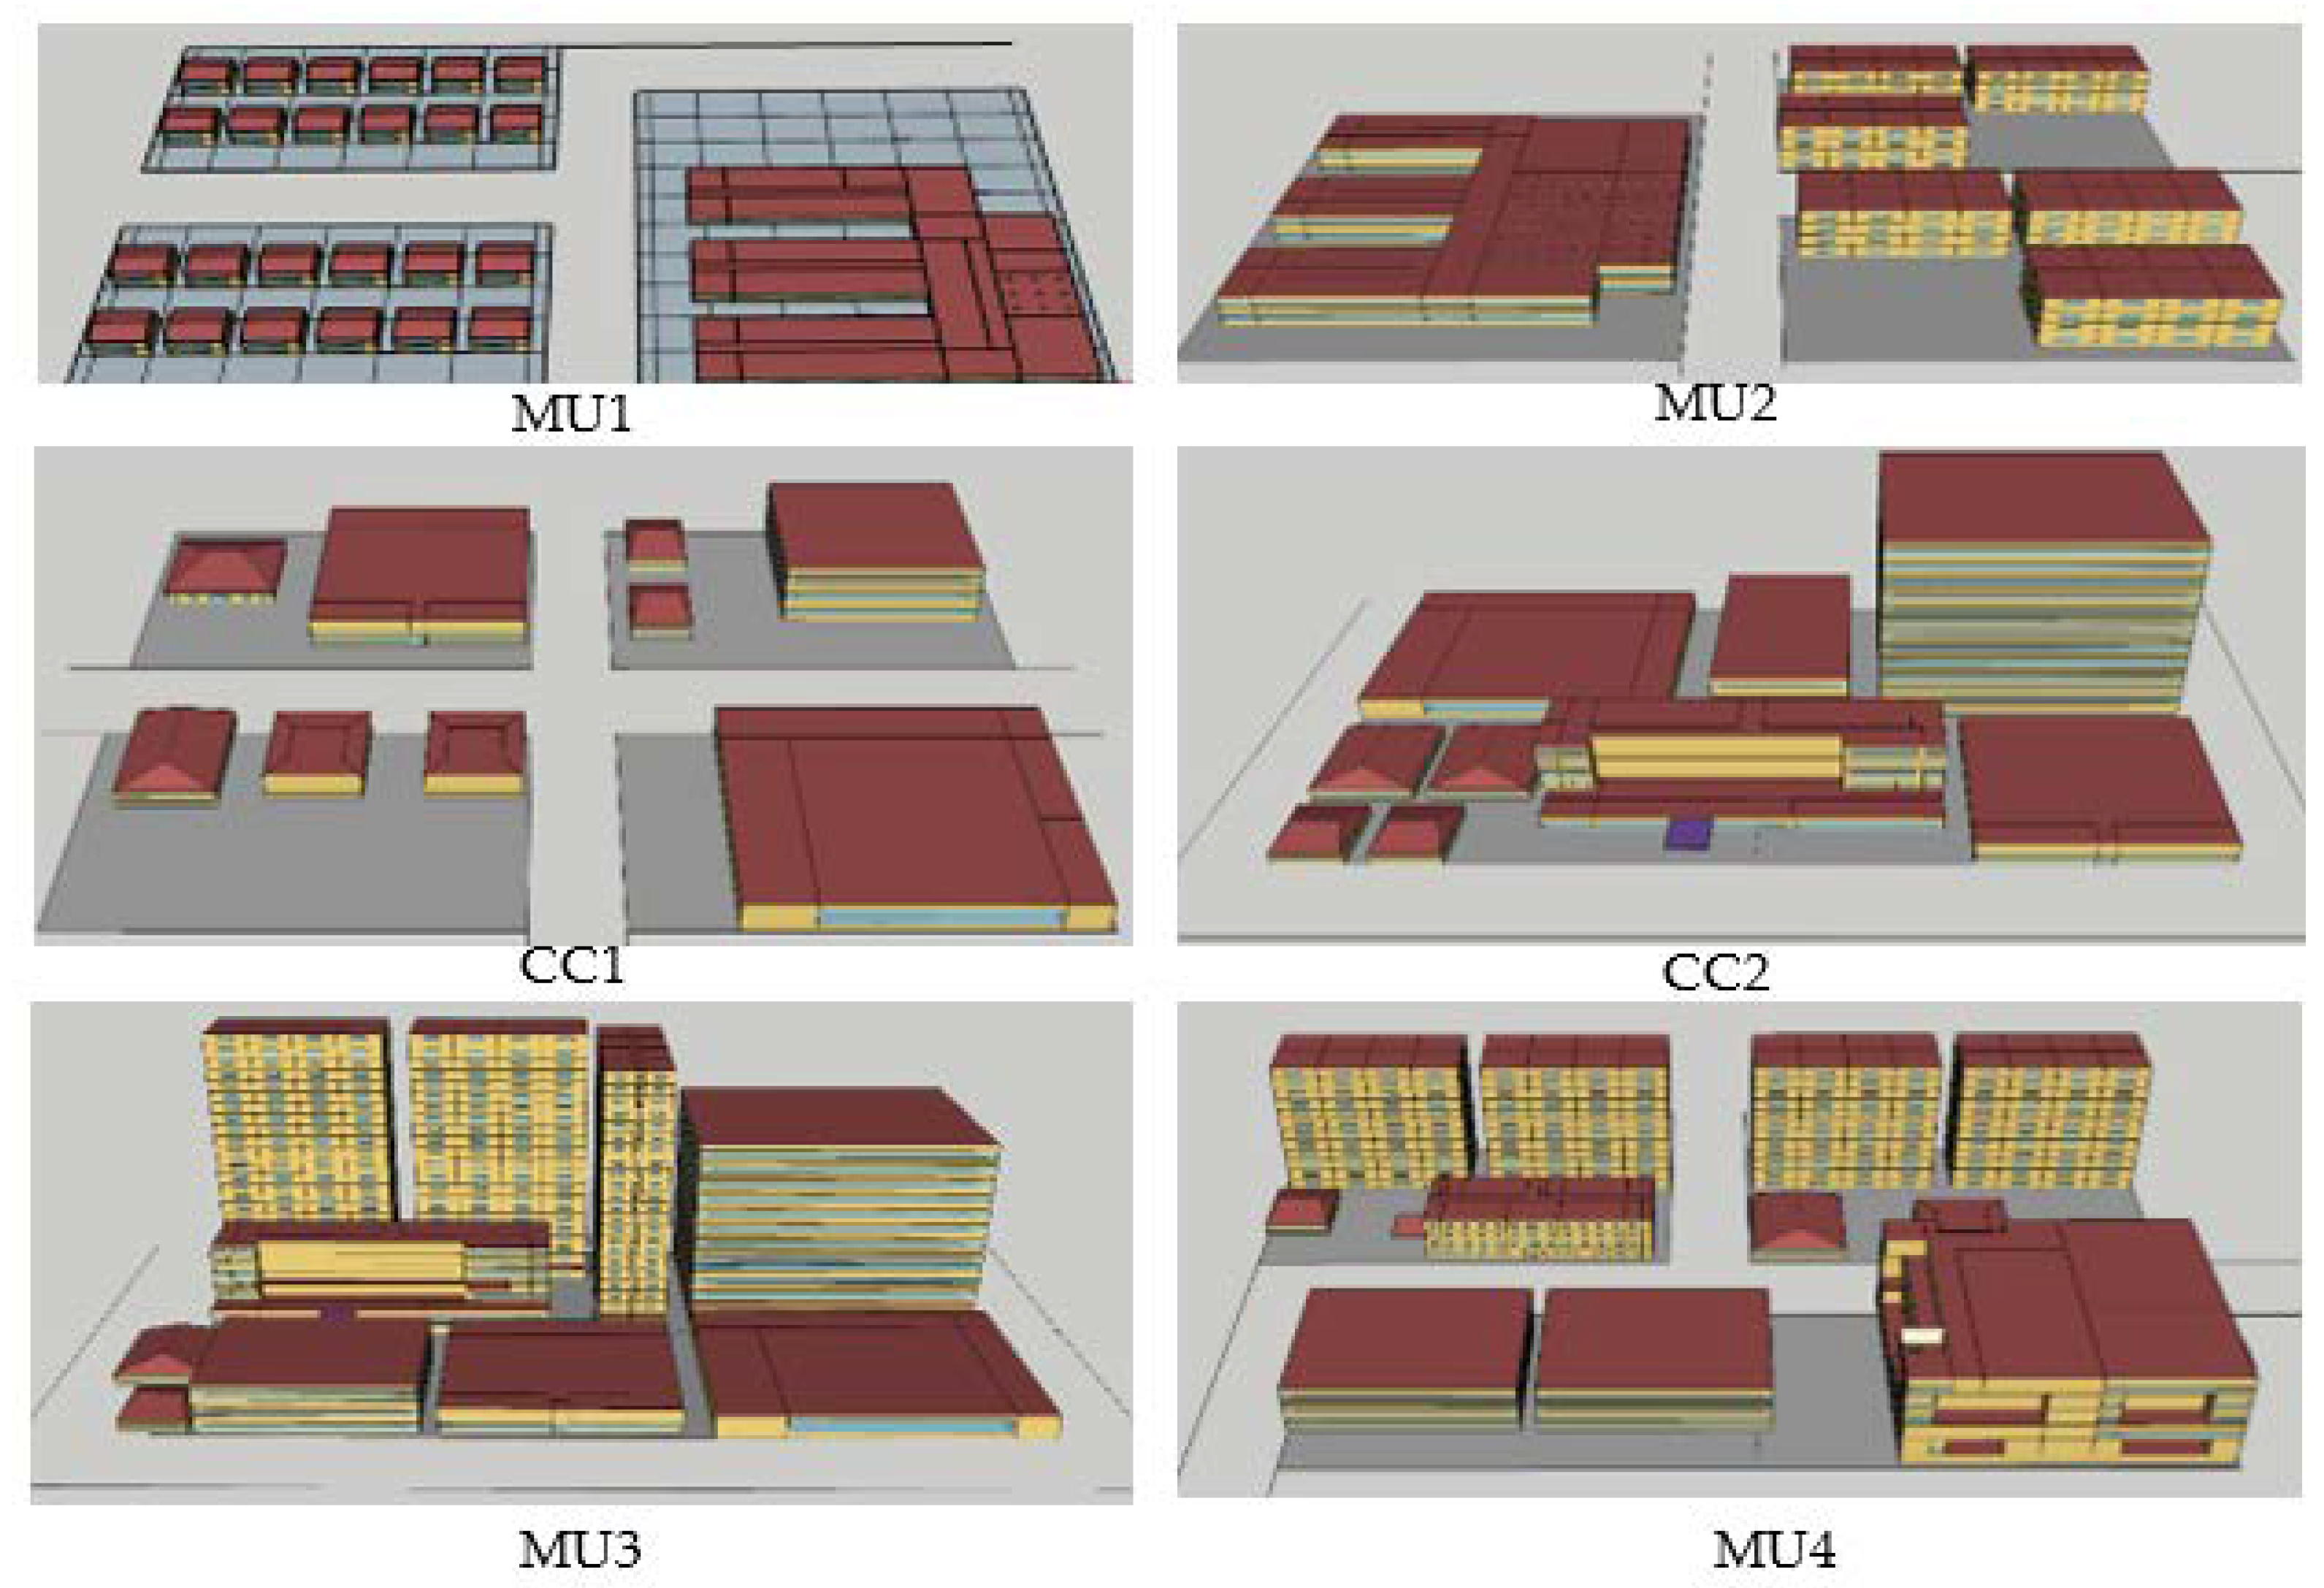
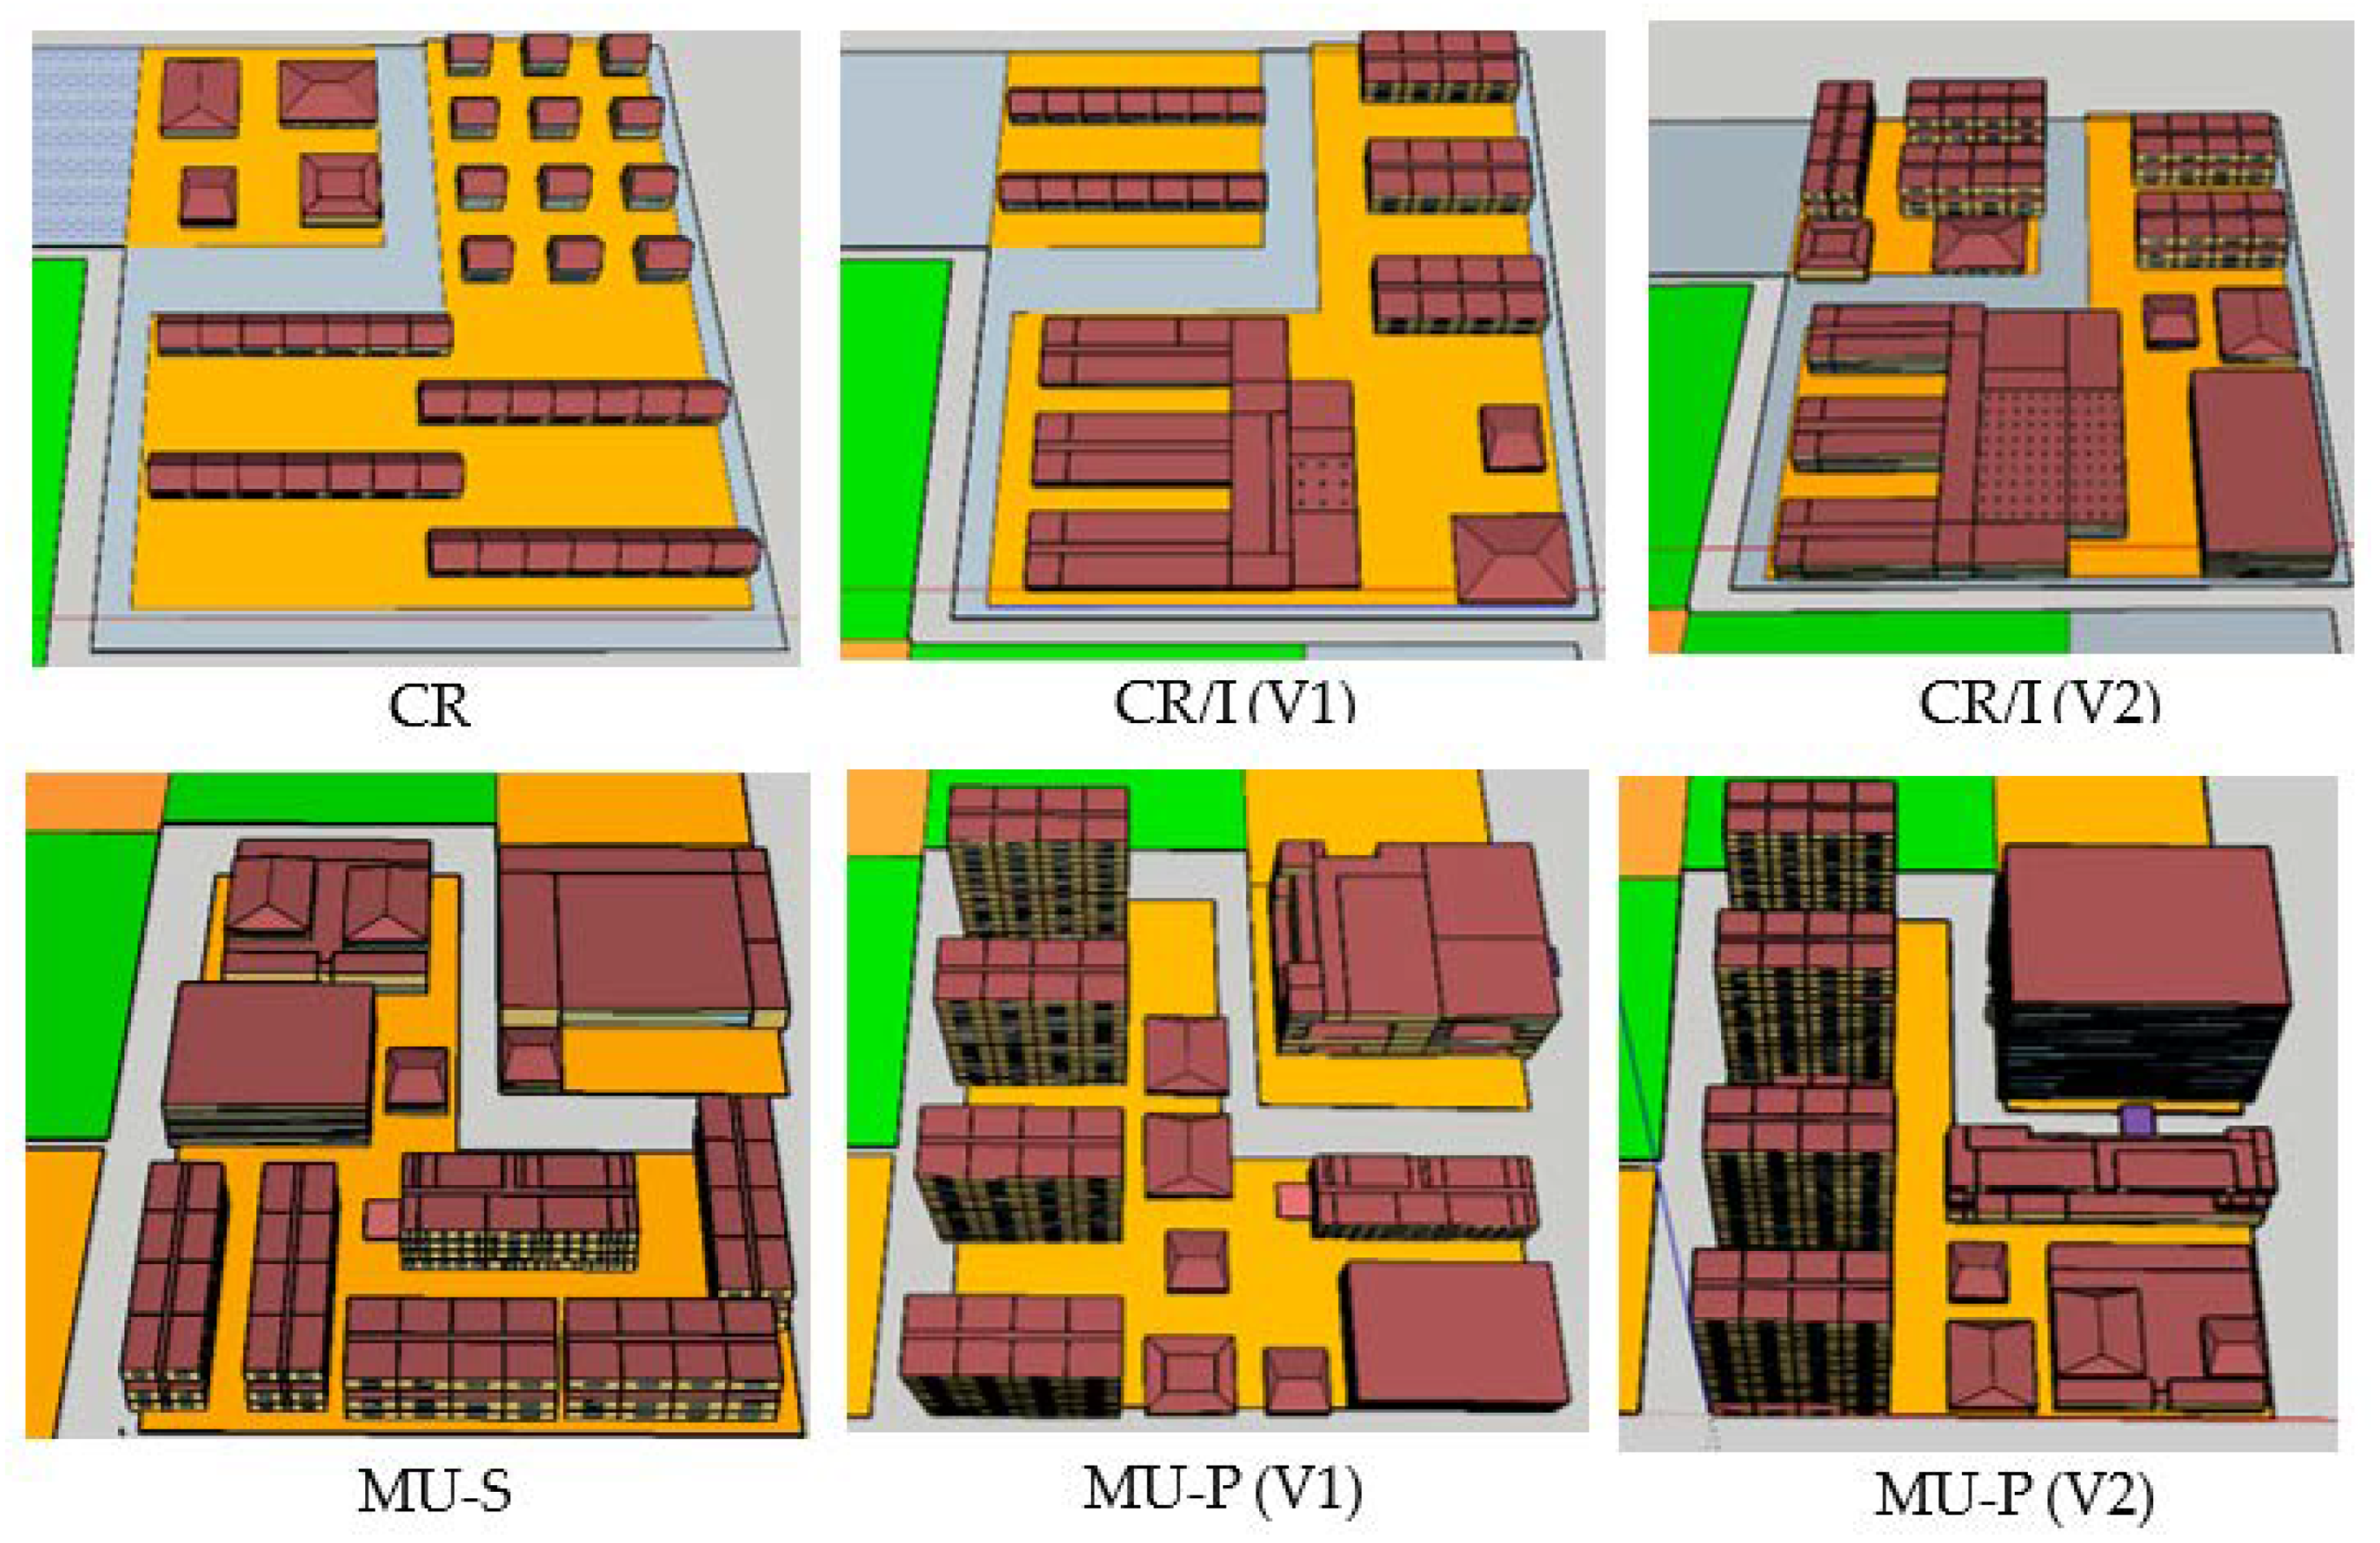
For the current work, six of these clusters representing mixed-use scenarios and ranging from low density with only two types of buildings to higher density and multiple building types are considered. These clusters are summarized below and illustrated in Figure 1.
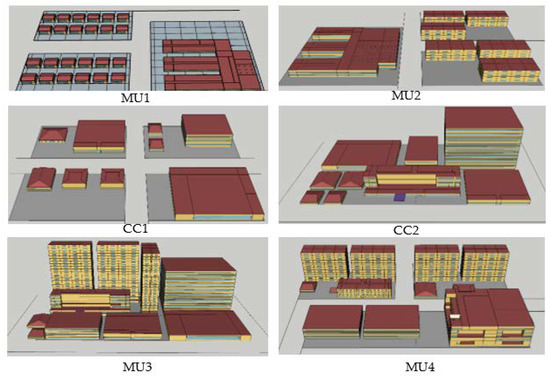
Figure 1.
Layout of the studied building clusters.
- MU1: consists of 24 detached single-family houses and a primary school.
- MU2: contains six low-rise apartment buildings (of three floors) and a secondary school.
- CC1: is a low-density commercial development containing a supermarket, a large retail complex, and two small standalone retail stores, two fast-food restaurants, a full restaurant, a small office, and a medium office.
- CC2: similar to CC1, this neighborhood contains only commercial buildings, but with higher density. It consists of a large office and a medium office, a large retail complex, a supermarket, a large hotel, a full restaurant, and a fast-food restaurant.
- MU3: is a highly mixed neighborhood including residential and commercial buildings, representing models of downtown core urban areas. It includes a large office, a medium office, a large retail complex, a supermarket, a large hotel, a full restaurant, a fast-food restaurant, and three apartment buildings (20 floors each).
- MU4: represents a special type of development that includes a hospital, a small hotel, four apartment buildings (10 floors each), a small retail store, two medium offices, a full restaurant, and a fast-food restaurant.
2.1.2. Design of Sustainable Neighborhood Units
Neighborhood units are designed to combine the concept of open green spaces with the inclusion of a variety of amenities required to achieve comfortable living while offering local job possibilities. As such, each neighborhood unit aims at containing retail facilities, office areas, restaurants, as well as some institutional buildings (schools, hospital).
The land-use composition is based on the fused grid concept, a neighborhood concept containing various sustainability principles. The fused grid is based on the substratum of orthogonal, but not a necessary uniform grid, where lot dimensions can change according to the building types and dimensions. Blocks intended for large buildings such as apartment or commercial complexes may require different dimensions than those dedicated to single-family houses. The fused grid adopts a modular design, to create neighborhoods with a focal point and boundaries, where a module is about 40 acres.
The neighborhood design is based on 1/8th of a fused grid module (5 acres) (see Figure 2). This neighborhood size is employed to allow an in-depth study of building and urban scale energy systems, and to explore future combinations of the studied neighborhood units (NUs) within the whole fused grid modules.
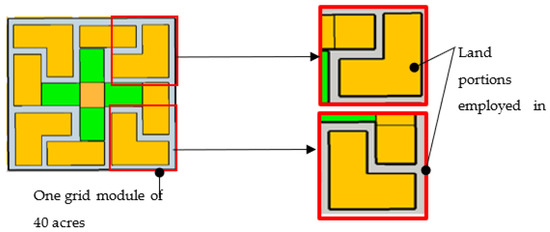
Figure 2.
Illustration of one fused grid module (8 u/a).
The neighborhood units (NUs) developed in this study are summarized below and illustrated in Figure 3.

Figure 3.
Illustration of the 6 studied neighborhood units.
- Core cluster archetype (CR): This core archetype includes the basic combination of residential buildings and amenities. It contains several detached and attached houses, a small retail store, a small office, a fast-food restaurant, and a full restaurant.
- Residential/institutional archetype (CR/I): This archetype includes institutional building (primary or secondary school) in addition to different other types of buildings. Two variations are designed within this:
- ○
- CR/I (V1): attached houses and medium-rise apartment buildings, a primary school, small office, convenience store, a fast-food restaurant, and a full restaurant.
- ○
- CR/I (V2): the second variation of this development contains higher density, composed of mid-rise apartment buildings with a secondary school, small office, medium office, two restaurants, and a convenience store.
- Residential/commercial archetype (MU-S): Containing five mid-rise apartment buildings of four floors, a medium office, a large retail store, a supermarket, four restaurants, and a small hotel.
- Particular commercial/institutional archetype: This kind of archetypes consists of a concentrated business district featuring a special type of building such as large hotel or a hospital. Two variations are designed:
- ○
- MU-P (V1): containing a medium office, a small hotel, a hospital, four restaurants (two full restaurants and two fast-food restaurants), a small retail store, and four apartment buildings of 15 floors each.
- ○
- MU-P (V2): containing a large office, a large hotel, four restaurants (two full restaurants and two fast-food restaurants), a large retail store, and four apartment buildings of 20 floors each.
2.2. Energy Performance Investigation
The energy performance and onsite energy generation potentials (renewable and alternative energy) of the six traditionally designed building clusters (BCs) and six sustainable neighborhood units (NUs) are first estimated using EnergyPlus [36] simulations. Key assumptions employed in the simulations are as follows:
- The population is estimated assuming occupancy of 2.5 per residential unit (for all types of residential buildings single detached, attached, and apartments [37]).
- The dynamic occupancy schedules for residential and commercial buildings are assumed as per ASHRAE Advanced Energy Design Guides (AEDG), ASHRAE 62.1, and recommendations by the simulation working group of ASHRAE 90.1 (refer [38] for more details). Further details about other schedules such as ventilation, HVAC, lighting, hot water, etc. are also referred to in [38].
- Energy use intensity (EUI) includes electrical loads (electricity used for equipment, appliances, and cooling) except for equipment employed for space heating and domestic hot water (DHW). These calculations are made using the EnergyPlus simulation engine by setting up energy models for various BC and NU configurations.
- Heating load is assumed to be served by non-electrical systems (i.e., natural gas or district heating) with an efficiency of 80%.
Various indices are developed to compare the energy performance of the different types of neighborhoods/clusters, to consider the variation of building types and their numbers. The indices are defined in two categories: diversity index and energy performance indices.
2.2.1. Diversity Index
Existing clusters and sustainable neighborhood units (NUs) are designed from the same set of buildings but with different compositions of building types and numbers. These buildings are adopted from the building energy model (BEM) inventory defined by the US Department of Energy (DoE) [39] and systematically modified to achieve high energy performance for the studied location. High-performance measures such as energy-efficient building envelops, natural ventilation, electrochromic windows, and light-emitting diode (LED) lighting are incorporated to modify these BEMs.
To conduct a comparative study among the traditionally designed clusters and the neighborhood units, a diversity index (DI) is developed to quantify the diversity of building usage within the cluster. In other words, it characterizes neighborhood planning features the value of DI is higher with multiple usages of buildings. Diversity index (DI) is calculated using two components: (i) the number of usage of buildings and (ii) the population accommodated within a building cluster. The consideration of population accommodation is beneficial in mixed-use clusters due to various socio-economic perspectives. The equation developed for the calculation of DI is given below,
where, UMn and PMn are the normalized building usage (or type) and population measures, respectively. The maximum value of these normalized measures can be 1. To calculate UMn, first the number of building usages is estimated. For example, in the neighborhood unit (NU) CR/I (V1), four different types of buildings, namely institutions (school), offices (small office), restaurants (fast-food restaurant), and residential buildings (attached houses and apartments) are included. Whereas the maximum number of building types is six in the case of the clusters MU4 and MU5 and the neighborhood units MU-P (V1) and MU-P (V2). As shown in Equation (2), to estimate UMn for a given cluster, the number of building types (UM) is divided by the maximum number of types in both sets of building clusters (BCs) and neighborhood units (NUs).
Similarly, PMn can be calculated as represented in Equation (3), where PM is the population measure defined as the population that can be accommodated with a given BC or NU and the denominator reflects maximum population accommodation in the two sets of developments BCs and NUs (i.e., 1600 people in MU-P (V2)). For each BC/NU, UMn,, and PMn are calculated to estimate the individual diversity index (DI). Further, to calculate DI, two weightage factors are included in Equation (1). In this work, equal weights are defined (0.5 for each measure, both UM and PM), nevertheless, this can be modified according to specific applications.
2.2.2. Energy Performance Indices
- Electricity use index (EUI): This is defined as annual usage of electricity per unit of total cluster/neighborhood unit (BC/NU) floor area (sum of floor areas of all buildings within given BC or NU). As mentioned above, the electricity usage includes all demands except space heating and DHW, as these loads are assumed to be met using non-electrical systems. Similar to the diversity index, by dividing the EUI of a given BC/NU to maximum EUI among all the BCs/NUs, the normalized value of EUI (termed as EUIn) is calculated.
- Thermal load index (TUI): This is a measure used to calculate load per unit area for a given BC/NU. Heat load is a summation of space heating and DHW loads. Moreover, for comparison purposes, the normalized value (TUIn) is calculated by dividing individual TUI with the maximum TUI value for all BCs and NUs.
- Onsite generation index (OGI): Onsite energy generation resources include renewable energy sources (RES) and alternative energy resources (AES). Vertical wind turbines and roof/façade installed PV are considered as onsite RES to generate electricity. For the installation of these RES, potential surfaces are identified within a given BC/NU. While the potential façade and roof areas are identified for the installation of PV panels, roof areas can be also used for solar thermal collectors (STC) depending on the optimization of energy resources (as explained below). The potential of AES consisting of waste to energy (in this work) is calculated based on the waste disposal of each BC/NU. The maximum capacities for the installation of RES and AES are presented in Table 1.
 Table 1. Onsite energy generation potential capacities.
 - Ratio of performance (RoP): It is defined as the ratio of onsite generation potential to the electricity consumption of a given BC or NU. A value equal to 1 represents net-zero energy status, whereas a number greater than 1 is suggestive of energy positive status.
2.3. Optimization Methodology
This section summarizes the optimization methodology developed to determine the optimal mixture of energy resources in individual building clusters and neighborhood units presented above. It also presents a methodology to determine the best energy sharing options among various neighborhood developments. The same cluster or neighborhood unit can be considered multiple times in the energy sharing optimization.
2.3.1. Optimization of Energy Resources
The individual optimization methodology allows to determine the best mixture of RES and AES within a specific BC or NU. Energy credits (EC) are accumulated when excess electricity is generated by RES and AES. Accumulated EC can be used in case of insufficient onsite electricity generation [7].
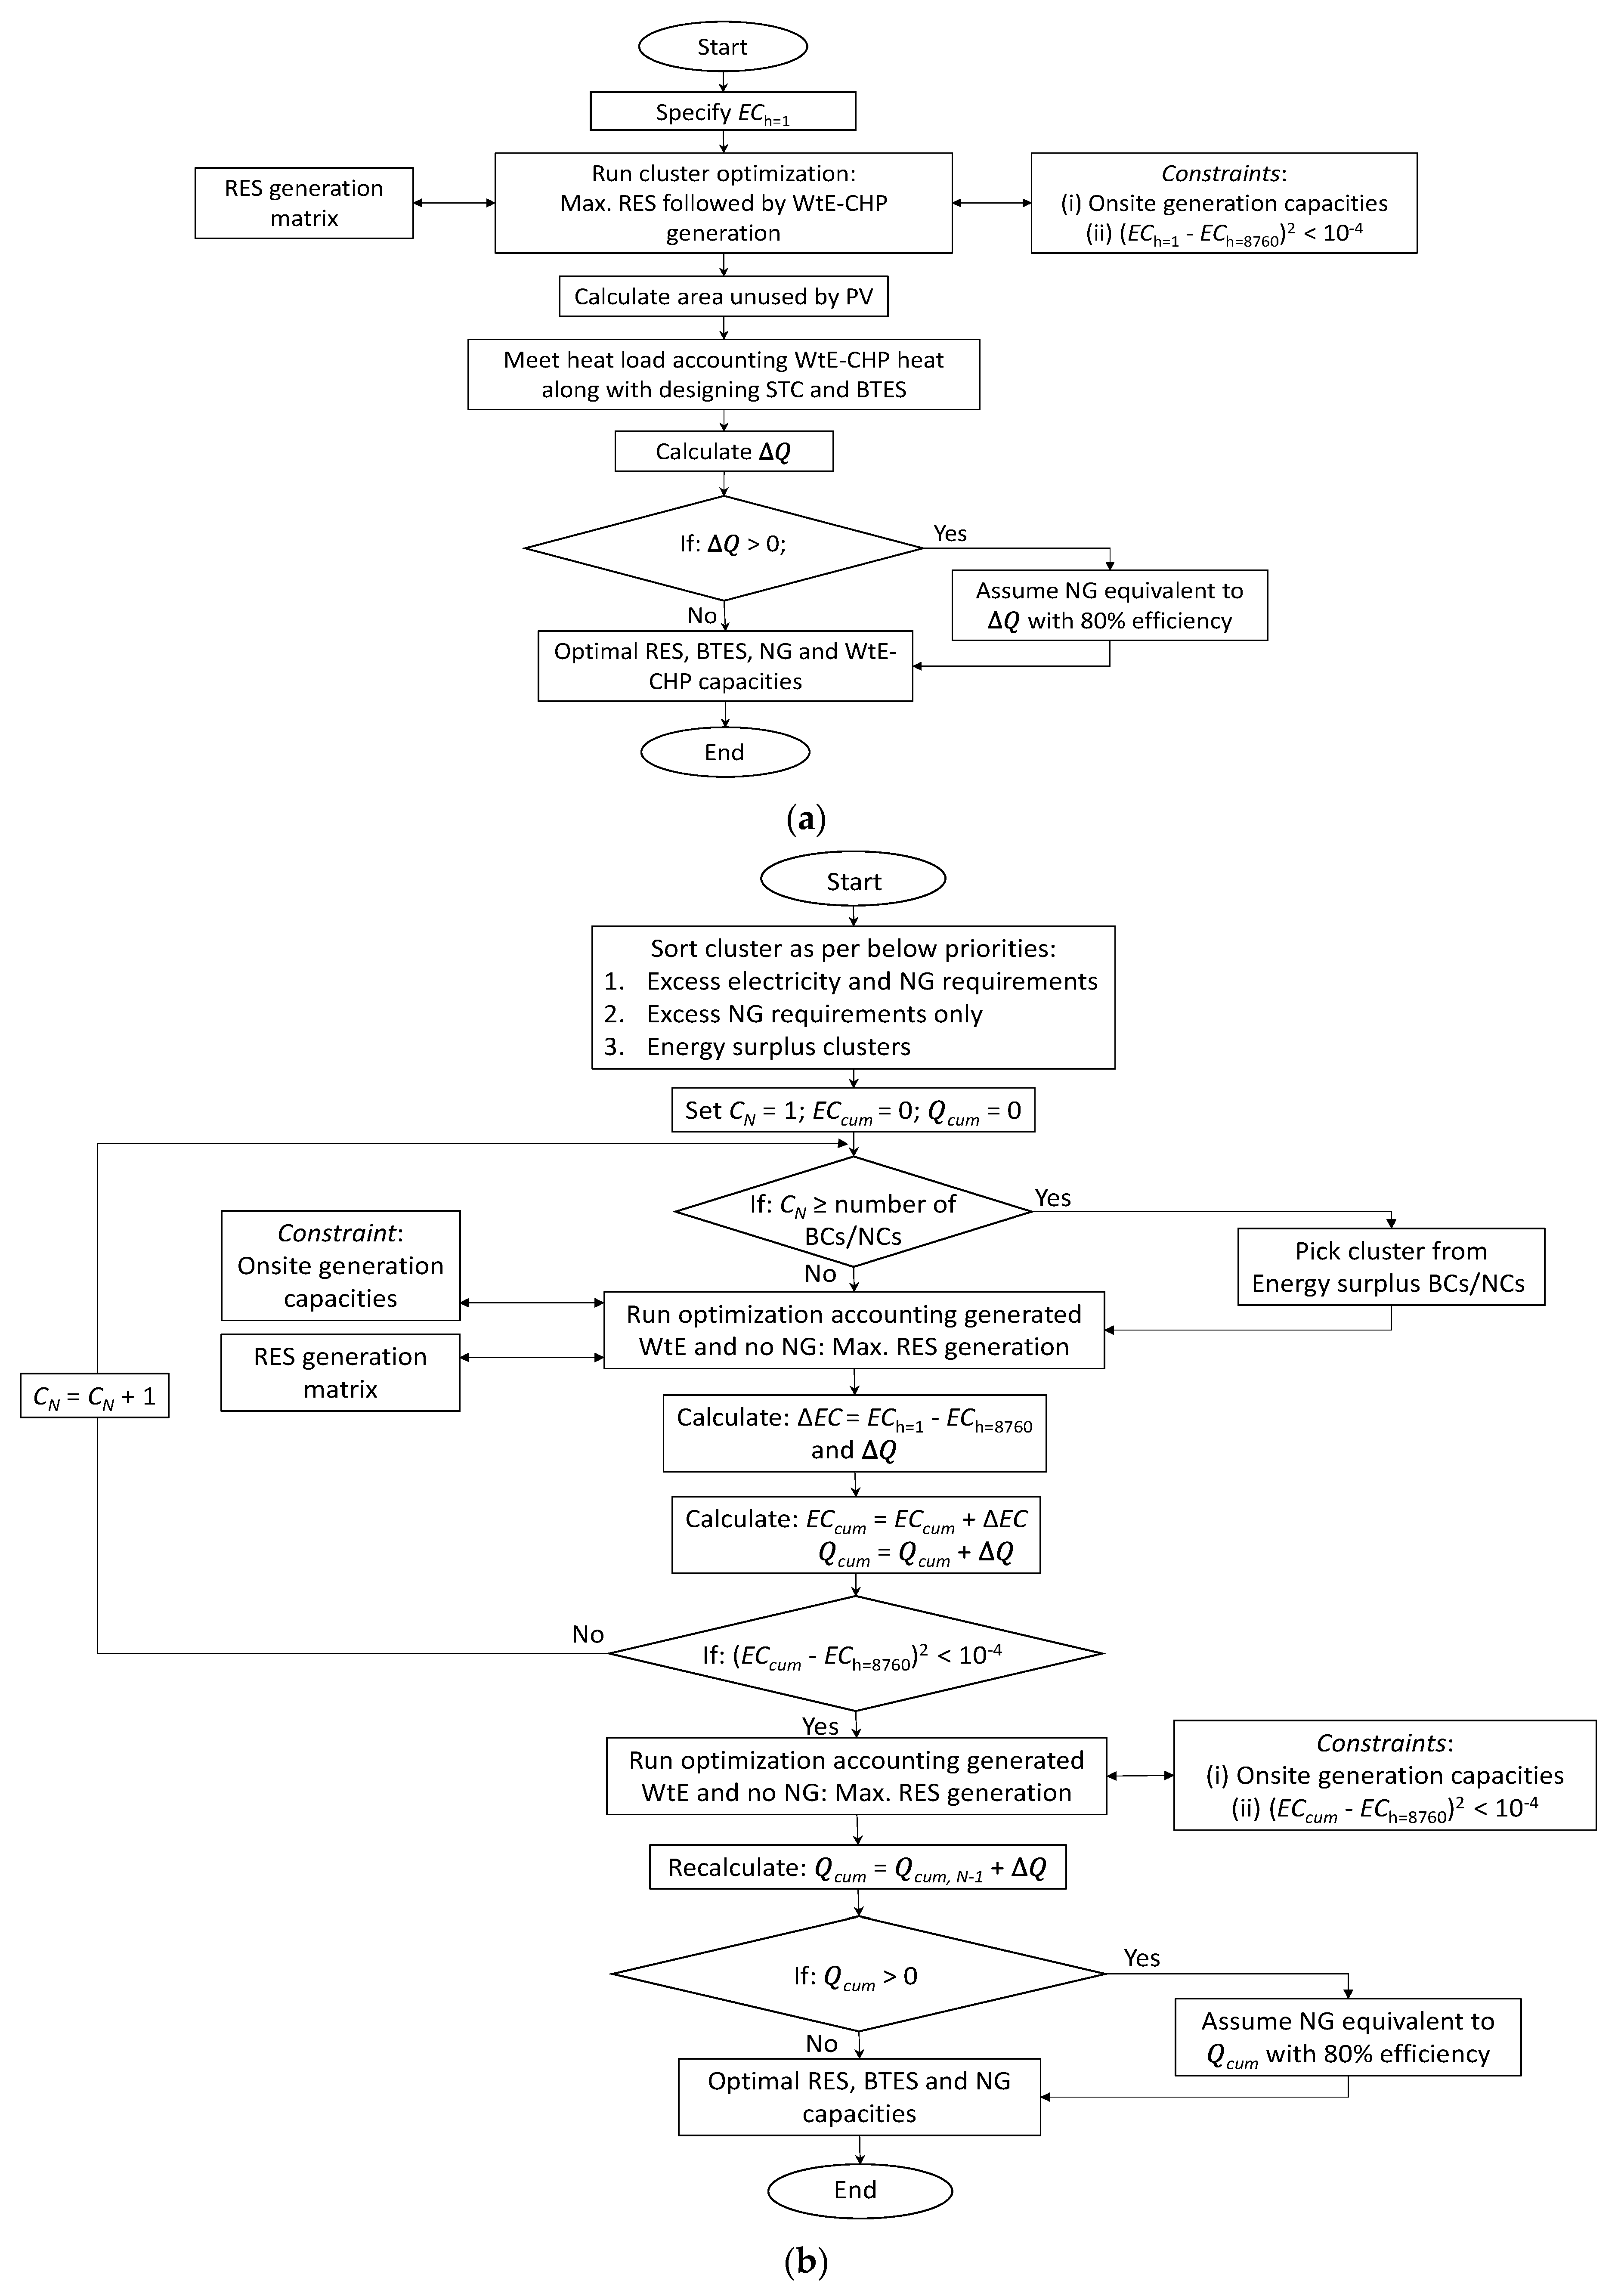
As presented in Figure 4a, the optimization process starts by assuming a value for ECh = 1. Usually, a high value is assumed to maximize the interaction with the local grid (1010 W in this work). These energy credits are recovered at the end of the year (assuming the constraint (ECh = 1 − ECh = 8760)2 < 10−4). Subject to this EC constraint and the RES capacities, the optimization process maximizes the RES generation. In case the annual electrical demands are still unmet by the RES generation, WtE-CHP is used to fulfill the electric requirements. After satisfying the constraints and obtaining a solution for the optimization problem (i.e., maximizing RES production and attaining electrically neutral status), the unused area for PV (if any) is calculated. Accounting WtE-CHP heat (if available), STC, and BTES capacities are estimated. If heat deficit exists (i.e., ΔQ > 0), the appropriate value of natural gas (NG) consumption is assumed considering heating equipment efficiency of 80%. Subsequently, optimal RES (WT and PV), borehole thermal energy storage (BTES), NG, and WtE-CHP capacities are identified for a given cluster or NU.
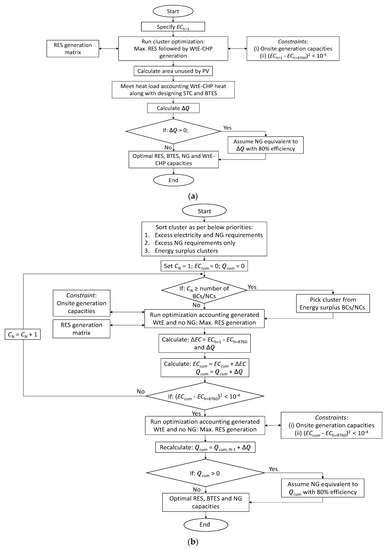
Figure 4.
Flow charts for (a) Individual cluster/neighborhood optimization and (b) multiplier energy sharing optimization.
2.3.2. Energy Sharing Multiplier Optimization
The energy sharing potential among the studied BCs and NUs is explored (see Figure 4b). A specific neighborhood can be considered multiple times in a combination of neighborhoods, employing a multiplier option as presented below. Allowing maximum energy generation by the clusters and neighborhood units, the surplus energy by some of these developments is supplied to those with an energy deficit.
To apply the multiplier energy sharing optimization technique, first clusters/neighborhoods with additional requirements of both electricity and NG are sorted (i.e., clusters unable to fulfill energy needs by onsite resources). Thereafter, clusters/neighborhoods that meet their electrical demands by onsite resources but are not able to serve thermal loads are sorted. Finally, energy surplus clusters/neighborhoods that can share the energy with deficit BCs or NCs are sorted. This sorting process is the primary step in the energy sharing multiplier optimization as indicated in Figure 4b.
After the sorting process, a number index CN is set to 1 representing the top cluster/neighborhood in the sorted list. ECcum and Qcum are assumed to be zero, representing initial cumulative electrical and heat deficits, respectively. For instance, a cluster/neighborhood with an energy deficit increases ECcum, whereas a cluster/neighborhood energy surplus will reduce ECcum. Next, the condition of CN ≥ number of clusters/neighborhoods (in the sorted list) is checked. In case of the unsatisfied condition, the optimization will run by assuming WtE-CHP operated by on-site waste and no NG. The optimization process considers maximum onsite capacities bound as a constraint (e.g., area for PV, number of WT, waste for WtE-CHP, etc.). The optimization method maximizes the total onsite energy generation prioritizing electricity generation. Although this work utilizes the genetic algorithm as optimization method, any optimization algorithm can be employed.
After the optimization, ΔEC and ΔQ representing the electrical and heat deficit, respectively, are calculated for a given cluster/neighborhood (CN). For initial energy deficit cluster/neighborhood, ΔEC and ΔQ are positive, while for energy surplus cluster/neighborhood ΔEC is negative. ΔQ can be either negative or positive. Hence, negative values of these quantities reflect surplus generation that can ultimately reduce ECcum and Qcum. Accordingly, cumulative values ECcum and Qcum are updated. The condition of (ECcum − ECh = 8760)2 < 10−4, to identify whether ECcum tends to be zero after considering year end EC for a given cluster/neighborhood. In case this condition is unsatisfied, the cluster/neighborhood number index CN is increased, and the same process of optimization repeats until CN reaches the total number of clusters/neighborhoods or if (ECcum − ECh = 8760)2 < 10−4. If CN limit is reached and (ECcum − ECh = 8760)2 < 10−4 does not meet, the optimization process considers only energy surplus clusters/neighborhoods to achieve near-zero value of ECcum. Alternatively, a limited number of energy surplus clusters/neighborhoods can be considered in this energy-sharing process. The optimization process selects one of the energy surplus clusters and runs the optimization process again (it continues to couple more clusters/neighborhoods together until the cumulative electrical deficit is eliminated). In this case, the value of ΔEC will be negative, signifying surplus electrical generation. However, ΔQ is likely to be negative as well, as onsite resources are prioritized to generate electricity since the prime focus is to eliminate the cumulative electrical deficiency. Upon calculating ECcum and Qcum, the termination condition of (ECcum − ECh = 8760)2 < 10−4 is verified. In case of an unmet condition, the above process repeats. Otherwise, the optimization process of the last cluster/neighborhood will be rerun. This is essential in the optimization process since the target of energy sharing multiplier optimization is to achieve electrical neutral status. For instance, an ECh = 8760 > ECcum, indicating that onsite electrical generation of the combination of clusters/neighborhoods exceeds demand, can be due to excessive utilization of PV modules. In such a case, a portion of the surfaces utilized to integrate PV modules could be used for STC to reduce heat deficit (Qcum). To ensure this, the optimization process for the last cluster/neighborhood reruns considering (ECcum − ECh = 8760)2 < 10−4 as an additional constraint, where the electrical neutral status is achieved by default. Qcum is recalculated afterward and the condition of near-zero Qcum is checked. If this condition is satisfied, then the optimization process provides optimal capacities, otherwise, assuming 80% heating equipment efficiency, an NG capacity equivalent to Qcum is assumed.
The same process can be applied to single energy deficit BC or NC, coupling several energy surplus BCs or NCs to attain electrically neutral status.
3. Results
Results of the investigation firstly include the comparisons of the trends of the energy performance of building clusters (BCs) to the sustainable neighborhood units (NUs). The optimization of energy resources mixes of each category of development is then summarized followed by the sharing potential among different clusters/neighborhood units and optimal combinations to achieve maximum energy sharing.
3.1. Comparison of Building Clusters and Neighborhood Units
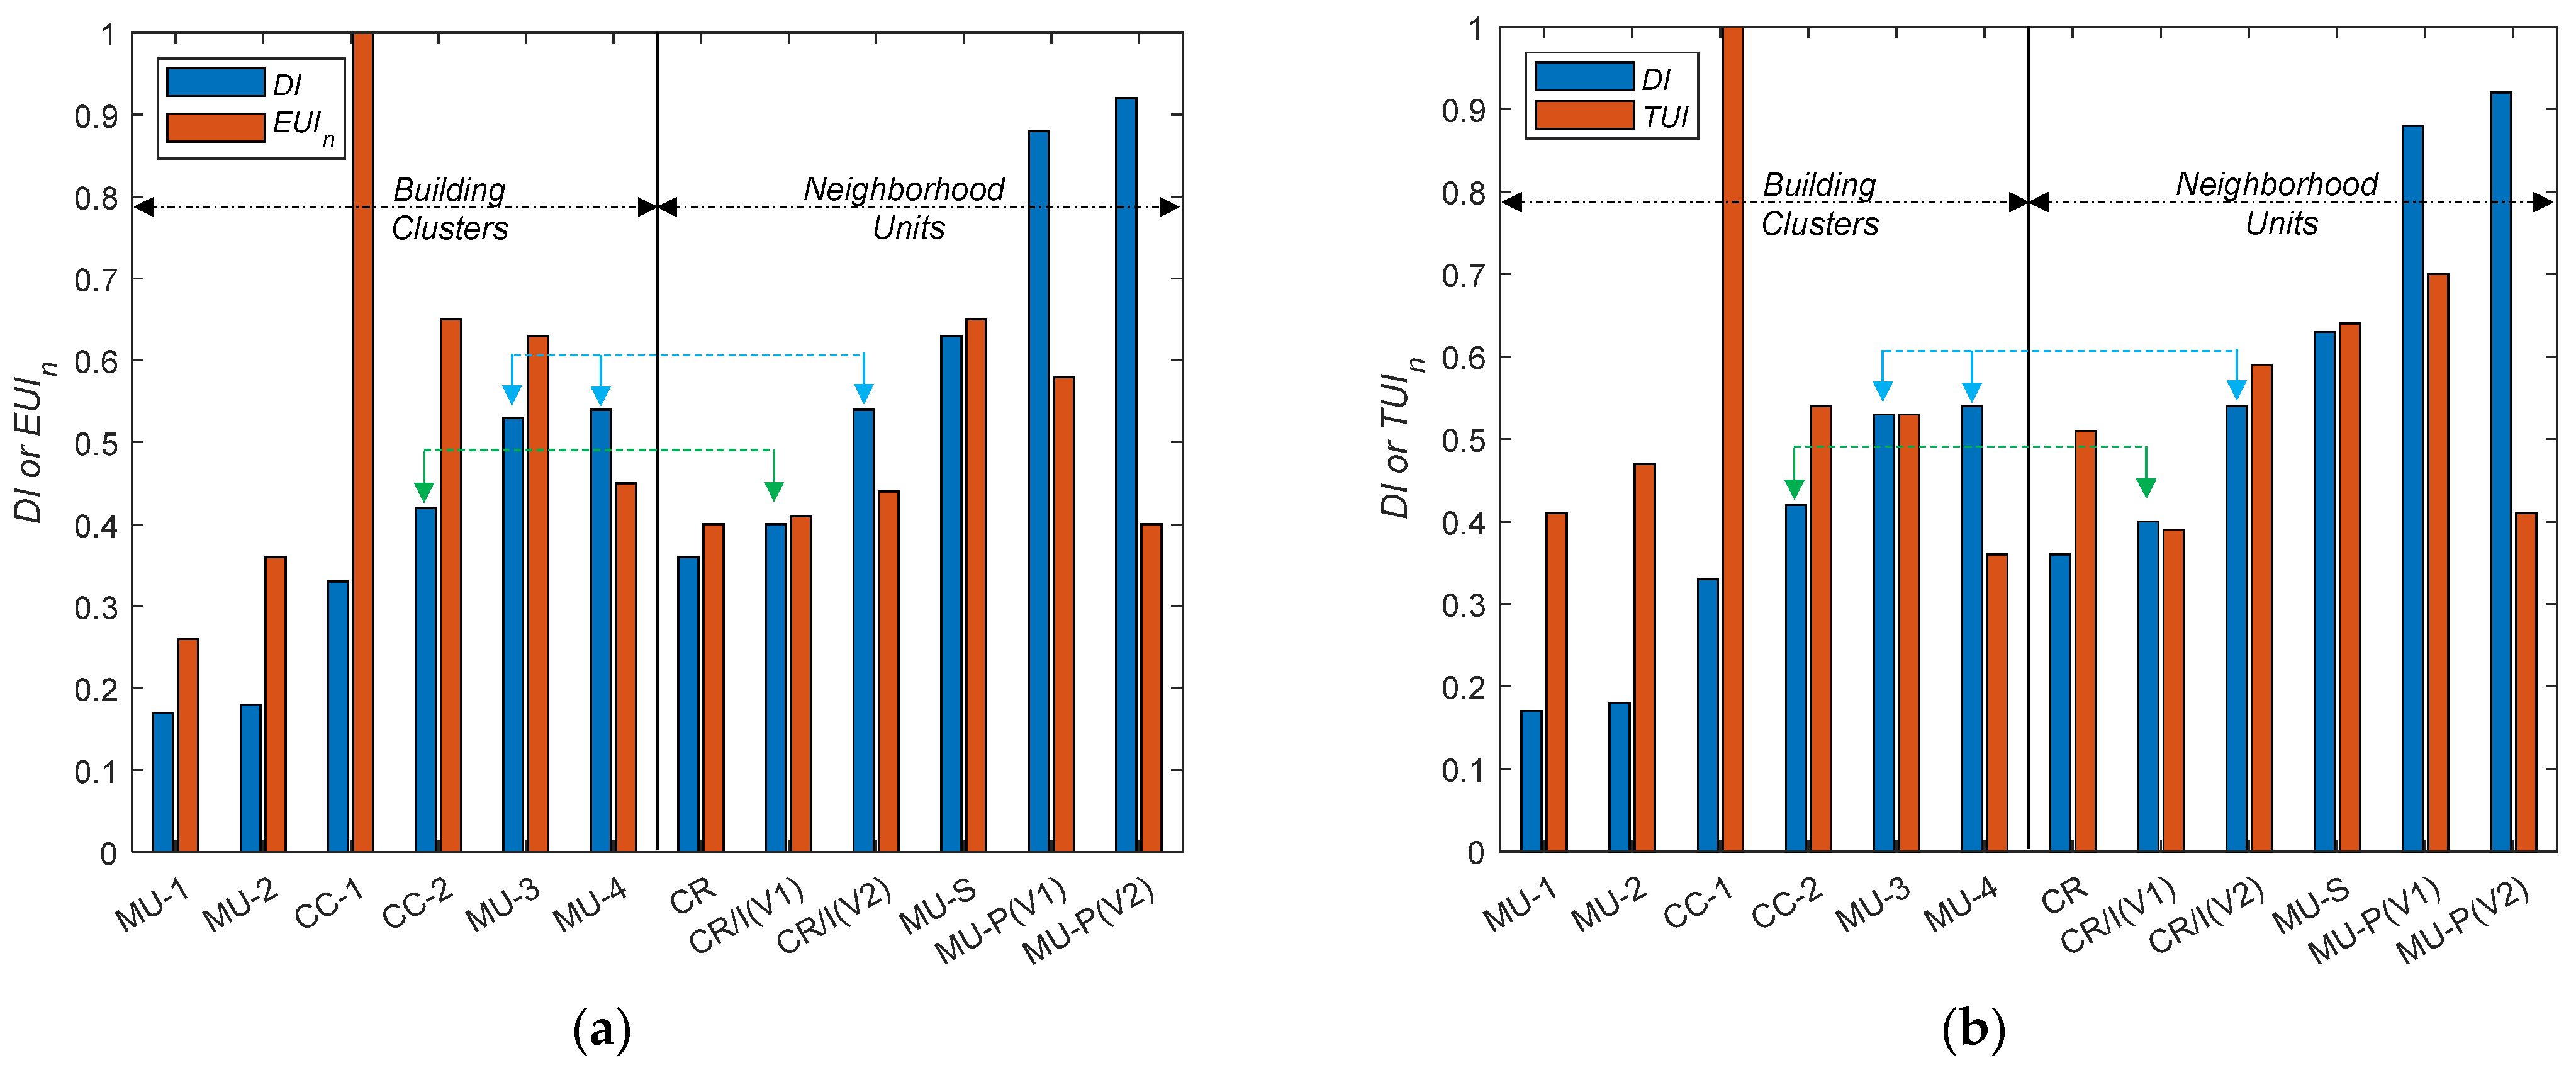
To compare the performance of BCs and NUs, diversity and energy performance indices are employed, as mentioned above. The indices of all BCs and NUs are shown in Table 2. the diversity index (DI) for the BCs varies between 0.17 to 0.54, whereas for the NUs, it lies between 0.36 and 0.92. Overall, the neighborhood units (NUs) are better in terms of diversity, promoting a mixed-use concept. One of the factors in higher DI for the NUs is that each cluster has residential units in addition to the most basic amenities for comfortable living. Other energy performance indices such as EUI, TUI, onsite generation index (OGI), and the ratio of performance (RoP) are also indicated in Table 2. Due to the inclusion of various types of buildings and their densities, the electrical and thermal performances are diverse (EUI and TUI). These diverse building mixtures result in different available surface areas for onsite energy resources installations that affect OGI and RoP.
Table 2.
Comparison of BCs and NUs.
Employing the indices presented in Table 2, the normalized values of energy performance criteria are calculated (as presented in the Methodology section). The normalized energy performance indices are correlated by employing the diversity index (DI). For instance, in Figure 5a the DI and EUIn (normalized) are plotted together for various BCs and NUs. BCs and NUs similar values of DI are compared using arrowheads (in the Figure). For example, while MU-3 and MU-4 have similar DI as CR/I (V2)), the EUIn is less for CR/I (V2). Similarly, the DI of CC-2 is comparable to CR/I(V1), EUIn is significantly less in the case of the neighborhood unit (NU)- CR/I (V1). In the case of the building clusters (BCs), the highest value of EUIn (1) is observed with a DI of 0.33 (for CC-1), whereas for NUs the maximum value of EUIn is 0.65 with a DI of 0.63 (for MU-S). Overall, the performance of NUs is better as compared to BCs. Similarly, the heating load index (TUIn) for BCs and NUs are compared in Figure 5b. In this case too, a maximum TUIn of 1 is observed for CC-1 with a low diversity index (DI of 0.33). For the NUs, a maximum TUIn of 0.7 is observed for MU-P (V1) with the diversity index (DI) of 0.88.
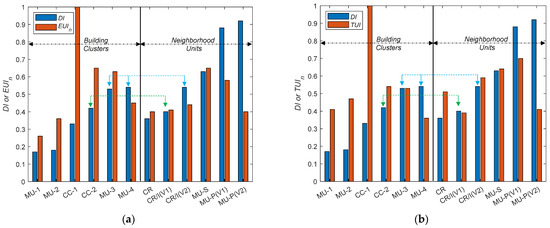
Figure 5.
Comparison of BCs and NUs based on diversity index (DI) in terms of (a) EUIn and (b) TUIn.
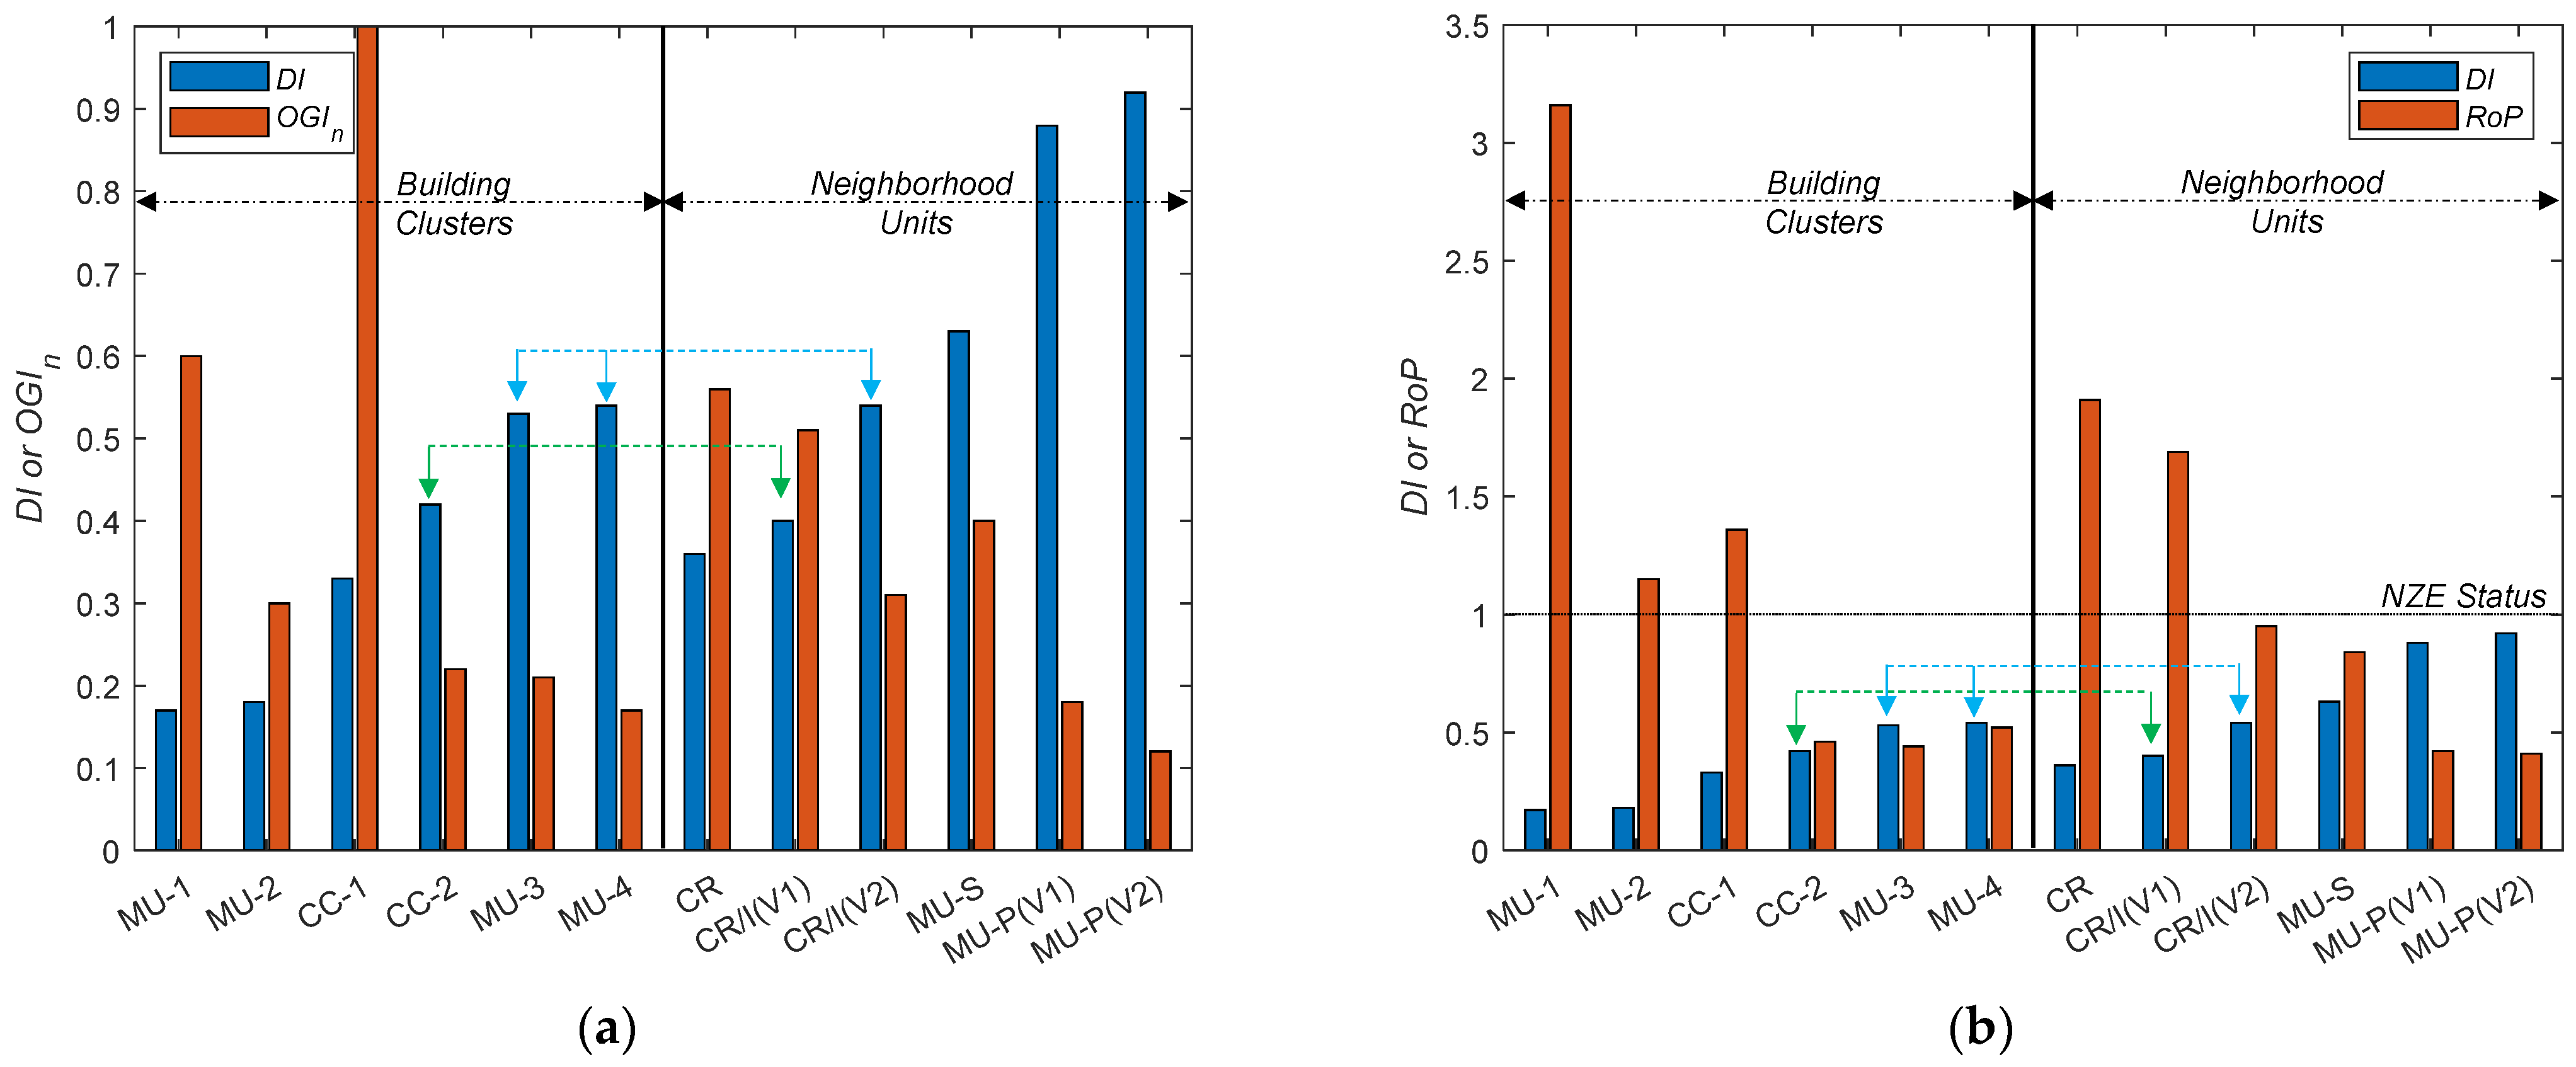
In Figure 6, the normalized onsite generation index (OGIn) and RoP are compared for all BCs and NUs. As indicated in Figure 6a, for the BCs, the highest value of OGIn (of 1) is observed for CC-1, whereas for NUs its maximum value of 0.56 is associated with CR. At the same time, it should be considered that even OGIn is higher for CC-1, the energy consumption of this building cluster is significantly higher (as discussed above). Comparing BCs and NUs with similar diversity index (DI) it can be observed that the OGIn is better in general in the case of NUs.

Figure 6.
Comparison of BCs and NUs based on diversity index (DI) in terms of (a) OGIn and (b) RoP.
The ratio of onsite generation potential to electricity consumption -RoP of all BCs and NUs is compared in Figure 6b. The RoP for BCs varies between 0.44 to 3.16 and for NUs it lies between 0.41 to 1.91. The lowest RoP in BCs is for MU-3 (RoP = 0.44), associated with a diversity index (DI) of 0.53. For NUs the lowest RoP of 0.41 is observed for MU-P (V2), corresponding to a DI of 0.92 (highest building diversity). At low and mid DI values, the RoP values of NUs are significantly higher than BCs. For instance, the low DI cluster MU-1 (DI = 0.17) in BCs yields the highest RoP of 3.16, whereas for NUs the lower DI associated with CR (DI = 0.36) has an RoP of 1.91. Comparing similar DI clusters CC-2 (in the BCs) with CR/I (V1) (in the NUs) shows that the RoP of the NU is 2.7 times higher than that of the BC.
3.2. Optimization of Energy Resources Mix
This section presents the optimization results for individual building clusters (BCs) and neighborhood units (NUs). Two methods are adopted for the optimization:
- (i)
- The WtE-CHP generation of a BC/NU is limited to the respective community waste disposal.
- (ii)
- The WtE-CHP generation is not restricted to waste disposal by the specific community, aiming at achieving net-zero status.
3.2.1. Individual Optimization of BCs
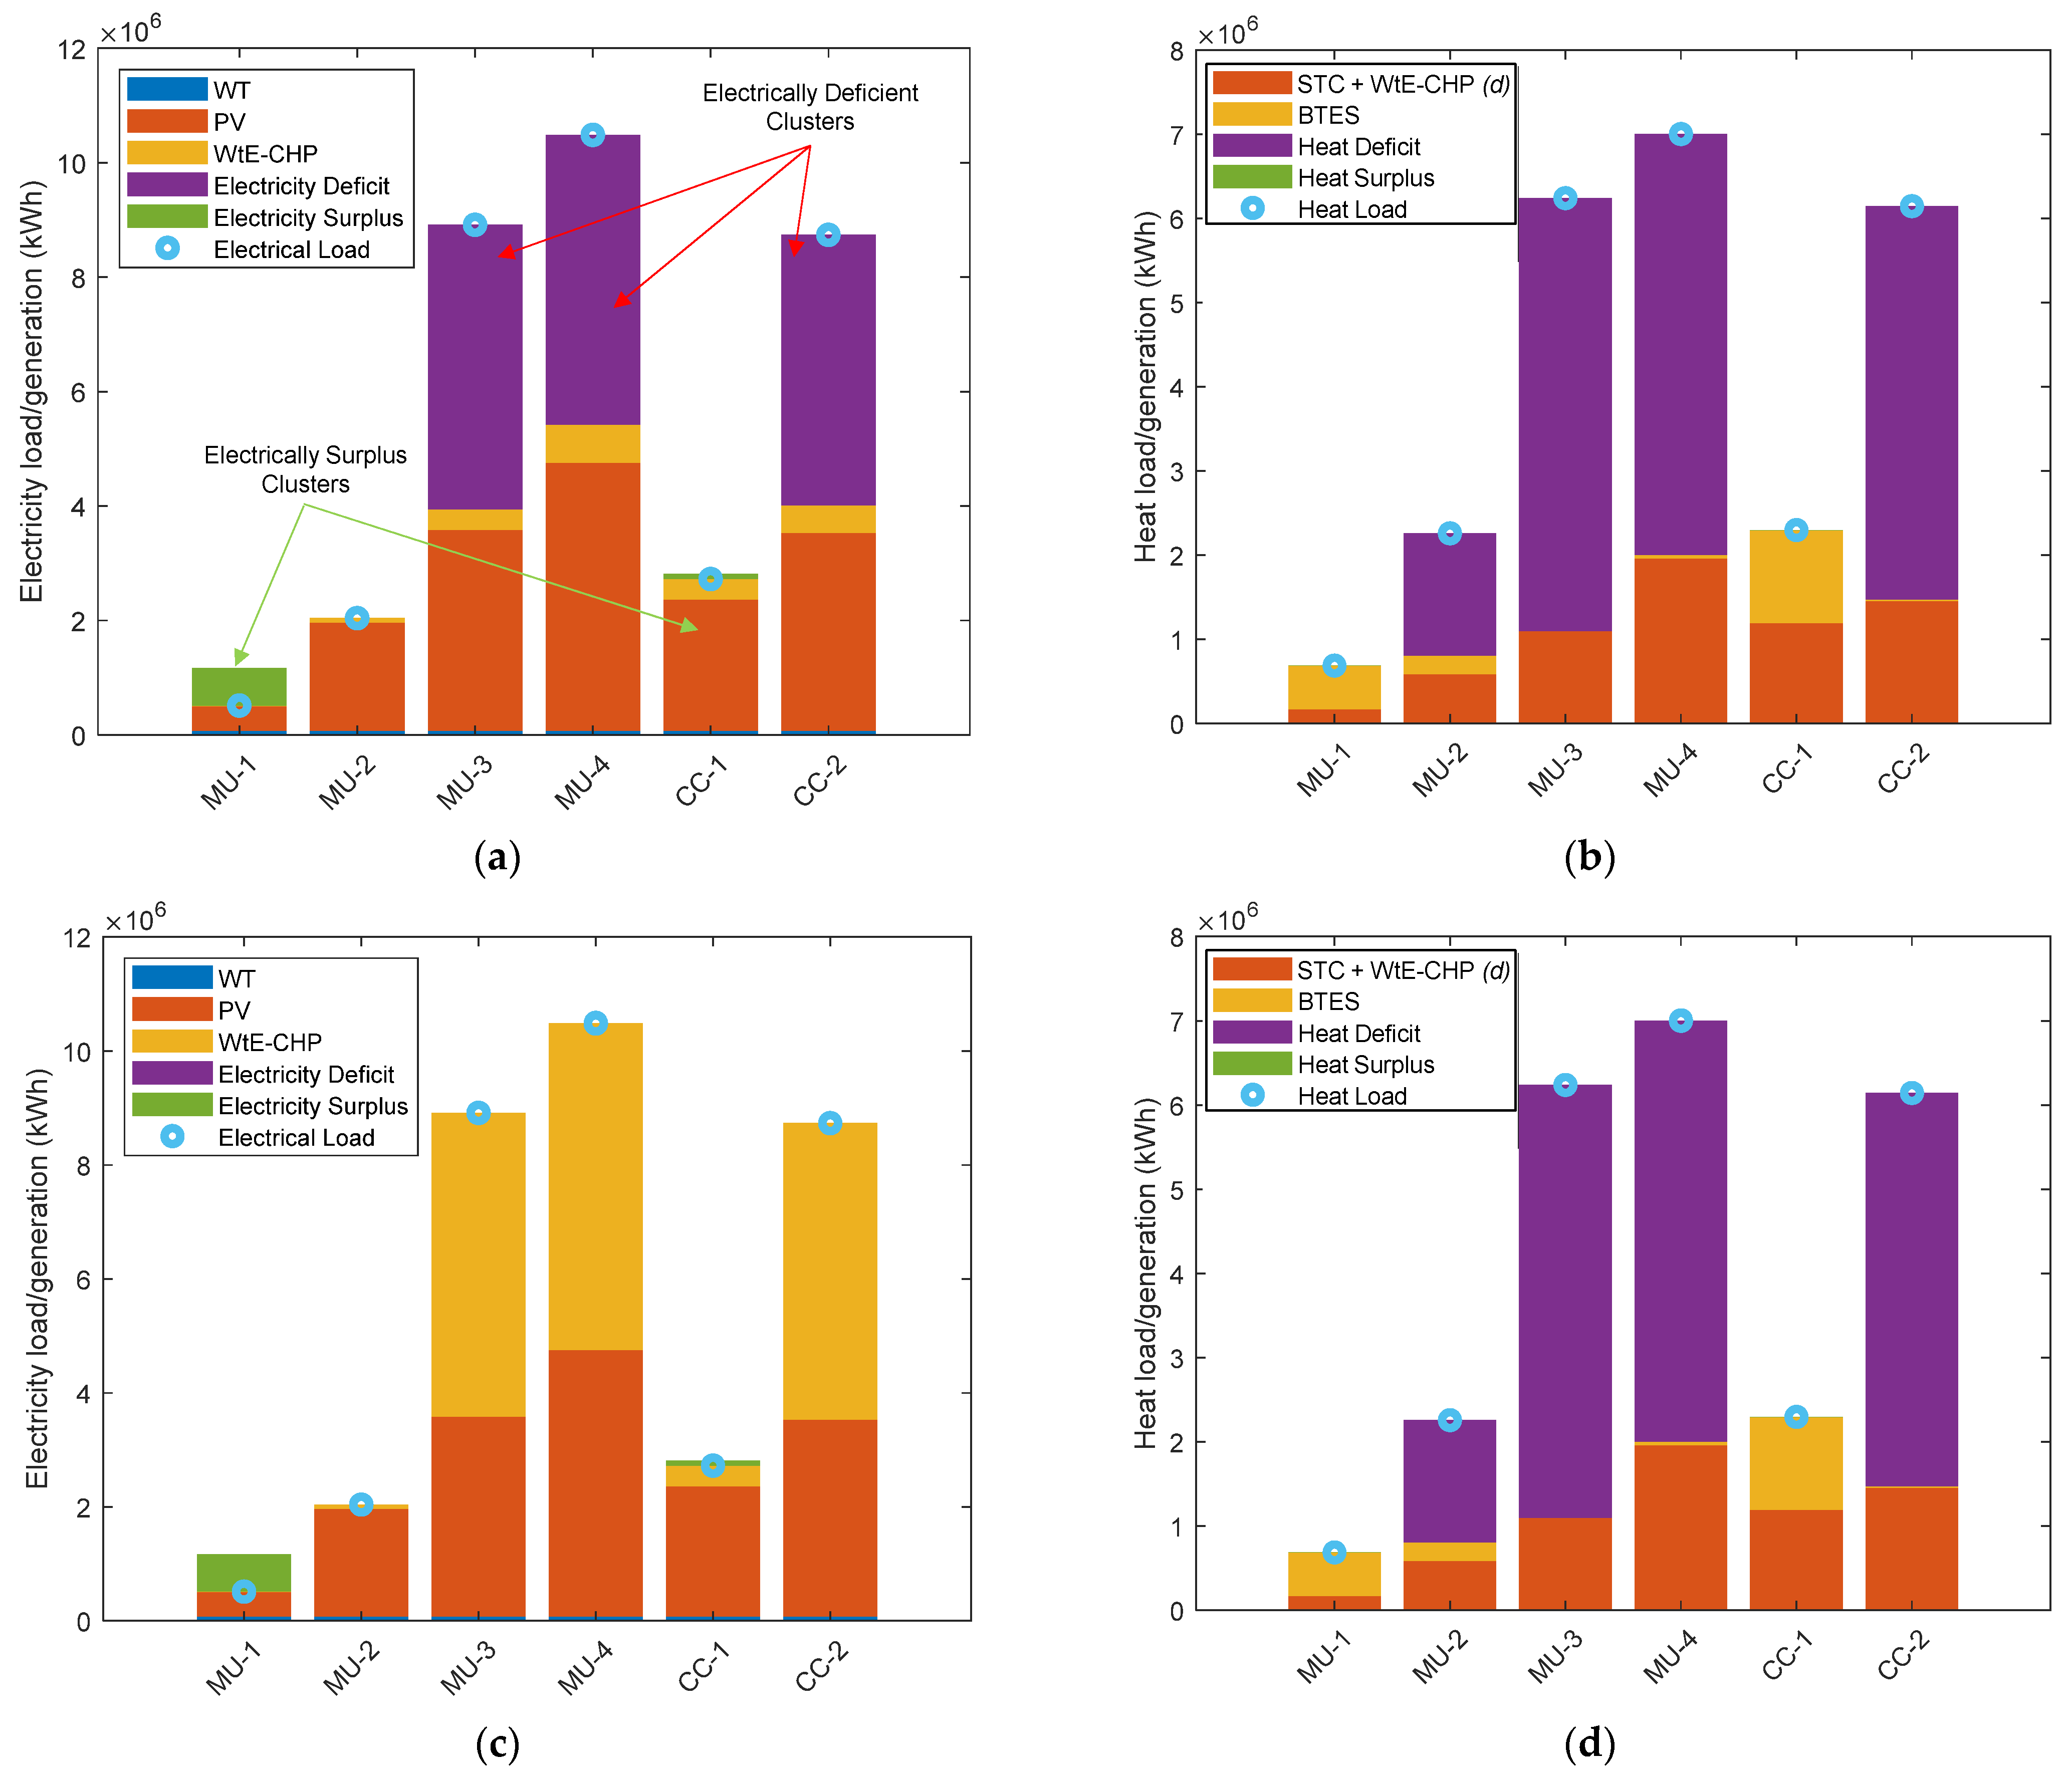
The optimization results of the energy resources mix of various individual BCs are presented in Figure 7. The results associated with the restricted WtE (Method (i) above), are presented in Figure 7a,b. Meeting the annual electrical load (represented by points in the graphs), onsite generation by various energy resources is presented in Figure 7a. WtE-CHP considers electrical generation from local waste. Building clusters such as MU-1 and CC-1 are electrically positive clusters generating electricity beyond demand while MU-2 is self-sufficient. Whereas, a significant annual electrical deficit (between 47.2 × 10⁵ to 50.7 × 10⁵ kWh) is observed for MU-3, MU-4, and CC-2 clusters. In terms of thermal energy MU-1 and CC-1 clusters are self-sufficient (Figure 7b). However, MU-2, MU-3, MU-4, and CC-2 are heat deficient (lacks by 14.5 × 10⁵ to 51.4 × 10⁵ kWh), where onsite energy potential fails to meet more than half of the heat requirements.
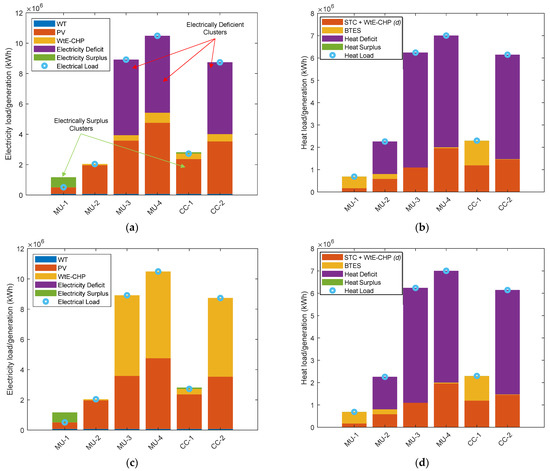
Figure 7.
Loads and optimal onsite electrical and heat generations for BCs using (a,b) cluster waste disposal limit and (c,d) no limit on waste.
The results corresponding to the non-restricted WtE (Method (ii) above), are presented in Figure 7c,d. Employing this method, the shortfall in onsite electricity generation in the electrically deficient clusters (MU-3, MU-4 and CC-2) is fulfilled using additional waste that should be imported (from outside the community). Additional waste volumes of 7652 t, 7796 t, and 7264 t are respectively required for MU-3, MU-4, and CC-2. For these clusters more than half of the electricity is generated by waste.
On the thermal energy side, as a result of additional annual waste, a prominent amount of surplus heat is available in MU-3, MU-4, and CC-2 after meeting the neighborhood heat load (Figure 7d). This thermal energy is supplied by the BTES that is primarily charged by WtE-CHP. Excess thermal energy (48 × 105 to 52 × 105 kWh) can be extracted from the BTES and supplied to neighboring communities. For instance, this additional thermal energy can be supplied to MU-2, which has a thermal energy deficit.
3.2.2. Individual Optimization of NUs
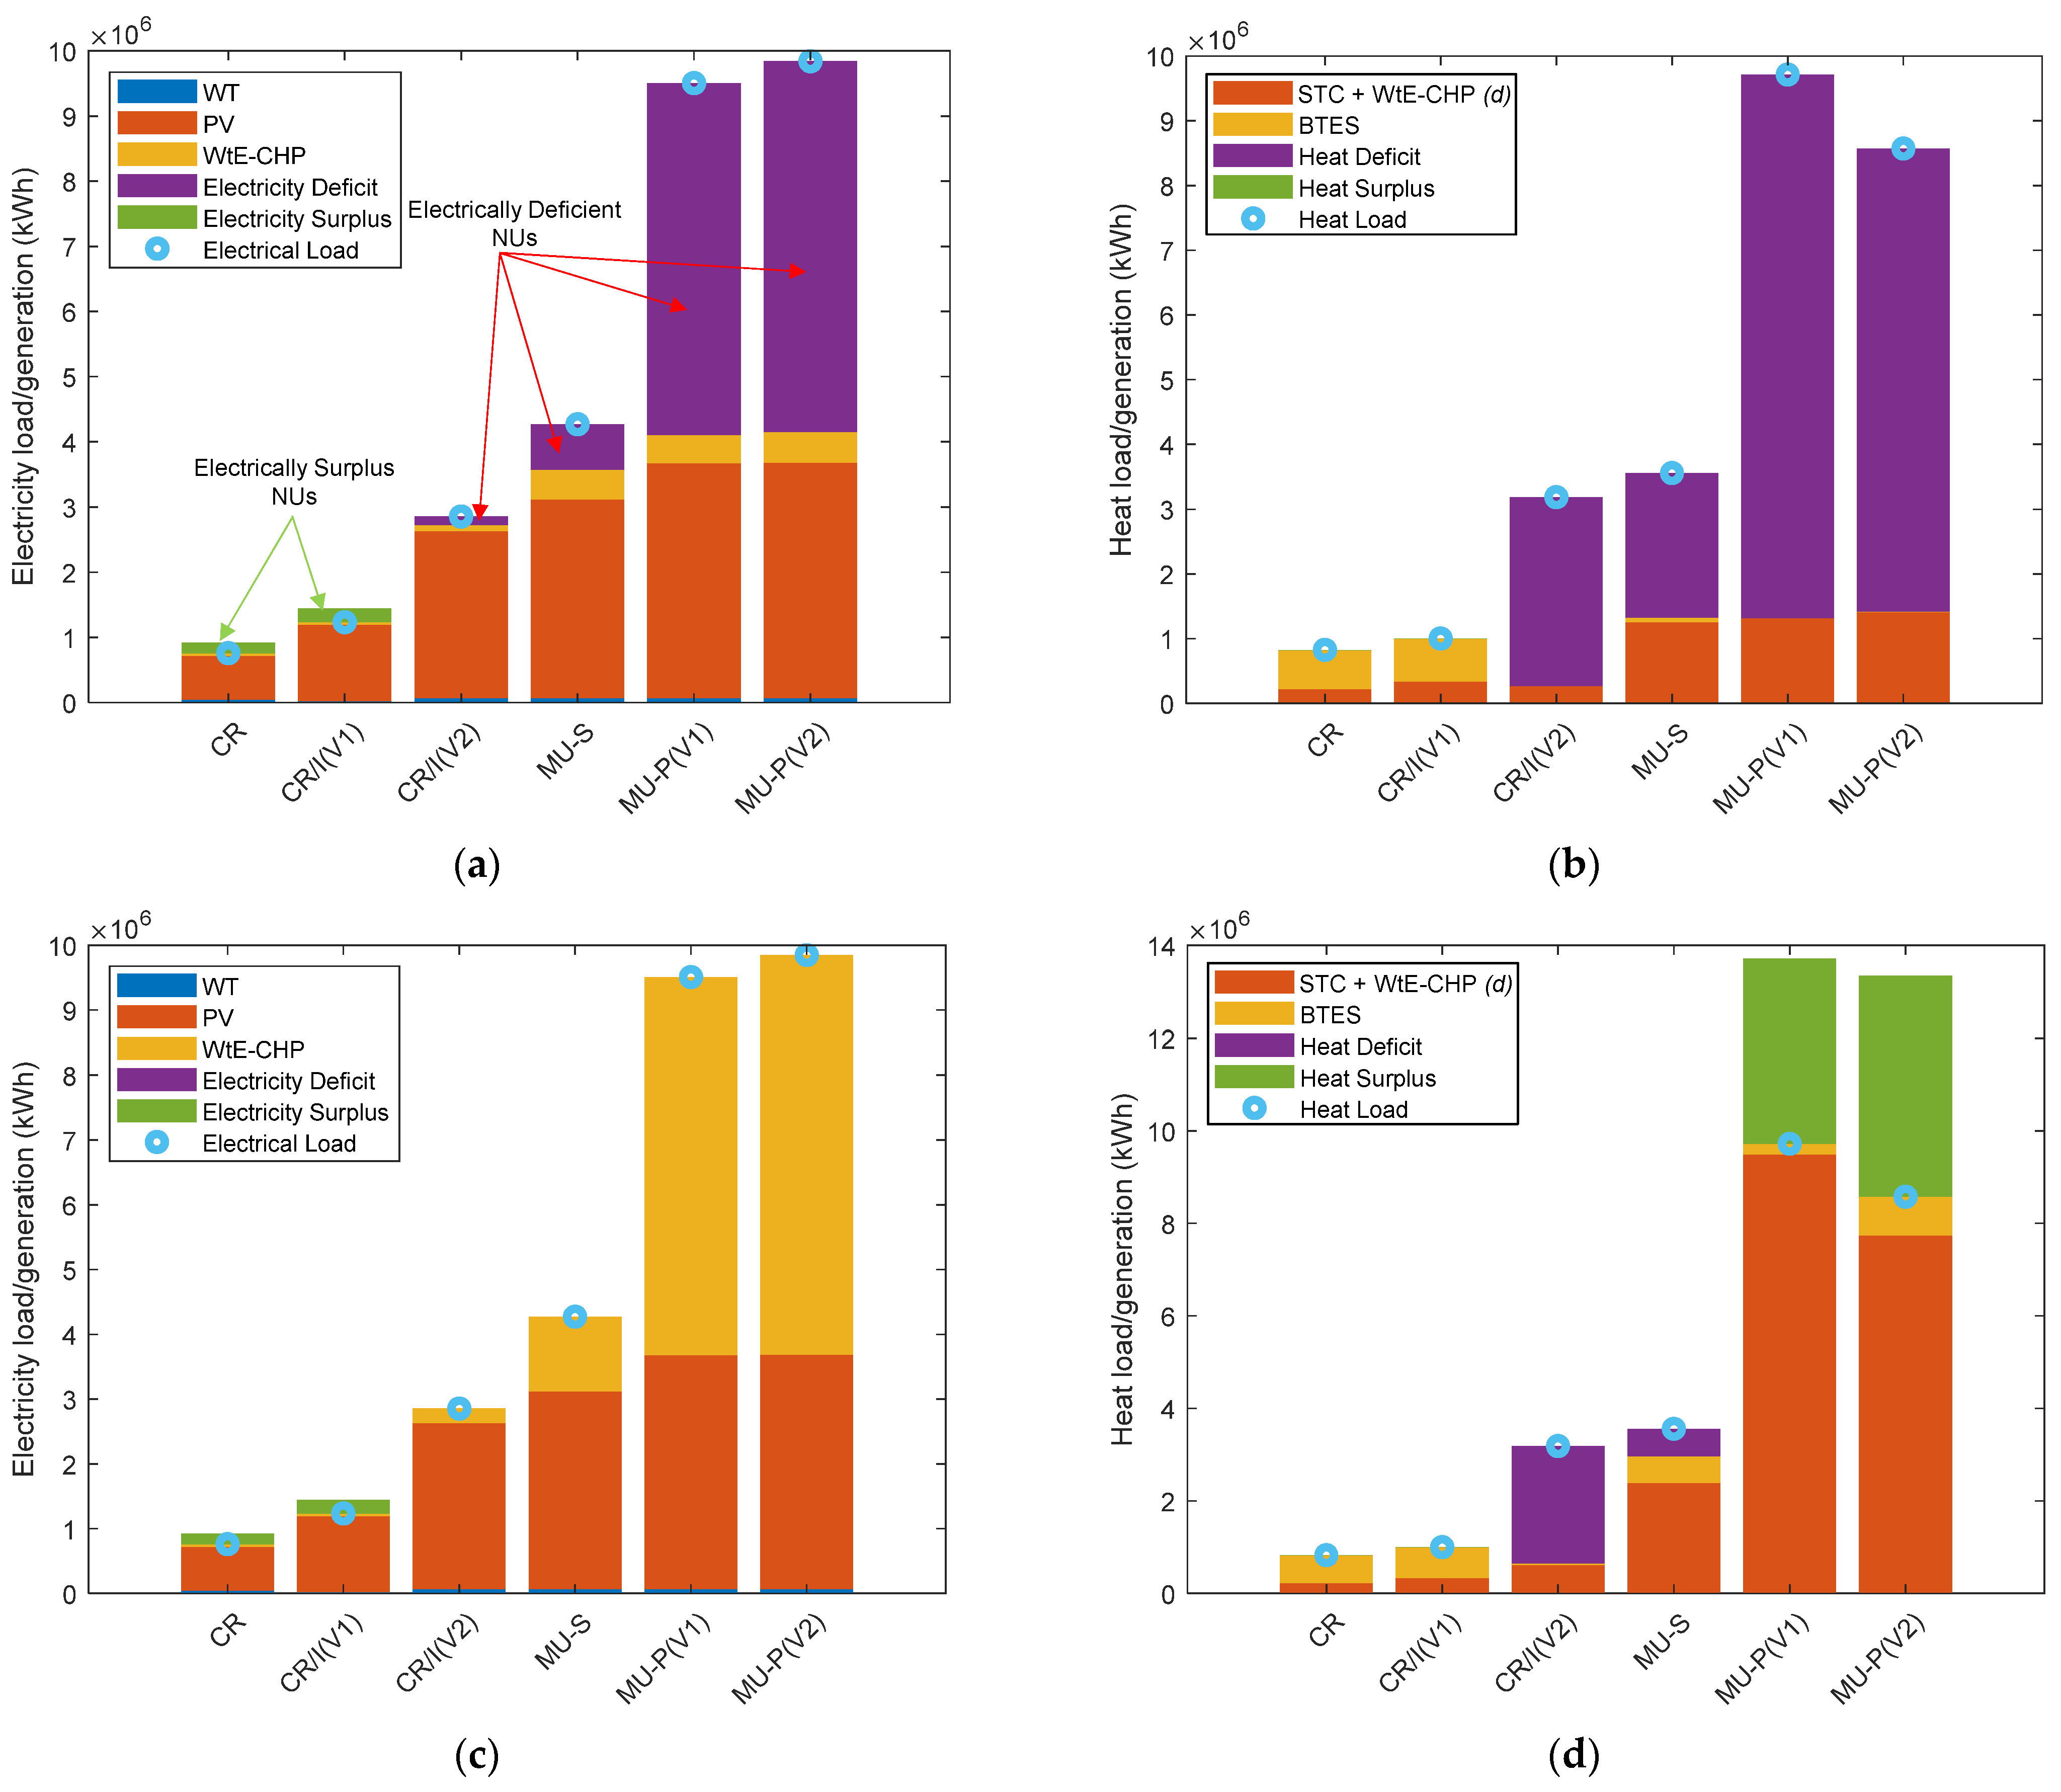
The main results of the optimization of energy resources applied to the neighborhood units (NUs) are presented in Figure 8. Limiting the waste disposal to local waste generation (in Figure 8a) results in some electrically deficient NUs such as CR/I (V2), MU-S, MU-P(V1) and MU-P (V2). The deficiency of electricity varies from 1.3 × 10⁵ to 56.9 × 10⁵ kWh. However, lower density NUs such as CR and CR/I (V1) generate excess electricity. In terms of thermal energy NUs such as CR/I (V2), MU-S, MU-P(V1) and MU-P (V2) are deficient, when WtE-CHP generation is limited (Figure 8b). The annual deficiency of thermal energy varies between 22.3 × 10⁵ and 84.0 × 10⁵ kWh.

Figure 8.
Loads and optimal onsite electrical and heat generations for the neighborhood units using (a,b) waste disposal limit and (c,d) no limit on waste.
To meet the electrical deficiency, additional waste import of 200 t, 1066 t, 8308 t, and 8759 t are required for CR/I (V2), MU-S, MU-P (V1), and MU-P (V2), respectively. This additional waste is calculated based on the electricity deficit. For neighborhood units MU-P (V1) and MU-P (V2), more than 50% of electricity is generated using waste (Figure 8c). The utilization of additional waste for WtE-CHP leads to additional thermal energy generation. NUs such as MU-P (V1) and MU-P (V2) have surplus thermal energy, which can be supplied to heat deficient NUs like CR/I (V2) and MU-S (Figure 8d). These NUs, while meeting their electrical needs from onsite energy resources, are deficient in thermal energy.
3.3. Energy Sharing Optimization
This section presents a methodology to optimize energy sharing potential among various clusters and neighborhood units. The methodology allows the utilization of the same BC/NU multiple time, employing a multiplier, to achieve a net-zero energy status.
3.3.1. Building Clusters Energy Sharing Optimization
Figure 9 presents the results of energy sharing optimization. Figure 9a shows individual cluster electrical load, cumulative electrical load, and deficit. The electricity deficit of the first three BCs increases (Figure 9a) but once energy-positive BCs such as MU-1, MU-2 and CC-1 are integrated, this deficit starts decreasing. The dotted line shows the initiation of the multiplication process, where a multiplier is employed for MU-1, MU-2, and CC-1. To meet the overall annual electricity demands of all the cluster types (considered jointly), a total of 23 clusters must be integrated including five MU-1 configurations, six MU-2 configurations, and six CC-1 configurations (Figure 9a). Figure 9b shows the onsite generation from various resources, indicating that PV is the major source of electricity generation.
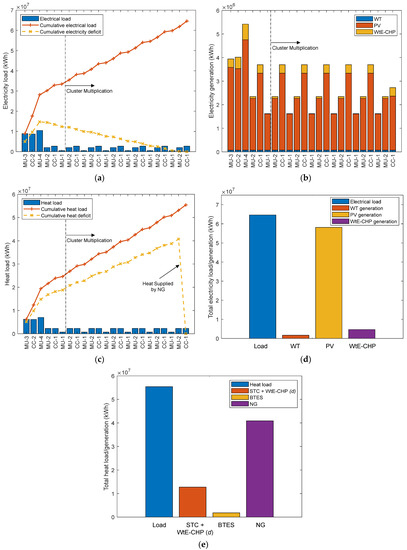
Figure 9.
Energy resource optimization for building clusters (BCs) using BC multiplication approach and its influence on (a) electrical load/deficit, (b) electrical generation, (c) heat load/deficit, (d) total electrical load and generation from onsite resources, (e) total heat load and generation from onsite resources.
The heat deficit increases during the cluster multiplication process (Figure 9c) because there is no sufficient onsite heat generation as electricity generation is prioritized. For example, building surfaces are used for PV integration rather than for STC. In this study, natural gas (NG) is assumed to meet the heat deficit. Figure 9d presents a comparison between the total annual electrical load and total onsite generations for all clusters. PV supplies about 90.2% of the total annual electrical load, whereas WtE-CHP and WT contribute by about 7.2% and 2.6% respectively to the onsite electricity generation. NG is the main source of thermal energy supplying about 73.8% of the total annual thermal load (as shown in Figure 9e), while STC + WtE-CHP and BTES satisfy 23.0% and 3.2% of the thermal load, respectively.
Satisfying the electrical deficit of various individual building clusters through optimal combinations with other clusters is explored as well. Table 3 shows that example MU-4 and MU-3 can be each optimally coupled to three MU-2, two MU-1, and two CC1 to achieve a net-zero energy neighborhood, while CC-2 can be coupled to two MU-2, two MU-1, and two CC-1.
Table 3.
Cluster multiplication optimization of individual electrically deficit building clusters (to achieve electrically neutral status).
3.3.2. Energy Sharing Optimization of Neighborhood Units
A similar approach of energy sharing optimization is adopted for the neighborhood units. NUs such as CR and CR/I (V1) having RoP potential greater than 1 are selected as multiplier NU (see Table 2 for details).
As shown in Figure 10a, all six NUs are combined. For the first two NUs- MU-P(V1) and MU-P (V2) the electrical deficit increases significantly due to less RoP potential. Thereafter for MU-S and CR/I (V2), the deficit increases marginally, starting to decrease with the combination of CR and CR/I (V1). The results indicate that in order to achieve an electrically neutral status for all studied neighborhood units (joined together), a total of 20 NUs need to be combined together, consisting of an MU-P (V1), an MU-P (V2), an MU-S, a CR/I (V2), eight CR and eight CR/I (V1) (Figure 10a). PV is the main source of electricity generation (Figure 10b) satisfying about 91.7% of the total electrical load as represented in Figure 10d. The contributions of WtE-CHP and WT to the electrical generation are 4.9% and 3.4%, respectively.
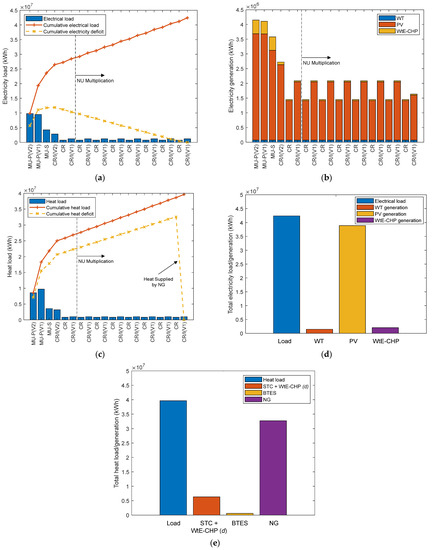
Figure 10.
Energy resource optimization for NUs using NU multiplication approach and its influence on (a) electrical load/deficit, (b) electrical generation, (c) heat load/deficit, (d) total electrical load and generation from onsite resources, (e) total heat load and generation from onsite resources.
The cumulative heat deficit increases along the combination process as observed in Figure 10c. Therefore, an alternative source for thermal energy is required, such as NG in this work. As indicated in Figure 10e, NG contributes to 82.6% of the total thermal load of all 20 NUs, while STC + WtE-CHP and BTES contribute to 15.9% and 1.5% of the thermal load, respectively.
The individual electrically deficit NUs are optimized using the multiplication optimization method. MU-P (V1) and MU-P (V2) both require eight electrically positive neighborhood units (EPCs) four CR and four CR/I (V1). MU-S can be optimally coupled to a CR, and a CR/I (V1), while CR/I (V2) can be coupled to a CR (Table 4).
Table 4.
Cluster multiplication optimization of individual electrically deficit neighborhood units (to achieve electrically neutral status).
4. Discussion
This section summarizes the main results presented in this paper. These are presented in three different subsections: the comparison of commonly designed building clusters to the neighborhood units, the optimization of energy mix within all the studied developments, and finally the discussion of energy sharing between these developments.
4.1. Comparison of BCs and NUs
The main observations of the comparative study between the building clusters (BCs) and the neighborhood units (NUs), are summarized below.
- Measuring the diversity of building types within the BCs and NUs, employing a diversity index (DI), indicates that the arrangement of NUs is better than BCs. The DI for BCs ranges between 0.17 and 0.54, where its value lies between 0.36 and 0.92 for the NUs. Hence the NUs, implementing various sustainable considerations in the selection of building types, have more diverse usage of buildings.
- Comparing the normalized electricity use index (EUIn) between the BCs and NUs (with similar DI) suggests better performance of the NUs. The highest EUIn value is 1 for the building clusters as compared to its highest value of 0.65 in the neighborhood units.
- The normalized heating load index (TUIn) suggests better performance of NUs as compared to the BCs. The value of this index lies between 0.36 and 1.00 for BCs and 0.39 to 0.70 for NUs.
- Onsite generation opportunities are significantly better in the case of NUs. Except for CC-1 and MU-1 (in the BCs), the normalized onsite generation index (OGIn) for all other BCs varies between 0.17 and 0.30. At the same time, the energy consumption for CC-1 is significantly high with a low diversity index (as it mainly includes commercial buildings). On the other hand, OGIn for the neighborhood units (NUs) ranges from 0.12 to 0.56 with improved diversity index and less energy consumption (e.g., OGIn of 0.12 is associated with a high DI of 0.92).
- The energy performance analysis of both sets of developments (BCs and NUs) represented by the ratio of performance (RoP) indicates an overall better performance of the NUs. For example, although MU-1 (in the BCs) has the highest RoP value of 3.16, this cluster has the lowest DI (of 0.17), being a low density and low usage diversity cluster (detached houses and primary school). For the neighborhood units, the highest RoP of 1.91 is associated with the CR neighborhood unit, having a DI of 0.36. Comparing BCs and NUs with similar DI, the RoP of the neighborhood CR/I (V1) is 2.7 times higher than the cluster CC2.
4.2. Optimization of Energy Mix
Below is a discussion of the main results of the optimization of energy resources mix, within various individual building clusters and neighborhood units.
- Analyzing the electrical performance of the building clusters, MU-1 and CC-1 are electrically positive clusters, whereas MU-3, MU-4, and CC-2 are unable to meet their electrical need using onsite energy resources. The electrical deficit varies between 47.2 × 10⁵ and 50.7 × 10⁵ kWh (48% to 56% of total annual electricity demand). Accordingly, a significant amount of waste varying from 7264 t to 7796 t is required to be imported from outside these clusters to satisfy the electricity demand.
- The study of the thermal energy performance of building clusters indicates that MU-2, MU-3, MU-4, and CC-2 experience a deficit of thermal energy (ranging from 14.5 × 10⁵ to 51.4 × 10⁵ kWh, or 64% and 82% thermal deficiency in comparison with the annual demand), while MU-1 and CC-1 are self-sufficient.
- Assuming that WtE-CHP generation is not restricted by the amount of waste disposal in a cluster, not only the electrical demand of clusters can be fulfilled, but a significant surplus of thermal energy can be generated for MU-3, MU-4, and CC-2 clusters. This surplus heat is between 48 × 105 and 52 × 105 kWh, which is calculated as heat available for extraction from BTES (equivalent to 50% of heat charged). This surplus heat can supply to neighboring urban setups.
- The study of the electrical performance of the neighborhood units indicates that CR/I(V2), MU-S, MU-P(V1), and MU-P(V2) are electrically deficient clusters. The electrical energy deficit ranges from 1.3 × 10⁵ to 56.9 × 10⁵ kWh. Electrical deficit to demand percentage varies from 5% (for CR/I (V2)) to 58% (for MU-P (V2)). To meet this electrical load, additional waste volumes varying from 200 t to 8759 t should be imported to increase the WtE-CHP production. These four Nus are also heat deficient (from 22.3 × 10⁵ to 84.0 × 10⁵ kWh, or 63% to 91% shortfall in thermal generation as compared to the annual demand). On the other hand, CR and CR/I (V1) neighborhoods are electrically positive and self-sufficient in meeting the thermal load.
- Keeping no limit on WtE-CHP generation, electrical needs of CR/I (V2), MU-S, MU-P (V1), and MU-P (V2) can be met. For the neighborhood units MU-P (V1) and MU-P (V2), more than half of the electrical demand is met using WtE-CHP. NUs such as MU-P (V1) and MU-P (V2) generate a significant amount of surplus heat that can be supplied to neighboring clusters.
4.3. Energy Sharing Optimization
The energy sharing potential among various BCs and NUs is based on optimizing the combination of various types of BCs/NUs, to achieve an electrical neutral development. To reach this objective, some electrically positive BCs/NUs are employed multiple times in the same combination of neighborhoods. The main observations are discussed below.
- A total of 23 building clusters needs to be coupled together to achieve a net-zero electrical status of all the studied BCs, jointly considered. This includes the combination of multiple electrically positive BCs (such as those characterized by a low diversity index). In such a combination of clusters, PV is the major source of electrical generation (90.2%), whereas the contributions of WtE-CHP and WT are 7.2% and 2.6%, respectively. Other optimal combinations include one building cluster with a large energy deficit and multiple electrically positive BCs.
- In the case of the neighborhood units, a total of 20 clusters needs to be combined to satisfy the electrical demand of all the studied NUs (jointly considered). This includes one cluster of each of the high density, high diversity NUs (e.g., MU-P (V1), MU-P (V2), MU-S, and CR/I (V2)), and multiple lower density and low diversity NUs (i.e., 8 CR and 8 CR/I (V1)). PV generates 91.7% of the total annual electricity demands, whereas the contributions of WtE-CHP and WT are 4.9% and 3.4%, respectively. Other optimal combinations include fewer numbers of NUs, such as one NU with high electrical load, coupled to a single or multiple electrically positive NUs.
- The thermal load of all combinations, both for the building clusters and neighborhood units is not satisfied from onsite resources. An alternative source of thermal energy needs to be employed to satisfy this load, for space heating and domestic hot water. Natural gas is employed in this work to supply around 79% of the thermal load for the BC combinations of 23 clusters, and about 83% of the NUs combination of 20 clusters. Other lower impact strategies can be investigated in the future to further reduce the environmental impact of these communities.
5. Conclusions
This paper presents a useful insight into the impact of design considerations of urban developments on energy performance and mixes of energy resources. It presents a unique approach to determine optimal combinations of small-scale neighborhoods (of 5 acres), to achieve larger scale net-zero energy urban developments.
The study indicates that highly mixed and diverse urban developments—called neighborhood units—designed according to various sustainable principles has in general better energy performance than developments commonly found in the North American context. These neighborhood units not only combine various amenities within a walkable distance but also balances onsite renewable generation and energy utilization. Some of these neighborhood units with lower diversity, but still including basic amenities such as schools, retail areas, small offices, and restaurants together with residential buildings, can achieve a net positive status. Highly diverse neighborhoods that include large commercial areas generate about 84% and 37% of their annual electrical and thermal consumptions, respectively.
Coupling several buildings clusters and neighborhood units with various energy generation and energy consumption profiles allows energy sharing among those that have excess energy generation and those with an energy deficit. In this study, the attempt to achieve a net-zero energy for all combined neighborhoods/clusters, requires including multiple energy-positive clusters and neighborhood units, within the same combination. The number of the same energy-positive clusters or neighborhoods units within a development, and thus the development size, depends on the type and number of the clusters and neighborhood units with an energy deficit.
Although this work focuses on electrical energy, strategies to increase the share of renewable sources in the generation of thermal energy will be further developed. The innovative approach presented in this work can present a valuable tool in planning urban developments of various scales, aiming at achieving a neutral energy or energy positive status. This methodology allows to determine the most useful combinations of neighborhood units to balance energy performance and quality of life.
Author Contributions
All authors have jointly contributed to this research work. Conceptualization, C.H.-V. and K.S.; methodology, C.H.-V. and K.S.; software, C.H.-V. and K.S.; validation, C.H.-V. and K.S.; formal analysis, C.H.-V. and K.S.; investigation, C.H.-V. and K.S.; resources, C.H.-V. and K.S.; data curation, C.H.-V. and K.S.; writing—original draft preparation, C.H.-V. and K.S.; writing—review and editing, C.H.-V. and K.S.; visualization, C.H.-V. and K.S.; supervision, C.H.-V. All authors have read and agreed to the published version of the manuscript.
Funding
This research acknowledges the funding received from Natural Sciences and Engineering Research Council of Canada (NSERC, Canada) under Discovery Grant held by Dr. Hachem-Vermette.
Institutional Review Board Statement
Not applicable.
Informed Consent Statement
Not applicable.
Data Availability Statement
Not applicable.
Conflicts of Interest
The authors declare no conflict of interest.
Nomenclature
| AES | alternative energy resources |
| BC | building cluster |
| BTES | borehole thermal energy storage |
| CN | cluster number |
| CC | commercial cluster |
| CR | core cluster archetype |
| CR/I | residential/institutional archetype |
| DI | diversity index |
| EC | energy credits [kWh] |
| EUI | electricity use index [kWh/m2-y] |
| LED | light-emitting diode |
| MU | mixed-use |
| MU-S | residential/commercial archetype |
| NG | natural gas |
| NU | neighborhood unit |
| OGI | onsite generation index |
| PM | population measure |
| PV | photovoltaics |
| Q | thermal load [kWh] |
| RES | renewable energy sources |
| RoP | ratio of performance |
| STC | solar thermal collectors |
| TUI | thermal use index [kWh/m2-y] |
| UM | building usage/type measure |
| WT | wind turbines (vertical axis) |
| WtE-CHP | waste-to-energy combined heat and power |
| Subscripts | |
| cum | cumulative |
| h | hour |
| n | normalized value |
| Symbols | |
| Δ | deficit |
References
- Perry, C.A. City planning for neighborhood life. Soc. F. 1929, 8, 98. [Google Scholar] [CrossRef]
- Wellman, B.; Leighton, B. Networks, neighborhoods, and communities: Approaches to the study of the community question. Urban Aff. Q. 1979, 14, 363–390. [Google Scholar] [CrossRef]
- Zhang, X.; Lovati, M.; Vigna, I.; Widén, J.; Han, M.; Gal, C.; Feng, T. A review of urban energy systems at building cluster level incorporating renewable-energy-source (RES) envelope solutions. Appl. Energy 2018, 230, 1034–1056. [Google Scholar] [CrossRef]
- Strasser, H.; Kimman, J.; Koch, A.; am Tinkhof, O.M.; Müller, D.; Schiefelbein, J.; Slotterback, C. IEA EBC annex 63–implementation of energy strategies in communities. Energy Build. 2018, 158, 123–134. [Google Scholar] [CrossRef]
- Walker, S.; Labeodan, T.; Boxem, G.; Maassen, W.; Zeiler, W. An assessment methodology of sustainable energy transition scenarios for realizing energy neutral neighborhoods. Appl. Energy 2018, 228, 2346–2360. [Google Scholar] [CrossRef]
- Behfar, A.; Alam, M.M.R.; Shahmoradi, R.; Tadi, M.; Vahabzadeh, S. Optimizing energy performance of a neighborhood via IMM® methodology: Case Study of Barcelona. J. Energy 2013, 7, 74–85. [Google Scholar]
- Hachem-Vermette, C.; Singh, K. Developing an optimization methodology for urban energy resources mix. Appl. Energy 2020, 269, 115066. [Google Scholar] [CrossRef]
- Singh, K.; Hachem-vermette, C. Economical energy resource planning to promote sustainable urban design. Renew. Sustain. Energy Rev. 2021, 137, 110619. [Google Scholar] [CrossRef]
- Hofierka, J.; Kaňuk, J. Assessment of photovoltaic potential in urban areas using open-source solar radiation tools. Renew. Energy 2009, 34, 2206–2214. [Google Scholar] [CrossRef]
- Freitas, S.; Catita, C.; Redweik, P.; Brito, M.C. Modelling solar potential in the urban environment: State-of-the-art review. Renew. Sustain. Energy Rev. 2015, 41, 915–931. [Google Scholar] [CrossRef]
- Gagliano, A.; Nocera, F.; Patania, F.; Capizzi, A. Assessment of micro-wind turbines performance in the urban environments: An aided methodology through geographical information systems. Int. J. Energy Environ. Eng. 2013, 4, 43. [Google Scholar] [CrossRef] [Green Version]
- Kammen, D.M.; Sunter, D.A. City-integrated renewable energy for urban sustainability. Science 2016, 352, 922–928. [Google Scholar] [CrossRef] [PubMed] [Green Version]
- Amini, H.R.; Reinhart, D.R. Regional prediction of long-term landfill gas to energy potential. Waste Manag. 2011, 31, 2020–2026. [Google Scholar] [CrossRef]
- McLeskey, J.T.; Terziotti, L.T.; Sweet, M.L. Modeling seasonal solar thermal energy storage in a large urban residential building using TRNSYS 16. Energy Build. 2012, 45, 28–31. [Google Scholar] [CrossRef]
- Rey, E. Integration of energy issues into the design process of sustainable neighborhoods. In Proceedings of the PLEA 2006, 23rd international Conference on Passive and Low Energy Architecture, Geneva, Switzerland, 6–8 September 2006; pp. 679–682. [Google Scholar]
- Osdoba, T.; Dunn, E.; Van Hemert, H.; Love, J. The role of district energy in greening existing neighborhoods: A primer for policy makers and local government officials. WIT Trans. Ecol. Environ. 2011, 143, 217–227. [Google Scholar]
- Connolly, D.; Lund, H.; Mathiesen, B.V.; Werner, S.; Möller, B.; Persson, U.; Boermans, T.; Trier, D.; Østergaard, P.A.; Nielsen, S. Heat Roadmap Europe: Combining district heating with heat savings to decarbonise the EU energy system. Energy Policy 2014, 65, 475–489. [Google Scholar] [CrossRef]
- Bai, Z.; Liu, Q.; Hong, H.; Jin, H. New solar-biomass power generation system integrated a two-stage gasifie. Appl. Energy 2017, 194, 310–319. [Google Scholar] [CrossRef]
- Ala-Juusela, M.; Crosbie, T.; Hukkalainen, M. Defining and operationalising the concept of an energy positive neighbourhood. Energy Convers. Manag. 2016, 125, 133–140. [Google Scholar] [CrossRef] [Green Version]
- O’Dwyer, E.; Pan, I.; Acha, S.; Shah, N. Smart energy systems for sustainable smart cities: Current developments, trends and future directions. Appl. Energy 2019, 237, 581–597. [Google Scholar] [CrossRef] [Green Version]
- Dai, R.; Hu, M.; Yang, D.; Chen, Y. A collaborative operation decision model for distributed building clusters. Energy 2015, 84, 759–773. [Google Scholar] [CrossRef]
- Mavromatidis, G.; Orehounig, K.; Carmeliet, J. Uncertainty and global sensitivity analysis for the optimal design of distributed energy systems. Appl. Energy 2018, 214, 219–238. [Google Scholar] [CrossRef]
- Mostafavi Sani, M.; Mostafavi Sani, H.; Fowler, M.; Elkamel, A.; Noorpoor, A.; Ghasemi, A. Optimal energy hub development to supply heating, cooling, electricity and freshwater for a coastal urban area taking into account economic and environmental factors. Energy 2022, 238, 121743. [Google Scholar] [CrossRef]
- Koirala, B.P.; Koliou, E.; Friege, J.; Hakvoort, R.A.; Herder, P.M. Energetic communities for community energy: A review of key issues and trends shaping integrated community energy systems. Renew. Sustain. Energy Rev. 2016, 56, 722–744. [Google Scholar] [CrossRef] [Green Version]
- Singh, K.; Hachem-Vermette, C. Energy sharing between sustainable residential and conventional commercial buildings cluster. In Proceedings of the 35th PLEA Conference: Planning Post Carbon Cities, A Coruña, Spain, 1–3 September 2020. [Google Scholar]
- Rastegar, M.; Fotuhi-Firuzabad, M. Load management in a residential energy hub with renewable distributed energy resources. Energy Build. 2015, 107, 234–242. [Google Scholar] [CrossRef]
- Hanafizadeh, P.; Eshraghi, J.; Ahmadi, P.; Sattari, A. Evaluation and sizing of a CCHP system for a commercial and office buildings. J. Build. Eng. 2016, 5, 67–78. [Google Scholar] [CrossRef]
- Li, L.; Mu, H.; Li, N.; Li, M. Economic and environmental optimization for distributed energy resource systems coupled with district energy networks. Energy 2016, 109, 947–960. [Google Scholar] [CrossRef]
- Ma, S.; Zhou, D.; Zhang, H.; Weng, S.; Shao, T. Modeling and operational optimization based on energy hubs for complex energy networks with distributed energy resources. J. Energy Resour. Technol. 2019, 141, 022002. [Google Scholar] [CrossRef]
- Qi, H.; Yue, H.; Zhang, J.; Lo, K.L. Optimisation of a smart energy hub with integration of combined heat and power, demand side response and energy storage. Energy 2021, 234, 121268. [Google Scholar] [CrossRef]
- Ghanbari, A.; Karimi, H.; Jadid, S. Optimal planning and operation of multi-carrier networked microgrids considering multi-energy hubs in distribution networks. Energy 2020, 204, 117936. [Google Scholar] [CrossRef]
- Falke, T.; Krengel, S.; Meinerzhagen, A.K.; Schnettler, A. Multi-objective optimization and simulation model for the design of distributed energy systems. Appl. Energy 2016, 184, 1508–1516. [Google Scholar] [CrossRef]
- Ren, H.; Zhou, W.; Nakagami, K.; Gao, W.; Wu, Q. Multi-objective optimization for the operation of distributed energy systems considering economic and environmental aspects. Appl. Energy 2010, 87, 3642–3651. [Google Scholar] [CrossRef]
- Tooryan, F.; HassanzadehFard, H.; Collins, E.R.; Jin, S.; Ramezani, B. Optimization and energy management of distributed energy resources for a hybrid residential microgrid. J. Energy Storage 2020, 30, 101556. [Google Scholar] [CrossRef]
- Hachem-Vermette, C.; Singh, K. Optimization of energy resources in various building cluster archetypes. Renew. Sustain. Energy Rev. 2022, 157, 112050. [Google Scholar] [CrossRef]
- National Renewable Energy Laboratory (NREL) EnergyPlus. Available online: https://energyplus.net/ (accessed on 28 November 2018).
- Hachem, C.; Grewal, K.S. Investigation of the impact of residential mixture on energy and environmental performance of mixed use neighborhoods. Appl. Energy 2019, 241, 362–379. [Google Scholar] [CrossRef]
- Deru, M.; Field, K.; Studer, D.; Benne, K.; Griffith, B.; Torcellini, P.; Liu, B.; Halverson, M.; Winiarski, D.; Rosenberg, M.; et al. U.S. Department of Energy Commercial Reference Building Models of the National Building Stock; U.S. Department of Energy: Oak Ridge, TN, USA, 2011.
- US Department of Energy Commercial Buildings. Available online: https://www.energy.gov/science-innovation/energy-efficiency/commercial-buildings (accessed on 16 November 2018).


Publisher’s Note: MDPI stays neutral with regard to jurisdictional claims in published maps and institutional affiliations. |
© 2022 by the authors. Licensee MDPI, Basel, Switzerland. This article is an open access article distributed under the terms and conditions of the Creative Commons Attribution (CC BY) license (https://creativecommons.org/licenses/by/4.0/).