Article

Comparison of Bacterial Community Structure in PM2.5 within Broiler Houses under Different Rearing Systems in China

1
State Key Laboratory of Animal Nutrition, Institute of Animal Sciences, Chinese Academy of Agricultural Sciences, Beijing 100193, China
2
Bureau of Agriculture and Rural Affairs of Luanping County, Chengde 068250, China
3
Department of Science and Environmental Studies, The Education University of Hong Kong, Taipo, New Territories, Hong Kong, China
*
Author to whom correspondence should be addressed.
These authors contributed equally to this work.
Sustainability 2022, 14(3), 1357; https://doi.org/10.3390/su14031357
Submission received: 28 November 2021 / Revised: 19 January 2022 / Accepted: 21 January 2022 / Published: 25 January 2022

Abstract

:
Background: In intensive poultry farming, high concentrations of indoor particulate matter (PM) impact production performance and welfare. In this study, PM2.5 level and bacterial community diversity were investigated in a multilayer cage house rearing system (CH) and a net flooring house rearing system (FH) during different growth stages to clarify the effects of the rearing systems on the diversity of airborne bacteria and help improve health management. Methods: The IC and high-throughput sequencing were used for ion composition and bacterial diversity analysis of PM2.5 collected from CH and FH. Results: The concentrations of NH3, CO2 and PM2.5 in CH were significantly lower than FH (p < 0.001) in both middle and late rearing stages. PM concentrations gradually increased with broiler growth only in FH. The water-soluble ions of PM2.5 samples had no significant difference between the two systems (p > 0.05). Firmicutes, Actinobacteria and Proteobacteria were the most abundant phyla in both the atmosphere and the broiler houses, but the composition was significantly different. The bacterial community in the broiler houses had strong correlations with temperature, humidity and PM of extremely high concentrations. Ions had stronger correlations with microbial community structure. Conclusions: The superiority of CH in environmental control over FH indicates that improved techniques in environmental control and breeding management can greatly reduce farming air pollution and improve the health management of broiler houses.

1. Introduction

The high concentration of particulate matter (PM) and the microbes it carries, which are discharged from intensive livestock and poultry rearing, has gradually become an important health threat to both animals and farm employees. The toxicity of these particles increases with the decrease in their size, surface area and adsorbed surface material. The nasopharynx traps 2.5–10 µm PM (PM10), although small particulate matter less than 2.5 µm (PM2.5) can enter the deep part of the respiratory system and deposit primarily in the bronchi and lungs [1]. Recent studies have shown ambient PM as a pathogen carrier, allowing germs to spread across far distances and cause infectious and allergic disorders [2]. PM has a complex composition and contains a large number of suspended microbes, including bacteria, fungi and viruses. Recent studies have shown that the sizes of aerosol bacterial cells are from 1.1 to 2.1 μm and from 2.1 to 3.3 μm [3]. In intensive farming, suspended microbes are derived from the aerosolization of animal feces, feed stuff, skin and feather fragments, escaping into the air and forming large amounts of microbial aerosol. Pathogen infections can directly cause respiratory diseases, such as pneumonia, tracheitis and bronchitis, and thus, serious losses to poultry production. The immune system also can be overloaded and degraded in function by high concentrations of non-pathogenic microorganisms, making livestock and poultry susceptible to disease [4,5].
The concentration and variation of indoor PM are impacted by the type of rearing system used, broiler activation, density and environmental control variables (temperature, relative humidity and ventilation). Indoor PM concentrations in different types of facilities have been studied, and it has been discovered that there is a strong correlation between PM concentrations and housing systems, ventilation rates and operational methods [6,7].
In China, with the development of intensive farming in broiler houses, the traditional net flooring house rearing systems (FH) are gradually being replaced by multilayer cage house rearing systems (CH). Although the CH requires sizeable investments in equipment, it has a higher indoor air quality, production performance and economic profit than the FH [8]. The direct benefits of CH are preventing the contact of the broiler itself with excreta, which has dramatically reduced the incidence of coccidiosis and intestinal diseases [9]. It also shows advantages of saving resources and facilitating automated management.
In this study, PM2.5 samples in three growth stages (early, middle and late stage) were collected individually from a CH in Fenyang, Shanxi Province, and an FH in Luanping, Hebei Province, from July to October 2019. Water-soluble ions were analyzed, and bacterial communities were identified by high-throughput sequencing using bacterial 16S rRNA genes in PM2.5 samples. The aims of this study are to (1) characterize and compare PM2.5 levels and bacterial compositions in CH and FH, (2) assess the diversity of the PM2.5 airborne bacterial community and (3) investigate the impacts of different rearing systems on PM2.5 chemical components and the bacterial community inside broiler houses.

2. Materials and Methods

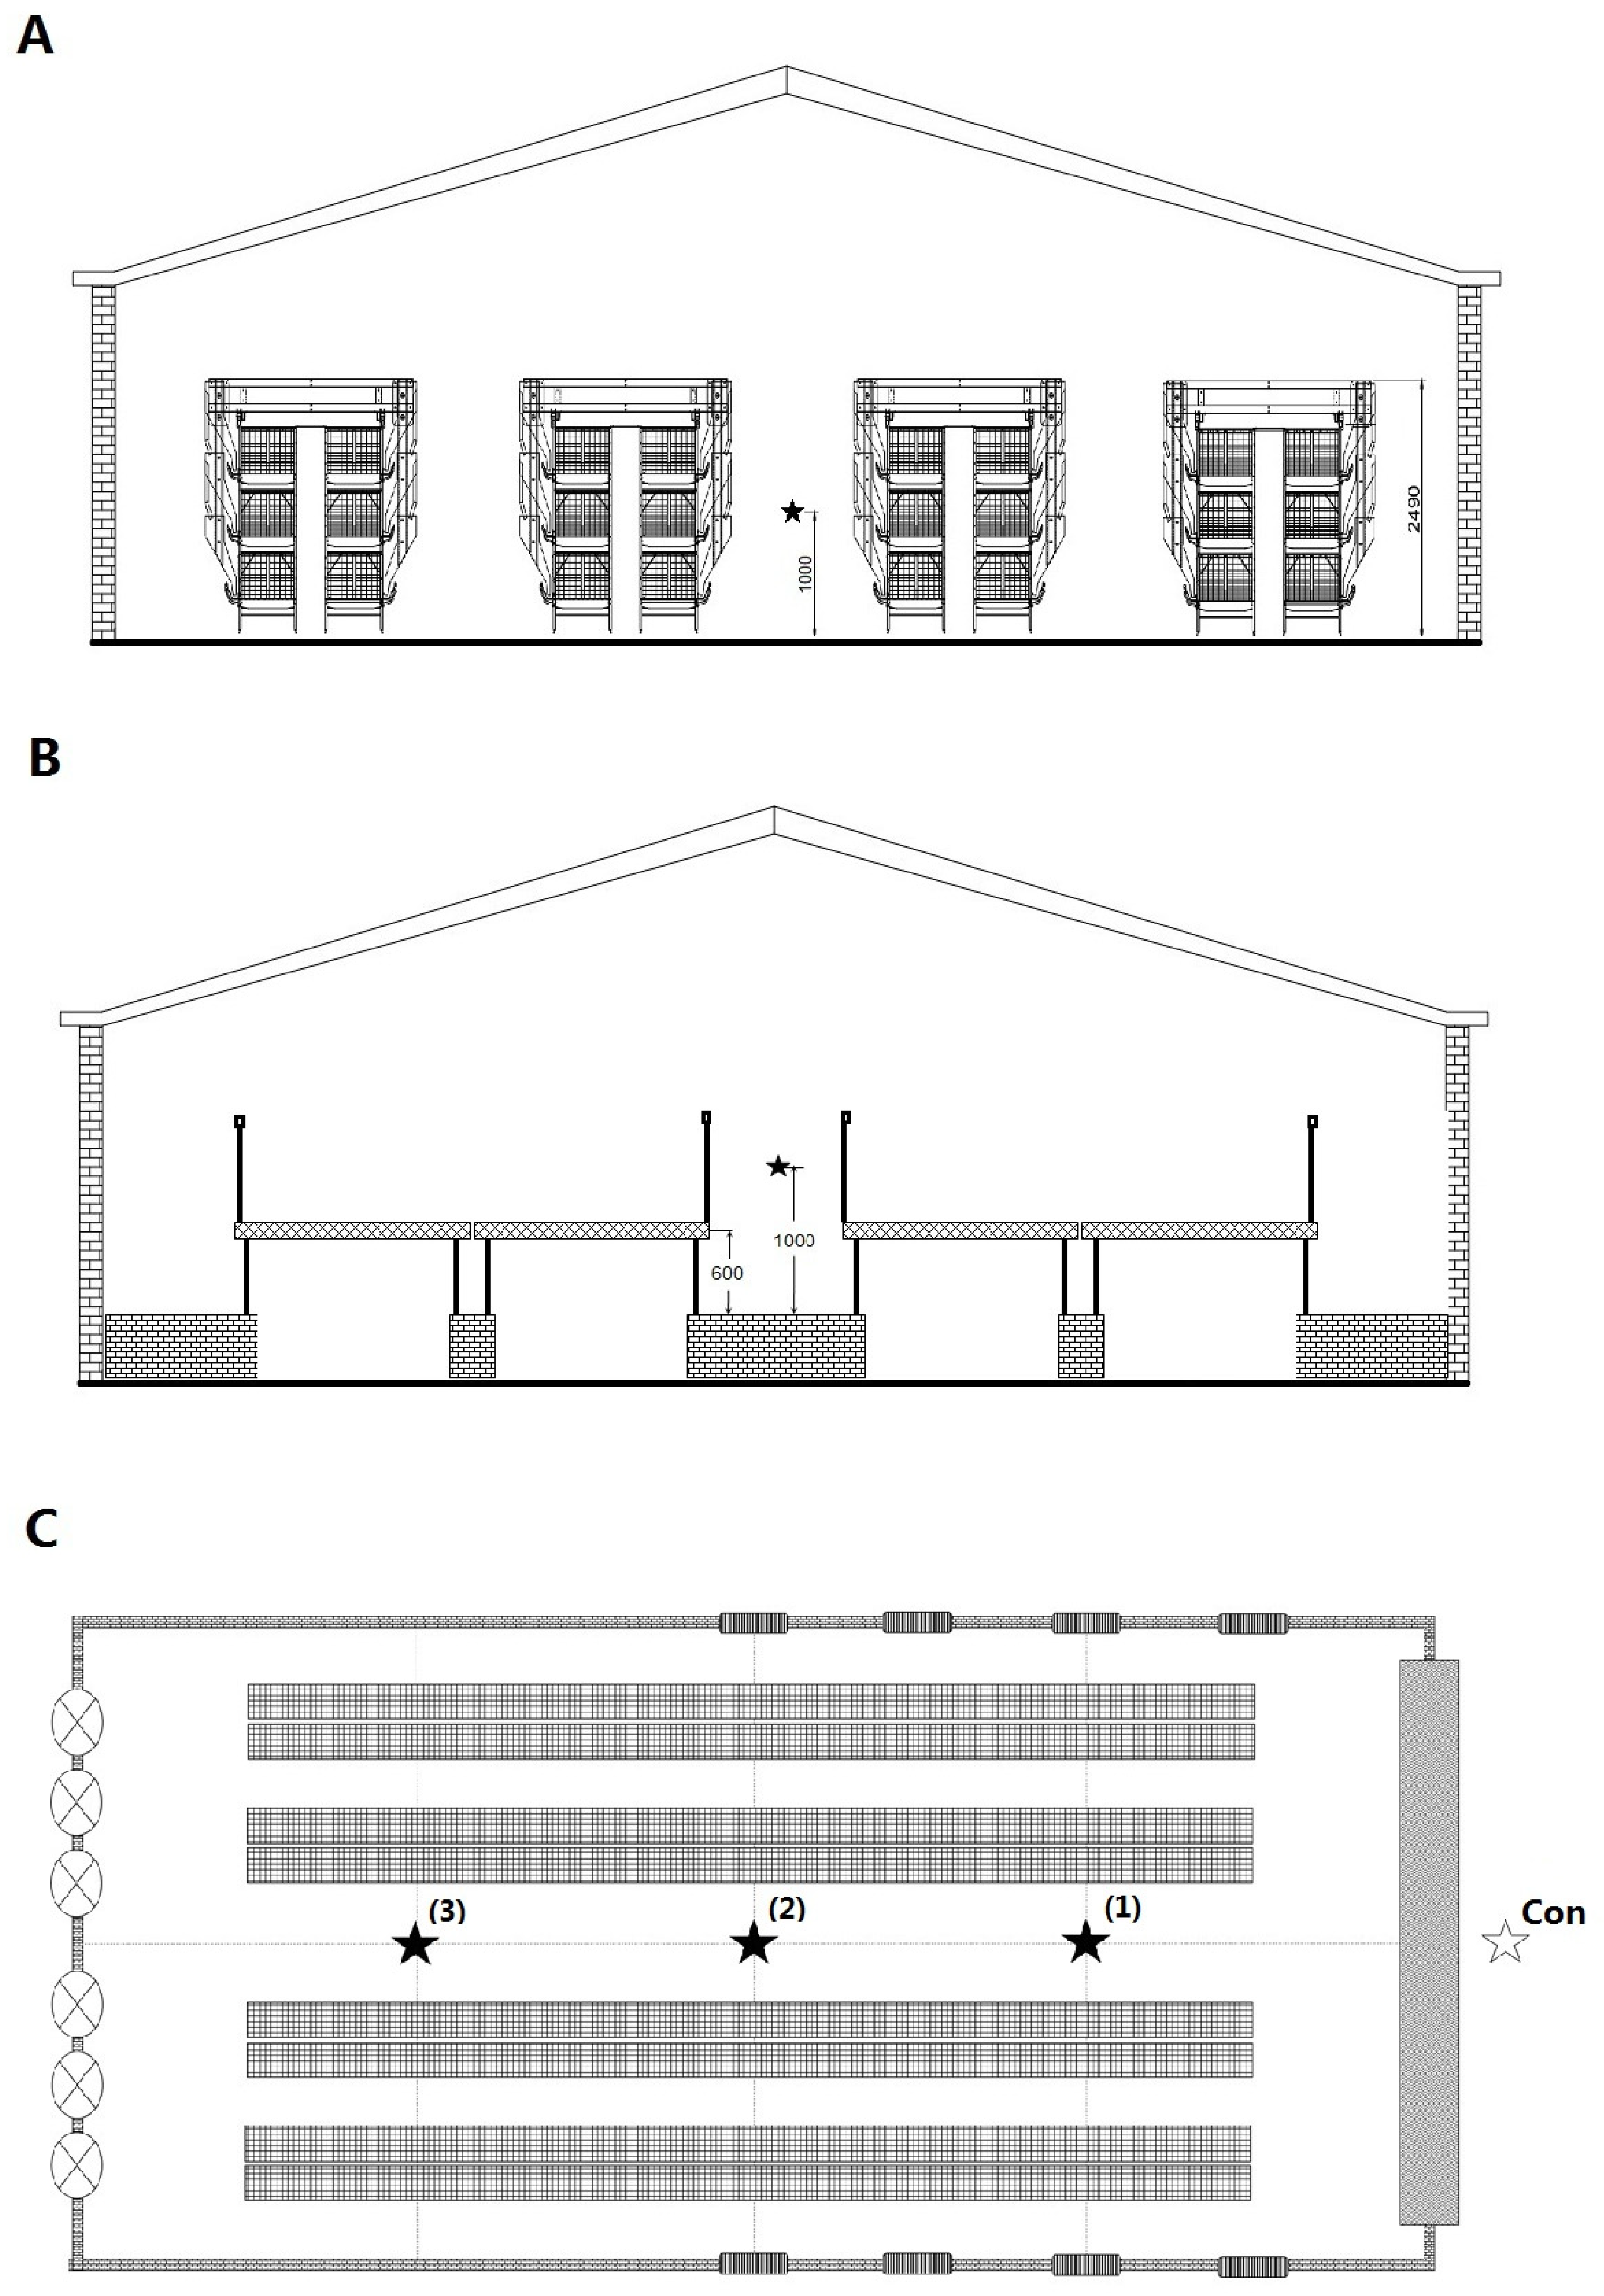
2.1. Characteristics of Broiler Houses

Field sampling was conducted at a three-tiered CH in Fenyang, Shanxi Province, and an FH in Luanping, Hebei Province. All boiler varieties were Arbor Acres (AA), with 42-day feeding periods. The house in CH covers an area of 1575 m2 (90 × 17.5 × 3.8 m in length, width and height, respectively) with a rearing scale of 38,500 to 39,000. The FH house covers 1400 m2 (100 × 14 × 3.5 m, in length, width and height, respectively) with a scale of 12,300 to 12,600. There were also differences in fecal removal procedures between the two systems. The feces were cleaned up every two days in the early stage and once a day in the middle and late stages with an automatic manure belt in the CH, while manual work was performed at the end of the rearing cycle in the FH.

2.2. The Detection of Particulate Matter, Temperature, Relative Humidity, CO2 and NH3 in Broiler House

Samples were collected at the front (1), middle (2), rear (3) and outdoor air inlet (Con) of the broiler houses (Figure 1C). The height of each sampling position was 1.0 m, as shown in Figure 1A,B. PM2.5 collection began at 9:00 on days 10, 24 and 38 for 48 h (D10, D24 and D38) (total flow during acquisition is 282 m3). A medium-flow ambient air particulate sampler (model Laoying 1073B, Qingdao, China; PM2.5 cutting size Da50 = 2.5 ± 0.2 μm; geometric standard deviation of capture efficiency σg = 1.2 ± 0.1) was used to collect PM2.5 samples on 90 mm (diameter) quartz filter membranes. Before sampling, the quartz filter membranes were oven-baked 4 h at 450 °C and pretreated in constant temperature and humidity conditions for 48 h. The concentration of PM was measured and calculated by the gravimetric method. The environmental control variables, including temperature, humidity, CO2 and NH3, were monitored at 6:00, 11:00, 15:00 and 21:00 in a day. A digital meter (CEM DT-321S, Qingdao, China) was used to measure temperature and relative humidity. Portable gas detectors (Qingdao, China, LOBO Company, LB-MS4X Model) were used to detect the contents of CO2 and NH3 with 1 ppm and 0.01 ppm accuracy, respectively. All the samples were collected from June to September in the different rearing systems.

2.3. DNA Extraction and PCR Amplification

According to the manufacturer’s instructions, the bacterial DNA was extracted with a PowerSoil DNA Isolation Kit (MoBio Laboratories, Carlsbad, CA, USA) from PM2.5. The DNA was checked by 1% agarose gel electrophoresis and analyzed by the NanoDrop 2000 UV-vis spectrophotometer (Thermo Scientific, Wilmington, DE, USA) for concentration and purity. The V3–V4 regions of the 16S rRNA gene were amplified by an ABI GeneAmp® 9700 PCR thermocycler (ABI, Foster, CA, USA). The primers were 338F (5′-ACTCCTACGGGAGGCAGCAG-3′) and 806R (5′-GGACTACHVGGGTWTCTAAT-3′). The PCR protocol was performed as follows: 95 °C for 3 min of initial denaturation, followed by 27 cycles of amplification with 95 °C for 30 s, 55 °C for 30 s and 72 °C for 45 s, continued with 72 °C for a 10 min extension, and ending with 4 °C incubation. The PCR mixtures contained 4 μL 5 × TransStart FastPfu buffer and 0.4 μL DNA Polymerase, 2 μL dNTPs (2.5 mM), 1 μL forward and reverse primers (4 μM) for each, template DNA 10 ng and ddH2O up to 20 μL. PCR amplification reactions were triplicated, and products were cut from 1% agarose gel and then purified by AxyPrep DNA Gel Extraction Kit (Axygen Biosciences, Union City, CA, USA). Then, Quantus™ Fluorometer (Promega, Madison, WI, USA) was chosen for quantification before sequencing [10].

2.4. Illumina MiSeq Sequencing

High-throughput sequencing was performed by Majorbio Bio-Pharm Technology Co., Ltd. (Shanghai, China) following the standard protocols. The amplicons were purified and paired-end sequenced (2 × 300) with an Illumina MiSeq platform (Illumina, San Diego, CA, USA). The raw reads were uploaded to the NCBI Sequence Read Archive (SRA) database.

2.5. Processing of Sequencing Data

The raw reads of 16S rRNA gene sequencing were demultiplexed, quality-filtered by Trimmomatic, and merged by FLASH with the following criteria: (1) the 300 bp reads were truncated at any site showing a quality score less than 20 over a 50 bp sliding window, and the truncated reads shorter than 50 bp or with ambiguous characters were discarded; (2) only overlapping sequences longer than 10 bp were assembled according to their overlapped sequence, and the maximum mismatch ratio of overlap region was 0.2; (3) samples were differentiated based on the barcode and primers, and the sequence direction was adjusted for exact barcode matching and 2 nucleotide mismatches in primer matching.
UPARSE (version 7.1, http://drive5.com/uparse/, accessed on 4 August 2020) was used to cluster operational taxonomic units (OTUs) with 97% similarity, and chimeric sequences were discarded. The RDP Classifier tool (http://rdp.cme.msu.edu/, accessed on 4 August 2020) was used to compare the taxonomy of each OTU representative sequence to the 16S rRNA database (e.g., Silva SSU138) with a confidence threshold of 0.7. The OTU sequence was flattened (the flattening sequence value was 26,426), and the subsequent analysis was carried out with the flattened results [11,12].
The sequencing data were uploaded to the NCBI SRA database under accession number PRJNA728498. The SRA submission number was SUB9461026.

2.6. Chemical Analysis

A quarter sample of filter membrane (D 90 mm) was taken to detect ion concentrations. The levels of water-soluble ions were detected by the National Research Center for Environmental Analysis and Measurement (Beijing, China). The water-soluble ion detection from PM2.5 samples followed the National Environmental Protection Standards of PRC (HJ799-2016 and HJ800-2016, http://kjs.mee.gov.cn/hjbhbz, accessed on 20 January 2021). Another quarter of sample filter was used for extraction by ultrasonic treatment in deionized water for 30 min. The major cations and anions contents including Mg2+, Na+, K+, Ca2+, NH4+, NO3, SO42+, Cl and F were determined by ion chromatography (ICS-1500, DIONEX, Sunnyvale, CA, USA).

2.7. Statistical Analysis

Alpha diversity indices of Chao 1 and Shannon were estimated. QIIME software was used to calculate the beta diversity distance matrix. Correlations between bacterial community and environmental control variables were evaluated by a linear mode of redundancy analysis (RDA) with Canoco 4.5.
The experimental results are shown as the mean ± standard error of mean (SEM). The data were statistically analyzed using GraphPad Prism 6.0 software. Least-significant difference (LSD) one-way analysis of variance (ANOVA) was carried out to examine significant differences between the three different rearing stage settings. An independent sample t-test analysis was preformed to compare the mean concentrations of PM2.5 in CH and FH. Spearman’s rank correlation analysis was used to study the correlations between water-soluble ions and airborne bacteria. IBM SPSS Statistics 24.0 (SPSS, Inc., Chicago, IL, USA) was for statistical analysis, and a p-value < 0.05 was considered statistically significant different at a confidence level of 95%.

3. Results

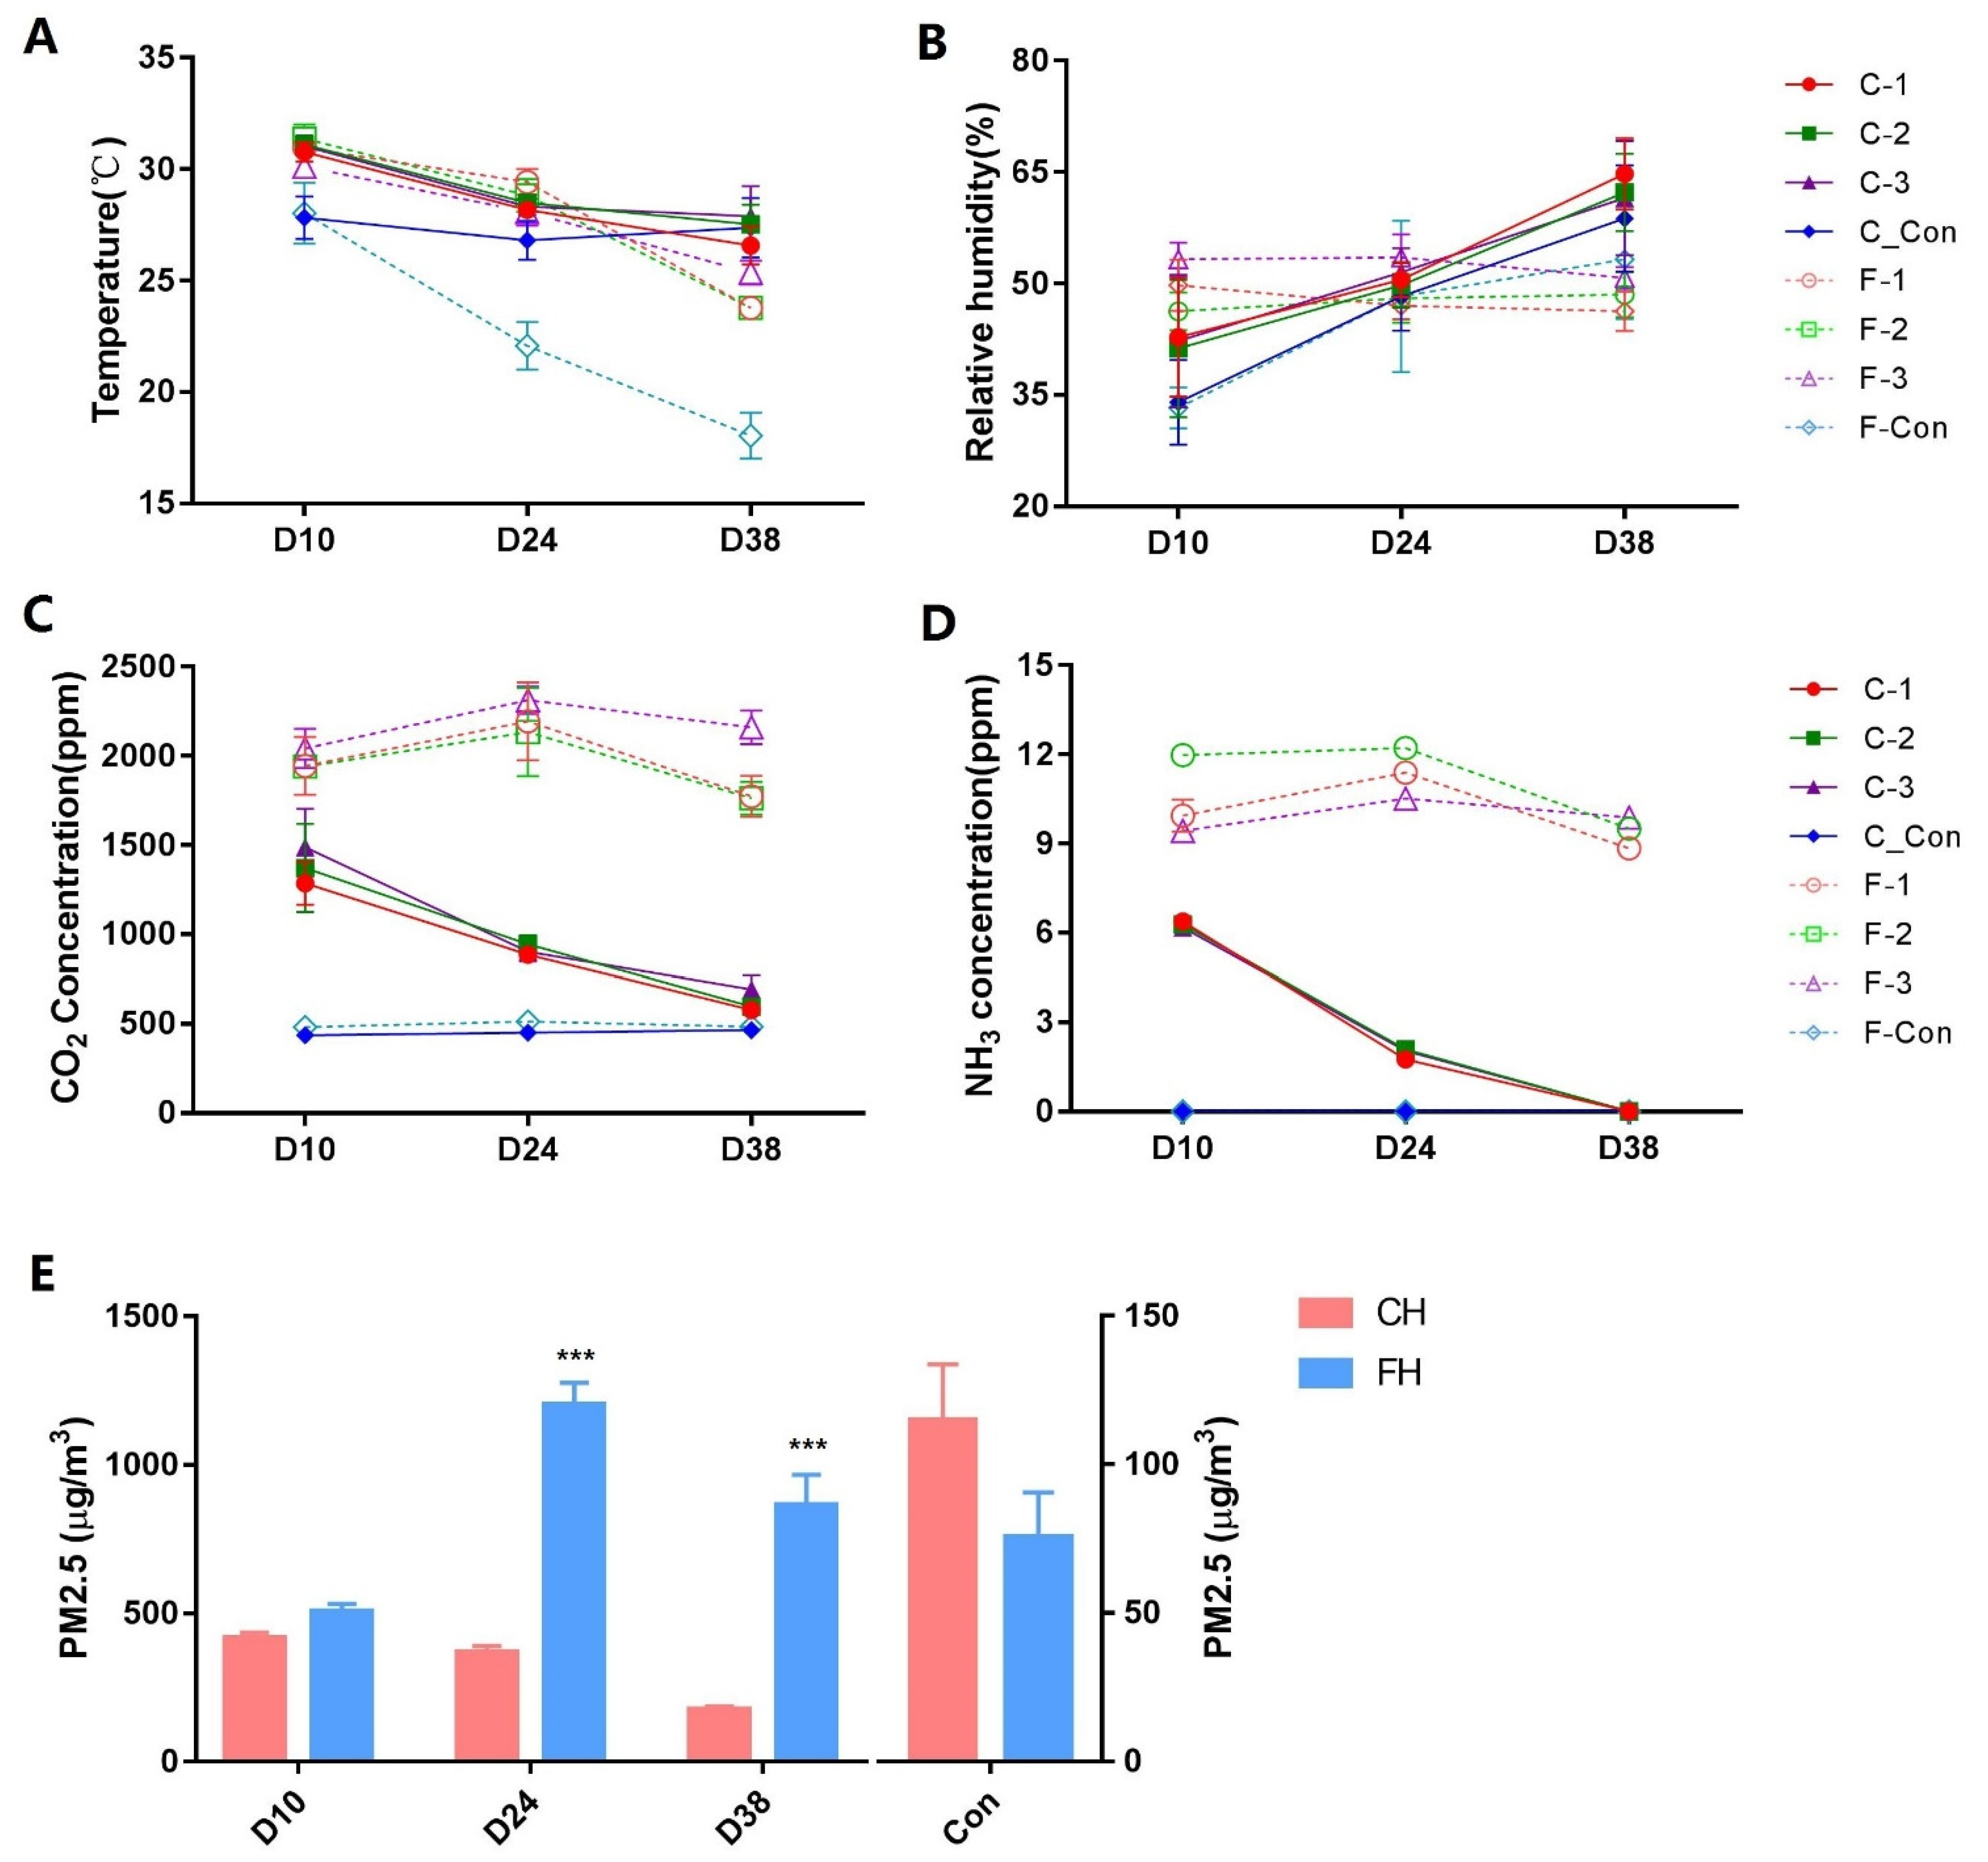
3.1. Variation in Environmental Control Variables and PM2.5

The environmental control variables (temperature, humidity, CO2 and NH3 level) and PM2.5 were surveyed in early (days 9–10), middle (days 23–24) and late stages (days 37–38) (Figure 2). PM2.5 concentration was calculated based on the filtration volume and net weight. The calculated variation in the environmental control variables and PM2.5 are shown in Figure 2. The temperature reduced with day age, but the humidity was close to the outdoor air. In CH, both the CO2 and NH3 levels inside the broiler houses showed sharp decreases between the early and late stages. In the late stage, CO2 showed no significant difference compared to the outdoor control (692 ± 155 vs. 466 ± 78 ppm, p > 0.05), and NH3, like the outdoor atmosphere, was undetectable. In FH, the concentrations of CO2 and NH3 showed little change in value between the early (1977 ± 204 ppm and 10.45 ± 0.38 ppm, respectively), middle (2214 ± 229 ppm and 11.38 ± 0.24 ppm, respectively) and late stages (1900 ± 201 ppm and 9.41 ± 0.20 ppm, respectively). The average PM2.5 concentrations of both middle and late stages in CH (369.16 ± 21.44 μg/m3 and 174.68 ± 12.24 μg/m3, respectively) were significantly lower than in FH (1201.38 ± 75.90 μg/m3 and 864.38 ± 101.98 μg/m3, respectively, p < 0.001). There was no significant difference between the two systems in the early stage (CH_D10 was 416.25 ± 33.73 μg/m3 and FH_D10 was 505.65 ± 25.88 μg/m3, p > 0.05).

3.2. Water-Soluble Ion Concentrations in Indoor PM2.5

The average concentrations of water-soluble cations and anions in indoor PM2.5 samples are shown in Figure 3. As indicated, SO42− was the most abundant ion, with 41.36 ± 7.05 mg/g in CH and 14.8 ± 6.92 mg/g in FH. NO3 levels were 24.3 ± 9.42 mg/g in CH and 7.02 ± 4.13 mg/g in FH. NH4+ was a rich cation, reaching 14.03 ± 4.32 mg/g in CH and 5.67 ± 2.49 mg/g in FH. The measured water-soluble ions including Mg2+, Na+, K+, Ca2+, NH4+, NO3, SO42−, Cl and F from PM2.5 samples in CH and FH accounted for 150.53 mg/g and 58.08 mg/g, respectively. The concentrations of SO42−, NH4+ and NO3 of PM2.5 in CH were higher than those in FH, but the differences were not significant. There was also no significant difference in Mg2+, Na+, K+, Ca2+, NH4+, F and Cl concentrations between CH and FH PM2.5 (Figure 3).

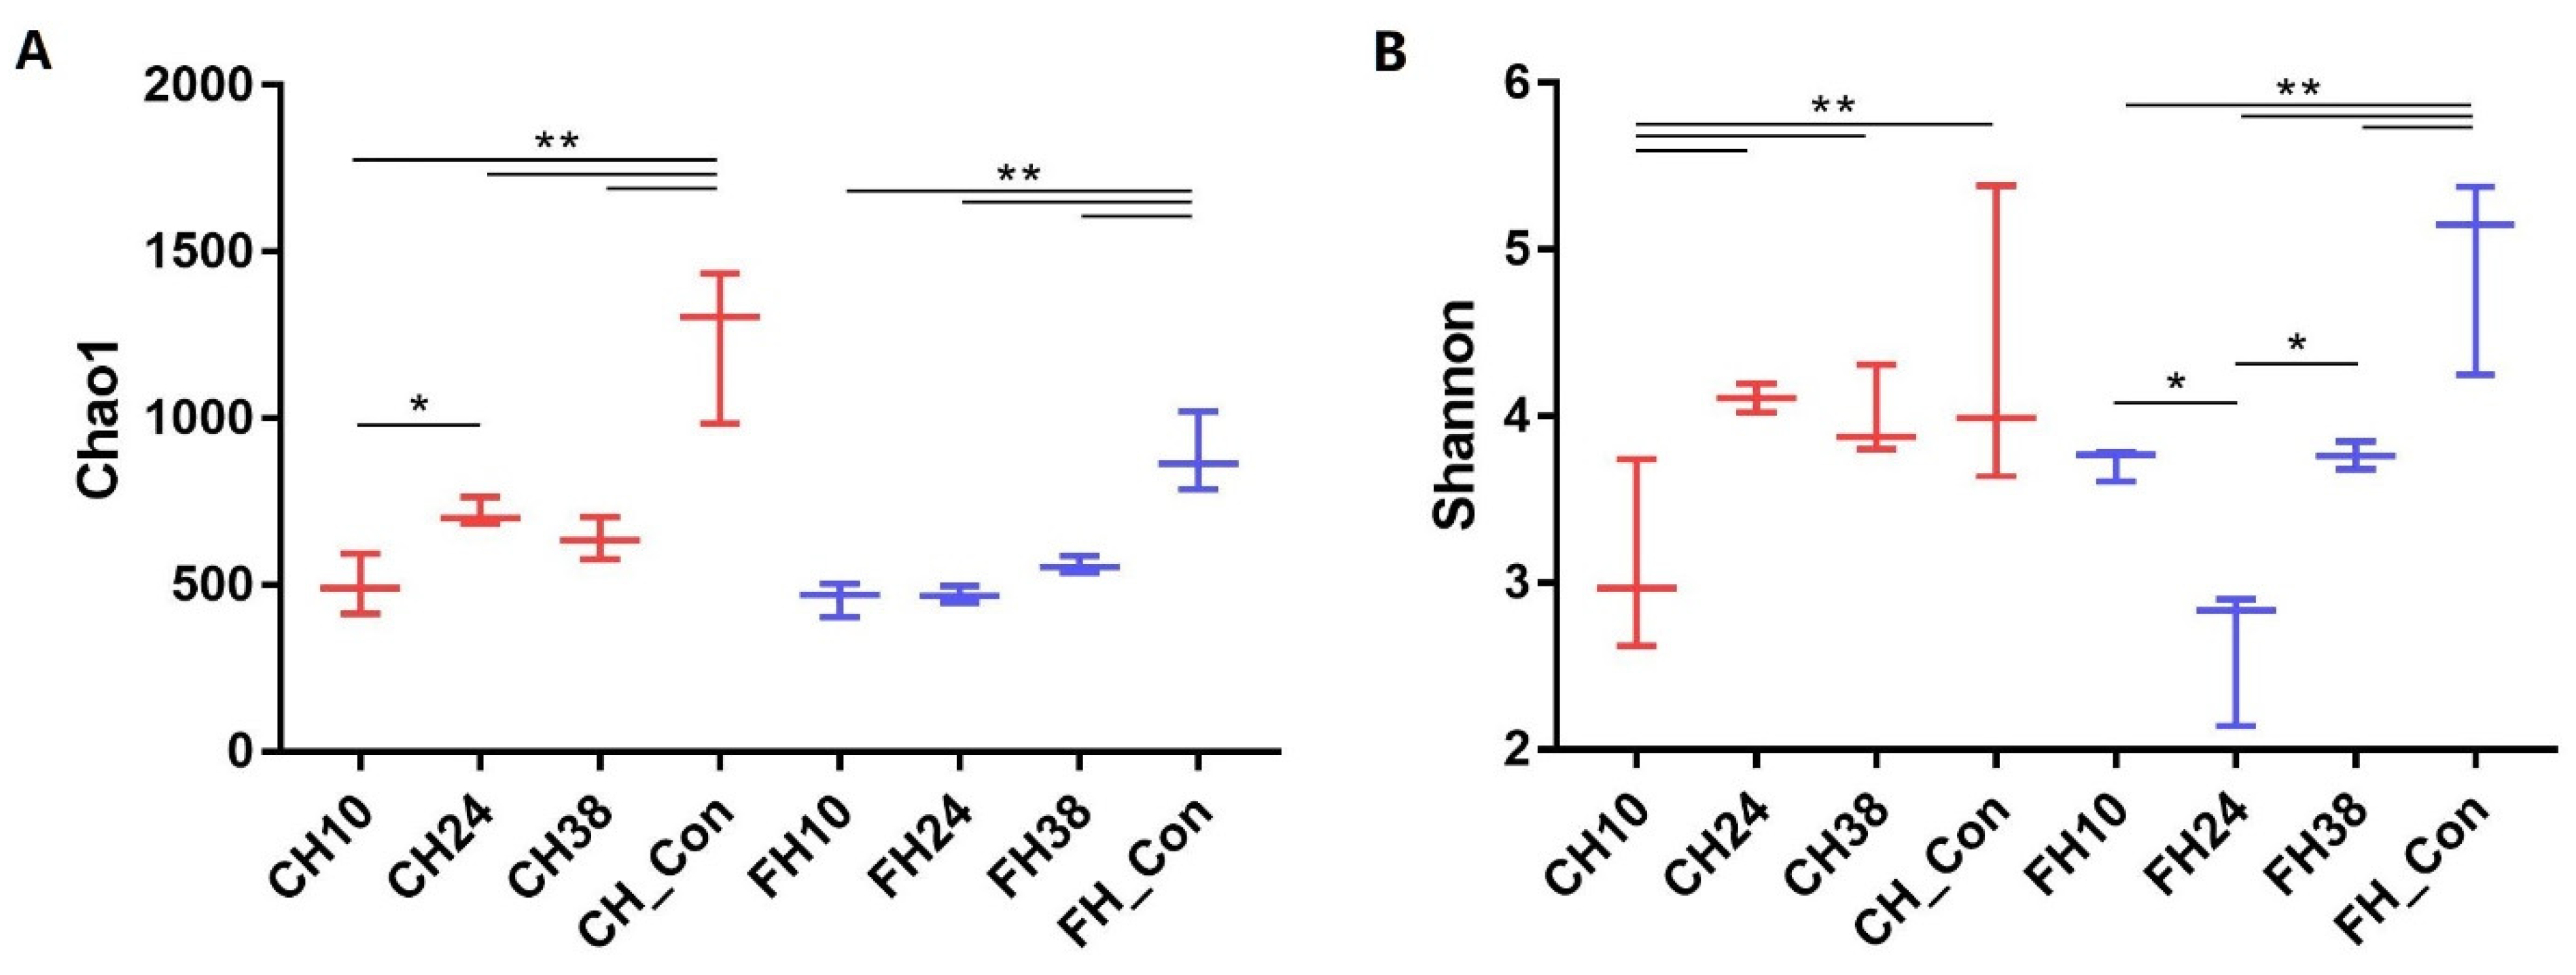
3.3. Airborne Bacterial Community Structure of PM2.5

A random rarefaction of sample reads according to the smallest value (26,426 sequences) was performed firstly for downstream analysis. A total of 1775 OTUs were clustered at a 97% similarity level according to the distance between sequences, and 25 phyla, 67 classes, 161 orders, 295 families and 705 genera were identified from all 24 samples. The alpha diversity is shown in Figure 4. In CH, the Chao1 index of the PM2.5 samples in the early stage (CD10) was significantly lower than in the middle stage (CD24, p < 0.05, Figure 4A). Compared with indoor samples, outdoor PM2.5 samples (CH_Con in Shanxi and FH_Con in Hebei) had significantly higher Chao1 index levels (p < 0.01). Figure 4B shows that in the FH, the Shannon index of the PM2.5 samples in the middle stage (FD24) was significantly lower than both the early and late stages and outdoor samples (FD10, FD38 and CH_Con, p < 0.01). The outdoor samples (FH_Con) had significantly higher Shannon index levels (p < 0.01).
The species with proportions greater than 5% appeared at the phylum (Figure 5A) and genera (Figure 5B) levels. The bacterial phyla Firmicutes, Actinobacteria and Proteobacteria were detected as dominant taxa from the indoor PM2.5 samples. The total relative abundance of these three phyla was up to 91.8% outdoors (84.6–96.6%) and 98.7% indoors (97.6–99.4%). At the genera level, 9 of the top 10 genera, including Rothia, Lactobacillus, Ruminococcus, Macrococcus, unclassified_f__Lachospiraceae, Faecalibacterium, Enterococcus, Blautia, and Corynebacterium, were Gram-positive, and the last of the top 10, Acinetobacter, was Gram-negative.
A Venn diagram of bacterial composition at the genus level is shown in Figure 6 to visualize the similarity and overlap in sample diversity between bacterial communities. The numbers of bacterial genera identified in C_Con, C_PM, F_PM and F_Con were 606 (85.96%), 379 (53.76%), 307 (43.55%) and 578 (81.99%), respectively. There were 695 (98.58%) genera found outdoors compared to 420 (59.57%) genera indoors, and 410 (58.16%) common genera were identified both indoors and outdoors. In the outdoor atmosphere, there were 117 (117/695, 16.83%) unique bacterial genera in CH (Shanxi) and 89 (89/695, 12.81%) in FH (Hebei), and 489 (489/695, 70.36%) common genera were found in the two places. Inside the broiler houses, there were 113 (113/420, 26.90%) unique aerosol bacterial genera in CH and 41 (41/420, 9.76%) in FH, and 266 (266/420, 63.33%) common genera were found.

3.4. Effects on Bacterial Community Structure in PM2.5

RDA analysis combined correspondence analysis with multiple regression analysis, which was mainly used to describe the relationship between bacterial diversity and key environmental control variables in the broiler houses (Figure 7A). The results show that for the first and second axes, the weighted values explained 47.23% and 17.75% of the difference, respectively. Temperature and humidity showed a negative correlation in the broiler houses, while CO2 and NH3 were positively correlated with PM2.5. Samples were well clustered together within the group, and separated between different groups. The CD24, CD38 and FD10 groups were close to the origin of the coordinate, showing weaker correlations than the others. The CD10 samples in the early stage of CH exhibited positive correlations with temperature. The FD38 samples in the late stage of FH showed positive correlations with humidity. Interestingly, the bacterial community structure of FH24 was separated from the other groups, showing strong positive correlations with CO2, NH3 and PM2.5, but weak correlations with temperature and humidity.
The heatmap based on Spearman’s analysis was used to analyze the relationship between water-soluble ion concentration (Figure 3) and microbial abundance at the genus level (Figure 7B). The water-soluble ions of NH4+, SO42 and NO3 were clustered in a branch, showing positive influences on the taxa such as Ruminococcus, Enterococcus, Erysipelatoclostridium, Sellimonas and Enterococcus, but negative influences on Corynebacterium. Ions such as K+, Mg2+ Ca2+ and Cl in another branch exhibited significantly positive correlations with Blautia and Subdoligranulum and negative correlations with Macrococcus and Kurthia.

4. Discussion

In intensive livestock and poultry farming, indoor PM plays a vital role in pathogen transmission, respiratory diseases and allergic reactions to livestock and poultry, and has an impact on production performance and human health [13]. Numerous studies have shown that the community structure of bacterial aerosols in intensive farming is affected by many factors, including the species, feeding modes, rearing stages and seasons [14,15]. A better understanding of the effects of breeding patterns on particulate matter and bacterial aerosols in the intensive broiler chicken industry not only benefits animal production performance and welfare, but also protects the health of employees. Distinctive PM2.5 levels and bacterial communities were compared between CH and FH in this research. We found that they responded differently to the factors of day age, temperature, humidity and ventilation in broiler rearing cycles.
The primary sources of PM in poultry houses are the birds and their excrement, including skin, feathers, feed and manure. Rearing density, animal activity and ventilation are also important factors affecting PM concentration [16]. Our results showed that CO2 and NH3, both aerosol components, were consistent with PM changes between the two feeding patterns. In FH, PM2.5 concentrations in broiler houses increased rapidly with the rearing cycle stage, in accordance with some reports [17]. In CH, indoor PM2.5 had no significant change throughout the growth cycle, despite having higher stocking density than FH. RDA analysis (Figure 7a) with environmental factors also showed that CO2 and NH3 were positively correlated with PM2.5, suggesting that efficient ventilation could simultaneously discharge excess CO2, NH3 and PM, which was helpful to improve the environmental conditions. This result was reconfirmed by the aforementioned discussion and previous studies [18,19]. This suggests that from June to October in northern China, the cage house has more efficiency in removing PM2.5, carbon dioxide and ammonia than the net flooring house.
For techniques of microbial aerosol analyses, traditional microbial culture is often inaccurate. Culture techniques, predominantly used for bacterial aerosol composition in the past, allow for the recovery of only a small fraction of the real airborne microorganism burden in aerosol, given the inability of most bacteria to grow on agar plates [20]. According to recent studies, the quantity of culturable air microbes was 1000 times lower than measured by non-culturable methods such as PCR [21]. Only 0.3% to 10% of certain microorganisms in the environment could be collected and detected using traditional culture [22,23], greatly limiting species and quantity analyses [24]. Currently, 16S rDNA high-throughput sequencing, which does not depend on pure culture, is the most common analytical method to study the structural diversity of airborne microorganisms [25].
A total of 25 phyla, 67 classes, 161 orders, 295 families and 705 genera were identified here by 16S rDNA high-throughput sequencing, showing a rich diversity of the microbes carried by the PM2.5 samples. The most abundant bacterial phyla, Firmicutes, Actinobacteria, Proteobacteria and Bacteroidetes, have been revealed as ubiquitous phyla at outdoor and indoor sites [26]. In our results, the composition of indoor flora at the same site is different from that in the outdoor atmosphere. Based on the high content of organic matter in the PM, the concentration of airborne bacteria in poultry houses is high, and the composition is farm-specific [27,28]. The outdoor atmosphere has more unique taxa than indoors. In addition, the unique populations of atmosphere bacteria differed greatly between the locations of CH and FH, which is also consistent with previous studies on the changes in atmospheric aerosol bacterial community structure [29,30]. The high Chao1 and Shannon indices of outdoor atmosphere indicated a greater bacterial abundance and diversity than indoors. Inside the CH, both bacterial abundance and diversity in the early rearing stage were lower than the middle and late stages, although the PM2.5 concentration had no significant differences between the three stages. This is probably because thorough cleaning, disinfection and ventilation treatment are carried out for more than a week during the empty house period. The large quantity of aerosol bacteria was eliminated, and the community went through a reconstruction process in every rearing cycle. After the early stage, the increase in day age and the activation of broiler, litter, dust and feces led to a high PM2.5 level indoors. Especially in the middle stage of FH, the PM2.5 surge may result in lower bacterial diversity. This also occurred in the atmospheric environment reported by Tan (2016) and Li (2018) [31,32]. Thus, high concentrations of PM2.5 reduce aerosol bacterial diversity in poultry houses.
Generally, meteorological conditions such as relative humidity, temperature, wind speed and the content of NH3 and SO2 are considered to affect the concentration and structure of airborne bacteria [10,33,34]. The changes in temperature and humidity are other main factors leading to the variation in the indoor bacterial community structure. From the RDA analysis, the variation trend of indoor bacterial community structure with the increase in day age was consistent with the decrease in temperature, which was also in line with the actual situation of the decreasing temperature demand of broilers. In the early rearing stage, the airborne bacteria were significantly affected by temperature. As the temperature required by the chicks decreased, this effect tended to diminish in middle stage. The bacterial community structure of the late stage was more affected by humidity. PM2.5 was another key factor in aerosol bacteria. The bacterial structure in the middle stage (day 24) of FH was significantly different from that in the other stages, and was strongly correlated with PM2.5 concentrations, suggesting that excessive PM2.5 concentrations might be conducive to the survival and proliferation of some groups such as Actinobacteria and Bacteroidetes in phyla, associated with livestock feces [25,35,36], indicating an excessive accumulation of feces in the broiler house. In genus, high contents of Rothia and Streptococcus (Figure 5) might be involved in the lung immune response [37]. Excreta accumulation not only increased the release of harmful gases such as NH3 and H2S, but also increased the proportion of some potentially pathogenic bacteria in the air. Whether these changes were associated with disease occurrence and physiological changes in broilers remains to be further studied.
In addition to temperature and humidity affecting the bacterial community structure, concentration and chemical composition of aerosol PM also had impacts on bacterial species. Numerous studies show that PM serves as a nutritional supplier, carrier and refuge, so bacterial concentrations and diversity are positively correlated with PM levels, to a certain extent. However, with further increases in PM concentration, the correlation between particulate matter and airborne bacterial concentration becomes negative, especially for PM2.5 [38,39]. Our results also supported this view, as the outdoor samples (CH_Con and FH_Con) had the lowest PM2.5 concentrations and highest bacterial diversity both in Shanxi and Hebei provinces. This was completely opposite to the FH_D24 group, which had the highest level of PM2.5 coming from FH (Figure 2E). In the atmosphere environment study, chemical composition explained more than half of the variance in bacterial species–environment correlations [40]. Our results showed that the most positively correlated airborne bacteria were sulfate (SO42−) and nitrogen (NO3 and NH4+), followed by K+, Na+, Mg2+, Ca2+, Cl and F, similar to other studies [41,42,43]. Chemical analysis of PM showed that the total mass fraction of identified inorganic species was not the majority (normally less than 16%), but the organic composition was [7,44]. The composition varied significantly with animal building type [44]. There might not be enough of a difference between CH and FH, or the changes in organic and microbe composition alter the ion fraction. We found that the concentrations of SO42−, NH4+ and NO3 of PM2.5 in CH were higher than those in FH, but not significantly. The correlation heatmap between water-soluble ions and bacterial community structures (Figure 7B) indicates that sulfate and nitrogen ions, NH4+, SO42 and NO3 had more impact than the metal cations, K+, Na+, Mg2+ and Ca2+ at the genus level, which was consistent with atmospheric environment research. In view of the complex composition of PM2.5, future studies are needed, such as element and organic content analysis, to clarify the influence mechanism of particulate matter composition in the broiler house environment on microbial community structure.
The CH, with a higher stocking density, has lower levels of PM2.5, CO2 and NH3 than FH. The PM2.5 in CH has no significant change during the whole broiler rearing cycle. An efficient ventilation system and manure removal methods ensure an excellent indoor air quality and appropriate humidity during the entire broiler rearing process. The superiority of CH in environmental control over FH indicates that improved techniques in environmental control and breeding management can greatly reduce farming air pollution and improve the welfare and health management of broiler houses.

Author Contributions

Methodology, I.K., W.W. and T.M.; data curation and investigation, I.K., W.W. and A.M.I.; resources, X.Y., R.S. and L.L.; software, W.W. and M.T.K.; writing, T.M.; supervision, H.Z. All authors have read and agreed to the published version of the manuscript.

Funding

The authors are grateful for the support from the China Agriculture Research System of MOF and MARA (CARS-41), the Agricultural Science and Technology Innovation Program (ASTIP-IAS07) and the Central Public-interest Scientific Institution Basal Research Found (2021-YWF-ZYSQ-04) in China.

Institutional Review Board Statement

The animal study protocol was approved by the Animal Care and Welfare Committee of the Institute of Animal Sciences, Chinese Academy of Agricultural Sciences (protocol code IAS2019-78 and date of 15 June 2019).

Informed Consent Statement

Not applicable.

Data Availability Statement

The sequencing data were uploaded to the NCBI SRA database under accession number PRJNA728498. SRA submission number was SUB9461026.

Conflicts of Interest

The authors declare no conflict of interest.

References

  1. Lu, F.; Xu, D.; Cheng, Y.; Dong, S.; Guo, C.; Jiang, X.; Zheng, X. Systematic review and meta-analysis of the adverse health effects of ambient PM2.5 and PM10 pollution in the Chinese population. Environ. Res. 2015, 136, 196–204. [Google Scholar] [CrossRef] [PubMed]
  2. Winkel, A.; Mosquera, J.; Koerkamp, P.; Ogink, N.; Aarnink, A.J.A. Emissions of particulate matter from animal houses in the Netherlands. Atmos. Environ. 2015, 111, 202–212. [Google Scholar] [CrossRef]
  3. Raisi, L.; Aleksandropoulou, V.; Lazaridis, M.; Katsivela, E. Size distribution of viable, cultivable, airborne microbes and their relationship to particulate matter concentrations and meteorological conditions in a mediterranean site. Aerobiologia 2013, 29, 233–248. [Google Scholar] [CrossRef]
  4. de Rooij, M.M.T.; Smit, L.A.M.; Erbrink, H.J.; Hagenaars, T.J.; Hoek, G.; Ogink, N.W.M.; Winkel, A.; Heederik, D.J.J.; Wouters, I.M. Endotoxin and particulate matter emitted by livestock farms and respiratory health effects in neighboring residents. Environ Int 2019, 132, 105009. [Google Scholar] [CrossRef]
  5. Dai, P.; Shen, D.; Tang, Q.; Huang, K.; Li, C. PM2.5 from a broiler breeding production system: The characteristics and microbial community analysis. Environ. Pollut. 2020, 256, 113368. [Google Scholar] [CrossRef]
  6. Fujiyoshi, S.; Tanaka, D.; Maruyama, F. Transmission of Airborne Bacteria across Built Environments and Its Measurement Standards: A Review. Front. Microbiol. 2017, 8, 2336. [Google Scholar] [CrossRef] [Green Version]
  7. Shen, D.; Wu, S.; Dai, P.Y.; Li, Y.S.; Li, C.M. Distribution of particulate matter and ammonia and physicochemical properties of fine particulate matter in a layer house. Poult. Sci. 2018, 97, 4137–4149. [Google Scholar] [CrossRef]
  8. Yan, L.; Lv, Z.; An, S.; Xing, K.; Zhou, G. Effects of rearing system and narasin on growth performance, gastro-intestinal development and gut microbiota of broilers. Poult. Sci. 2020, 100, 100840. [Google Scholar] [CrossRef]
  9. Kadykalo, S.; Roberts, T.; Thompson, M.; Wilson, J.; Lang, M.; Espeisse, O. The value of anticoccidials for sustainable global poultry production. Int. J. Antimicrob. Agents 2017, 51, 304–310. [Google Scholar] [CrossRef]
  10. Cao, C.; Jiang, W.; Wang, B.; Fang, J.; Lang, J.; Geng, T.; Jiang, J.; Zhu, T.F. Inhalable microorganisms in Beijing’s PM2.5 and PM10 pollutants during a severe smog event. Environ. Sci. Technol. 2014, 48, 1499. [Google Scholar] [CrossRef]
  11. Edgar, R.C. UPARSE: Highly accurate OTU sequences from microbial amplicon reads. Nat. Methods 2013, 10, 996. [Google Scholar] [CrossRef] [PubMed]
  12. Quast, C.; Pruesse, E.; Yilmaz, P.; Gerken, J.; Glckner, F.O. The SILVA ribosomal RNA gene database project: Improved data processing and web-based tools. Nucleic Acids Res. 2012, 41, D590–D596. [Google Scholar] [CrossRef] [PubMed]
  13. Feng, S.; Dan, G.; Liao, F.; Zhou, F.; Wang, X. The health effects of ambient PM2.5 and potential mechanisms. Ecotoxicol. Environ. Saf. 2016, 128, 67–74. [Google Scholar] [CrossRef] [PubMed]
  14. Hong, P.Y.; Li, X.; Yang, X.; Shinkai, T.; Zhang, Y.; Wang, X.; Mackie, R.I. Monitoring airborne biotic contaminants in the indoor environment of pig and poultry confinement buildings. Environ. Microbiol. 2012, 14, 1420–1431. [Google Scholar] [CrossRef]
  15. Just, N.; Lecours, P.B.; Marcoux-Voiselle, M.; Kirychuk, S.; Veillette, M.; Singh, B.; Duchaine, C. Bacterial diversity characterization of bioaerosols from cage-housed and floor-housed poultry operations. Environ. Res. 2013, 59, 46–50. [Google Scholar] [CrossRef]
  16. Cambra-López, M.; Aarnink, A.J.A.; Zhao, Y.; Calvet, S.; Torres, A.G. Airborne particulate matter from livestock production systems: A review of an air pollution problem. Environ. Pollut. 2010, 158, 1–17. [Google Scholar] [CrossRef]
  17. Zhang, J.; Li, Y.; Xu, E.; Jiang, L.; Tang, J.; Li, M.; Zhao, X.; Chen, G.; Zhu, H.; Yu, X.; et al. Bacterial communities in PM2.5 and PM10 in broiler houses at different broiler growth stages in spring. Pol. J. Vet. Sci. 2019, 22, 495–504. [Google Scholar]
  18. Li, Z.; Zheng, W.; Wei, Y.; Li, B.; Wang, Y.; Zheng, H. Prevention of particulate matter and airborne culturable bacteria transmission between double-tunnel ventilation layer hen houses. Poult. Sci. 2019, 98, 2392–2398. [Google Scholar] [CrossRef]
  19. Yang, W.; Guo, M.; Liu, G.; Yu, G.; Wang, P.; Wang, H.; Chai, T. Detection and analysis of fine particulate matter and microbial aerosol in chicken houses in Shandong Province, China. Poult. Sci. 2017, 97, 995–1005. [Google Scholar] [CrossRef]
  20. Blais-Lecours, P.; Perrott, P.; Duchaine, C. Non-culturable bioaerosols in indoor settings: Impact on health and molecular approaches for detection. Atmos. Environ. 2015, 110, 45–53. [Google Scholar] [CrossRef]
  21. Duquenne, P. On the Identification of Culturable Microorganisms for the Assessment of Biodiversity in Bioaerosols. Ann. Work Expo. Health 2018, 62, 139–146. [Google Scholar] [CrossRef] [PubMed] [Green Version]
  22. Dungan, R.S.; Leytem, A.B. Qualitative and quantitative methodologies for determination of airborne microorganisms at concentrated animal-feeding operations. World J. Microbiol. Biotechnol. 2009, 25, 1505–1518. [Google Scholar] [CrossRef]
  23. Xu, Z.; Kai, W.; Wu, Y.; Shen, F.; Chen, Q.; Li, M.; Yao, M.; Vishal, S. Enhancing Bioaerosol Sampling by Andersen Impactors Using Mineral-Oil-Spread Agar Plate. PLoS ONE 2013, 8, e56896. [Google Scholar] [CrossRef] [PubMed] [Green Version]
  24. Lee, T.; Grinshpun, S.A.; Martuzevicius, D.; Adhikari, A.; Crawford, C.M.; Luo, J.; Reponen, T. Relationship between indoor and outdoor bioaerosols collected with a button inhalable aerosol sampler in urban homes. Indoor Air 2006, 16, 37. [Google Scholar] [CrossRef] [PubMed] [Green Version]
  25. Bowers, R.M.; Clements, N.; Emerson, J.B.; Wiedinmyer, C.; Hannigan, M.P.; Fierer, N. Seasonal variability in bacterial and fungal diversity of the near-surface atmosphere. Environ. Sci. Technol. 2013, 47, 12097. [Google Scholar] [CrossRef] [PubMed]
  26. Ruiz-Gil, T.; Acuña, J.J.; Fujiyoshi, S.; Tanaka, D.; Noda, J.; Maruyama, F.; Jorquera, M.A. Airborne bacterial communities of outdoor environments and their associated influencing factors. Environ. Int. 2020, 145, 106156. [Google Scholar] [CrossRef] [PubMed]
  27. Gao, M.; Jia, R.; Qiu, T.; Han, M.; Wang, X. Size-related bacterial diversity and tetracycline resistance gene abundance in the air of concentrated poultry feeding operations. Environ. Pollut. 2017, 220 Pt B, 1342–1348. [Google Scholar] [CrossRef]
  28. Jiang, L.; Zhang, J.; Tang, J.; Li, M.; Zhao, X.; Zhu, H.; Yu, X.; Li, Y.; Feng, T.; Zhang, X. Analyses of Aerosol Concentrations and Bacterial Community Structures for Closed Cage Broiler Houses at Different Broiler Growth Stages in Winter. J. Food Prot. 2018, 81, 1557–1564. [Google Scholar] [CrossRef]
  29. Pan, Y.; Pan, X.; Xiao, H.; Xiao, H. Structural Characteristics and Functional Implications of PM2.5 Bacterial Communities During Fall in Beijing and Shanghai, China. Front. Microbiol. 2019, 10, 2369. [Google Scholar] [CrossRef]
  30. Park, E.H.; Heo, J.; Kim, H.; Yi, S.M. The major chemical constituents of PM2.5 and airborne bacterial community phyla in Beijing, Seoul, and Nagasaki. Chemosphere 2020, 254, 126870. [Google Scholar] [CrossRef]
  31. Tan, J.; Duan, J.; Zhen, N.; He, K.; Hao, J. Chemical characteristics and source of size-fractionated atmospheric particle in haze episode in Beijing. Atmos. Res. 2015, 167, 24–33. [Google Scholar] [CrossRef]
  32. Li, W.; Yang, J.; Zhang, D.; Li, B.; Wang, E.; Yuan, H. Concentration and Community of Airborne Bacteria in Response to Cyclical Haze Events During the Fall and Midwinter in Beijing, China. Front. Microbiol. 2018, 9, 1741. [Google Scholar] [CrossRef] [PubMed] [Green Version]
  33. Gao, J.F.; Fan, X.Y.; Pan, K.L.; Li, H.Y.; Sun, L.X. Diversity, abundance and activity of ammonia-oxidizing microorganisms in fine particulate matter. Sci. Rep. 2016, 6, 38785. [Google Scholar] [CrossRef] [PubMed] [Green Version]
  34. Wei, K.; Zou, Z.; Zheng, Y.; Li, J.; Shen, F.; Wu, C.Y.; Wu, Y.; Hu, M.; Yao, M. Ambient bioaerosol particle dynamics observed during haze and sunny days in Beijing. Sci. Total Environ. 2016, 550, 751–759. [Google Scholar] [CrossRef] [PubMed]
  35. Bowers, R.M.; McLetchie, S.; Knight, R.; Fierer, N. Spatial variability in airborne bacterial communities across land-use types and their relationship to the bacterial communities of potential source environments. ISME J. 2011, 5, 601–612. [Google Scholar] [CrossRef] [Green Version]
  36. Wei, M.; Xu, C.; Xu, X.; Zhu, C.; Li, J.; Lv, G. Characteristics of atmospheric bacterial and fungal communities in PM2.5 following biomass burning disturbance in a rural area of North China Plain. Sci. Total Environ. 2019, 651 Pt 2, 2727–2739. [Google Scholar] [CrossRef]
  37. Ren, L.; Zhang, R.; Rao, J.; Xiao, Y.; Zhang, Z.; Yang, B.; Cao, D.; Zhong, H.; Ning, P.; Shang, Y.; et al. Transcriptionally Active Lung Microbiome and Its Association with Bacterial Biomass and Host Inflammatory Status. mSystems 2018, 3, e00199-18. [Google Scholar] [CrossRef] [Green Version]
  38. Dong, L.; Qi, J.; Shao, C.; Zhong, X.; Gao, D.; Cao, W.; Gao, J.; Bai, R.; Long, G.; Chu, C. Concentration and size distribution of total airborne microbes in hazy and foggy weather. Sci. Total Environ. 2016, 541, 1011–1018. [Google Scholar] [CrossRef]
  39. Liu, H.; Zhang, X.; Zhang, H.; Yao, X.; Zhou, M.; Wang, J.; He, Z.; Zhang, H.; Lou, L.; Mao, W.; et al. Effect of air pollution on the total bacteria and pathogenic bacteria in different sizes of particulate matter. Environ. Pollut. 2018, 233, 483–493. [Google Scholar] [CrossRef]
  40. Innocente, E.; Squizzato, S.; Visin, F.; Facca, C.; Rampazzo, G.; Bertolini, V.; Gandolfi, I.; Franzetti, A.; Ambrosini, R.; Bestetti, G. Influence of seasonality, air mass origin and particulate matter chemical composition on airborne bacterial community structure in the Po Valley, Italy. Sci. Total Environ. 2017, 593–594, 677–687. [Google Scholar] [CrossRef]
  41. Xu, C.; Wei, M.; Chen, J.; Wang, X.; Zhu, C.; Li, J.; Zheng, L.; Sui, G.; Li, W.; Wang, W.; et al. Bacterial characterization in ambient submicron particles during severe haze episodes at Ji’nan, China. Sci. Total Environ. 2017, 580, 188–196. [Google Scholar] [CrossRef] [PubMed] [Green Version]
  42. Zhong, S.; Zhang, L.; Jiang, X.; Gao, P. Comparison of chemical composition and airborne bacterial community structure in PM2.5 during haze and non-haze days in the winter in Guilin, China. Sci. Total Environ. 2019, 655, 202–210. [Google Scholar] [CrossRef] [PubMed]
  43. Li, H.; Zhou, X.Y.; Yang, X.R.; Zhu, Y.G.; Hong, Y.W.; Su, J.Q. Spatial and seasonal variation of the airborne microbiome in a rapidly developing city of China. Sci. Total Environ. 2019, 665, 61–68. [Google Scholar] [CrossRef] [PubMed]
  44. Yang, X.; Wang, X.; Zhang, Y.; Lee, J.; Su, J.; Gates, R.S. Characterization of trace elements and ions in PM10 and PM2.5 emitted from animal confinement buildings. Atmos. Environ. 2011, 45, 7096–7104. [Google Scholar] [CrossRef]
Figure 1. Schematic drawing of PM2.5 collection in broiler rearing house. Sectional view of (A) CH and (B) FH. (C) Top view of the sampling patten for both CH and FH systems. The four sampling locations are labeled as Con, 1, 2 and 3.
Sustainability 14 01357 g001
Figure 2. Variation in environmental control variables and PM2.5 levels during the rearing cycle of broiler houses. The early, middle and late rearing stages are denoted with D10 (day 10), D24 (day 24) and D38 (day 38), respectively. (A) Temperature (°C), (B) relative humidity (%), (C) CO2 concentration (ppm), (D) NH3 concentration (ppm), (E) PM2.5 concentration (μg/m3). *** represents p < 0.001 between CH and FH.
Sustainability 14 01357 g002
Figure 3. The concentrations of water-soluble (A) cations and (B) anions in indoor PM2.5 samples (n = 3).
Sustainability 14 01357 g003
Figure 4. Community diversity and richness of PM2.5 samples in CH and FH. The plot represents the indicated richness estimator. (A) Scatter plot of the Chao1 index. (B) Scatter plot of the Shannon index. * p < 0.05 and ** p < 0.01 compared between groups in CH and FH (n = 3).
Sustainability 14 01357 g004
Figure 5. Relative abundance of the dominant bacteria in different PM2.5 samples at the phylum (A) and genera (B) levels. The species with proportions greater than 5% are shown at the phylum level and the genera level. Each bar represents the mean value of relative abundance in each group (n = 3).
Sustainability 14 01357 g005
Figure 6. Venn analysis of four biomasses based on genus level. The bar graph shows the number of genera in each set. The samples collected outside and inside the CH, and inside and outside the FH are represented by C_Con, C_PM, F_PM and F_Con, accordingly.
Sustainability 14 01357 g006
Figure 7. Analysis of the influence of environmental control variables and water-soluble ions on the bacterial community structure in PM2.5. (A) Arrows, direction and magnitude of environmental control variables associated with bacterial community structures at the genus level. The ellipses represent bacteria clusters from different groups of PM2.5 samples. (B) Correlation between water-soluble ions and bacterial community structures based on the genus (top 30) as assessed using Spearman’s correlation analysis. The clustering tree on the left side represents the clustering of influence patterns, and the upper one represents the clustering of water-soluble ions. Positive correlations are shown in red color and negative correlations in blue. *, ** and *** represent p < 0.05, p < 0.01 and p < 0.001, respectively.
Sustainability 14 01357 g007
Publisher’s Note: MDPI stays neutral with regard to jurisdictional claims in published maps and institutional affiliations.

