
Assessment of Extraction Methods of Trace Metallic Elements in Plants: Approval of a Common Method

 , ,
, ,  and
and
Abstract
:1. Introduction
2. Experimental
2.1. Plant Material
2.2. Test Methods
2.3. Nitric Acid Digestion (1% and 10%)
2.4. Acid Mixtures Digestion
2.5. Measurements of Trace Metal Elements
2.6. Statistical Analysis
3. Results
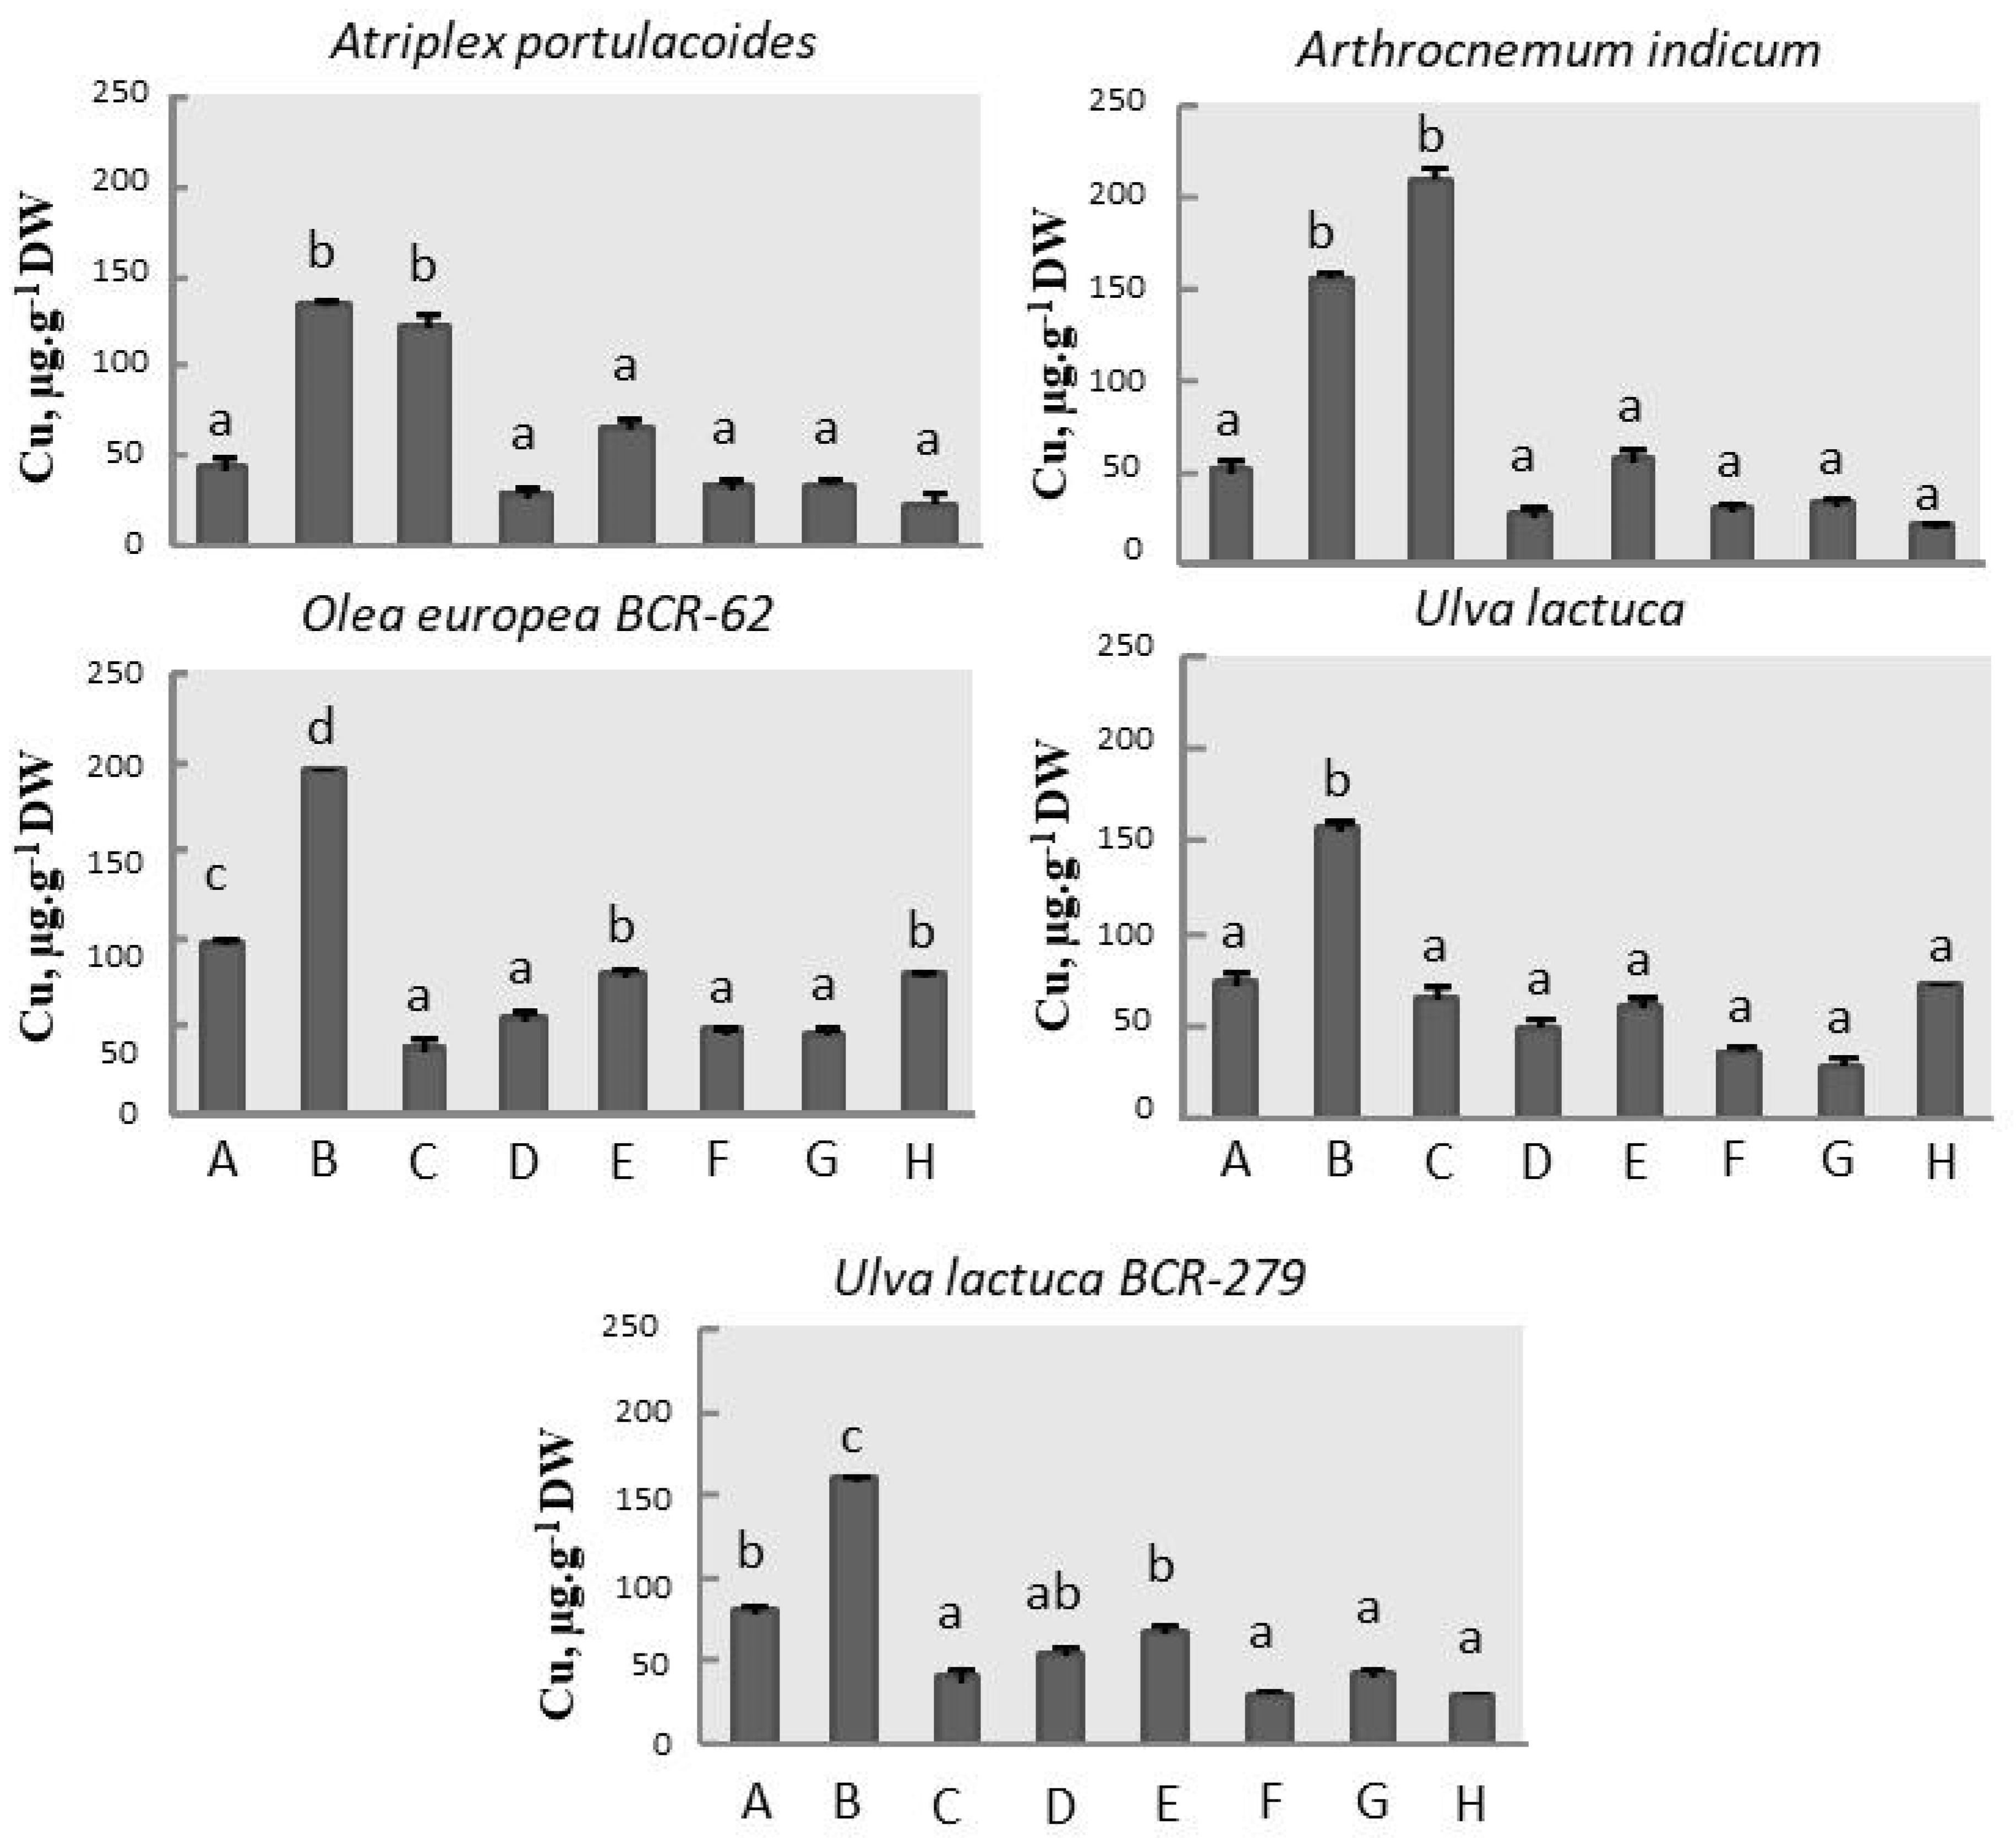
3.1. Copper Assay
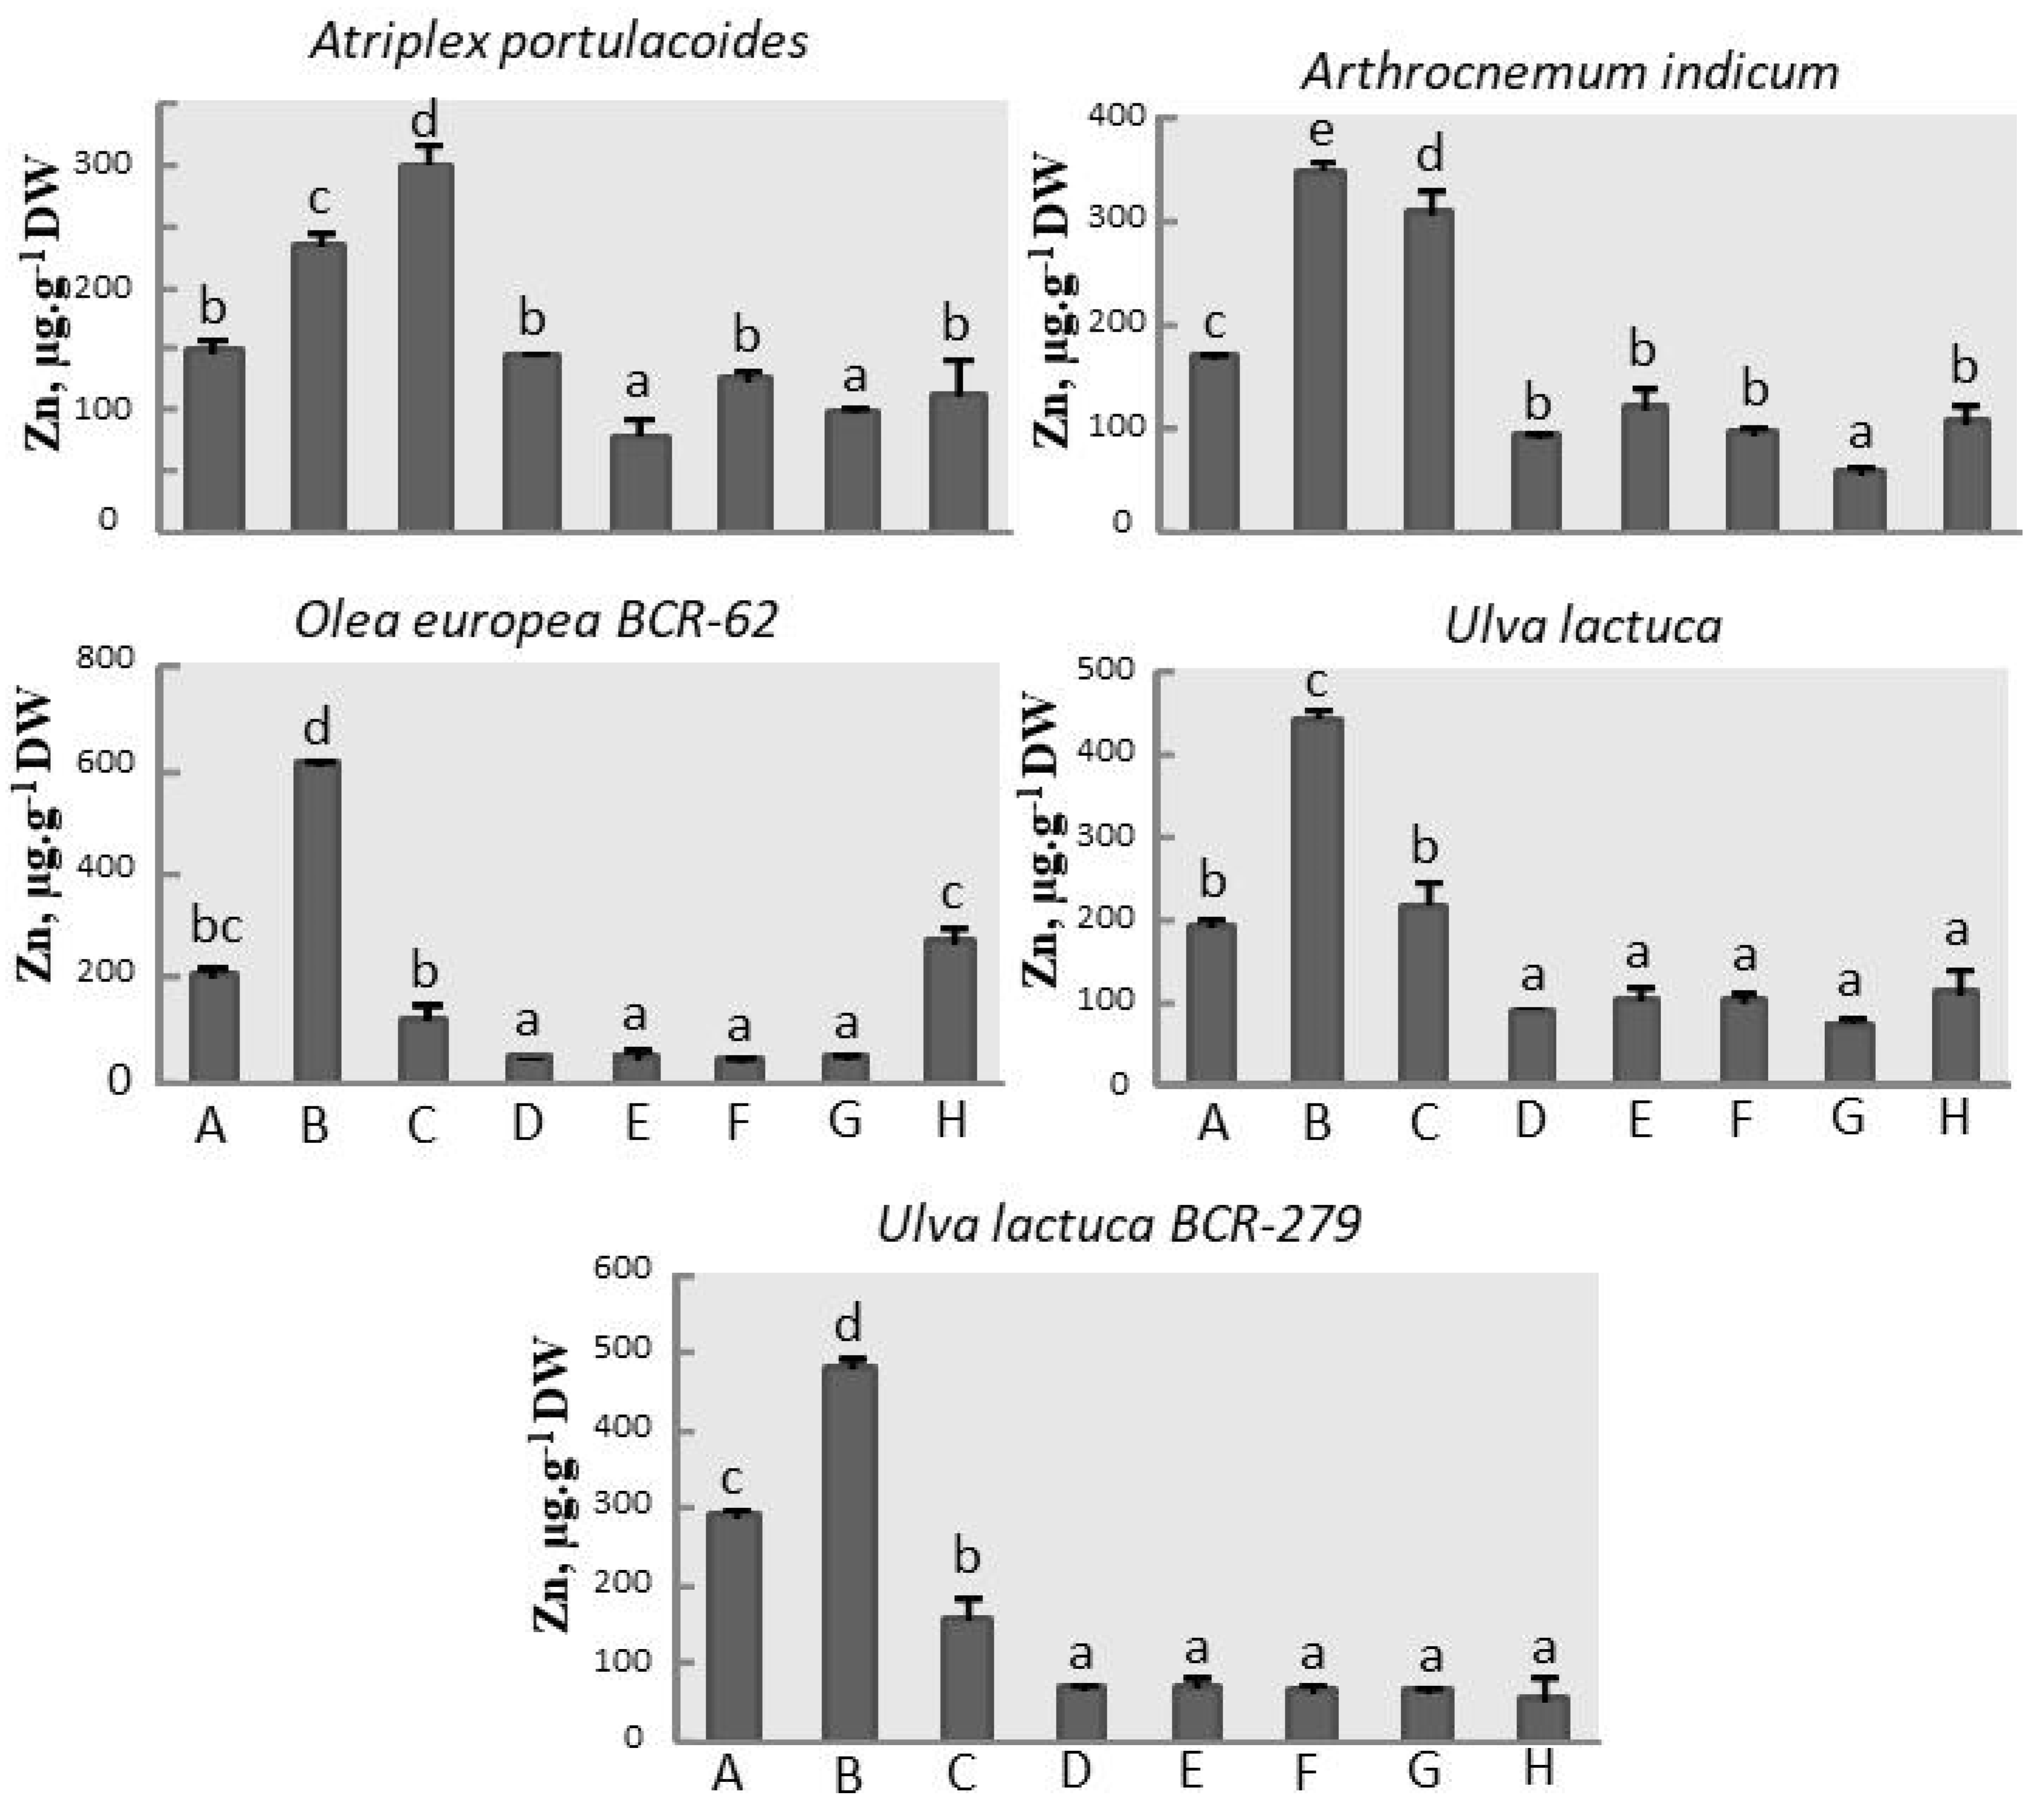
3.2. Zinc Assay
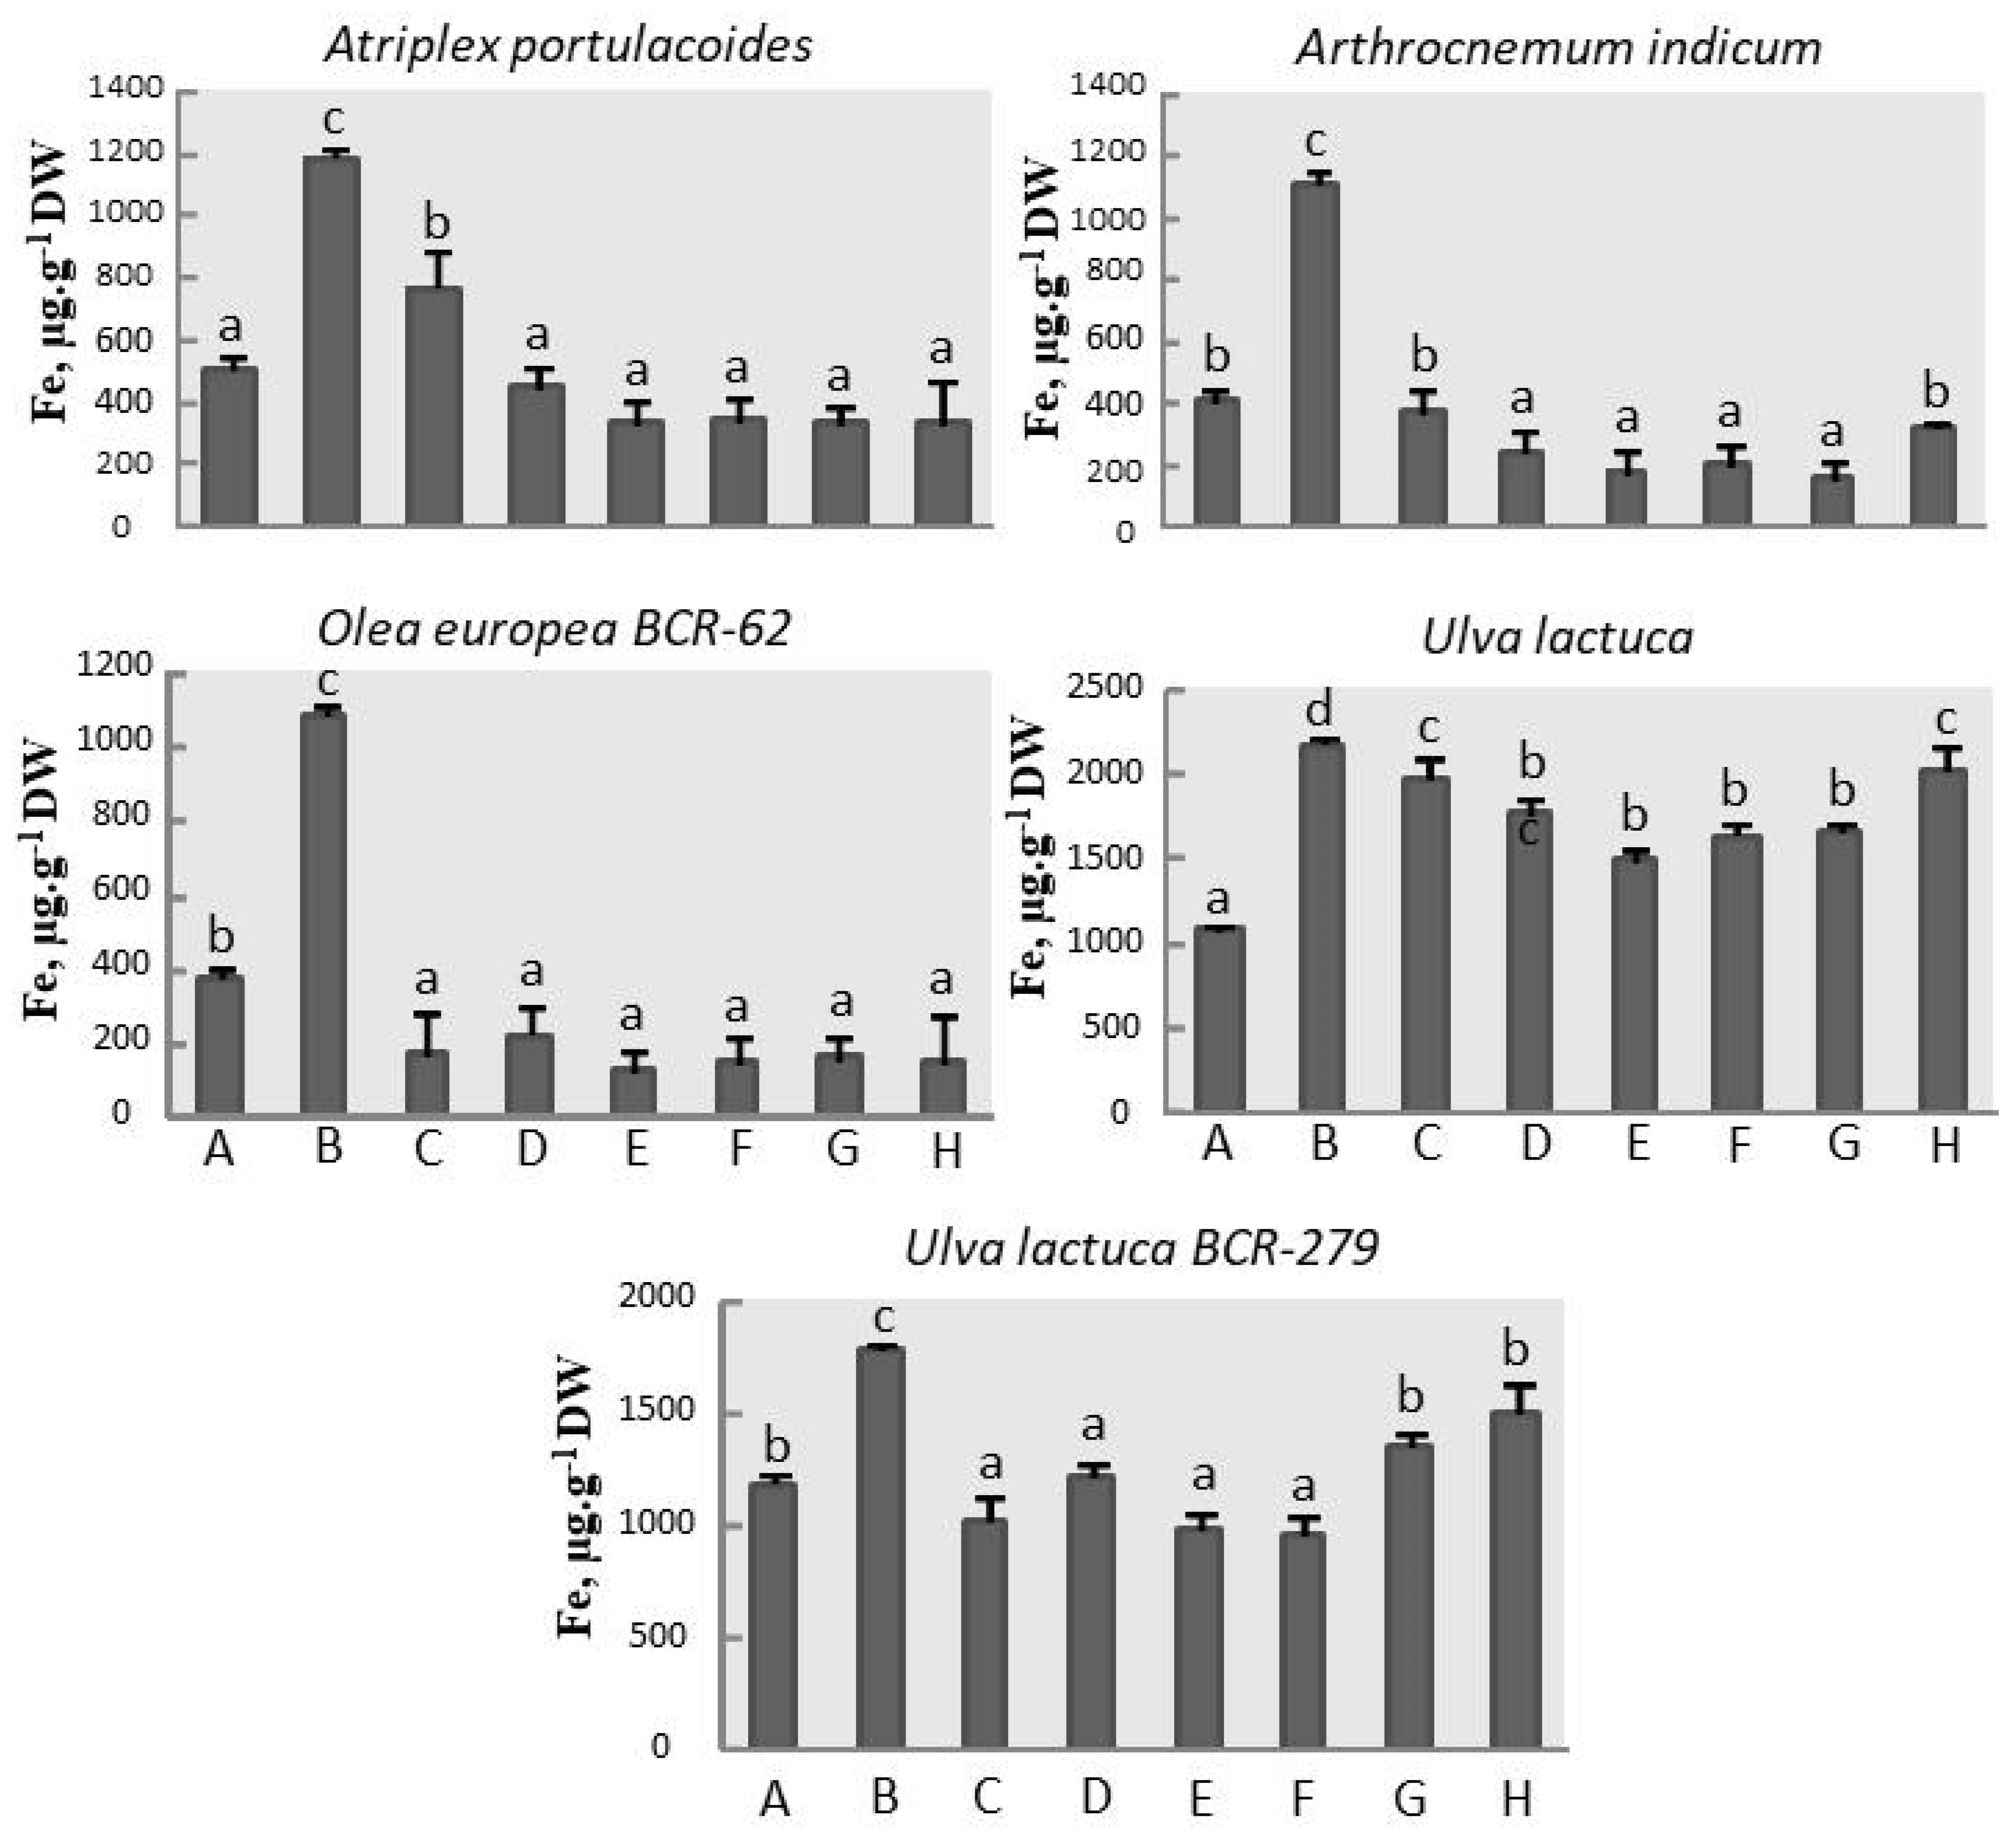
3.3. Iron Assay
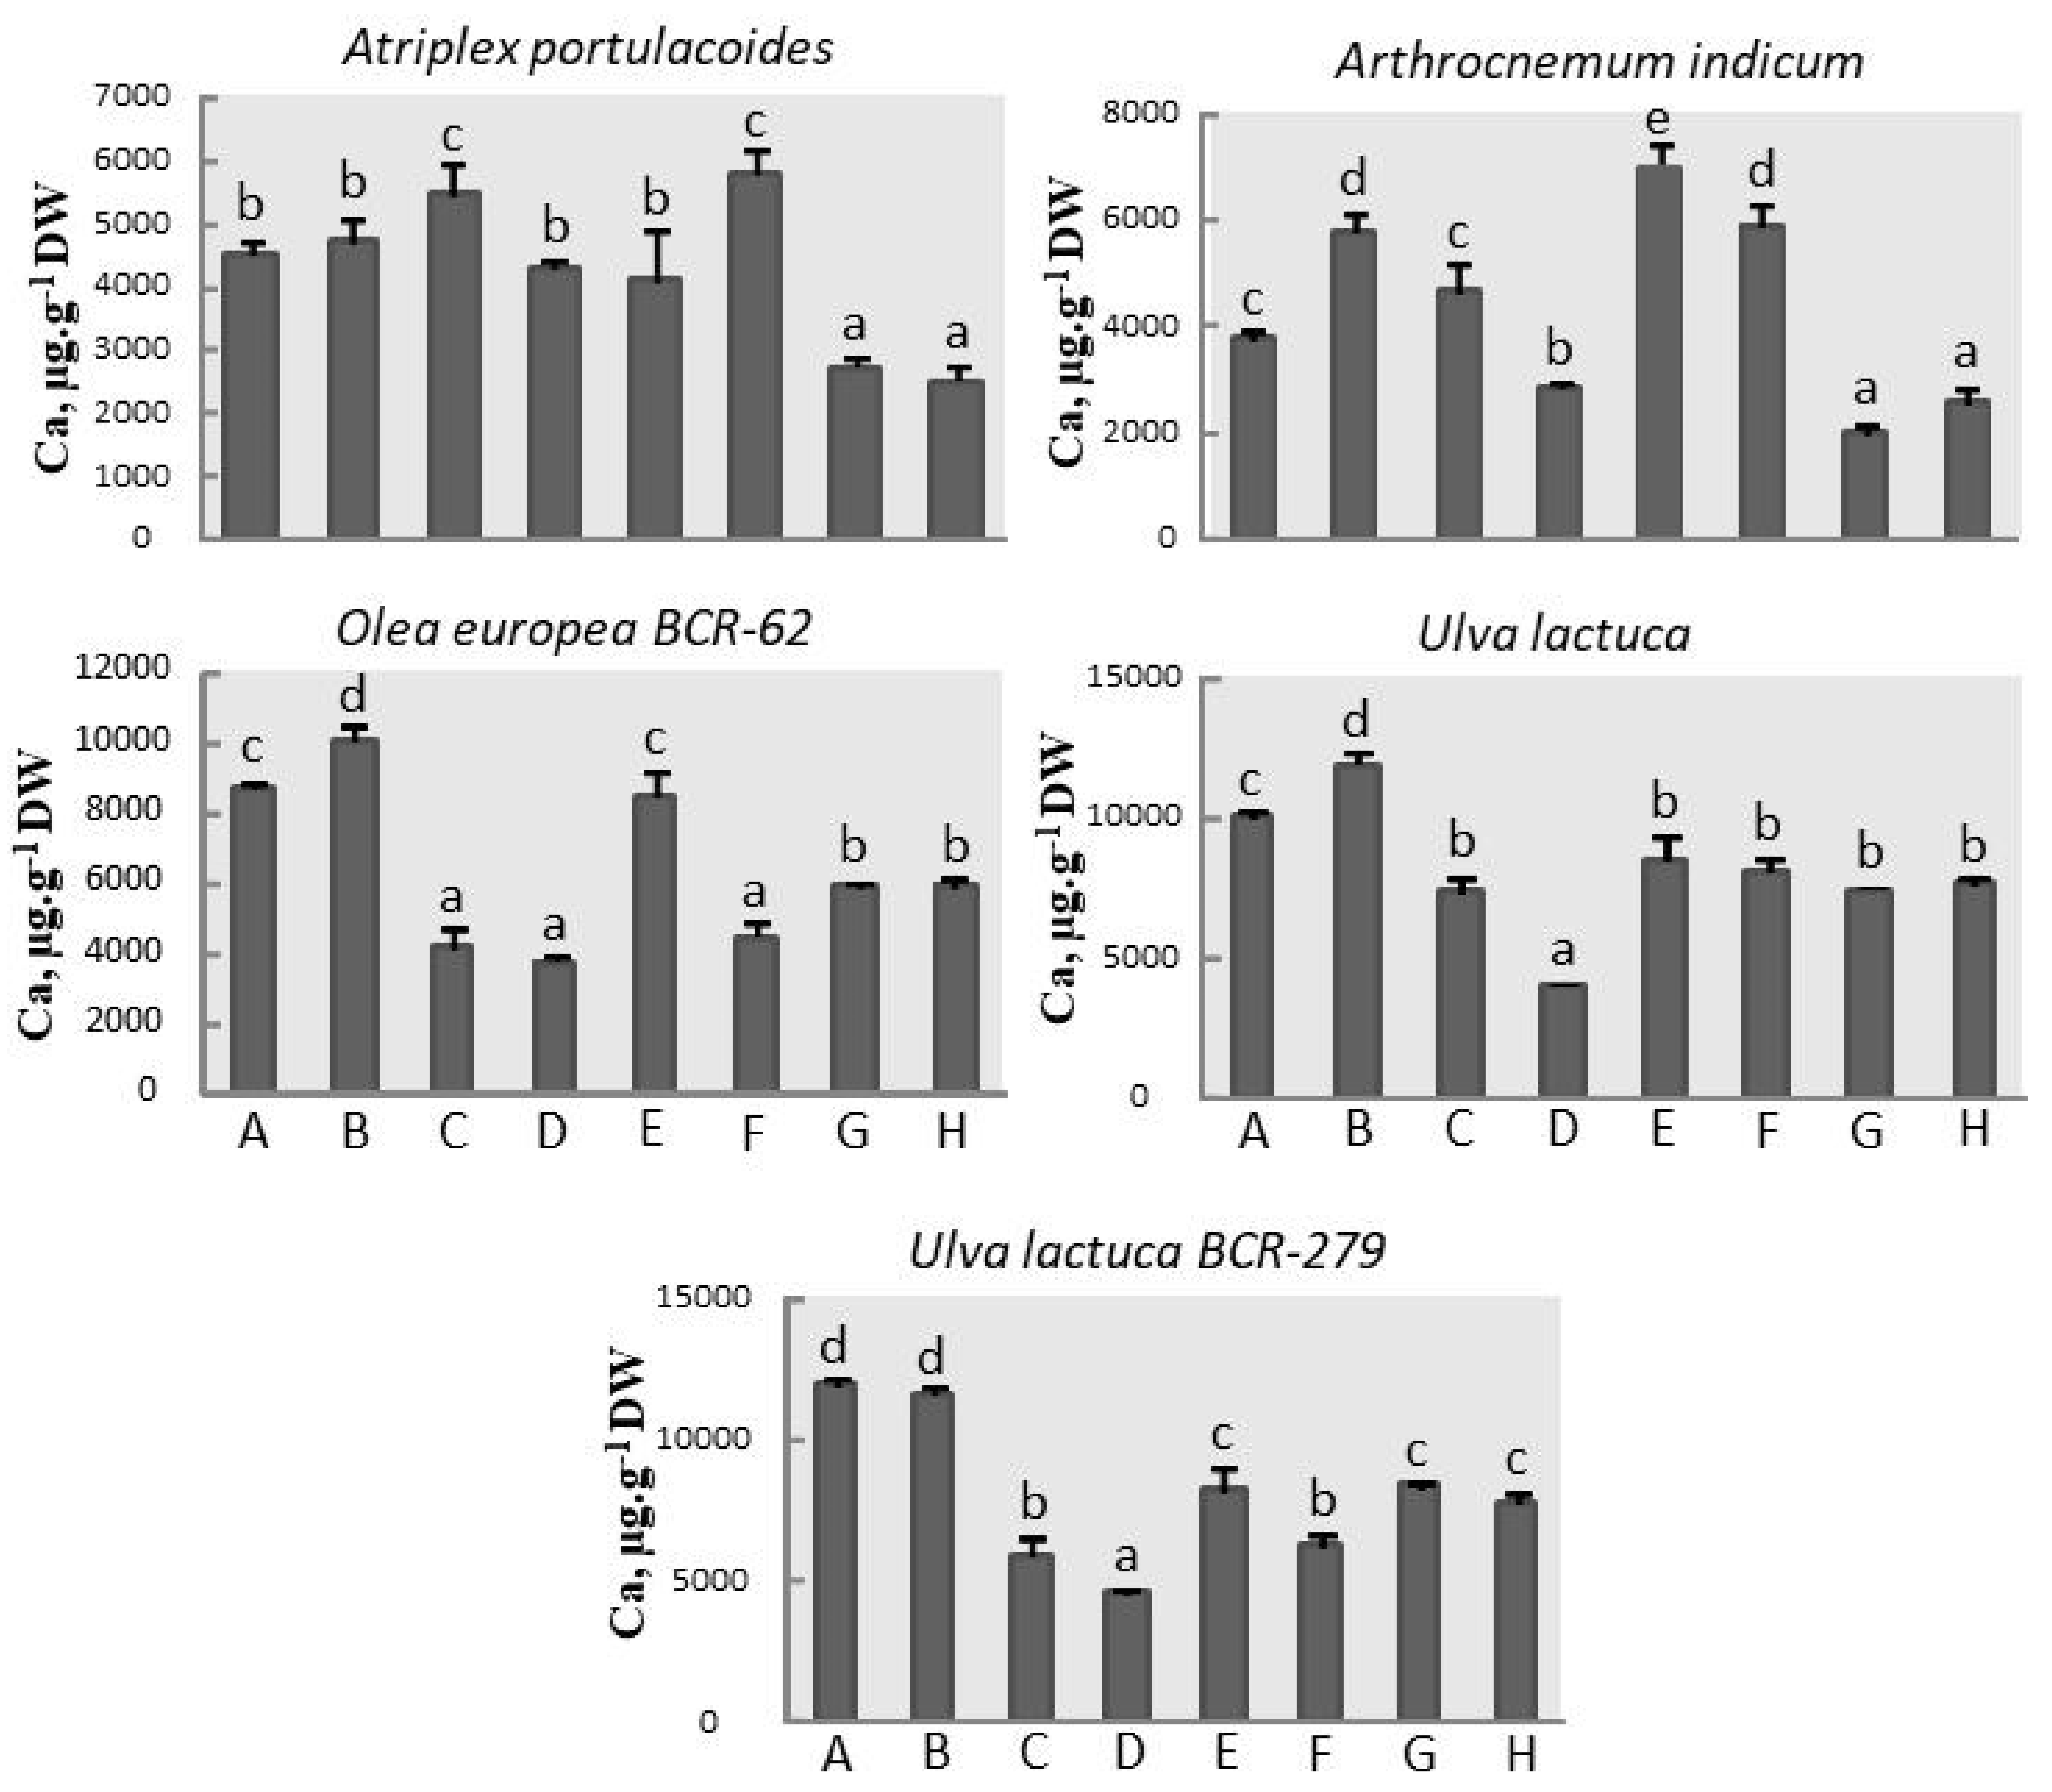
3.4. Calcium Assay
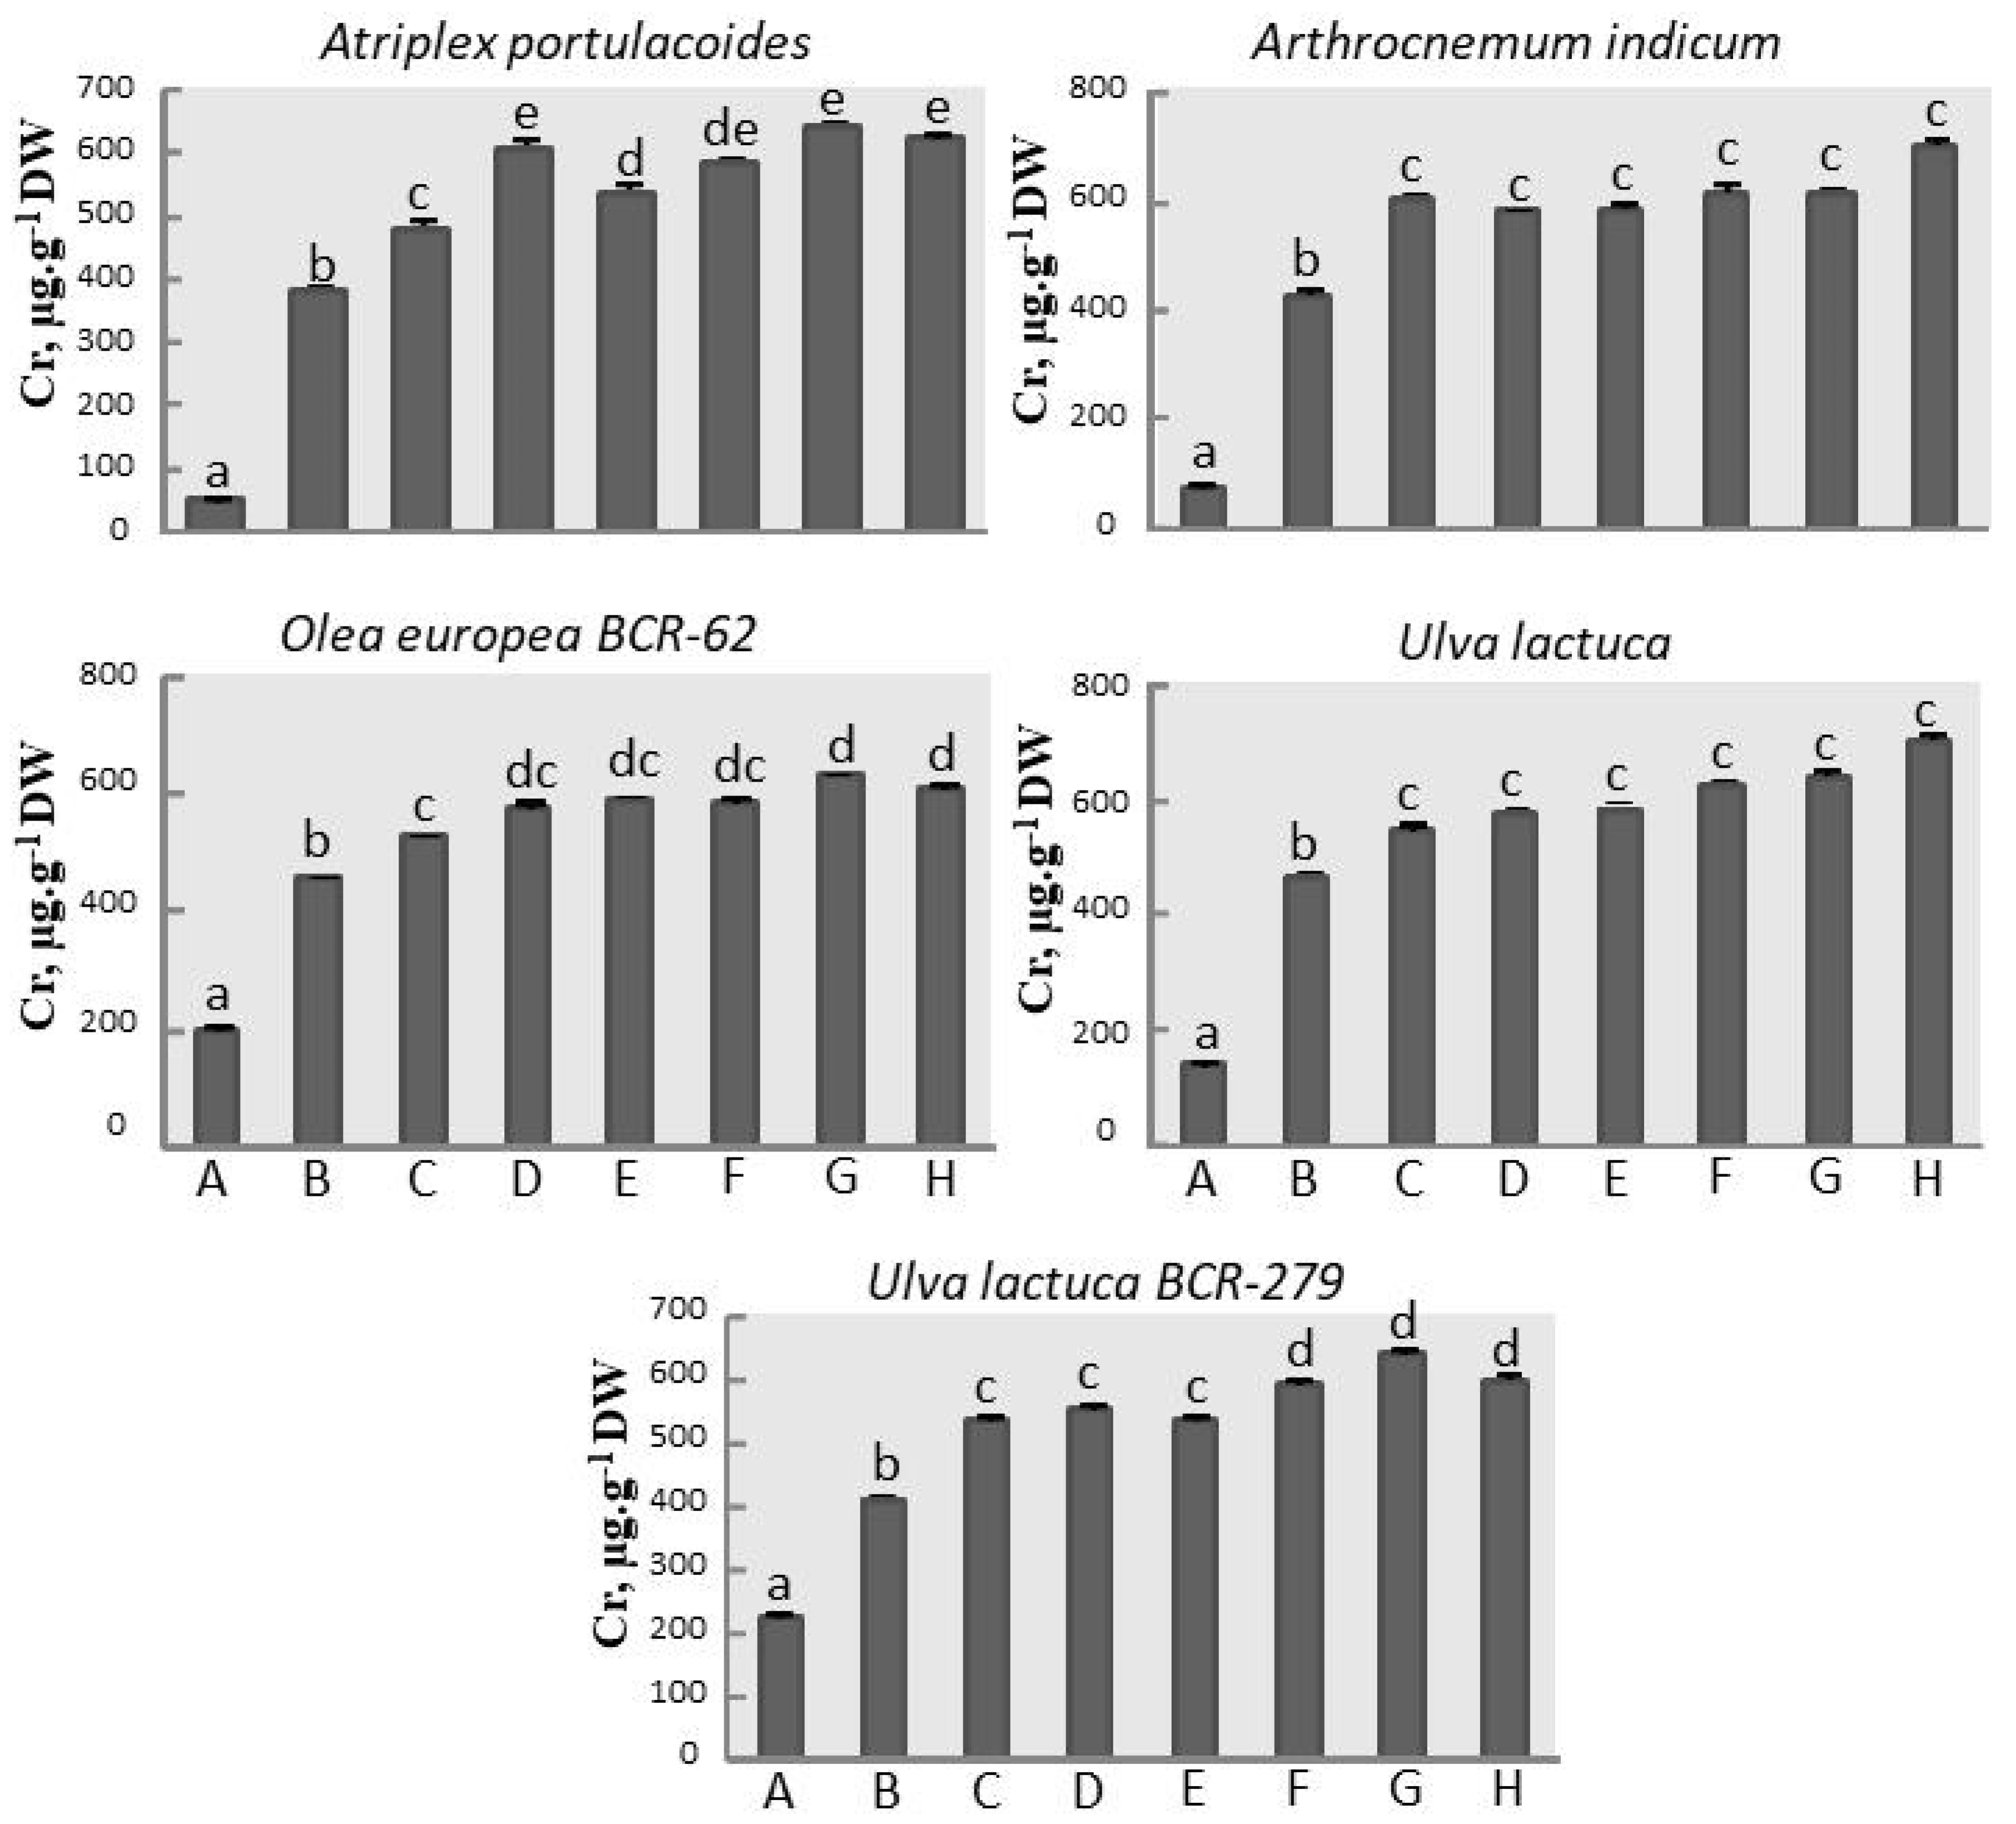
3.5. Chromium Assay
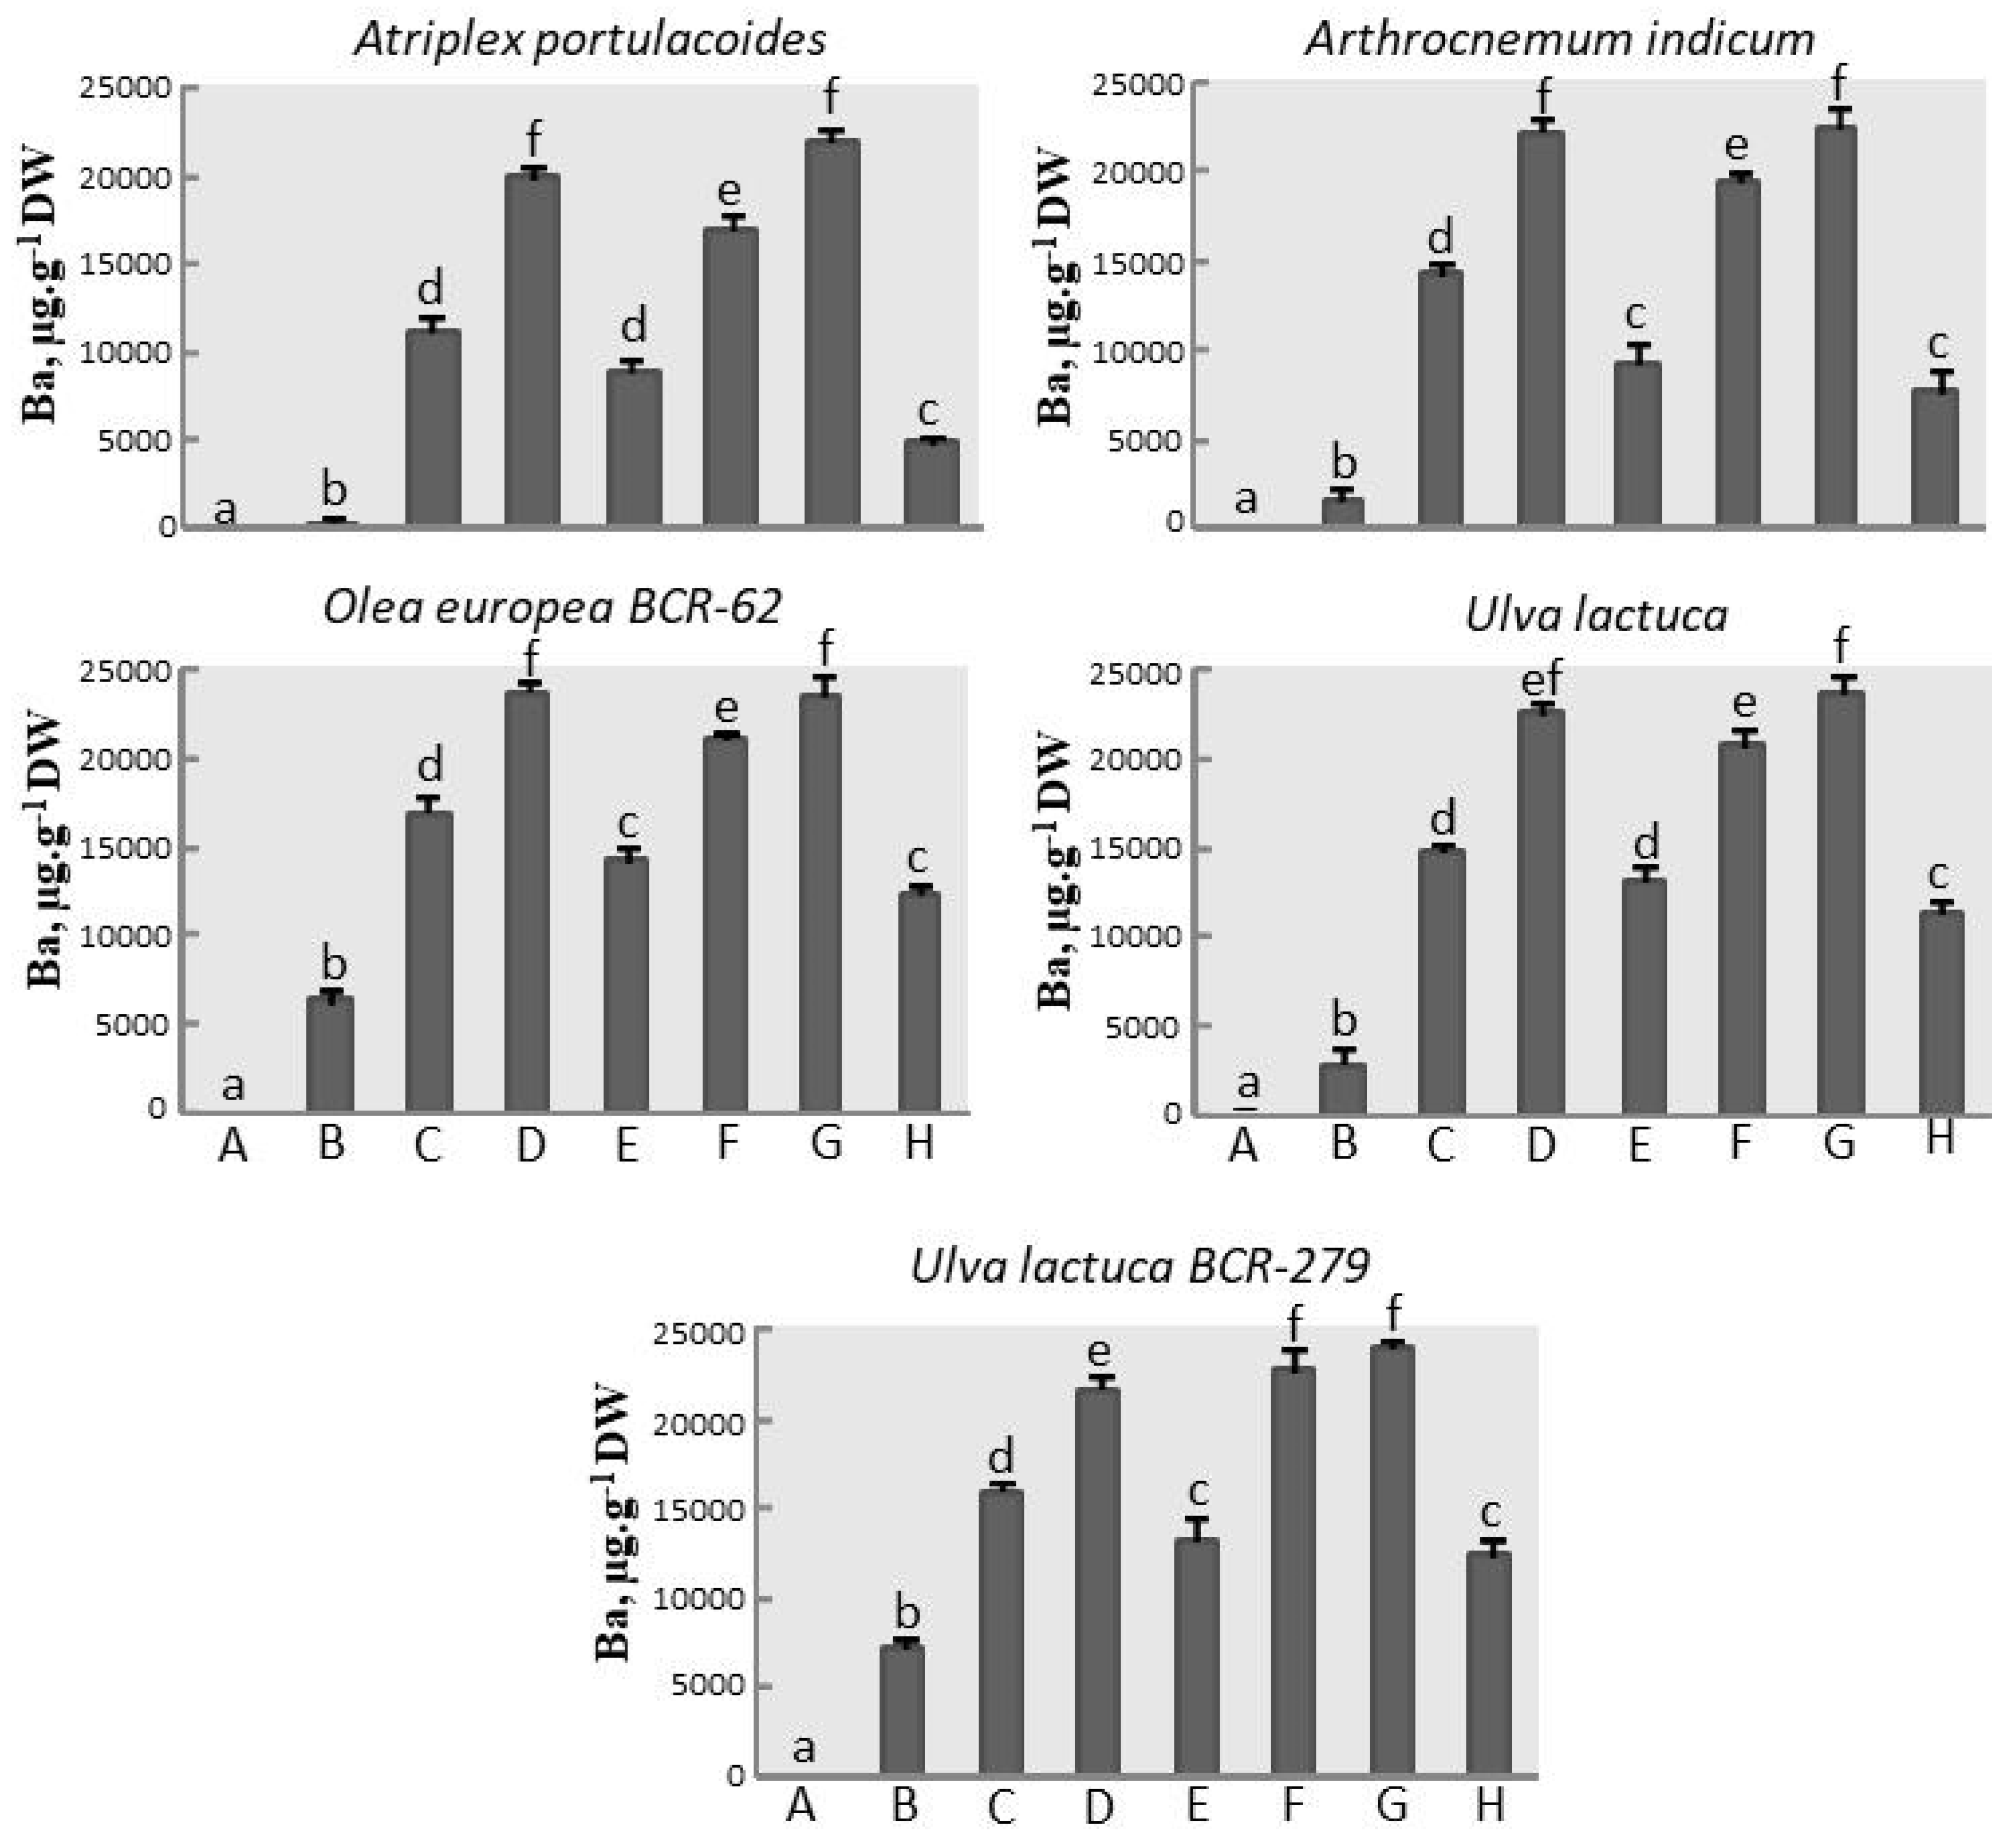
3.6. Barium Assay
4. Discussion
4.1. Drying and Crushing
4.2. Extraction
5. Conclusions
Author Contributions
Funding
Institutional Review Board Statement
Informed Consent Statement
Data Availability Statement
Acknowledgments
Conflicts of Interest
References
- Briffa, J.; Sinagra, E.; Blundell, R. Heavy metal pollution in the environment and their toxicological effects on humans. Heliyon 2020, 6, e04691. [Google Scholar] [CrossRef] [PubMed]
- Hou, D.; O’Connor, D.; Igalavithana, A.D.; Alessi, D.S.; Luo, J.; Tsang, D.C.W.; Sparks, D.L.; Yamauchi, Y.; Rinklebe, J.; Sik Ok, Y. Metal contamination and bioremediation of agricultural soils for food safety and sustainability. Nat. Rev. Earth Environ. 2020, 1, 366–381. [Google Scholar] [CrossRef]
- Masindi, V.; Muedi, K.L. Environmental Contamination by Heavy Metals. In Heavy Metals; Saleh, H., Aglan, R., Eds.; IntechOpen: London, UK, 2018; pp. 115–133. [Google Scholar] [CrossRef] [Green Version]
- Diarra, I.; Prasad, S. The current state of heavy metal pollution in Pacific Island Countries: A review. Appl. Spectrosc. Rev. 2021, 56, 27–51. [Google Scholar] [CrossRef]
- Al Naggar, Y.; Khalil, M.S.; Ghorab, M.A. Environmental Pollution by Heavy Metals in the Aquatic Ecosystems of Egypt. Open Acc. J. Toxicol. 2018, 3, 555603. [Google Scholar] [CrossRef]
- Vassileva, E.; Docekalova, H.; Baeten, H.; Vanhentenriijk, S.; Hoenig, M. Revisitation of mineralization modes for arsenic and selenium determinations in environmental samples. Talanta 2001, 54, 187–196. [Google Scholar] [CrossRef]
- Idera, F.; Omotola, O.; Adedayo, A.; John Paul, U. Comparison of acid mixtures using conventional wet digestion methods for determination of heavy metals in fish tissues. J. Sci. Res. Rep. 2015, 8, 1–9. [Google Scholar] [CrossRef]
- Sghaier, D.B.; Bankaji, I.; Pedro, S.; Caçador, I.; Sleimi, N. Photosynthetic behaviour and mineral nutrition of Tamarix gallica cultivated under aluminum and NaCl combined stress. Phyton-Int. J. Exp. Bot. 2019, 88, 239–252. [Google Scholar] [CrossRef]
- Labidi, O.; Vives-Peris, V.; Gómez-Cadenas, A.; Pérez-Clemente, R.M.; Sleimi, N. Assessing of growth, antioxidant enzymes and phytohormone regulation in Cucurbita pepo under cadmium stress. Food Sci. Nutr. 2021, 9, 2021–2031. [Google Scholar] [CrossRef]
- Abbruzzini, T.F.; Silva, C.A.; de Andrade, D.A.; de Oliveira Carneiro, W.J. Influence of digestion methods on the recovery of iron, zinc, nickel, chromium, cadmium and lead contents in 11 organic residues. Rev. Bras. Ciência Solo 2014, 38, 166–176. [Google Scholar] [CrossRef] [Green Version]
- Caçador, I.; Caetano, M.; Duarte, B.; Vale, C. Stock and losses of trace metals from salt marsh plants. Mar. Environ. Res. 2009, 67, 75–82. [Google Scholar] [CrossRef] [Green Version]
- Momen, A.A.; Zachariadis, G.A.; Anthemidis, A.N.; Stratis, J.A. Investigation of four digestion procedures for multi-element determination of toxic and nutrient elements in legumes by inductively coupled plasma-optical emission spectrometry. Anal. Chim. Acta 2006, 565, 81–88. [Google Scholar] [CrossRef]
- Micó, C.; Recatalá, L.; Peris, M.; Sanchez, J. A comparison of two digestion methods for the analysis of heavy metals by flame atomic absorption spectroscopy. Spectrosc. Eur. 2007, 19, 23–26. [Google Scholar]
- Asher, A.S.; Samuel, K.E.; Mary, D.S. Analytical method for comparison of suitable wet digestion methods for heavy metal analysis in soil around a cement industry. Int. J. Res. Sci. Innov. 2020, 7, 2321–2705. [Google Scholar]
- Ghanthimathi, S.; Aminah, A.; Salmijah, S.; Ujang, T.; Nurul Izzah, A. Comparison of microwave assisted acid digestion methods for ICP-MS determination of total arsenic in fish tissue. Sains Malays. 2012, 41, 1557–1564. [Google Scholar]
- Ranasinghe, P.; Weerasinghe, S.; Kaumal, M.N. Determination of heavy metals in tilapia using various digestion methods. Int. J. Sci. Res. Innov. Technol. 2016, 3, 2313–3759. [Google Scholar]
- Shaibur, M.R.; Md Shamim, A.H.; Imamul Huq, S.M.; Kawai, S. Comparison of digesting capacity of nitric acid and nitric acid-perchloric acid mixture and the effect of lanthanum chloride on potassium measurement. Nat. Sci. 2010, 8, 157–162. [Google Scholar]
- Müller, E.I.; Mesko, M.F.; Moraes, D.P.; Korn, M.d.G.A.; Flores, É.M.M. Wet digestion using microwave heating. In Microwave-Assisted Sample Preparation for Trace Element Analysis; Flores, É.M.M., Ed.; Elsevier: Amsterdam, The Netherlands, 2014; pp. 99–142. [Google Scholar] [CrossRef]
- Baize, D. Teneurs totales en “métaux lourds” dans les sols français. Le Courrier De L’environnement De L’inra 2000, 39, 39–54. [Google Scholar]
- Larson, K.D.; Dejong, T.K.; Johnson, R.S. Physiological and growth responses of mature peach trees to postharvest water stress. J. Am. Soc. Hortic. Sci. 1988, 133, 296–300. [Google Scholar]
- Bankaji, I.; Sleimi, N. Polymorphisme biochimique chez quelques halophytes autochtones du nord Tunisien. Revue Ecologie 2012, 67, 29–39. [Google Scholar]
- Lefèvre, I.; Marchala, G.; Meerts, P.; Corréal, E.; Lutts, S. Chloride salinity reduces cadmium accumulation by the Mediterranean halophyte species Atriplex, halimus L. Environ. Exp. Bot. 2009, 65, 142–152. [Google Scholar] [CrossRef]
- Redondo-Gómez, S.; Mateos-Naranjo, E.; Andrades-Moreno, L. Accumulation and tolerance characteristics of cadmium in a halophytic Cd-hyperaccumulator, Arthrocnemum macrostachyum. J. Hazard. Mater. 2010, 184, 299–307. [Google Scholar] [CrossRef] [PubMed]
- Barbaste, M. Analyse des teneurs en métaux dans les végétaux, analyse foliaires de diverses espèces végétales Al, As, B, Cd, Co, Cr, Cu, Fe, Mg, Mn, Mo, Ni, Pb, Se, Zn. In Comparaison de Méthodes D’analyse des Éléments Traces Métalliques (ETM) et des Hydrocarbures Aromatiques Polycycliques (HAP) sur les Sols et les Végétaux; Hébrard-Labit, C., Meffray, L., Eds.; [Rapport de Recherche]; Centre d’études sur les réseaux, les Transports, l’urbanisme et les Constructions Publiques (CERTU): Bordeaux, France, 2004; pp. 63–75. [Google Scholar]
- Des Ligneris, L.; Douay, F.; Sterckeman, T. Teneurs en métaux (Pb, Cd et Zn) de végétaux cultivés dans les exploitations agricoles et les jardins familiaux. In Programme de Recherches Concertées, Environnement et Activités Humaines, Etude d’un Secteur Pollué par les Métaux, Lère Partie: Métaux Polluants des Sols (Cd, Pb, Zn) et Organismes Vivants. Qualité des Productions Végétales; Ministère de l’Enseignement Supérieur et de la Recherche, Région Nord-Pas de Calais: Nord-Pas-de-Calais, France, 1999; Volume 3, p. 131. [Google Scholar]
- C.E.R.T.U.: Centre d’Etude sur les Réseaux, les Transports, l’Urbanisme et les Constructions Publiques. Comparaison de Méthodes D’analyse des Éléments Traces Métalliques et des Hydrocarbures Aromatiques Polycycliques (HAP) sur les Sols et les Végétaux 2004; Centre d’Etude sur les Réseaux, les Transports, l’Urbanisme et les Constructions Publiques (CERTU): Lyon, France, 2004. [Google Scholar]
- Uddin, A.H.; Khalid, R.S.; Alaama, M.; Abdualkader, A.M.; Kasmuri, A.; Abbas, S.A. Comparative study of three digestion methods for elemental analysis in traditional medicine products using atomic absorption spectrometry. J. Anal. Sci. Technol. 2016, 7, 6. [Google Scholar] [CrossRef] [Green Version]
- Hoenig, M. Preparation steps in environmental trace element analysis—Facts and traps. Talanta 2001, 54, 1021–1038. [Google Scholar] [CrossRef]
- Mokoena, D.P.; Mngadi, S.V.; Nomngongo, P.N. Microwave-Assisted extraction of trace metals from sediments using dilute hydrogen peroxide and dilute nitric acid prior to their determination by Inductively Couple Plasma-Optical Emission Spectrometry. Curr. Anal. Chem. 2020, 16, 970. [Google Scholar] [CrossRef]
- Yang, L.; Li, Y.; Xj, G.; Ma, X.; Yan, Q. Comparison of dry ashing, wet ashing and microwave digestion for determination of trace elements in periostracum serpentis and periostracum cicadae by ICP-AES. J. Chil. Chem. Soc. 2013, 58, 3. [Google Scholar] [CrossRef] [Green Version]
- Anugrahwati, M.; Falahudin, A.; Khoirul Anas, A. Comparative analysis of dry ashing and wet digestion methods for determination of Pb metal in tobacco leaves. AIP Conf. Proc. 2020, 2229, 030040. [Google Scholar] [CrossRef]
- Bui, X.T. Use of Matrices Agro-Foodstuff as Indicators of Environmental Pollution: Example of Milk. Ph.D. Thesis, Sciences of the Universe, Paris, France, 2007. [Google Scholar]
- Sleimi, N.; Bankaji, I.; Dallai, M.; Kefi, O. Accumulation des éléments traces et tolérance au stress métallique chez les halophytes colonisant les bordures de la lagune de Bizerte. Revue Ecologie 2014, 69, 49–99. [Google Scholar]


| Olea europaea BCR-62 | Cu (µg·g−1 DW) | Zn (µg·g−1 DW) |
|---|---|---|
| Method A | 97.07 | 209.40 |
| Method B | 196.11 | 616.67 |
| Method C | 38.78 | 127.21 |
| Method D | 55.47 | 51.53 |
| Method E | 78.99 | 52.11 |
| Method F | 48.05 | 46.78 |
| Method G | 46.87 | 54.09 |
| Method H | 79.87 | 270.99 |
| Certified reference value | 46.60 | 16.00 |
| Ulva lactuca BCR-279 | Cu (µg·g−1 DW) | Zn (µg·g−1 DW) |
| Method A | 79.79 | 290.93 |
| Method B | 159.66 | 482.75 |
| Method C | 39.80 | 159.80 |
| Method D | 54.51 | 70.43 |
| Method E | 68.25 | 73.54 |
| Method F | 30.68 | 66.36 |
| Method G | 42.52 | 66.57 |
| Method H | 30.51 | 54.63 |
| Certified reference value | 13.10 | 51.30 |
Publisher’s Note: MDPI stays neutral with regard to jurisdictional claims in published maps and institutional affiliations. |
© 2022 by the authors. Licensee MDPI, Basel, Switzerland. This article is an open access article distributed under the terms and conditions of the Creative Commons Attribution (CC BY) license (https://creativecommons.org/licenses/by/4.0/).
Share and Cite
Sleimi, N.; Bankaji, I.; Kouki, R.; Dridi, N.; Duarte, B.; Caçador, I. Assessment of Extraction Methods of Trace Metallic Elements in Plants: Approval of a Common Method. Sustainability 2022, 14, 1428. https://doi.org/10.3390/su14031428
Sleimi N, Bankaji I, Kouki R, Dridi N, Duarte B, Caçador I. Assessment of Extraction Methods of Trace Metallic Elements in Plants: Approval of a Common Method. Sustainability. 2022; 14(3):1428. https://doi.org/10.3390/su14031428
Chicago/Turabian StyleSleimi, Noomene, Insaf Bankaji, Rim Kouki, Nesrine Dridi, Bernardo Duarte, and Isabel Caçador. 2022. "Assessment of Extraction Methods of Trace Metallic Elements in Plants: Approval of a Common Method" Sustainability 14, no. 3: 1428. https://doi.org/10.3390/su14031428