Article

Relation between Globe Latitude and the Quality of Life: Insights for Public Policy Management

by
Adam Pawliczek
1,2,
Joanna Kurowska-Pysz
3 and
Richard Smilnak
1,4,*
1
Moravian Business College Olomouc, Prague University of Economics and Business, 779 00 Olomouc, Czech Republic
2
Faculty of Management, Prague University of Economics and Business, 377 01 Jindřichův Hradec, Czech Republic
3
The Research Institute on Territorial and Inter-Organizational Cooperation, WSB University, 41-300 Dąbrowa Górnicza, Poland
4
Faculty of Economics, Prague University of Economics and Business, 130 67 Prague, Czech Republic
*
Author to whom correspondence should be addressed.
Sustainability 2022, 14(3), 1461; https://doi.org/10.3390/su14031461
Submission received: 14 December 2021 / Revised: 20 January 2022 / Accepted: 22 January 2022 / Published: 27 January 2022

Abstract

:
Life quality and its determinants represent a topic which is essential to all civilizations, past and present. This paper employs common methods for inspecting factors of correlation with the aim of assessing the influence of geographical location on life quality and happiness. After setting a stable theoretical cornerstone, the article works with the measures reported by the Human Development Index (HDI) and the World Happiness Score (WHS). The work finds and proves ties between the globe latitude of one’s dwelling and their reported life quality measures, with the main conclusion being that the quality of life measured by the HDI and WHS is spread around the globe asymmetrically regarding latitude. Following the results of the research, possible reasons such as enhanced strategic thinking and an emphasis on sounder plans for living embedded in public policy are discussed. Recommendations point toward the possibility of the global north issuing aid to the global south, not in the form of financial capital, but in the form of a knowledge transfer through technology-enabled learning as a means for uplifting global well-being.

1. Introduction: Quality of Life and Regionalism

The question of the possible ties between human life quality and geographical location has been on the minds of the authors of this text for a long time, and since we all are university lecturers, the decision to consider the results from the point of view of educators was natural. Inspecting the influence of one’s location on their life quality with novel ways of education in mind, we therefore embarked on the study which follows.
The definition of the concept of “the quality of life” has been the question of philosophy, religion and culture for many years, but usually it is interconnected with health, happiness, wisdom and reaching old age. As a social concept, it can be associated with:
  • Democracy, liberty, freedom;
  • High quality of environmental and natural conditions;
  • Health care, social services;
  • Safety, low criminality and corruption;
  • Education, culture, individual and community values;
  • Reasonable private property and wealth.
For the analyses, we selected the following composite indicators as possible and suitable measures of the quality of life:
  • The Human Development Index (HDI);
  • The World Happiness Score (WHS).
If we want to compare the indicators mentioned above, we need to choose an optimal geographic unit or region. We concluded that the world countries defined from the point of latitude by their capital cities will be a satisfying measure for our purposes. Although such units are still not ideal, they are well representative, and the data needed for analyses are well obtainable.
The concepts of globalization, deglobalization and regionalism are necessary to mention as important integration/disintegration phenomena which are occurring in the world. Globalization, as the process by which the world is becoming increasingly interconnected because of massively increased trade and cultural exchange, has increased the overall production of goods and services and has therefore had generally a positive economic consequence in terms of growth. In the contemporary world, however, we can observe deglobalization processes as well. These are characterized by a lowered interdependence between certain worldwide economic agents—typically large economic (common market) areas or nation states. The concept of deglobalization describes periods in history where goods, services and investment flows between national economies decline. Regionalism—as a political ideology—leading in theory and practice to regional rather than central systems of economic, cultural, or political activity—is very close to deglobalization.
Trends and processes called regional integration are a natural part of the whole world economy and the logical outcome of the colonial arrangement of the world in addition to economic and international development. The essence of the integration process has been a gradual removal of barriers between states and regions and the creation of their cooperation based on specialization. In addition to the dynamically developing regions of the world, however, there are some regions where the international division of labor and cooperation does not work as smoothly. In one aspect, in the contemporary world, there are countries where better conditions for mutual cooperation, prosperity enhancement, and economic development are constantly being created. However, there are still regions where cooperation exists very scarcely and does not bring much positive effect.
The aim of this paper is to compare the level of human life quality in selected countries with their geographical (regional) location expressed by degrees of latitude using the HDI and WHS as selected parameters of the quality of life. For the comparison and analyses, the data of the HDI and WHS development in countries of the world in the period from 1990 to 2019 have been used. The main goal of the paper is to find out if the HDI and WHS scores are correlated to the globe latitude. Different time scopes and groups of countries are applied to research this phenomenon. Section 2 offers the literature review, followed by an overview of the methods used (Section 3). Section 4 then presents a view of the results, followed by Section 5 containing the discussion and a Section 6 which concludes the main body of this research.
The specific and partial goal of this paper is to prove or disprove an existing link between a country’s capital city location determined by latitude, with their quality of life. After determining the character of the relation between those measures and discussion, the authors issue policy recommendations.

2. Literature Review

The following chapter introduces important concepts, definitions and discussion based on the review of the scientific literature.
The concepts of region, regionalism, regionalization, countries, and states are explained and discussed. The quality of human life, satisfaction and development, and its measurement (especially by the HDI), is further analyzed. Special attention is paid to bibliographic analysis, the definition and calculation of the HDI, its pros, cons and criticism points. Examples of scientific world findings regarding human development in relation to the ICT, competitiveness, corporate management, subnational level of the HDI, municipalities, income inequality, populism, geoprocessing, and spina bifida are described. Later modifications, optimization of the HDI, innovative approaches, and related indices are presented. At the end of the chapter, the situation analysis and tables of the HDI and WHS in regions and world countries are presented.

2.1. Ambiguity in Defining the Concept of Region

Professional approaches to the issue of world regions are rather different, and definitions of the basic concepts are still undergoing their development. The basic concept of “region” is related to the geographical location in the classical concept, however, in terms of regionalism, the concept of a region has a social, economic, political or organizational meaning and can be defined as “groupings (clusters) of two or more countries, which may have various forms of regional cooperation and integration” [1]. This form of the definition enables the view of a given region as a summary of selected members of a grouping. Although we consider the structure of bonds and the level of economic integration, there are a series of examples when countries do not belong to a given region or the membership of countries in different organizations overlaps, yet they are a part of the region in terms of geography. An obvious example may be Norway or Switzerland, or, if needs be, the countries wanting to join the EU.
A major trend in the global economy and the driving force of its development is the global phenomenon called regionalism, which “seeks to integrate economies into as comparable level of the economic development as possible” [1] (p. 108). However, this international economic trend also carries political and strategic context, and, at the same time, it is related to the concept of globalization, which is the natural tendency for the convergence of economies and people.
Perhaps due to political reasons, there are two diametrically opposed groups of opinions related to the issue of regionalism, which are engaged in a dynamic and very intensive debate on the benefits and the risks of this international trend. Its protagonists emphasize the benefits, such as increasing the region’s competitiveness, market size, supporting the mobility of economic factors, etc., in the political sphere, the ability of stabilization and the possibility of promoting reforms and structural changes in particular countries and enhancing the security of these regions. This view is opposed by the other group, which refers to the harmfulness of regional trends because it deviates from economy to politics and political interests in organizing the world through the regions, by which it blocks the space for the participation of poorer or less “powerful” countries and increases the complexity of mutual relations and sets rules that the countries refuse or are reluctant to comply with.
When reviewing literature, it can be seen that a lot of factors, such as legal, territorial, cultural, historical, social, political, and economic aspects, influence the definition of the concept of a region. In particular, [2] emphasizes that regional integration is a driving force of multilateral negotiations and has a positive effect on the standard of living in member countries [3].
Similar findings have already been published [4]. Acemoglu et al. focused on the origins of power, prosperity, and poverty. The authors of [5] concentrate more on religious and cultural aspects of economic growth.
In terms of geography, regionalism is perceived similarly and is demonstrated by the main centers of the world economy. Again, there is a certain contradiction. On the one hand, regionalism leads to creating world economic centers, which eliminate the differences between West and East or North and South. On the other hand, however, regionalism creates and deepens these differences due to its nature. From the economic viewpoint, therefore, it opens the so-called economic scissors and deepens the poverty and backwardness of the poorest countries of the world, which are becoming more unstable regarding security and neglected in terms of economic interconnectedness. The concept of regionalism is to be distinguished from the concept of regionalization, which represents the process of creating regions on the basis of mutual cooperation and occurs as a result of mutual economic dependence of states. However, this trend proceeds autonomously, just as cooperation among countries arises and develops spontaneously. This formal tendency occurs mainly in border areas in terms of economic and social convergence.

2.2. Economic Differentiation of Regions and States

A considerable differentiation among states is given mainly by the unequal allocation of natural resources and by the past development of their societies. The profound differences between countries and regions are also caused by the historical inertia of colonialism, and alternatively, the settlement of colonies by European and other settlers from more developed parts of the world, all of which have a positive impact on the development of backward areas [6].
Other aspects that contribute to uneven global development are, e.g., the abovementioned legacy of colonialism and different conditions in agriculture [4], or different climatic conditions [7] and different access to resources (e.g., mineral). However, the less favorable socio-cultural and political, but especially economic and industrial conditions, do not necessarily indicate negative development. If a country does not have sufficient supplies of scarce natural resources, the Ricardian theory of comparative advantage may work successfully, and the areas may undergo a very positive economic development due to specialization (e.g., Hong Kong, Singapore).
Certainly, the position of power of the states also has a certain influence, and the economic dependence of the developing countries on the developed world is obvious, too [8]. However, widening the disparities among countries occurs again since the developing countries are mainly used as a source of cheap labor or other production resources, or, if needs be, an outflow of profit, human capital and income back to the developed countries. Mainly the vastly different cost of labor is reflected in prices, which only deepens the inequalities within the whole world economy. The different labor costs are obviously reflected in the value of a product and the differentiation continues to increase. “The unequal trade exchange helps maintain the technological backwardness of the countries with a cheap labour as their participation in world markets is not accompanied by a corresponding accumulated profit” [9]. Thus, from this point of view, the exacerbation of economic globalization and the further opening of the so-called economic scissors occur.

2.3. On the Measurement of Life Quality and Human Development

Life quality has always been one of the dominant societal and political discourses in the modern world. Notions such as life quality, well-being and development are often used interchangeably, and the latter can be defined as a complex and multidimensional process that positively changes the perceived well-being or the quality of life of individuals and the whole society [10]. The definition of the levels of development of countries/regions and its main constituent items are still an open question, but the “old” notion of economic development, which considers lowering inequality measured by per capita income as its main goal, seems clearly insufficient to attain the amplitude and breadth of challenges connected with development [11]. Hence, it does not come as a surprise that the term development has been amplified through being taken from different viewpoints, by adding various adjectives to the term, e.g., “human” and “sustainable” as the most frequent [12].
Human development was introduced in 1990 to emphasize that not just economic growth, but people and their capabilities should be the ultimate criteria for assessing the level of development of a country [13]. As first set by the United Nations Development Program [14], the concept gathers three essential human choices—a life which lasts long and is spent in good health, knowledge enhancement enabled by access to information and education, and a decent standard of living. Nevertheless, it has evolved through time to account for a wider and much more complex process of making the pool of people’s choices and opportunities larger, of enlarging human freedoms and of valuing individuals’ capacities that allow them to lead a life with higher life expectancy that is spent in good health, to have accessible education and to have access to means that have potential of forming a good standard of living, while making these opportunities sustainable in order that they could be beneficial to future generations [15].
Inequalities (key messages) in human development in the 21st century to be overcome [16]:
  • KM 1: disparities in human development remain widespread, despite achievements in reducing extreme deprivations;
  • KM 2: a new generation of inequalities is emerging, with divergence in enhanced capabilities, despite convergence in basic capabilities;
  • KM 3: inequalities accumulate through life, often reflecting deep power imbalances;
  • KM 4: assessing and responding to inequalities in human development demands a revolution in metrics;
  • KM 5: we can redress inequalities if we act now, before imbalances in economic power are politically entrenched.

2.4. The Human Development Index (HDI)

Searching the Web of Science, namely for the topic “Human Development Index” (on October 2020), returns a total of over 65,000 publications. The number of citations has been consistently growing in geometric progression since the year 1995. This bibliographic analysis highlights the relevance and importance of the topic.
Definition
The Human Development Index (HDI) serves as the frame of reference to measure the progress of human development and is the best-known measure that aims to expand the in many ways short-sighted focus on per capita income. No measure of the levels of development of countries is perfect, and HDI is no exception. Subsequently, efforts have lately been taken to amend, expand, or supplement the HDI as an index of development, opening new ways for inspecting the phenomenon.
Calculation
The HDI serves as a measure for economic development in addition to that of a society. It is a summarizing index for grasping long-term progress in a country’s average level of human development, taking into account three basic dimensions: longevity, access to knowledge and a decent standard of living.
In 2010, the aggregation formula in the HDI was changed to a geometric mean [17,18].
HDI = health   LE x × education   EDU x × income   GNI x 3
LE x = LE 20 85 20
EDU x = MYSI + EYSI 2
GNI x = ln GNI PC ln 100 ln 75,000 ln 100
where LE is life expectancy, MYSI is Mean Years of Schooling Index, EYSI is the Expected Years of Schooling Index, and GNIPC is the gross national income per capita. Table 1 further depicts the aspects of the calculation.
The authors of [20] searched for a theoretical base for employing the geometric mean HDI formula. Firstly, they found a maximal class of index functions, which they labeled quasi-geometric means, that satisfied symmetry for the characteristics, normalization, and separability. Secondly, they proved that power means were the only quasi-geometric means which satisfied homogeneity. Finally, the new HDI was constructed as the only power mean which satisfied minimal lower boundedness, in accord with a local complementability axiom proposed by [21].
Pros, Limitations and Criticism
Composite indices are widely used in the assessment of development. These measures are mathematical combinations of indicators that share the most important advantage of summarizing an extensive volume of information on the different dimensions that characterize a given complex phenomenon [22]. A wide range of composite indicators of development are currently available in the literature, and the HDI is the most popular one.
Based on a terminology that categorizes development according to twelve different dimensions, [23] evaluated composite indices utilized to measure development, highlighting that many authors have claimed that these indices represent no real contribution to the literature on the research of indicators, or the strength of the systematic positive association between income and the HDI. Nevertheless, the author further developed the main pros and cons of using composite indices, and that the multidimensionality of composite indices is, in fact, the cornerstone of their advantages. On the other hand, [24] questioned the multidimensionality of composite measures of development, because their evaluation of the breadth of dimensions covered in a sample containing 54 indices revealed the limited number of the dimensions of development embedded in most of the indices and, thus, the partial vision of the phenomenon they presented as a result.
Based on the data published by the UNDP for 2017, it was shown that the Human Development Index was built incorrectly by putting equal weights on all of its components. The author of [25] concluded that the HDI is both flawed in its composition and, similar to several of its predecessors, fails to provide insights into intercountry development level comparisons and pre-existing indicators, including GNP per capita. Despite being a subject of criticism concerning its efficiency as a development indicator, the HDI is used at large as a tool for monitoring both social and economic development [26].
The author of [27] provided a positive assessment of the HDI, depicting it as a good starting point for determining the relative level of a country’s development. It is, however, a synthetic measure and hence includes limitations in terms of grasping the extent to which the inhabitants of a country participate in the process of achieving progress, while the shortcomings of this indicator also lay within being unable to show prospects for future development. The author of [28] concluded that the HDI needs to be supplemented by other measures aimed at assessing economic and social cohesion, sound strategies for development, and growth models that take sustainability into account.
Examples of Findings Regarding Human Development (ICT, competitiveness, corporate management, subnational level, income inequality, municipalities, populism, geoprocessing, and spina bifida)
Fresh contributions to explore the assumptions concerning human development affiliated with a given explanatory variable are the following: [29] focused on information and communication technology (ICT), finding that better human development is regarded as a central phenomenon for mobile phone usage, however, it appears to be otherwise regarding internet usage. In the same vein, the empirical results of [30] revealed that ICT promotes human development in Pakistan, even though bidirectional causality is also detected. The authors of [31] addressed the relations within the assessment of global competitiveness, environment for conducting business, along with human development in the (twenty-eight) EU countries for the period of 2006–2017. The panel analysis results suggested the impact of the environment for business and human capital as factors driving competitive advantage—enhancing global competitiveness. Sustainable development and the HDI have become important issues of debate in many countries, but so far there is a lack of literature concerning the symmetrical relationship between the HDI-related issues and corporate management. The author of [32] outlined a transparent, easy-to-communicate addition to the already existing, often branched, and data-demanding corporate CSR management and reporting instruments, by looking at a macro level index: the HDI. The author derived the CHDI (Corporate HDI) by mirroring the specifications of UNDP’s HDI to the company level. For management purposes, the CHDI points at the levels of social and human capital of a company by unmasking the main factors causing their slow decrease.
The availability of high-resolution global spatial data which could be utilized for research is increasing. Main economic and human development indicators are, however, still mostly measured at the national level only, and are also being downscaled by researchers for gridded spatial analyses. Instead, it would be favorable to gather data for subnational economic units where available, enhanced by national data where needed [33]. The authors of [34] estimated the relationship between income distribution and the HDI and its components, detecting a negative long-run association (with human development) and short-run associations (a positive relation for the level of economic development, and a negative relation for educational effects). Finally, the study of [35] showed that municipalities, or a set of municipalities grouped with sub-regions and metropolitan regions, presented socioeconomic disparities and inequalities directly related to human development and economic growth. The research considered the regional development of the Metropolitan Region of the Paraíba Valley and Litoral Norte (RMVPLN) of the State of São Paulo. The authors of [36] presented a case study of a similar phenomenon looking at fourteen of the lowest HDI scoring municipalities within the State of Michoacán (Mexico).
The authors of [37] introduced a model for identifying the circumstances driving the growth of populism politics in European democracies by looking at the links between the HDI and the Corruption Perception Index (CPI). The findings of the study provided fresh comprehension of this phenomenon, which has the potential of helping to identify the soft spots in European democracies that populist parties aim to exploit.
The authors of [38] summarized scores of the HDI classification encompassing six World Health Organization (WHO) regions. Most countries in the South-East Asia (SEARO) region are reported to have high availability of research published on folate status amongst women of reproductive age. Additionally, most countries found in the European region received a good evaluation for surveying the prevalence of spina bifida among newborns. Overall, 90% of countries did not publish research on mortality caused by spina bifida. This work is an illustration on studies connecting the HDI with human health issues.
As an example of the environmentalist approach, [39] explored the consequences of shifting the climate policy narrative for evaluation. The authors turned away from the traditional costs/benefits or economic growth, to a message calling for social welfare improvement. Their paper considered the HDI as a possible criterion for the evaluation of what effects climate policies could have on welfare.
Modification, Optimization of the HDI and Innovative Approaches
In the light of the above-mentioned findings, there surely is room for additional extension of this subject. Indeed, especially after the Commission on the Measurement of Economic Performance and Social Progress, also known as the Stiglitz-Sen-Fitoussi Commission [40], called for action in its report, many new indices have been swiftly added in an effort to quantify these phenomena with heightened emphasis. Good examples are the Better Life Index (BLI) published by the Organization for Economic Cooperation and Development [41], first published in 2011; the World Happiness Score (WHS) of the United Nations Sustainable Development Solutions Network [42], whose first report was released in 2012; and the Social Progress Index (SPI), launched in 2013 by the Social Progress Imperative [43].
The author of [17] proposed a modified HDI by presenting a reflection on what makes human development, with the pillars which support it. This research suggested two new dimensions (employment and political freedoms) for addition into the HDI in order for the index to be able to grasp developmental progress better.
The authors of [36] considered environmental, economic and social sustainability criteria alongside the water–food–energy nexus to form a new approach to increase the HDI in peripatetic communities.
Different viewpoints are provided by distinct indices. The Human Life Index (HLI) does not include an economic measure explicitly, and is simpler than the HDI, which does not make it prone to suggesting argumentative trade-offs between the factors that make up human development. The correlation between those indices (HLI and HDI) is quite high (0.93) [44].
The authors of [45] examined and evaluated the dynamics of the sustainability of the Beijing–Tianjin–Hebei (BTH) urban agglomeration, over the timeframe 2000 to 2015, using the Human Sustainable Development Index (HSDI), and debated the main factors driving the changes in the sustainability of the region (economic versus environmental). Finally, [46] proposed a new indicator called the Sustainable Total Factor Productivity that simultaneously includes two comprehensive indicators and an ecological footprint, which reflects human an ecological consumption; and the Human Development Index, which measures human well-being levels.
Additional recent proposals are specifically oriented to the problem of the equal weighting method chosen to compute the HDI. The author of [47] presented a variant human development index (H) that utilized identical dimensions and country data as the HDI, but had no arbitrary attributes. Instead, all H parameters resulted from the data on the following assumption: humans consider health and income as benchmark factors for making choices on the volumes of work and education. Index H also enabled comparison of a country’s progress in time, using the state of the world in 2000 as the unit for measuring development. The author of [48] used the weights proposed by the sensitivity analysis as a tool to optimize HDI leading to a better differentiation of countries due to their socio-economic development. The authors of [49] formulated the HDI combining its core dimensions linearly, determining the weights by using a dynamic factor analysis algorithm. Results showed that adding a dynamic component to the HDI served better for discovering tipping points in the course of human development.

2.5. The World Happiness Score (WHS) in Regions and States

The World Happiness Report surveys the condition of global happiness and ranks 149 countries in an order of perceived happiness reported by their citizens. In the survey, the respondents were asked to rate their happiness on a scale from 0 to 10. The Happiness Index is calculated by averaging the survey results of the respondents [50].
The WHS is calculated by simply adding up seven sub-indicators. Such an aggregation may give a false impression as it is subject to possible compensation effects, possibly hiding important information. For the purpose of this index, data is analyzed using posetic-based analysis allowing an evaluation which excludes assumptions or aggregations leading to a varied ranking of happiness. The relative significance of the sub-indicators is revealed. The most important component of the seven emerges to be the ‘Dystopia’ measure, which shows the countries own perception of being better or worse off than the speculative country Dystopia. Moreover, it has been proven that, e.g., the GDP per capita in terms of purchasing power parity takes only a menial role. The author of [51] further clarified the so-called ‘peculiar’ countries: nations that are labelled this way for having one or more sub-indicators either extremely high or low when matched to the common tendency of this indicator(s).
The following table characterizes the world situation regarding the WHS and globe latitude, which is analyzed further in the paper.
Table 2 is a comparison of the world happiness score of 149 world countries in 2020, according to the SDSN methodology. The table contains two basic selected categories: 15 happiest countries and 15 unhappiest countries form the WHS point of view, including the latitude of their capital cities. The table is used as a dataset for Figure 1 below.

2.6. Using the Human Development Index and the World Happiness Score as a Measure of Life Quality

Use of the indices chosen for the current research was derived from the notion that they have established themselves as standard measures of the quality of life and life standards in literature. The author of [52] choose the HDI as a measure for monitoring quality of life improvements, in similarity to [53] when inspecting standards of living development. The WHS was used in the analysis of [54] when looking for links between quality of life and happiness.
The authors of [55] concluded by including the WHS and HDI, among other measures, as suitable indices to be regarded as theoretical definitions of the quality of life and well-being, while [56] also worked with the HDI, noting that this measure does not capture emotional well-being.

2.7. Interconnectedness between the Determinants of Quality of Life Reported by the HDI and WHS, Individual Happiness, Long-Term Thinking and Public Policy

There are visible links between the rate of farsightedness of our minds and some of the indices which make up the HDI and WHS. Our ability to think in longer terms can be captured by our ability to perceive the long-term benefits of our actions today. Literature on this topic is divided between works measuring patience and papers working with the inverse of it, capturing the time preference rate. Associating higher levels of patience with higher growth rates, and larger capital stock due to increased savings and better investments in R&D and innovations, has been a staple in economic literature [57]. Other authors have elaborated on the issue by measuring patience [58] and inspecting its geographical distribution, where [59] discovered that higher levels of patience (lowered time preference) are embedded within the Germanic, Nordic, Anglo/American, Middle Eastern and Asian nations, whereas the opposite can be stated about the East Europe, Latin America and Latin Europe, with African respondents reporting the lowest levels of patience in their study. The work of [60] pointed towards a strong positive relationship between patience and income per worker while also influencing total factor productivity and capital stock in the same way. Moreover, [61] described a link between positive affect, i.e., experiencing happiness, and a lowered time preference.
Long-term thinking, the ability to make plans and contemplate strategy, is a must when putting sound public policy in place. Practicing higher patience can make a country more prone to putting such policies in place, and the modern welfare states are the pinnacle of such efforts, while social safety nets fall among their main tools. The work of [62] concluded that full employment, in addition to safety net policies, the components of a welfare state agenda, do increase happiness. The papers by [63,64] reached similar conclusions, in addition to other works related to the subjective well-being literature [65].

2.8. How the Contribution Connects with Theory

In accordance with the methodical attitude of the Academy of Management to creating theories, the approach to building a new theory or testing an existing one is possible to perceive in the following manner: theoretical contributors of empirical papers can be classified as reporters, testers, qualifiers, builders, and expanders [66]. The presented paper aims to elaborate the theory by becoming an expander with high theoretical contribution. The valuable theory is characterized by two important factors: originality (revelatory insight) and utility (practical and scientific) [67]. The hereby presented paper addresses both factors, reveals new points of view, opens a discussion and formulates the new theory on the relations of cause and effect [68].

3. Methods and Goals

The main goal of the paper is to discover if the quality of life, measured by the HDI and WHS, correlates with globe latitude. The partial goal is to lead a discussion aimed at uncovering the reason of that phenomenon, and to present different opinions and ideas including policy recommendations.
There are five research questions formulated:
  • What are the possible measurable components of the quality of life?
  • Is the quality of life spread symmetrically and homogenously around the globe?
  • Is the situation as depicted by the WHS in the world and Europe similar?
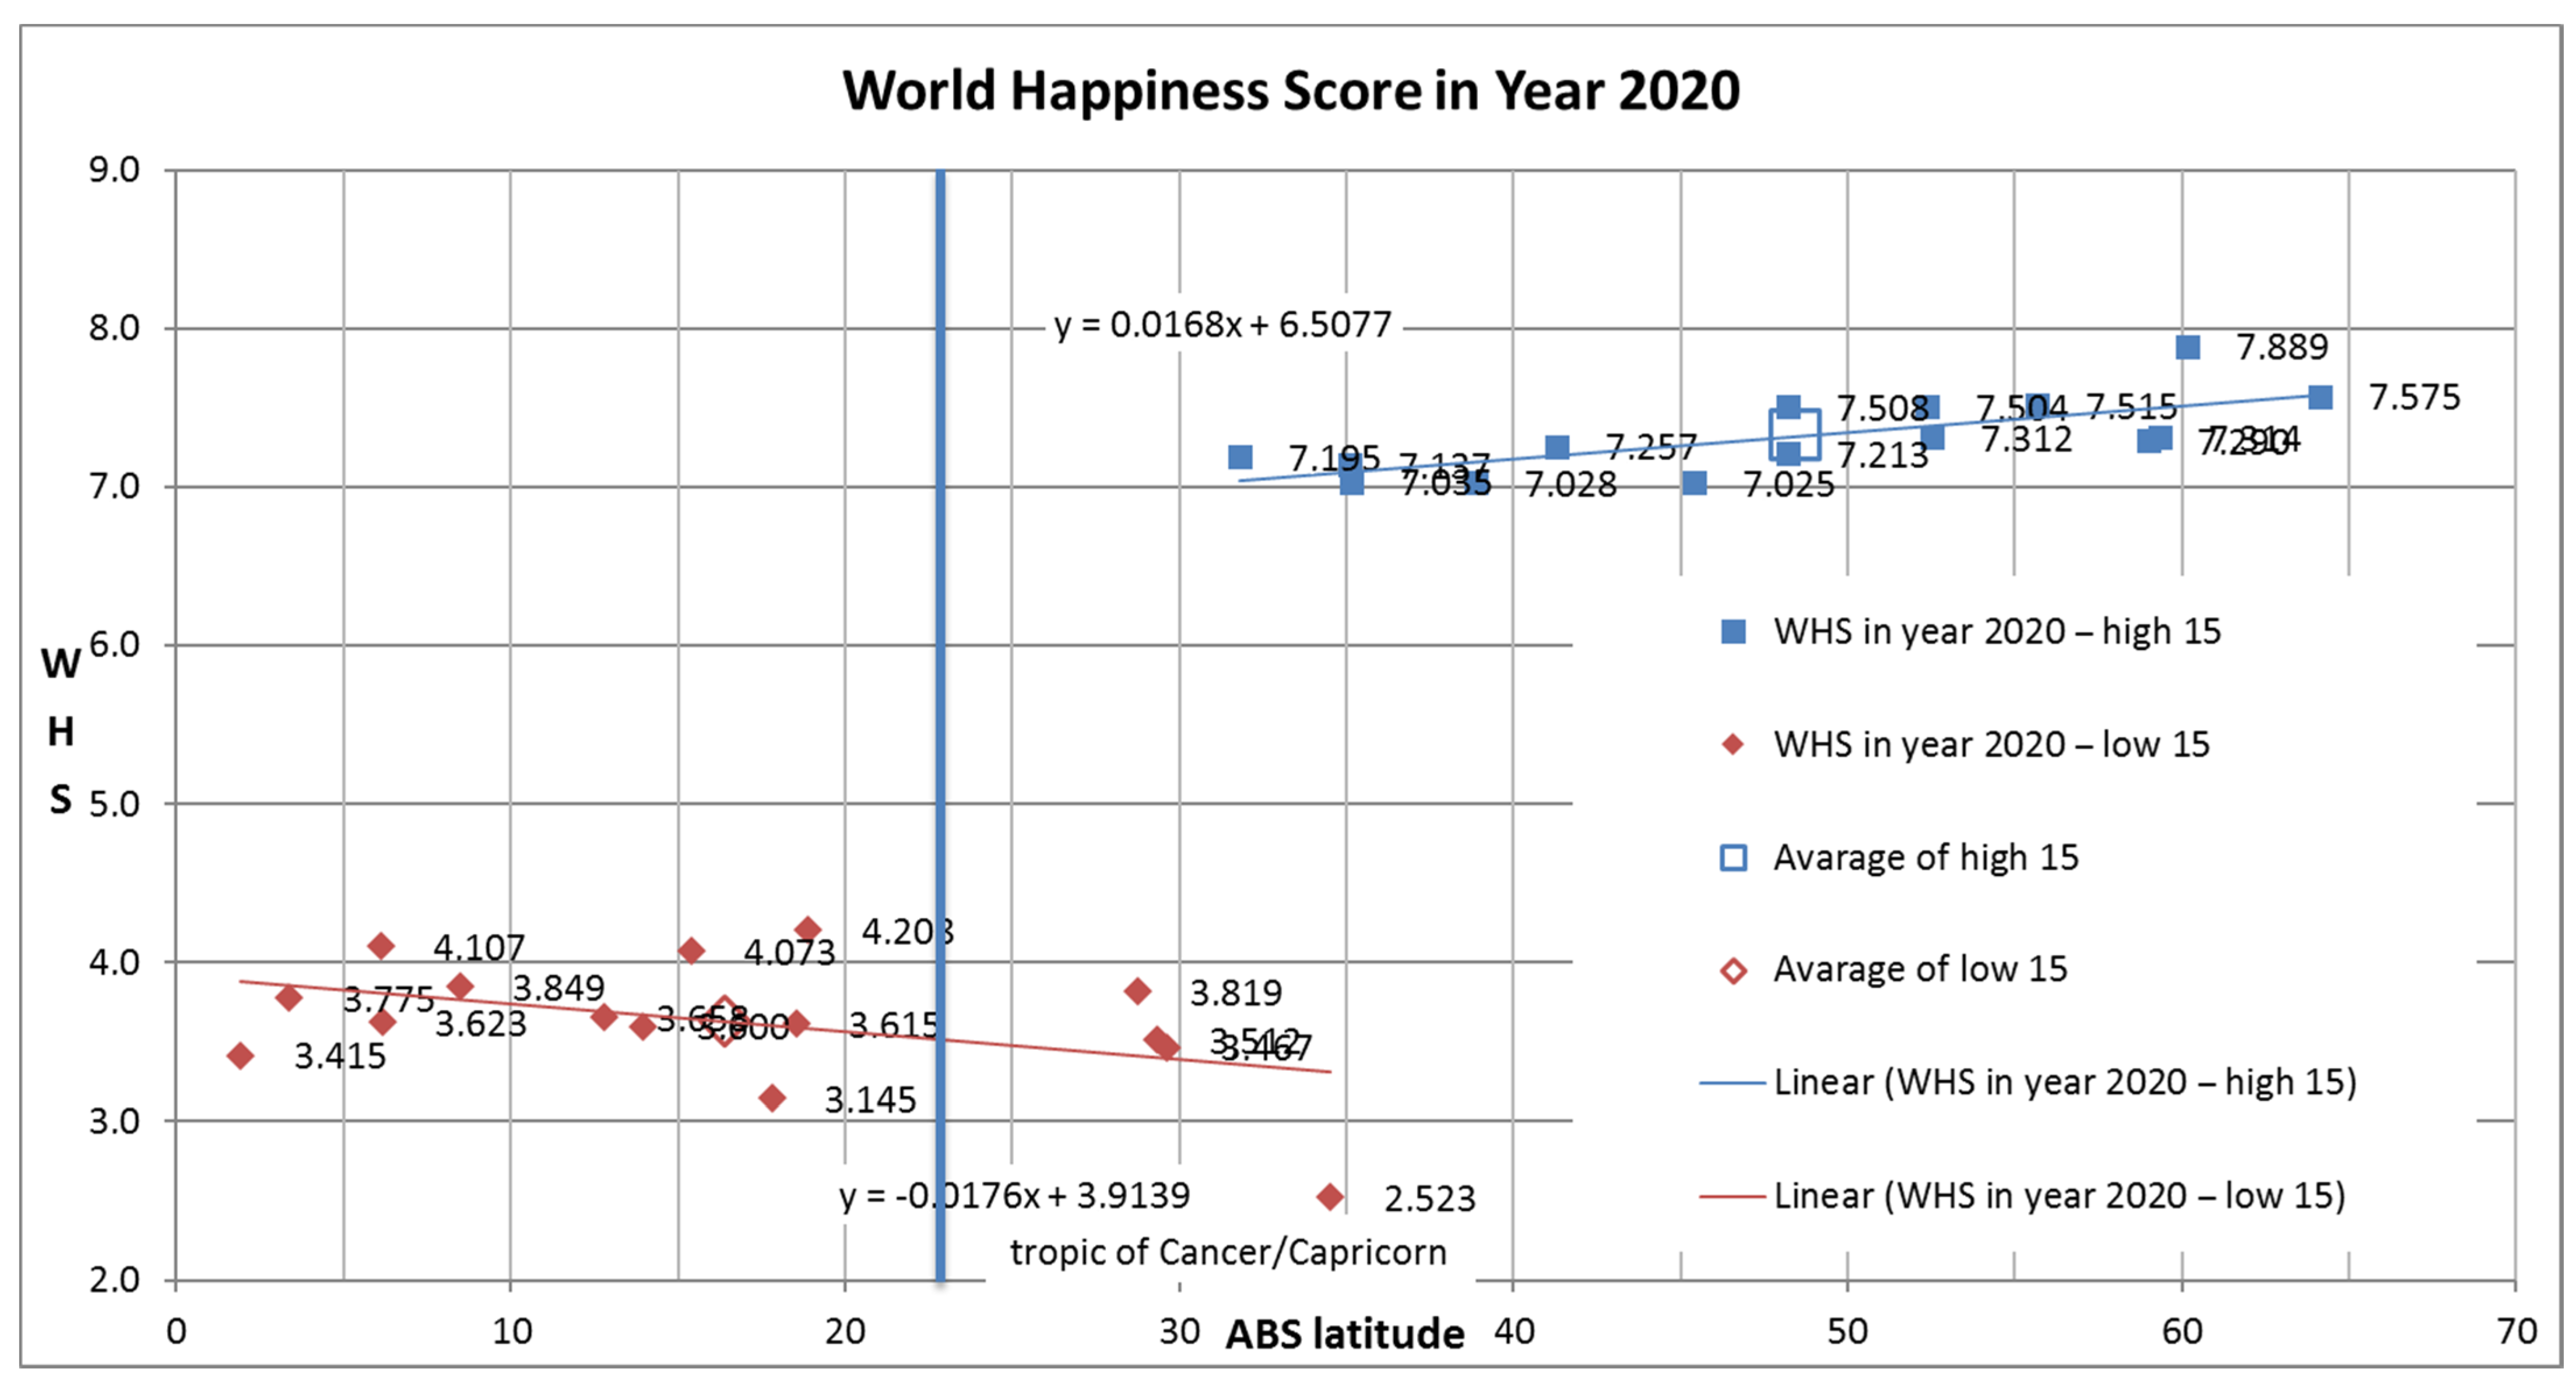
  • What is the trend in the WHS in the top 15 and the bottom 15 countries?
  • What are the causes or precursors of the asymmetry of the quality of life around the globe?
Hypothesis H1 was formulated: the quality of life measured by the HDI and WHS is spread around the globe symmetrically regarding latitude (H0 = non H1).
Follow-up operationalization and quantification of hypothesis was suggested:
CORREL (world HDI × lat.) AND CORREL (world WHS × lat.) < 0.4
The applied research methodology was based on secondary data of the HDI and WHS in the time period 1990 to 2019. Used datasets were obtained from:
  • United Nations Development Programme, Human Development Reports [69]
  • Sustainable Development Solutions Network, World Happiness Report 2021 [50]
  • Countries, Capitals, Latitude and Longitude Table, CSG network [70]
Obtained data were processed by Microsoft Excel 365, and were sorted, filtered, and analyzed.
Several subsequent quantitative analyses and calculations were performed: arithmetic means, standard deviations, linear regression, and Spearman and Pearson correlation coefficients.
Graphical evaluation using an XY scatter plot was utilized, and linear regression trend lines were drawn. Arithmetic averages and directions of linear trends and their differences were calculated.
Spearman correlation formula was used for correlation calculations. Inbuilt functions CORREL in SPSS and MS Excel were utilized. The calculations are significant on the level alpha = 0.05.
r s = ρ r g X , r g Y = cov r g X , r g Y σ r g X σ r g Y
where rs is the Spearman correlation coefficient; rgX and rgY are the rank variables Xi, Yi; ρ denotes the usual Pearson correlation coefficient but applied to the rank variables; cov (rgX, rgY) is the covariance of the rank variables; and σrgX, σrgY are the standard deviations of the rank variables.
The correlation coefficient values of interpretation [71] are as follows: rs = 0.00–0.19 “very weak”, rs = 0.20–0.39 “weak”, rs = 0.40–0.59 “moderate”, rs = 0.60–0.79 “strong”, and rs = 0.80–1.0 “very strong”.

4. Results

The research results chapter is divided into three parts. The first part contains results concerning geographic location vs. the WHS on the selected sample of 30 countries worldwide and solely in Europe. The results are based on the analyses of two groups of the top and bottom rated countries, usually 15 (or 10 of them for calculation of a trend). If a different (higher) number of countries occurs in the group than stated, it means that several countries with the same score occupied one specific place in the rating. The second part shows linear regression of the HDI and WHS regarding latitude of bulk sample data (141 countries). The third part contains the descriptive statistics and the correlation analysis of the HDI and WHS regarding latitude, followed by a discussion of the research findings in chapter 5. This chapter aims to present the most important findings of the research that was conducted. It answers the research questions and evaluates the hypothesis.

4.1. World Happiness of World Countries and Their Geographical Location—Selection of Top and Bottom Countries

This subchapter focuses on showing the relationship between the WHS and the globe latitude of world countries. Figure 1 shows WHS in the year 2020 in two opposite groups of countries. The blue squares represent 15 countries with the highest WHS, and the red diamonds represent 15 countries with the lowest WHS. The bigger marks in Figure 1 represent the arithmetic averages of the particular group of high or low score countries. The X axis is an absolute value of the Earth latitude. The blue vertical line is the Tropic of Cancer, and respectively, Capricorn. For the purposes of analyses, we neglected the position of the Earth’s hemisphere with consideration that most of the selected countries lie in the northern hemisphere. Linear trendlines including equations are presented. The data from Table 2 are used for the analysis and comparison.
The top 15 WHS score countries are (highest to lowest): Finland (7.889), Iceland (7.575), Denmark (7.515), Switzerland (7.508), Netherlands (7.504), Sweden (7.314), Germany (7.312), Norway (7.290), New Zealand (7.257), Austria (7.213), Israel (7.195), Australia (7.137), Ireland (7.035), United States (7.025) and Canada (7.025). Only two of these countries lie in the southern hemisphere. Ten of these countries lie in Europe.
The lowest 15 WHS score countries are (lowest to highest): Afghanistan (2.523), Zimbabwe (3.145), Rwanda (3.415), Botswana (3.467), Lesotho (3.512), Malawi (3.600), Haiti (3.615), Tanzania (3.623), Yemen (3.658), Burundi (3.775), India (3.819), Sierra Leone (3.849), Zambia (4.073), Togo (4.107) and Madagascar (4.208). Nine of these countries lie in the southern hemisphere. Eleven of these countries are located in continental Africa.
The direction of the linear trendline of the top 15 WHS countries is 0.0168 and for the lowest 15 WHS countries it is −0.0176, representing a very slow growth with latitude within the top 15, and a slight decrease with increasing latitude for the bottom 15 performing countries. The arithmetic average value of the highest 15 WHS countries is 7.320 and the average of the lowest 15 WHS countries is 3.626, showing a very significant difference of 3.694. We can say that the WHS value of the most developed countries is double (2.019×) that of the least developed countries.
From the geographic point of view, we can clearly notice that all countries with the highest WHS are located at a higher latitude than the Tropic—in a moderate or a colder climate. In the case of countries with the lowest WHS, the situation is completely different, with 74% of the concerned countries located in a warmer or hot climate at a lower latitude than the Tropic.
When we compare the top 15 HDI and WHS countries, we can distinguish the following 12 common countries: Norway, Ireland, Switzerland, Iceland, Germany, Sweden, Australia, Netherlands, Denmark, Finland, Belgium and New Zealand, so these are the world’s most human developed and happiest countries as measured by indicators on which this research is based. The following countries are included in both the lowest 15 HDI and WHS groups: Burundi, Sierra Leone and Yemen, so these are the world’s least human developed and unhappiest countries. It is interesting that the overlap within the top 15 HDI and WHS countries is much larger than that of the lowest 15 HDI and WHS countries.
There are many similarities and differences in the comparison of the HDI and WHS regarding longitude, which will be further discussed later in this paper.
Figure 2 shows the WHS in the year 2020 in Europe in two opposite groups of countries. The blue squares represent 15 European countries with the highest WHS, and the red diamonds represent 15 European countries with the lowest WHS. The bigger marks in Figure 2 represent the arithmetic averages of the group of the highest or the lowest scoring countries. The X axis is an absolute value of the Earth latitude. It is obvious that all European countries are located in the northern hemisphere. Linear trendlines including corresponding equations are presented.
The top 15 WHS scoring countries are (highest to lowest): Finland (7.889), Iceland (7.575), Denmark (7.515), Switzerland (7.508), Netherlands (7.504), Sweden (7.314), Germany (7.312), Norway (7.290), Austria (7.213), Ireland (7.035), Czech Republic (6.897), Belgium (6.839), United Kingdom (6.798), France (6.714) and Slovakia (6.519). Eleven of these countries (except Norway, Iceland, Switzerland, and United Kingdom) are members of the EU.
The bottom 15 WHS score countries are (lowest to highest): Ukraine (5,270), Albania (5,365), Russian Federation (5.495), Bosnia and Herzegovina (5.516), Belarus (5.534), Bulgaria (5.598), Montenegro (5.722), Portugal (5.768), Greece (5.788), Moldova (5.812), Hungary (6.038), Serbia (6.042), Poland (6.139), Malta (6.157) and Latvia (6.229). Only seven of these countries (Bulgaria, Greece, Poland, Malta, Latvia, Portugal, and Hungary) are members of the EU.
The direction of the linear trendline of the highest 15 WHS European countries is 0.0471, and for the lowest 15 HDI European countries, it is close to 0, which represents moderate growth for the top 15 and a stagnant state of affairs for the lowest 15 countries with increasing latitude. The arithmetic average value of the highest 15 WHS European countries is 7.195, and the average of the lowest 15 WHS European countries is 5.765, which represents a difference of 1.430. We can say that the average WHS value of the most developed European countries is 1.25 times higher than that of the least developed European countries. The average WHS of the lowest 15 European countries is still 1.59 times higher than the lowest 15 WHS world countries.
From the geographic point of view, we can observe that the top 15 WHS European countries lie between 48° and 65° of the northern latitude, and the bottom 15 WHS European countries lie between 35° and 57° of the northern latitude, so the difference in climatic location regarding WHS is also partially apparent.
When we compare the top 15 HDI and WHS European countries, we can distinguish the following common countries: Norway, Ireland, Switzerland, Iceland, Germany, Sweden, Australia, Netherlands, Denmark, Finland, United Kingdom and Belgium; therefore, these are the most human developed and happiest European countries as measured by these two indices. The following countries are included in both the lowest 15 HDI and WHS European groups: Moldova, Ukraine, Bosnia and Herzegovina, Albania, Serbia, Bulgaria, Russian Federation, Montenegro, Hungary and Portugal; therefore, these are the least human developed and unhappiest European countries according to these indices. The number of the top 15 HDI and WHS mutual European countries is similar to the number of the lowest 15 HDI and WHS mutual European countries (12:11).

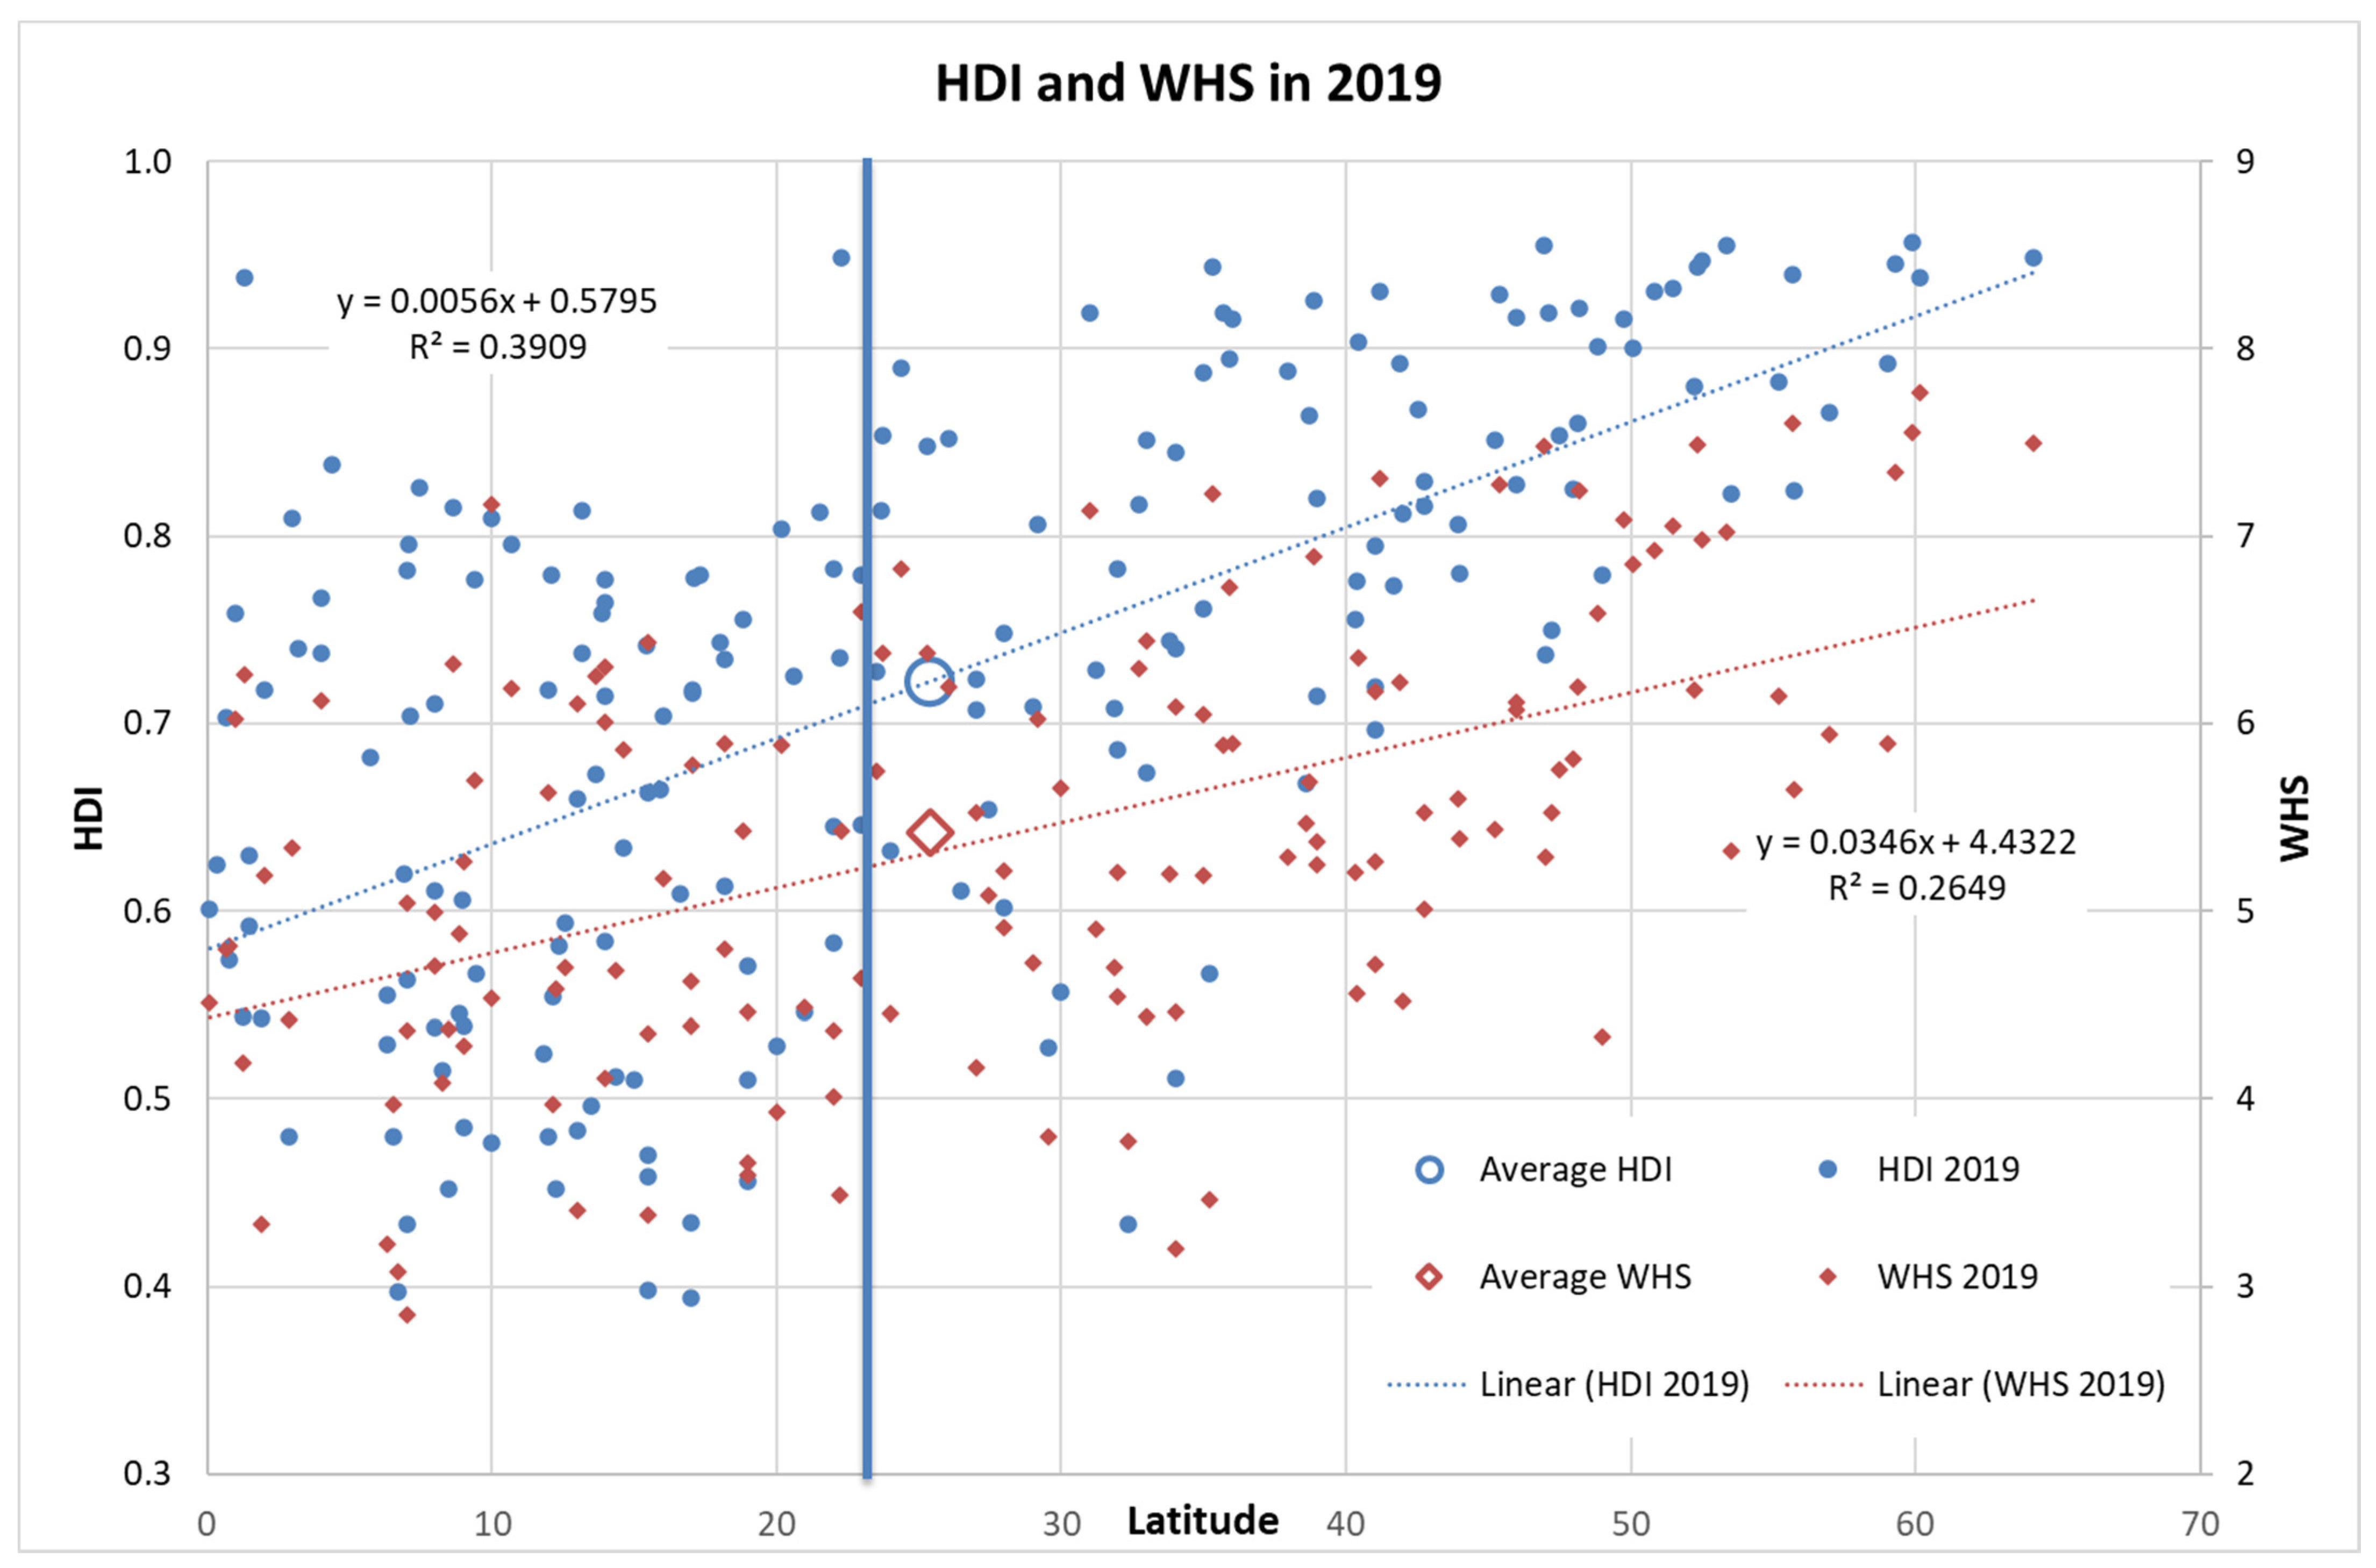
4.2. Human Development, Human Satisfaction of World Countries and Their Geographical Location—Bulk Sample

This subchapter focuses on the HDI and WHS regarding geographical latitude illustrated on the bulk sample of 141 countries. Although HDI was available for 189 countries and WHS for 148 countries in 2019 (the most recent year for which both datasets are completely published, as of late 2021), only 141 countries make mutual intersection regarding all years studied.
Figure 3 shows the HDI and WHS in the year 2019 for 141 world countries. The blue points represent the HDI values and the red diamonds represent the WHS values. The larger marks in Figure 3 represent the arithmetic averages of the particular group of scores (HDI or WHS). The X axis is an absolute value of the earth’s latitude. The Y1 axis (blue) is the value of the HDI and the Y2 axis is the value of the WHS. The blue vertical line marks the Tropics. For the purpose of analyses, we neglected the position of the earth’s hemisphere with the consideration that most of selected countries lie in the northern hemisphere.
Linear trendlines including corresponding equations are calculated and presented. The direction of the linear trendline of the HDI is 0.0056, and 0.0346 for the WHS, and they represent growth for the HDI and a moderate growth for the WHS with increasing latitude. The arithmetic average of the world HDI is 0.722 with its median standing at 0.740. The average of the world WHS is 5.416 with a median value of 5.406. We can say that more than half of the highest scoring countries achieve higher levels of HDI and WHS than the average.

4.3. Descriptive Statistics and Correlation Analysis

This subchapter presents the basic descriptive statistics and the correlation analyses of the HDI and WHS regarding latitude. The correlations were calculated for a bulk sample (141 countries) and for selections of top and bottom countries of the world and Europe.
Table 3 shows the number of elements in the correlation analysis (N). The average means support the trend of slow increase in the HDI and WHS in time. Standard deviations illustrate a very mild decrease in the spread of the HDI and WHS.
Table 4 shows Spearman correlation coefficients of the HDI and WHS within world countries in years 2015 to 2019 vs. globe latitude. All correlations are positive. An interesting finding is that in the global scope, the HDI correlates strongly with latitude in all observed cases (rs = 0.60–0.79). The WHS in the global scope correlates moderately with latitude in all observed cases (rs = 0.40–0.59). The mutual correlations are very strong among HDI and WHS values (rs = 0.80–1.0) with the highest value 0.828 between HDI 2016 and WHS 2017. The significance of the calculated correlation is on a level where α = 0.01.
The further correlations presented in Table 5 were calculated for selected top 15 and bottom 15 countries of the world and Europe. A very interesting finding is that the HDI and WHS in the global scope correlate in all observed cases very strongly (rs = 0.80–1.0) with latitude. Another interesting finding is that the correlation of world and European HDI to latitude with years (1990 to 2015; 2018 and 2019) increases. In the European scope, the HDI correlates weakly to latitude in the year 1990 (rs = 0.20–0.39) and moderately (rs = 0.40–0.59) in the years 2015 to 2019. The WHS correlates strongly to latitude in the years 2015 to 2019 (rs = 0.60–0.79) in the European setting. All correlations are positive. The significance of the calculated correlation is such that α = 0.05.
Further correlations were calculated in SPSS for selected groups of top 10, 15 and 20, and bottom 10, 15, and 20 countries of the world and Europe. These data merely confirm presented findings.
The following calculations were performed in order to resolve the research question represented by the hypothesis H1.
Bulk sample:
CORREL (world HDI × lat.)2015, 2016, 2017, 2018, 2019 AND CORREL (world WHS × lat.) 2015, 016, 2017, 2018, 2019 < 0.4?
(0.652 AND 0.655 AND 0.660 AND 0.661 AND 0.673) AND (0.427 AND 0.446 AND 0.465 AND 0.463 AND 0.478) > 0.4
Selection of the top and bottom countries:
CORREL (world HDI × lat.)1990, 2015, 2018, 2019 AND CORREL (world WHS × lat.)2015, 2018, 2019 < 0.4?
(0.820 AND 0.855 AND 0.857 AND 0.858) AND (0.808 AND 0.844 AND 0.835) > 0.4
On the basis of the above-mentioned findings and calculations, we can declare the hypothesis H1 as rejected. “The quality of life measured by the HDI and the WHS is spread around the globe asymmetrically regarding latitude”.

5. Discussion

The main goal of the paper was to discover if the quality of life, as measured by the HDI and WHS, is correlated with globe latitude. We can generally state that it is (and formulate the theory). The HDI and WHS are strongly correlated with globe latitude not only in the bulk sample of 141 world countries, but also when we take into account two world and European groups of the top 15 countries rated by their WHS value.
The partial goal was to discuss the reason for that phenomenon and to present different opinions and ideas and offer some policy recommendations. We may speculate what the cause for higher human development and happiness in northern countries is, especially from 35° to 65° northern latitude. The question is complex and intriguing since—paradoxically—in the south, the climatic and agricultural conditions for life survival are more favorable.
When answering the research questions, we take them chronologically:
1. What are the possible measurable components of the quality of life? There are many different approaches to measuring the quality of life which are described in the theoretical part of the paper. Our research takes into account two basic metrics (indicators): The Human Development Index (HDI) and the World Happiness Score (WHS). Other widely applied indices include, e.g., Variant HDI, Composite HDI, Corporate HDI, Human Life Index (HLI), Better Life Index (BLI), Social Progress Index (SPI), Human Sustainable Development Index (HSDI), Sustainable Total Factor Productivity (HTFP), and many others.
2. Is the quality of life spread symmetrically and homogenously around the globe? No, the quality of life is spread heterogeneously around the globe regarding latitude. Generally, we can say that strong correlation shows that the quality of life in northern countries (above the Tropic) is higher than in southern countries (near the Equator). The location of birthplace affects not only the future earnings and probability of living to an old age, but also the chance of having access to adequate nutrition, housing, education, health care, paid employment, clean water, etc. [9]. Milton Friedman is the fundamental opponent of foreign aid to less developed countries, and he argues that “this aid will not get mainly into the hands of those who would be able to use it effectively and it only weakens the motivations of governments and even people to help themselves” [72] (p. 434).
3. Is the situation as depicted by the WHS in the world and Europe similar? Yes, the European region also shows (moderate) evidence of similar spread of the quality of life on the basis of our selected indicators, although not as strong as in the world.
4. What is the trend in the WHS in the top 15 and bottom 15 countries? The WHS tends to grow in top countries with increasing latitude. The bottom countries do not contribute to this trend, however, in the last ten years, their growth is rather digressive. The south–north division in WHS concerning the sample countries is a finding which underscores the case proposed when answering the research question #2. Some scientists and environmentalists confirm our finding, and report problems caused by the uncontrolled use of natural resources, threat to the environment, and growth of disparities in the quality of life of people in developed and developing countries [73]. Uncontrollable consumption leads to the necessity of more resources and hence environmental degradation by over-exploiting renewable and non-renewable natural resources. It contributes to the waste of goods and human labor, and it also causes the emergence of significant economic disproportions between people [74]. The authors of [34] merged two branches of research in scientific works on development economics: the examination of the effect and conveyance channels of inequality on economic development, and the dialogue on the need for a more ample developmental measure. Additionally, the study uncovered that those links can be even more prevalent in countries having lower levels of development, appeasing what appeared to be contradictory research findings.
5. What are the causes or precursors of the asymmetry in relation to the quality of life around the globe? It is most likely that civilizations arose in hot climate areas (more sunshine, better agricultural conditions). The later expansion to colder areas on Earth brought a vital necessity for strategic planning—arranging a place for living and energy (providing shelter, heat and food storage) to survive the often dreadful winter seasons. This has shifted the perceived time preference for organizing one’s life towards the ability for contemplating the very long-term outcomes of one’s actions. The authors of [75] documented such development through inspecting the effect of the implementation of novel ways of crop cultivation during the Colombian exchange. Year after year, this experience helped in establishing human relations and uplifted cooperation patterns. This has led to an accelerated economic growth crowned by crafting the conditions for its flourishing found in democratic societies (top scoring countries) functioning within market economies. Another reason is that the tendency of public governance to lean toward a situation where human interactions are being moderated by law and human life, is being overarched by the vast infrastructure of the welfare state. Public policy nowadays guides individuals in these societies throughout their whole life. We are born and we die with the contribution of the state. The welfare state can be seen as a grand strategic plan for the life of many overlapping generations, and it has been created by forward-looking, long-term thinking and patient individuals possessing a skillset which can be passed on through education. As documented in the penultimate section of the literature review, public policy has a positive effect on perceived happiness, hence uplifting the quality of life as measured by the WHS. Additionally, populations living further from the equator are reportedly distinguished by having lower time preference rates. This makes them prone to putting sounder public policies in place while enjoying higher levels of income. which in turn enhances their HDI ranking.
The different development may just mean the above-mentioned historical experience of nations living in the temperate climate zone combined with the necessity of strategic planning and effective management of scarce resources. However, the current disparities among regions of the world are not only the result of past development and empiricism. They are also affected by development policies and different interest groups who often strictly enforce their goals. The development policy and aid to less developed countries can include not-so-small hints of moral hazard. Nevertheless, current trends point to moving the problem of differentiation among the states from national to supranational level.
The presented research can contribute to a better understanding of the lack of long-term thinking and conception in countries with lower life quality and point future researchers to take steps leading to progress in this area. The self-evident proposal to improving this area (i.e., quality of life in the global south) includes higher quality and intensity of education in general, especially in the field of strategic, long-term thinking, which would enable the placement of quality of life enhancing public policies.
Currently, it is the education sphere where rapid change can be intensively felt. While the year 2020 served as a catalyst for what has already been a decade in the making—digitalized technology-enabled learning—the current situation on the global education market allows, more than ever, the employment of the concepts of e-learning solutions in an endeavor to transfer ideas/technology for human development from the countries at the top of the ladder and in the north, to those at the bottom of the scale, usually found in the global south. The relation between a better quality of education and increased human capital, positive economic effects and enhanced quality of life is well documented [76,77,78,79], as is, throughout this paper, the effect of a lowered time preference on the ability of individuals to set up institutions that uplift life quality and increase happiness. Should it be the case that future foreign aid is administered through channeling education rather than government funding, the fear of it ending in the wrong hands could easily be dropped.

6. Conclusions

It is obvious that the issue of the uneven development of regions around the world has an enormously important global impact on different serious socio-demographic phenomena. The rapid expansion and economic development of the world economy may be accompanied or even replaced by an accelerated future evolution and socio-economic development in other parts of the world, causing substantial change in the distribution of world power. Knowledge, science, and technologies (ideas) are now the main driving forces.
To sum up, we can conclude that the main goal of the paper—to discover if the quality of life measured by the HDI and WHS correlates to the globe latitude, including hypothesis and five research questions—was fully accomplished. The research goal was fulfilled using the methodology described in Chapter 4, especially by the application of regression and correlation analysis. The authors’ added value lies in the application of standard scientific procedures on publicly accessible data and discovering completely new findings not earlier documented in scientific literature.
The contribution to theory lies in the formulation of, and proving, the new theory claiming that northern countries have generally higher quality of life than southern countries based on the chosen measures of the quality of life. The practical contribution can be found in the transfer, of causes and mechanism, of creating high quality of life from developed countries into less developed ones. However, further research of the causes and effects of the quality of life is needed, while a direction of effort taken towards lowering worldwide QoL imbalances is indicated.

Author Contributions

Conceptualization, A.P., J.K.-P. and R.S.; methodology, A.P.; software, A.P.; validation, A.P. and R.S.; data curation, A.P. and R.S.; writing—original draft preparation, A.P. and J.K.-P.; writing—review and editing, R.S.; visualization, A.P. and R.S.; supervision, A.P.; project administration, A.P. and R.S. All authors have read and agreed to the published version of the manuscript.

Funding

This paper has been prepared with financial aid from the project ROKA, number CZ.02.2.69/0.0/0.0/18_054/ 0014592, implemented by Moravian Business College Olomouc, and with the support of the project Erasmus+ BESPOKE 2021-1-HU01-KA220-HED-000032002.

Institutional Review Board Statement

Not applicable.

Informed Consent Statement

Not applicable.

Data Availability Statement

Not applicable.

Acknowledgments

Language corrections were made by Kateřina Důbravová and Siran Agadzhanyan. Richard Smilnak participated as part of a research effort to pursue doctoral studies at the Faculty of Economics, Prague University of Economics and Business.

Conflicts of Interest

The authors declare no conflict of interest.

References

  1. Kunešová, H.; Cihelková, E.; Kocourek, A.; Bednářová, A.; Nový, M. Světová Ekonomika: Nové Jevy a Perspektivy; C.H. Beck, s.r.o.: Prague, Czech Republic, 2006; p. 320. ISBN 80-7179-455-4. [Google Scholar]
  2. Baldwin, R. The Causes of Regionalism. In The World Economy; OECD Publishing: Paris, France, 1997. [Google Scholar]
  3. Řehák, V. Nový regionalismus: Proces a teorie. In Mezinárodné Vzťahy; FMV EU. s.: Bratislava, Slovakia, 2009; pp. 7–20. ISSN 1336-1562. Available online: http://fmv.euba.sk/RePEc/brv/journl/MV2009-2.pdf (accessed on 10 July 2021).
  4. Acemoglu, D.; Robinson, J.A. Why Nations Fail: The Origins of Power, Prosperity and Poverty; Crown Publishers: New York, NY, USA, 2012. [Google Scholar]
  5. Barro, R.J.; McCleary, R.M. Religion and Economic Growth; Harvard University: Cambridge, MA, USA, 2003. [Google Scholar]
  6. Angeles, L. Income Inequality and Colonialism; Discussion Paper Series, No. 066; Centre for Growth and Business Cycle Research: Manchester, UK, 2005; p. 32. [Google Scholar]
  7. Bonds, M.H.; Keenan, D.C.; Rohani, P.; Sachs, J.D. Poverty trap formed by the ecology of infectious diseases. Proc. R. Soc. 2021, 277, 1185–1192. [Google Scholar] [CrossRef] [PubMed]
  8. Novotný, J.; Nosek, V. Nomethetic geography revisited: Statistical distributions, basic generative mechanism and inequality measures. Geografie 2009, 114, 282–298. [Google Scholar] [CrossRef]
  9. Daněk, P. Nerovnoměrný Rozvoj Světa: Kolonialismus, Neokolonialismus a Diskurz Rozvoje. In Stát, Prostor, Politika. Vybrané Otázky Politické Geografie; Jehlička, P., Tomeš, J., Daněk, P., Eds.; Přírodovědecká Fakulta UK: Prague, Czech Republic, 2000. [Google Scholar]
  10. Simon, D. Dilemmas of Development and the Environment in a Globalizing World: Theory, Policy and Praxis. Prog. Dev. Stud. 2003, 3, 5–41. [Google Scholar] [CrossRef]
  11. Bonente, B.; Filho, N. Há uma Nova Economia do Desenvolvimento? Rev. Econ. 2008, 34, 77–100. [Google Scholar] [CrossRef] [Green Version]
  12. Amaro, R. Desenvolvimento—Um Conceito Ultrapassado ou em Renovação? Teor. Prát. Prát. Teor. Cad. Estud. Afr. 2003, 4, 37–70. [Google Scholar]
  13. Gaye, A. Contribution to Beyond Gross Domestic Product (GDP), Name of the Indicator/Method: The Human Development Index (HDI); UNDP Human Development Report Office. 2011. Available online: http://hdr.undp.org/en/humandev (accessed on 10 July 2021).
  14. UNDP. Human Development Report 1990; Oxford University Press: New York, NY, USA, 1991. [Google Scholar]
  15. Moreira, S.B.; Crespo, N. Economia do Desenvolvimento—Das Abordagens Tradicionais aos Novos Conceitos de Desenvolvimento. Rev. Econ. 2012, 38, 25–50. [Google Scholar] [CrossRef] [Green Version]
  16. Human Development Report 2019, United Nations Development Programme; One United Nations Plaza: New York, NY, USA, 2019; p. 10017.
  17. Salas-Bourgoin, M.A. A proposal for a modified Human Development Index. Cepal Rev. 2014, 2014, 29–44. [Google Scholar] [CrossRef] [Green Version]
  18. Kovacevic, M. Human Development Index: Concepts and Measurements. In Proceedings of the HDRO, UNDP Project LINK Meeting, Glen Cove, NY, USA, 17–19 June 2019. [Google Scholar]
  19. UNDP. Training Material for Producing National Human Development Reports. Available online: http://hdr.undp.org/sites/default/files/hdi_training.pdf (accessed on 20 July 2021).
  20. Kawada, Y.; Nakamura, Y.; Otani, S. An Axiomatic Foundation of the Multiplicative Human Development Index. Rev. Income Wealth 2019, 65, 771–784. [Google Scholar] [CrossRef]
  21. Herrero, C.; Martínez, R.; Villar, A. Multidimensional Social Evaluation: An Application to the Measurement of Human evelopment. Rev. Income Wealth 2010, 56, 483–497. [Google Scholar] [CrossRef]
  22. Saisana, M.; Tarantola, S. State-of-the-Art Report on Current Methodologies and Practices for Composite Indicator Development; Joint Research Center, European Commission: Bruselles, Belgium, 2002; Available online: https://ec.europa.eu/info/departments/joint-research-centre_en (accessed on 10 July 2021).
  23. Booysen, F. An overview and evaluation of composite indices of development. Soc. Indic. Res. 2002, 59, 115–151. [Google Scholar] [CrossRef]
  24. Moreira, S.B.; Crespo, N. Are Composite Indicators Really Multidimensional Assessment Tools of Development? J. Soc. Econ. Dev. 2013, 15, 113–130. [Google Scholar]
  25. McGillivray, M. The Human Development Index: Yet Another Redundant Composite Development Indicator? World Dev. 1991, 19, 1461–1468. [Google Scholar] [CrossRef]
  26. Sales, J.C.A.; e Silva, D.C.D.C.; Bitar, O.Y.; Lourenço, R.W. Proposal of methodology for spatial analysis applied to human development index in water basins. Geo J. 2019, 84, 813–828. [Google Scholar] [CrossRef] [Green Version]
  27. Bilbao-Ubillos, J. Another Approach to Measuring Human Development: The Composite Dynamic Human Development Index. Soc. Indic. Res. 2013, 111, 473–484. [Google Scholar] [CrossRef]
  28. Bilbao-Ubillos, J. The Limits of Human Development Index: The Complementary Role of Economic and Social Cohesion, Development Strategies and Sustainability. Sustain. Dev. 2013, 21, 400–412. [Google Scholar] [CrossRef]
  29. Zhang, J. The dynamic linkage between information and communication technology, human development index, and economic growth: Evidence from Asian economies. Environ. Sci. Pollut. Res. 2019, 26, 26982–26990. [Google Scholar] [CrossRef]
  30. Khan, N.H.; Yanbing, J.; Hassan, S.T. Investigating the determinants of human development index in Pakistan: An empirical analysis. Environ. Sci. Pollut. Res. 2019, 26, 19294–19304. [Google Scholar] [CrossRef]
  31. Kiseľáková, D.; Šofranková, B.; Gombár, M.; Čabinová, V.; Onuferová, E. Competitiveness and Its Impact on Sustainability, Business Environment, and Human Development of EU (28) Countries in terms of Global Multi-Criteria Indices. Sustainability 2019, 11, 3365. [Google Scholar] [CrossRef]
  32. Spangenberg, J.H. The Corporate Human Development Index CHDI: A tool for corporate social sustainability management and reporting. J. Clean. Prod. 2016, 134, 414–424. [Google Scholar] [CrossRef]
  33. Kummu, M.; Taka, M.; Guillaume, J.H.A. Data Descriptor: Gridded global datasets for Gross Domestic Product and Human Development Index over 1990–2015. Sci. Data 2018, 5, 180004. [Google Scholar] [CrossRef] [Green Version]
  34. Castells-Quintana, D.; Royuela, V.; Thiel, F. Inequality and sustainable development: Insights from an analysis of the human development index. Sustain. Dev. 2019, 27, 448–460. [Google Scholar] [CrossRef]
  35. Pinheiro, W.G.; Vieira, E.T.; Oliveira, E.A.D.A.Q. Relations between the GINI Index with the Human Development Index and the Gross Domestic Product of the RMVPLN Municipalities Under the Regional Development Optics. Humanid. Inov. 2019, 6, 43–66. [Google Scholar]
  36. Martínez-Guido, S.I.; González-Campos, J.B.; Ponce-Ortega, J.M. Strategic planning to improve the Human Development Index in disenfranchised communities through satisfying food, water and energy needs. Food Bioprod. Process. 2019, 117, 14–29. [Google Scholar] [CrossRef]
  37. Sarabia, M.; Crecente, F.; del Val, M.T.; Giménez, M. The Human Development Index (HDI) and the Corruption Perception Index (CPI) 2013-2017: Analysis of social conflict and populism in Europe. Econ. Res. Ekon. Istraž. 2019, 33, 2943–2955. [Google Scholar] [CrossRef]
  38. Kancherla, V.; Weakland, A.P.; Xu, S.Y.; Walani, S.R. Scorecard for spina bifida research, prevention, and policy: Score analysis by Human Development Index and WHO region. Prev. Med. 2019, 123, 1–7. [Google Scholar] [CrossRef]
  39. van den Bergh, J.C.; Botzen, W.W. Global impact of a climate treaty if the Human Development Index replaces GDP as a welfare proxy. Clim. Policy 2018, 18, 76–85. [Google Scholar] [CrossRef] [Green Version]
  40. Stiglitz, J.E.; Sen, A.; Fitoussi, J.P. Report by the Commission on the Measurement of Economic Performance and Social Progress; Academic Press: Cambridge, MA, USA, 2009. [Google Scholar]
  41. OECD (2017) Better Life Index 2017: Definitions and Data. OECD Statistics Online. Available online: https://www.oecd.org/statistics/OECD-Better-Life-Index-2017-definitions.pdf (accessed on 2 November 2021).
  42. Helliwell, J.; Layard, R.; Sachs, J. World Happiness Report 2019; Sustainable Development Solutions Network: New York, NY, USA, 2019. [Google Scholar]
  43. SPI. 2019 Social Progress Index: Executive Summary. Social Progress Imperative (SPI). Available online: https://www.socialprogress.org/static/9d3cd3204599ff2cdf87248edc2b1242/2019-social-progress-index-executive-summary-v2.0.pdf (accessed on 2 November 2021).
  44. Ghislandi, S.; Sanderson, W.C.; Scherbov, S. A Simple Measure of Human Development: The Human Life Indicator. Popul. Dev. Rev. 2019, 45, 219–233. [Google Scholar] [CrossRef]
  45. Chen, S.; Huang, Q.; Liu, Z.; Meng, S.; Yin, D.; Zhu, L.; He, C. Assessing the Regional Sustainability of the Beijing-Tianjin-Hebei Urban Agglomeration from 2000 to 2015 Using the Human Sustainable Development Index. Sustainability 2019, 11, 3160. [Google Scholar] [CrossRef] [Green Version]
  46. Yue, S.; Yongchang, S.; Jianhong, Y. Sustainable total factor productivity growth for 55 states: An application of the new malmquist index considering ecological footprint and human development index. Resour. Conserv. Recycl. 2019, 146, 475–483. [Google Scholar] [CrossRef]
  47. Lind, N. A Development of the Human Development Index. Soc. Indic. Res. 2019, 146, 409–423. [Google Scholar] [CrossRef]
  48. Kuc-Czarnecka, M. Sensitivity analysis as a tool to optimise Human Development Index. Equilibrium. Q. J. Econ. Econ. Policy 2019, 14, 425–440. [Google Scholar] [CrossRef] [Green Version]
  49. Zirogiannis, N.; Krutilla, K.; Tripodis, Y.; Fledderman, K. Human Development over Time: An Empirical Comparison of a Dynamic Index and the Standard HDI. Soc. Indic. Res. 2019, 142, 773–798. [Google Scholar] [CrossRef]
  50. World Happiness Report. 2021. Available online: https://worldhappiness.report/ (accessed on 10 October 2021).
  51. Carlsen, L. Happiness as a sustainability factor. The world happiness index: A posetic-based data analysis. Sustain. Sci. 2018, 13, 549–571. [Google Scholar] [CrossRef]
  52. Kovác, D. Psychologists and the quality of life. Stud. Psychol. 2001, 43, 161–167. [Google Scholar]
  53. Gubarev, M.; Sirotin, V. The level and quality of life in Russia and the United States of America: A comparative analysis. In Proceedings of the 2017 Tenth International Conference Management of Large-Scale System Development (MLSD), Moscow, Russia, 2–4 October 2017; IEEE: Piscataway, NJ, USA, 2017; pp. 1–4. [Google Scholar] [CrossRef]
  54. Pupavac, D.; Delibasic, M.; Pupavac, J.; Streimikis, J. Interdependence of quality of life and happiness of the population in Southeast European Countries. Montenegrin J. Econ. 2020, 16, 7–15. [Google Scholar] [CrossRef]
  55. Michalos, A.; Kahlke, P. Good Societies, Financial Inequality and Secrecy, and a Good Life: From Aristotle to Piketty. Appl. Res. Qual. Life 2019, 15, 1005–1054. [Google Scholar] [CrossRef]
  56. Rahman, T.; Mittelhammer, R.C.; Wandschneider, P.R. Measuring quality of life across countries: A multiple indicators and multiple causes approach. J. Socio-Econ. 2011, 40, 43–52. [Google Scholar] [CrossRef]
  57. Romer, P.M. Endogenous technological change. J. Political Econ. 1990, 98 Pt 2, S71–S102. [Google Scholar] [CrossRef] [Green Version]
  58. Falk, A.; Becker, A.; Dohmen, T.; Enke, B.; Huffman, D.; Sunde, U. Global evidence on economic preferences. Q. J. Econ. 2018, 133, 1645–1692. [Google Scholar] [CrossRef]
  59. Wang, M.; Rieger, M.O.; Hens, T. How time preferences differ: Evidence from 53 countries. J. Econ. Psychol. 2016, 52, 115–135. [Google Scholar] [CrossRef] [Green Version]
  60. Hübner, M.; Vannoorenberghe, G. Patience and long-run growth. Econ. Lett. 2015, 137, 163–167. [Google Scholar] [CrossRef] [Green Version]
  61. Ifcher, J.; Zarghamee, H. Happiness and time preference: The effect of positive affect in a random-assignment experiment. Am. Econ. Rev. 2011, 101, 3109–3129. [Google Scholar] [CrossRef] [Green Version]
  62. Easterlin, R.A. Happiness, growth, and public policy. Econ. Inq. 2013, 51, 1–15. [Google Scholar] [CrossRef] [Green Version]
  63. Di Tella, R.; MacCulloch, R.J.; Oswald, A.J. Preferences over inflation and unemployment: Evidence from surveys of happiness. Am. Econ. Rev. 2001, 91, 335–341. [Google Scholar] [CrossRef]
  64. DiTella, R.; MacCulloch, R.J.; Oswald, A.J. The Macro-Economics of Happiness. Rev. Econ. Stat. 2003, 85, 809–827. [Google Scholar]
  65. Scruggs, L. The Generosity of Social Insurance, 1971–2002. Oxf. Rev. Econ. Policy 2006, 22, 349–364. [Google Scholar] [CrossRef]
  66. Colquitt, J.A.; Zapata-Phelan, C.P. Trends in theory building and theory testing: A five-decade study of the Academy of Management Journal. Acad. Manag. J. 2007, 50, 1281–1303. [Google Scholar] [CrossRef] [Green Version]
  67. Corley, K.G.; Gioia, D.A. Building theory about theory building: What constitutes a theoretical contribution? Acad. Manag. Rev. 2011, 36, 12–32. [Google Scholar] [CrossRef] [Green Version]
  68. Bacharach, S.B. Organizational Theories: Some Criteria for Evaluation. Acad. Manag. Rev. 1989, 14, 496–515. [Google Scholar] [CrossRef]
  69. Human Development Index. United Nations Development Programme: Human Development Reports. 2020. Available online: http://hdr.undp.org/en/content/human-development-index-hdi (accessed on 2 October 2021).
  70. Countries, Capitals, Latitude and Longitude Table. CSG (Computer Support Group). 2021. Available online: http://www.csgnetwork.com/llinfotable.html (accessed on 2 October 2021).
  71. Taylor, R. Interpretation of the correlation coefficient: A basic review. J. Diagn. Med. Sonogr. 1990, 6, 35–39. [Google Scholar] [CrossRef]
  72. Holman, R. Dějiny Ekonomického Myšlení.3; C.H. Beck: Prague, Czech Republic, 2005; ISBN 80-7179-380-9. [Google Scholar]
  73. Rosłon-Żmuda, J. Green Economy. In Encyclopedia of Global Ecological and Energy Management; Rewizorski, M., Bieniek, K., Eds.; Fundacja na Rzecz Czystej Energii: Poznań, Poland, 2018. [Google Scholar]
  74. Wasilik, K. Trendy w zachowaniach współczesnych konsumentów—konsumpcjonizm a konsumpcja zrównoważona. Konsumpcja Rozw. 2014, 1, 66–74. [Google Scholar]
  75. Galor, O.; Özak, Ö. The agricultural origins of time preference. Am. Econ. Rev. 2016, 106, 3064–3103. [Google Scholar] [CrossRef] [PubMed] [Green Version]
  76. Barro, R.J. Education and economic growth. Contrib. Hum. Soc. Cap. Sustain. Econ. Growth Well-Being 2001, 79, 14–41. [Google Scholar]
  77. Hanushek, E.A.; Woessmann, L. Education and economic growth. Econ. Educ. 2010, 60–67. Available online: https://www.sciencedirect.com/science/article/pii/B9780080448947012276 (accessed on 10 July 2021).
  78. Baum, S.; Ma, J.; Payea, K. Education Pays, 2013: The Benefits of Higher Education for Individuals and Society. Trends in Higher Education Series; College Board: New York, NY, USA, 2013; 48p. Available online: https://eric.ed.gov/?id=ED572537 (accessed on 10 July 2021).
  79. Oreopoulos, P.; Salvanes, K.G. Priceless: The nonpecuniary benefits of schooling. J. Econ. Perspect. 2011, 25, 1159–1184. [Google Scholar] [CrossRef] [Green Version]
Figure 1. World Happiness Score in the Year 2020—the top 15 and the lowest 15 countries. Source: Processed by the authors based on [50].
Sustainability 14 01461 g001
Figure 2. World Happiness Score in the Year 2020: the top 15 and the lowest 15 European countries. Source: processed by the authors based on [50].
Sustainability 14 01461 g002
Figure 3. Human Development Index and World Happiness Score in the Year 2019, bulk sample (141 countries). Source: processed by the authors, based on [50,69].
Sustainability 14 01461 g003
Table 1. Calculation of the Human Development Index (HDI).
Human Development Index (HDI)
DimensionsLong and healthy lifeKnowledgeA decent standard of living
IndicatorsLife expectancy at birthExpected years of schooling Mean years of schoolingGNI per capita
Dimension IndexLife expectancy indexEducation indexGNI index
Source: own processing on the basis of [19].
Table 2. WHS of selected countries in 2020.
RankCountry (Top 15)ScoreLatitudeN/S
1Finland7.88960°15′N
2Iceland7.57564°10′N
3Denmark7.51555°41′N
4Switzerland7.50846°57′N
5Netherlands7.50452°23′N
6Sweden7.31459°20′N
7Germany7.31252°30′N
8Norway7.29059°55′N
9New Zealand7.25741°19′S
10Austria7.21348°12′N
11Israel7.19531°47′N
12Australia7.13735°15′S
13Ireland7.03553°21′N
14United States7.02839°91′N
15Canada7.02545°27′N
Country (Bottom 15)
135Madagascar *4.20818°55′S
136Togo *4.10706°09′N
137Zambia *4.07315°28′S
138Sierra Leone *3.84908°30′N
139India *3.81928°37′N
140Burundi *3.77503°16′S
141Yemen *3.65812°48′N
142Tanzania3.7866°10′S
143Haiti *3.61518°40′N
144Malawi *3.60014°00′S
145Lesotho *3.51229°18′S
146Botswana *3.46724°45′S
147Rwanda *3.41501°59′S
148Zimbabwe3.16017°43′S
149Afghanistan *2.52334°28′N
Source: Processed by the authors based on the [50]; * an asterisk next to the country name denotes the unavailability of 2020 data, hence, the 2018–2019 survey average was used—just as in the original document cited.
Table 3. Descriptive statistics for HDI and WHS vs. globe latitude, bulk sample.
Descriptive Statistics.
MeanStd. DeviationN
HDI 20150.7250.153141
HDI 20160.7280.153141
HDI 20170.7310.152141
HDI 20180.7330.152141
HDI 20190.7420.152141
Latitude °29.00016.879141
WHS 20155.4231.163141
WHS 20165.4141.155141
WHS 20175.4241.120141
WHS 20185.4491.110141
WHS 20195.4891.096141
Source: processed by the authors in SPSS.
Table 4. Spearman correlation coefficients for HDI and WHS vs. globe latitude, bulk sample.
Correlations.
HDI 2015HDI 2016HDI 2017HDI 2018HDI 2019Latitude °WHS 2015WHS 2016WHS 2017WHS 2018WHS 2019
Spearman’s rhoHDI 2015Correlation Coefficient1.0000.9990.9990.9980.9950.6520.7990.8190.8270.8230.815
HDI 20160.9991.0000.9990.9990.9960.6550.7970.8180.8280.8240.815
HDI 20170.9990.9991.0001.0000.9970.6600.7940.8160.8260.8230.815
HDI 20180.9980.9991.0001.0000.9980.6610.7930.8150.8250.8220.814
HDI 20190.9950.9960.9970.9981.0000.6730.7890.8110.8230.8210.815
Latitude °0.6520.6550.6600.6610.6731.0000.4270.4460.4650.4630.478
WHS 20150.7990.7970.7940.7930.7890.4271.0000.9820.9610.9400.917
WHS 20160.8190.8180.8160.8150.8110.4460.9821.0000.9880.9660.936
WHS 20170.8270.8280.8260.8250.8230.4650.9610.9881.0000.9860.960
WHS 20180.8230.8240.8230.8220.8210.4630.9400.9660.9861.0000.983
WHS 20190.8150.8150.8150.8140.8150.4780.9170.9360.9600.9831.000
Correlation is significant at the 0.01 level (2-tailed). Source: Processed by the authors in SPSS.
Table 5. Spearman correlation coefficients for HDI and WHS vs. Globe Latitude, selection of countries.
HDI y. 1990HDI y. 2015HDI y. 2018HDI y. 2019
World0.8200.8550.8570.858
Europe0.3400.4410.4520.454
WHS y. 1990WHS y. 2015WHS y. 2018WHS y. 2019
World- 0.8080.8440.835
Europe- 0.6760.6140.600
Source: processed by the authors in SPSS.
Publisher’s Note: MDPI stays neutral with regard to jurisdictional claims in published maps and institutional affiliations.

